Embed Size (px)
Citation preview
[
CYCLIC BEHAVIOR OF BEAM-TO-COLUMN
WEAK-AXIS ·MOMENT CONNECTIONS
by
Kenneth A. Heaton
FRITZ ENGINEERING l:ABORATORY LIBRARY
A Thesis
Presented to the Graduate Committee
of Lehigh University
in Candidacy for the Degree of
Master of Science
m
Civil Engineering
Lehigh University
Bethlehem, Pennsylvania
May 1Q87
Acknowledgments
The analytical and experimental study presented m this thesis was
conducted at Fritz Engineering Laboratory, Lehigh University, Bethlehem,
Pennsylvania. Dr. Irwin J. Kugelman is chairman of the Department of Civil
Engineering.
The experiments conducted in this work form part of the investigations
"Cyclic Behavior of Moment Connections" sponsored by the National Science
Foundation (Grant No. ECE-8320540).
The author wishes to express his sincere thanks to Dr. George C. Driscoll,
supervisor of the thesis and related research work, for the benefit of his helpful
suggestions and encouragement, patience and guidance during the course of this
study, and demonstrating to the author both the objectivity of science and the
science of humor.
Many thanks are due to Dr. Le-Wu Lu, Dr. Lynn S. Beedle, and Dr.
Bruce R. Somers for their valuable ideas and suggestions during the different
phases of the research project. Many people helped in the preparation of
specimens, erection of the assemblage, and in the actual testing, especially Dr.
Roger G. Slutter, and Messrs. Hugh T. Sutherland, Robert R. Dales, Charles
F. Hittinger, Raymond Kromer, Russell Longenbach, Daniel Pense, Dave Kurtz,
Gene Matlock and Todd Anthony. Mr. Richard N. Sopko took all test
photographs and prepared the prints and slides. The assistance of Ms. Eleanor
Nothelfer in obtaining various articles will never be forgotten.
11
Table of Contents \.
Acknowledgments ii Abstract 1 1. Introduction 2 2. Considerations in the Design of the Specimen 5 3. Considerations in the Design ot the Test Set-Up 9
4. Results of the Test Program 13
5. Test Data Management 18
6. Computer Modeling 23
1. Discussion of Results 26
8. Conclusions 37
References 40
Appendix A. Tables & Figures 41
Vita 75
111
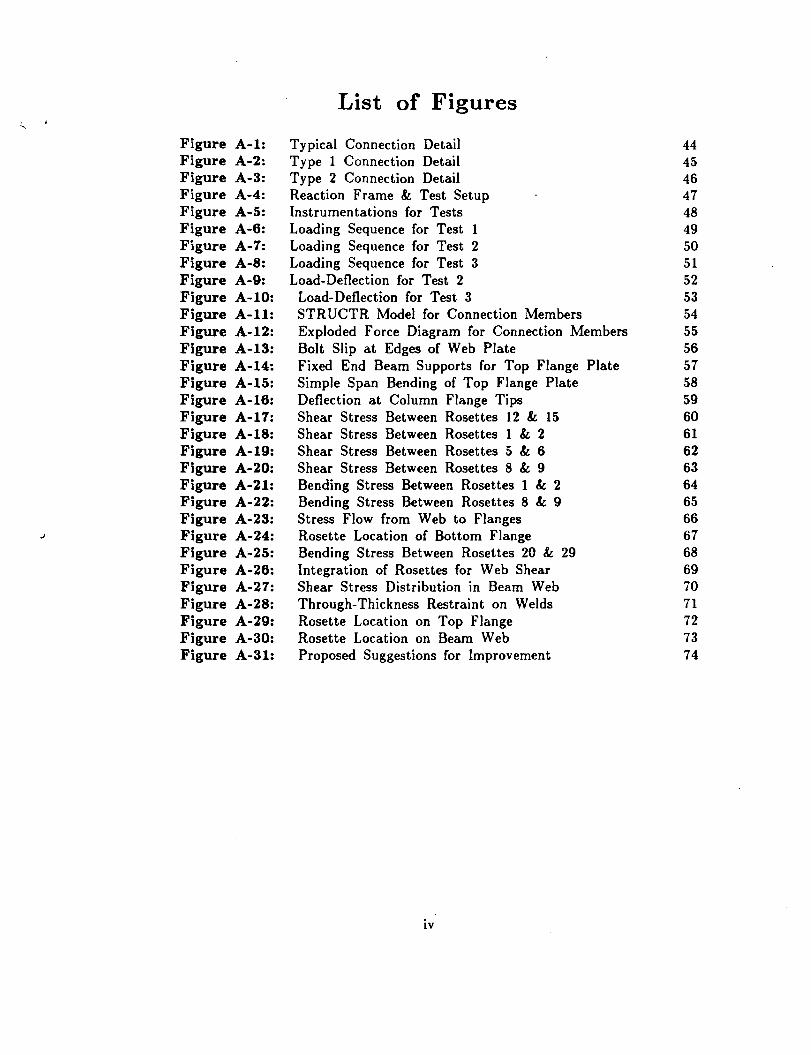
Figure A-1: Figure A-2: Figure A-3: Figure A-4: Figure A-5: Figure A-6: Figure A-7: Figure A-8: Figure A-9: Figure A-10: Figure A-11: Figure A-12: Figure A-13: Figure A-14: Figure A-15: Figure A-16: Figure A-17: Figure A-18: Figure A-19: Figure A-20: Figure A-21: Figure A-22: Figure A-23: Figure A-24: Figure A-25: Figure A-26: Figure A-27: Figure A-28: Figure A-29: Figure A-30: Figure A-31:
List of Figures
Typical Connection Detail Type 1 Connection Detail Type 2 Connection Detail Reaction Frame & Test Setup Instrumentations for Tests Loading Sequence for Test 1 Loading Sequence for Test 2 Loading Sequence for Test 3 Load-Deflection for Test 2
Load-Deflection for Test 3 STRUCTR Model for Connection Members Exploded Force Diagram for Connection Members Bolt Slip at Edges of Web Plate Fixed End Beam Supports for Top Flange Plate Simple Span Bending of Top Flange Plate Deflection at Column Flange Tips Shear Stress Between Rosettes 12 & 15 Shear Stress Between Rosettes 1 & 2 Shear Stress Between Rosettes 5 & 6 Shear Stress Between Rosettes 8 & 9 Bending Stress Between Rosettes 1 & 2 Bending Stress Between Rosettes 8 & 9 Stress Flow from Web to Flanges Rosette Location of Bottom Flange Bending Stress Between Rosettes 20 & 29 Integration of Rosettes for Web Shear Shear Stress Distribution in Beam Web Through-Thickness Restraint on Welds Rosette Location on Top Flange Rosette Location on Beam Web Proposed Suggestions for Improvement
lV
44 45 46 47 48 49 50 51 52 53 54 55 56 57 58 59 60 61 62 63 64 65 66 67 68 69 70 71 72 73 74
. '
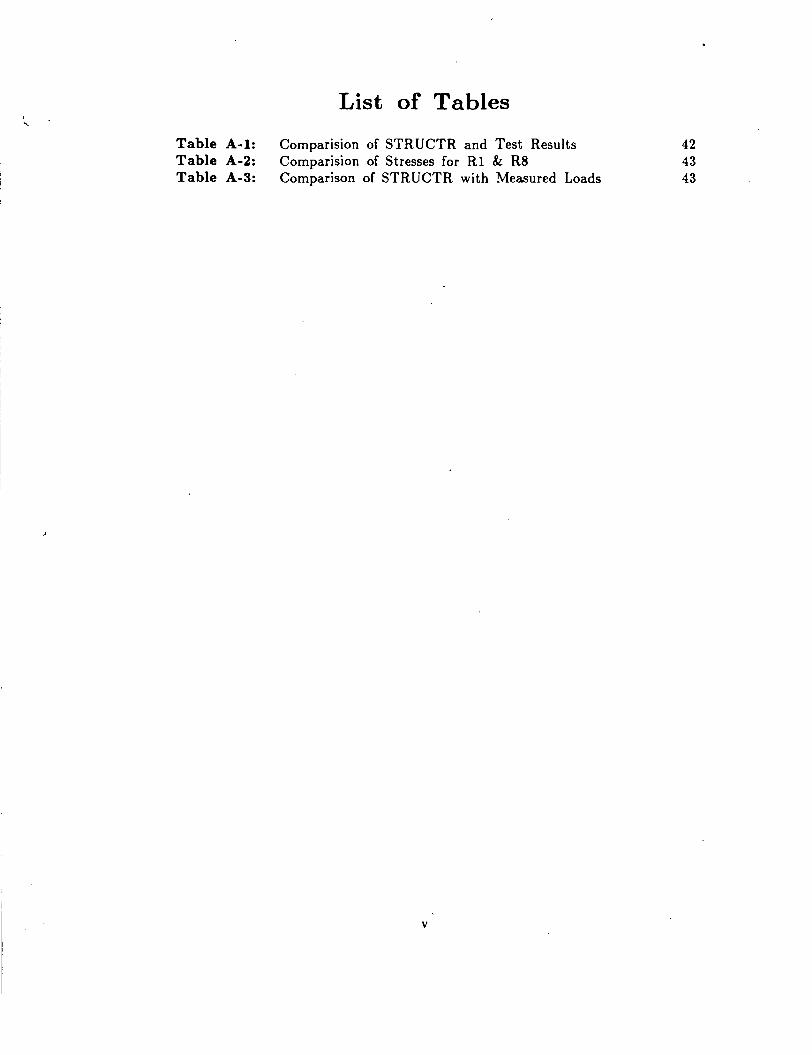
Table A-1: Table A-2: Table A-3:
List of Tables
Comparision of STRUCTR and Test Results Comparision of Stresses for Rl & RS Comparison of STRUCTR with Measured Loads
v
42 43 43
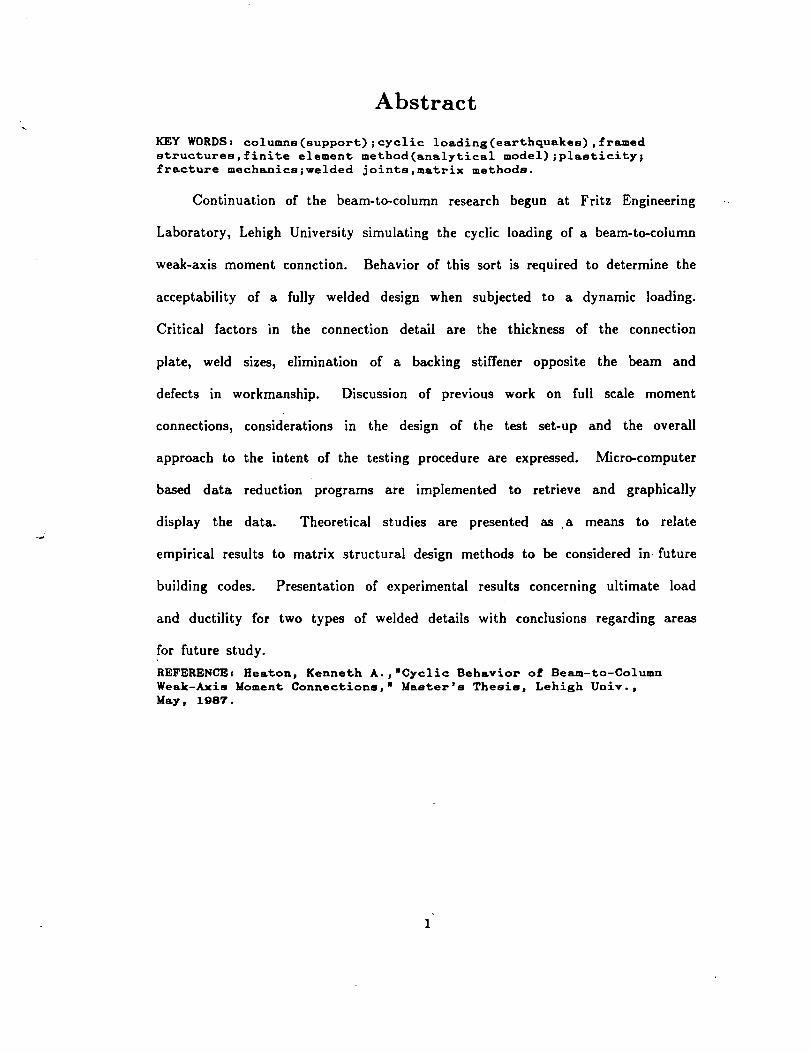
Abstract
KEY WORDS: columna(support);cyclic loading(earthquakes),framed structures,finite element method(analytical model);plasticity; fracture mechanics;welded joints,matrix methods.
Continuation of the beam-to-column research begun at Fritz Engineering
Laboratory, Lehigh University simulating the cyclic loading of a beam-to-column
weak-axis moment connction. Behavior of this sort is required to determine the
acceptability of a fully welded design when subjected to a dynamic loading.
Critical factors m the connection detail are the thickness of the connection
plate, weld sizes, elimination of a backing stiffener opposite the beam and
defects in workmanship. Discussion of previous work on full scale moment
connections, considerations in the design of the test set-up and the overall
approach to the intent of the testing procedure are expressed. Micro-computer
based data reduction programs are implemented to retrieve and graphically
display the data. Theoretical studies are presented as . a means to relate
empirical results to matrix structural design methods to be considered in· future
building codes. Presentation of experimental results concerning ultimate load
and ductility for two types of welded details with conclusions regarding areas
for future study.
REFERENCE: Heaton, Kenneth A.,"Cyclic Behavior of Beam-to-Column Weak-Axis Moment Connections,• Master's Thesis, Lehigh Univ., May, 1987.
1
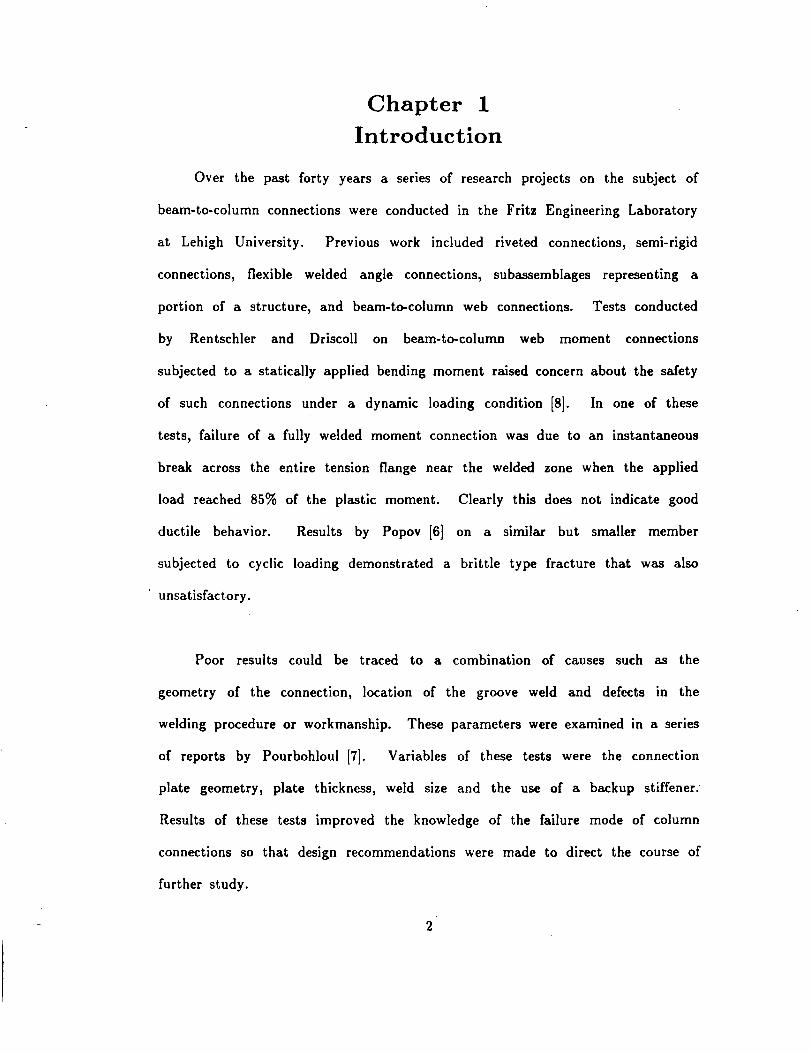
Chapter 1
Introduction
Over the past forty years a senes of research projects on the subject of
beam-to-column connections were conducted in the Fritz Engineering Laboratory
at Lehigh University. Previous work included riveted connections, semi-rigid
connections, flexible welded angle connections, subassemblages representing a
portion of a structure, and beam-to-column web connections. Tests conducted
by Rentschler and Driscoll on beam-to-column web moment connections
subjected to a statically applied bending moment raised concern about the safety
of such connections under a dynamic loading condition [8]. In one of these
tests, failure of a fully welded moment connection was due to an instantaneous
break across the entire tension flange near the welded zone when the applied
load reached 85% of the plastic moment. Clearly this does not indicate good
ductile behavior. Results by Popov [6] on a similar but smaller member
subjected to cydic loading demonstrated a brittle type fracture that was also
unsatisfactory.
Poor results could be traced to a combination of causes such as the
geometry of the connection, location of the groove weld and defects m the
welding procedure or workmanship. These parameters were examined in a series
of reports by Pourbohloul [7]. Variables of these tests were the connection
plate geometry, plate thickness, weld size and the use of a backup stiffener.
Results of these tests improved the knowledge of the failure mode of column
connections so that design recommendations were made to direct the course of
further study.
2
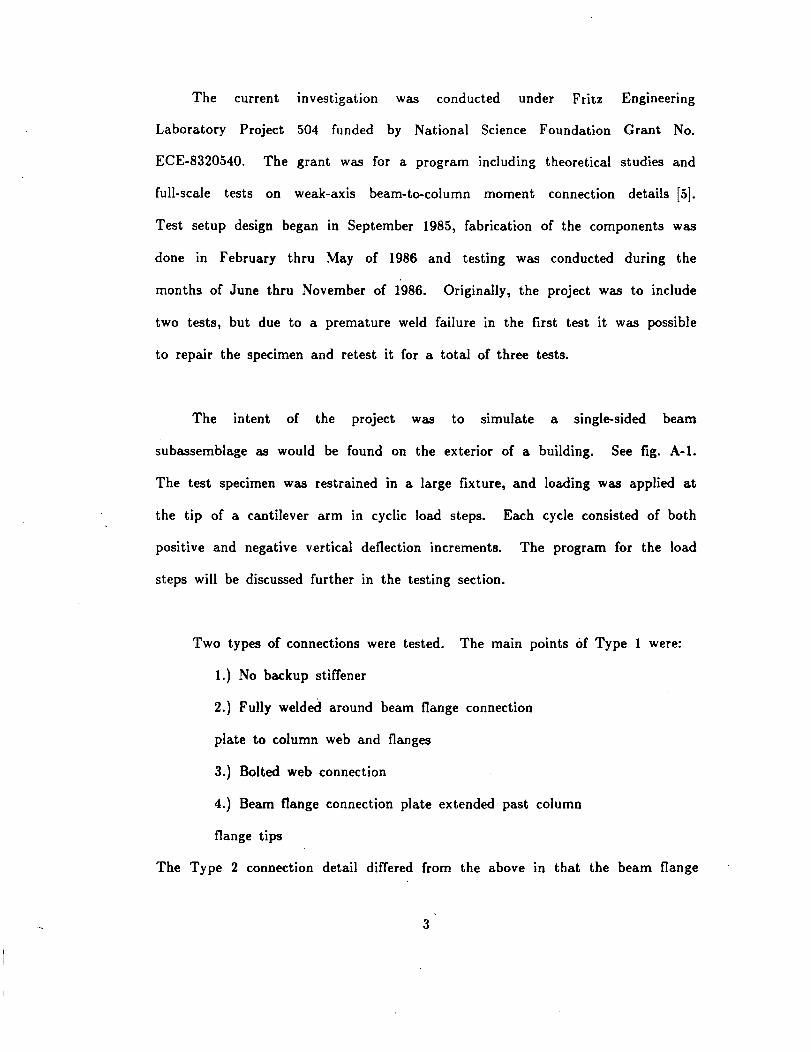
The current investigation was conducted under Fritz Engineering
Laboratory Project 504 funded by National Science Foundation Grant No.
ECE-8320540. The grant was for a program including theoretical studies and
full-scale tests on weak-axis beam-to-column moment connection details [5].
Test setup design began in September 1985, fabrication of the components was
done in February thru May of 1986 and testing was conducted during the
months of June thru November of 1986. Originally, the project was to include
two tests, but due to a premature weld failure in the first test it was possible
to repair the specimen and retest it for a total of three tests.
The intent of the project was to simulate a single-sided beam
subassemblage as would be found on the exterior of a building. See fig. A-1.
The test specimen was restrained in a large fixture, and loading was applied at
the tip of a cantilever arm in cyclic load steps. Each cycle consisted of both
positive and negative vertical deflection increments. The program for the load
steps will be discussed further in the testing section.
Two types of connections were tested. The mam points of Type 1 were:
1.} No backup stiffener
2.) Fully welded around beam flange connection
plate to column web and flanges
3.) Bolted web connection
4.) Beam flange connection plate extended past column
flange tips
The Type 2 connection detail differed from the above m that the beam flange
3
connection plate was not welded to the colurim web, and the beam flange
connection plate was increased in thickness to account for the full-span effect
between the column flanges. See fig. A-2 & A-3 for design details of Type 1 &
2.
The significance of this test is that only a limited number of weak-axis
beam-to-column moment connections have been tested under cyclic loading
conditions. The members tested here are larger than any previous cyclic loading
test of this type. There are some effects of size that can not be scaled up,
they can only be determined experimentally. Once the phenomenon that has
occurred in the full-scale test is understood then a model can be developed to
predict future behavior. Guidelines must be established to insure the safety of
large-scale fabrications so they can withstand severe loading conditions such as
an earthquake.
Attention was focused on the details of the welding procedure, weld
location and size, thickness of the connection plate members, and number and
location of the bolts in the web plate joint. A balance between member size,
ultimate strength, and ductility must be achieved m order to maintain
structural integrity during large distortions into the inelastic range.
4
Chapter 2
Considerations in the Design of the
Specimen
In order to maintain continuity with the earlier work of Rentschler [8] on
full scale connection tests and the flange connection plate detail tests of
Pourbohloul, et. al. [7], a W27 x 94 beam and two columns, a W14 x 174 and
W14 x 257 were selected as typical members in a building frame. Primary
components that must be designed are:
1.) Beam flange connection plate
2.) Beam web connection plate
3.) Welds of connection plate to column
4.) Full penetration weld between the beam
flange and the connection plate.
5.) Location, number and size of bolts m
web joint.
Each of these items will be discussed below:
Item !: The thickness of the beam flange connection plate for the Type 1
& 2 connections was determined by the previous work of Pourbohloul [7]. The
plate was extended three inches past the column flange tips in order to reduce
the stress concentration at the re-entrant corner. The plate was tapered in the
thickness direction at a slope of 1:2.5 in accordance with the Structural Welding
Code [2] fig. 8.10A for butt joints in parts of unequal thickness and offset
alignment. The plate was not . tapered in the width direction. However, the
amount of extension provided was sufficient to permit the path of tension
5
stresses to flow at an angle of 45 degrees from the column flange tips to the
edges of the beam flange as recommended by Pourbohloul [7]. Plate thickness
and the lack of welds between the column web and the connection plate were
the only differences between Type 1 & 2.
Item ~: The beam web connection plate was sized to be 9/16 inch in the
thickness direction, but obtaining plate this size was difficult so the thickness of
the web plate was increased to 5/8 inch to allow delivery of a stock item.
Care was taken to allow a generous radius at the cut out portions of the plate.
Item ~: Weld sizes were originally designed on the basis of the maxtmum
static loads to resist the shear and bending moment components of the applied
vertical load. This was shown to be inadequate in Test 1 because the Poisson's
ratio effect produced through-thickness stresses that caused cracks to develop at
the root of the weld. A detailed description of the through-thickness effed will
be given in the discussion of results. These welds were double fillet all around
the edges of the plate except the column web weld was eliminated in the Type
2 connection, Test 3.
Item 4: The full penetration weld between the beam flange and the
connection plate was per the ANSI/ AWS 01.1-86 code, fig 2.9.1 for single bevel
groove weld butt joint with backing bar [2]. This weld was dye-checked and
ultrasonically tested for the first test. The backing bars were removed and any
irregularites ground down and repaired. This procedure was done to reduce the
problems due to stress concentrations cited in the work of Pourbohloul [7].
Further comments will be made in the discussion of results.
6
Item _!!: Seven one-inch A490 bolts were used in the design to carry the
vertical shear load, but it was not possible to design a single row of bolts to
develop the entire plastic capacity of the beam web. This meant that the beam
flange connection plate had to accept higher normal forces due to the reduced
capacity of the web plate. (Later work by Lu tested the ultimate capacity of
these bolts.)
The specimen was proportioned with the overall length of the cantilever
exceeding the distance in which shear load would affect the final failure mode.
Fabrication was done in Fritz Lab and the proc~ss was closely monitored. Care
was taken to orient the rolling direction of the connection plates with the
longitudinal axis of the beam. Failure to do this was cited as a problem in
earlier testing. Bolt torque was checked by turn-of-the-nut method.
The fabrication quality of the finished specimens was good and probably
better than the average field craftsmanship. The welds were of proper size ·and
did not have porosity, surface cracks or inclusions visible to the naked eye.
Ultrasonic examination of the groove weld revealed some small voids and/or
inclusions but these were not large enough to require repairing the welds.
These inclusions were documented. Comments regarding the fracture mechanics
approach to the weld failure will be made later. A heavy mill scale on the
surface of the connection plate may have affected the depth of penetration and
this will be discussed in the results section.
Additional aspects of the specimen designs were based on results of other
7
investigations. A properly designed and fabricated connection will exhibit
ductile behavior and failure away from the groove weld of the connection plate
to beam flange joint. Popov reached some fundamental conclusions as to the
result of his work. The load deflection hysteresis loops for a steel cantilever
beam and connection are highly reproducible during repetitive load application.
This fact implies that such an assemblage is very reliable and can be counted
upon to absorb a definite amount of energy in each cycle for a prescribed
displacement. The ability to withstand severe repeated and reversed loading
seems to be assured for properly designed and fabricated steel structures; their
intrinsic energy absorption capacity IS large [6]. This energy absorption
capacity, as measured by the s1ze of the hysteresis loops, increases with
increasing tip deflection until the maximum loop outline is reached.
These assumptions form the basis for companson of test results for
different connection details. Some sort of standard must be established as a
guideline for an acceptable connection design. The ultimate energy absorption
capacity of the test detail must be compared to this standard to determine if it
meets the minimum requirements. For this series of tests the standard was
chosen at three cycles where the load reached positive plastic moment and
negative plastic moment based on recomendations by a European committee [9].
Chapter 3
Considerations in the Design ot the Test Set-Up
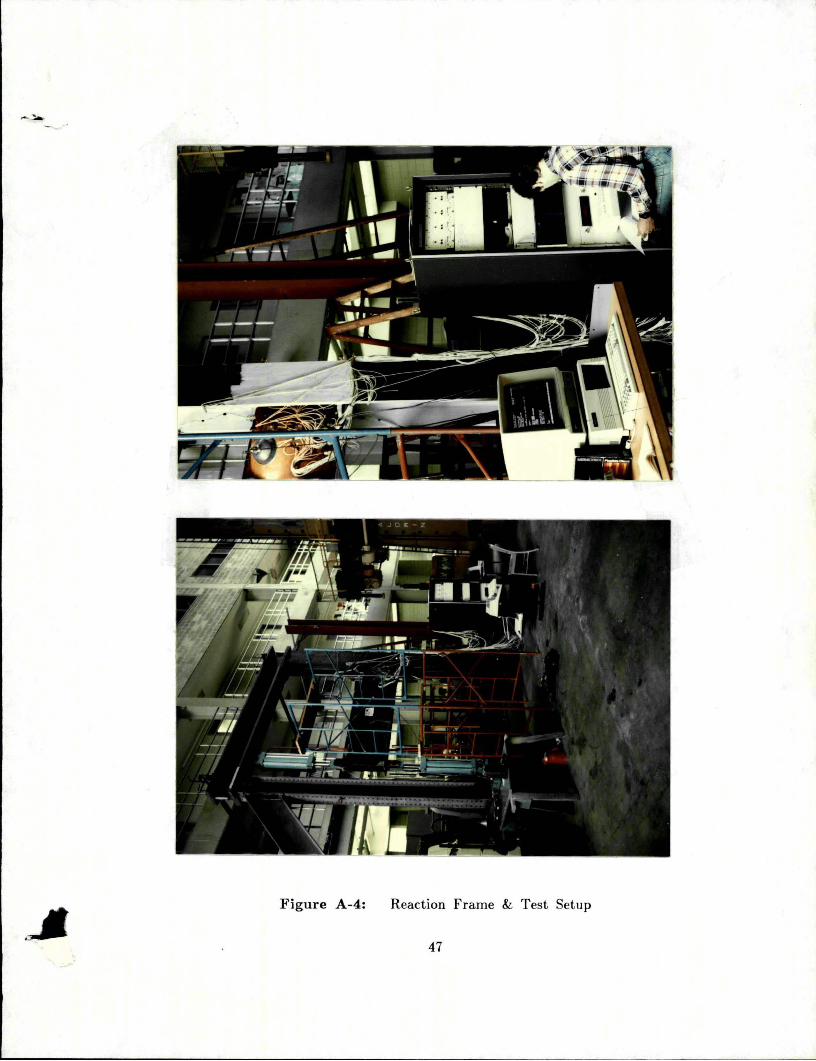
As stated above, this test was umque m that full stze members were
cyclically loaded to plastic bending failure. Due to the magnitude and
application rate of the forces required to cause failure, careful design of the
reaction frame was mandatory. Unfortunately, space constraints on the testing
floor and availability of testing frame members restricted the reaction frame to
less than optimum design. The frame used for this test was essentially a two-
dimensional structure with the cantilever beam, column and loading mechanism
in the plane of the reaction frame. See fig. A-4. This greatly reduced the
width of the frame allowing it to be erected in a small corner of the lab, but it
did not allow for cross-bracing. A forty-five degree leg braced one corner only,
while lateral struts stablized the frame to the building wall. The entire frame
was bolted together so that it could be taken apart to change the test
specimen.
The loading forces and reactions were modeled using STRUCTR--a
Structural Analysis Program developed by Driscoll and students at Lehigh
University [4]. The program inputs the number of members, joints, type of
restraints, member properties and material constants. Using the output from
the program, the deflections and forces at all ends of the members can be
determined.
Another factor m the design of the test 1s the loading system for the
9
beam. Since the test was to simulate dynamic loading conditions as much as
possible, hydraulic power was chosen as the prime source for a displacement
driven test program. Two hydraulic actuators operating in series (i.e., one in
compression the other in tension) were needed to reach the failure load of the
specimen and not overload the capacity of the actuators at their extended
length. The units used in this test were 8-inch bore by 24-inch stroke
T. J. cylinders manufactured by Aero-Quip. Pin connections at both ends of
each cylinder allowed displacement of the beam and rotation of the cylinder
without binding the piston to the bore. The hydraulic pumping system used
was an Amsler swing arm pumping unit which has exceptional flow control and
can maintain a steady pumping pressure almost indefinitely. Direction of travel
of the actuators was changed by using a Moog servo valve with a remote
control at the Amsler control panel. After some initial start-up problems the
system performed almost flawlessly.
After the connection ·details had been designed, the reaction frame built,
and the hydraulic system put together, the next major phase and probably the
most critical was the acquisition, storage and reduction of the test data.
Instrumentation line-up for Test 1 had 31 rosette strain gages, 8 linear gages, 7
dial indicators, 2 linear variable displacement transformers(L VDTs), a load cell,
and 2 rotation gages. There were 101 channels of strain readings to be
recorded at each load step. Four of the strain gages were wired together m
series and read manually by an operator. These four channels were calibrated
at a specific point along the length of the beam away from the yield zone to a
50 kip load cell. Using this calibration and extrapolating the load range
10
(assuming linear behavior) the load could be read versus a prescribed
displacement. Subtracting these four gages from the total left 97 remammg
channels that had to be recorded. A micro-based data acquisition system was
used for this purpose. Unfortunately, the system proved to be the weak link in
the operation. Unreliability, problems with the software, disk drive errors,
slowness, and limited screen visibility created many headaches. Some file
security was achieved by linking the system to an independent m1cro and
transferring data files to its hard disk once or twice a day. Even with this
backup, some files were lost. Counting all the delays and breakdowns, at least
two weeks were lost during the course of the test.
In addition to the strain gages, the other items of interest had to be
recorded manually. Dial gages, LVDTs, load cell readings and various book
keeping information such as load number, date and time had to be written
down in specially formatted tables for each load step in the cycle. Some
readings such as load and displacement were checked at the beginning and end
of each recording cycle to make sure the values had not slipped due to yielding.
This was especially critical at displacements in the inelastic range. The entire
recording process took three to five minutes (depending on the size and skill of
the crew) and to complete one load cycle could take four hours.
See fig. A-5 for the location of the dial gages and L VDTs. Dial gages
were used to measure bolt slip at the edges of the web connection plate, the
movement of the web connection plate at the center of the column web and the
Poisson's effect at the column flange tips where the horizontal connection plates
11
were located. The L VDTs were used to measure the displacement of the beam
tip (this was called the "criterion" measurement since it controlled the test) and
the sway at the top and bottom of the column. Column sway was measured to
calculate the angular rotation of the column centerline which contributed to the
beam tip displacement.
Photographs were taken of the overall test setup and at vanous stages of
interest such as maximum load or fracture of a weldment. As mentioned above,
an attempt was made to measure the rotation of the beam with respect to the
column· using some very old rotation gages but these did not work.
Unfortunately, this critical angle of rotation could not be determined reliably.
12
Chapter 4
Results of the Test Program
The programmed loading sequence was applied in increments of load and
displacement over a range of cycles that represented a prescribed percentage of
the maximum yield load. Each cycle was repeated three times in order to
simulate the energy of an earthquake. The peak amplitude of each group of
three cycles was chosen to be one fifth, two fifths, three fifths, four fifths and
equal to the amplitude required to cause plastic moment. The plan was to
work gradually up to the plastic moment and then repeat this cycle three times.
If the specimen were still intact then three more cycles of twice the amplitude
of the plastic moment were to have been applied. However, as will be seen this
procedure was somewhat academic.
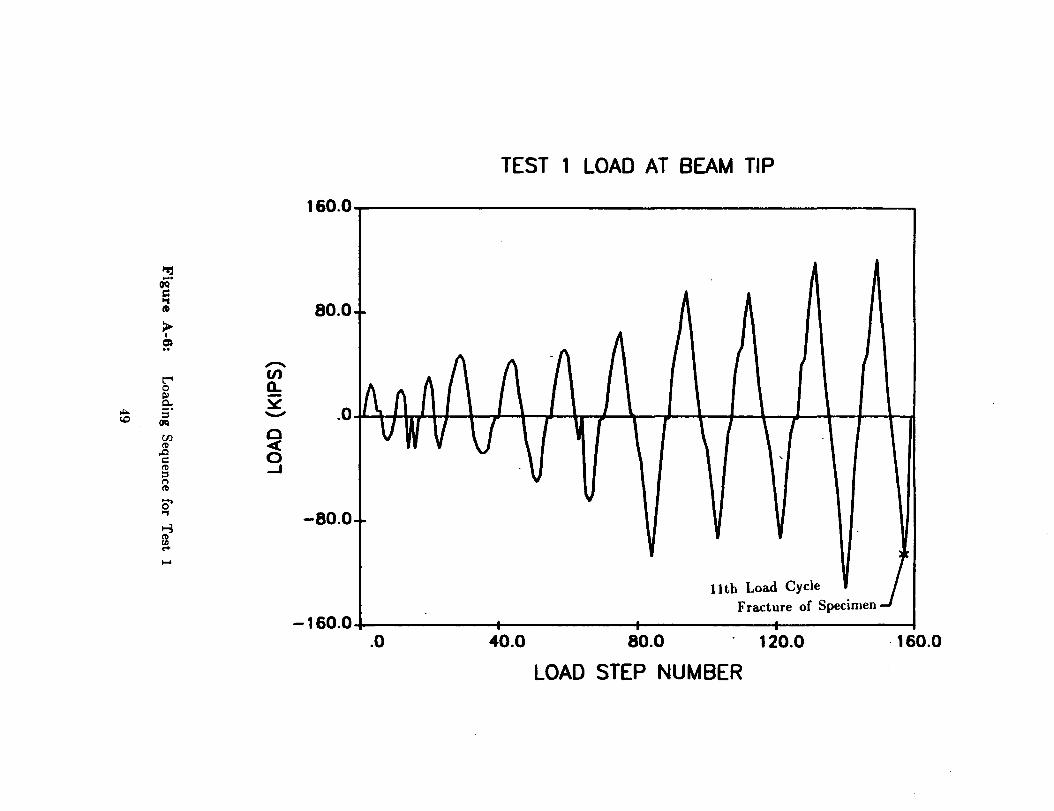
Test !--This test was conducted on the Type 1 connection( see fig. A-2
for details) which was welded along the flange plate connection to column web.
The load was applied as described above, see fig. A-6. As shown in the plot
the connection failed in the eleventh cycle at load step 158, which was
approximately 86% of the required plastic load. Failure was by a sudden
fracture of the left fillet weld in the top flange connection plate. The fracture
occured on both the top and bottom fillet welds along the column flange
portion of the plate and around the corner through about half of the fillet
welds along the column web. The initiation point for the crack appeared to be
at the column flange tip and it then worked slowly back along the inside face
of the flange when the weld was m tension. When the weld was in
compression the crack appeared to close. Fracture mechanics states that when
the crack driving force exceeds the crack resistance strength, unstable growth
occurs. As the load was increased to higher levels, the driving force increased
as the crack grew and the stress intensity level was raised. Crack growth
resistance increases with small increments to crack growth so the resistance was
able to keep up with the early stages of crack extension. Ultimate crack
growth resistance IS a finite material property so when the limit is exceeded
there is nothing left to resist fracture; therefore brittle (sudden) failure results.
Failure in this test was at a load about 14 percent less than expected and
the major components had undergone little if any yielding. A decision was
made to repair the welds and resize them considering the through-thickness
effect of Poisson's ratio. This will be discussed in greater detail in Chapter 7.
Thus the fractured 13/16 inch fillet welds were burned out and replaced by 1
inch fillet welds. The specimen was put back in the test frame and prepared
for testing.
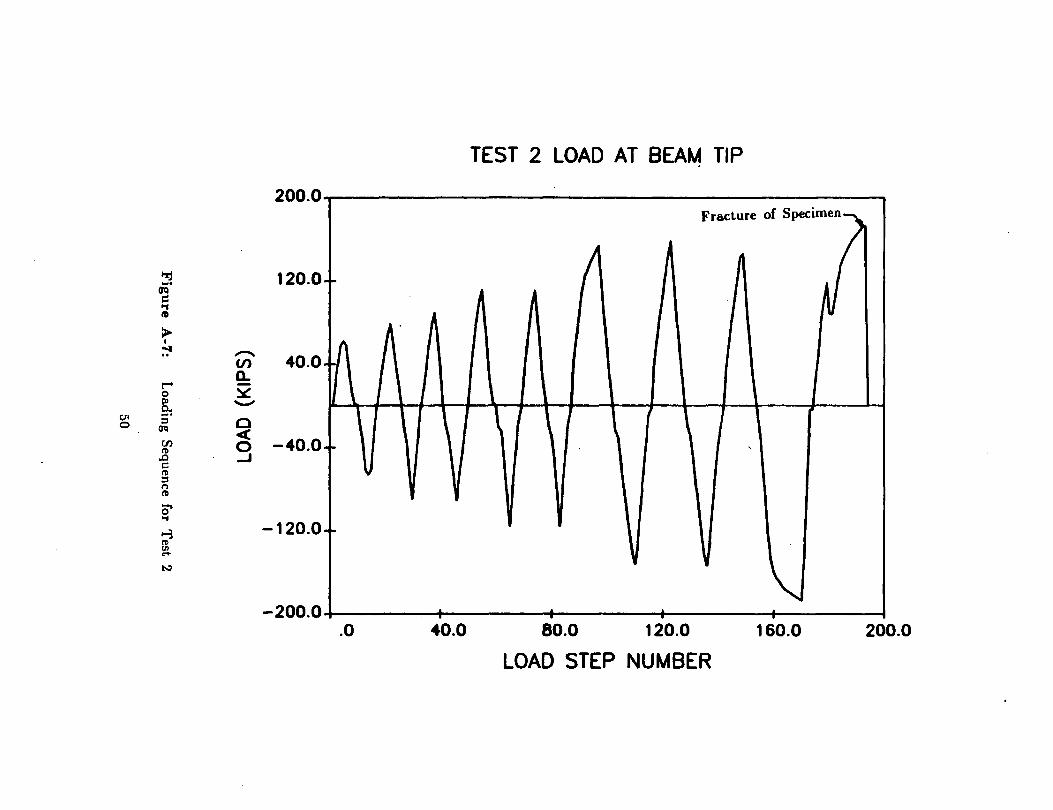
Test ~--The second test on the repaired specimen gave much better results.
The connection had adequate strength to develop the full plastic moment of the
cantilever beam. There was also adequate ductility to permit three cycles of
reversed plastic moment. See fig. A-7 for a plot of the load versus increment
number. After completing the program of controlled loading cycles, a final
monotonic load cycle was applied m order to determine the maximum
deformation capacity of the speCimen. Loading in the negative (downward)
direction was halted when a crack initiated in the groove weld connecting the
beam tension (top) flange to the connection plate. Loading was reversed,
14
because the crack area could resist compressiOn as the crack closed.
Displacement in the reversed (positive) direction was applied until cracking
occurred in the fillet welds along the column flange on the lower right hand
side. The maximum load reached was about 122% of the calculated plastic
moment. The maximum displacements were about +168% and -195% of the
observed yield displacement.
Examination of · the column flange fillet weld crack showed that it was
quite similar to the failure in Test 1. Again the crack appeared to start at the
column flange tips, perhaps due to a poor penetration of the root pass in this
area. However, this time the fillet welds displayed quite a bit of ductility
(yield lines can be seen along the weld surface) and held together for large
strain rates.
The crack in the tension flange full penetration weld can be shown to be
initiated by an elliptical flaw in the middle of the weld zone. The presence of
this flaw generates a high stress field around the perimeter of its boundary,
these high stresses produce localized cleavage failure. This can be seen as areas
of flat fracture. As the the crack progresses along the width of the beam
flange its mode of failure becomes slanted indicating a more ductile or shear
failure. The initial flaw may have required several cycles to grow large enough
to induce a critical stress field but once it reached this limit the growth became
unstable.
Test 3--The third test was conducted on the Type 2 specimen (see fig.
15
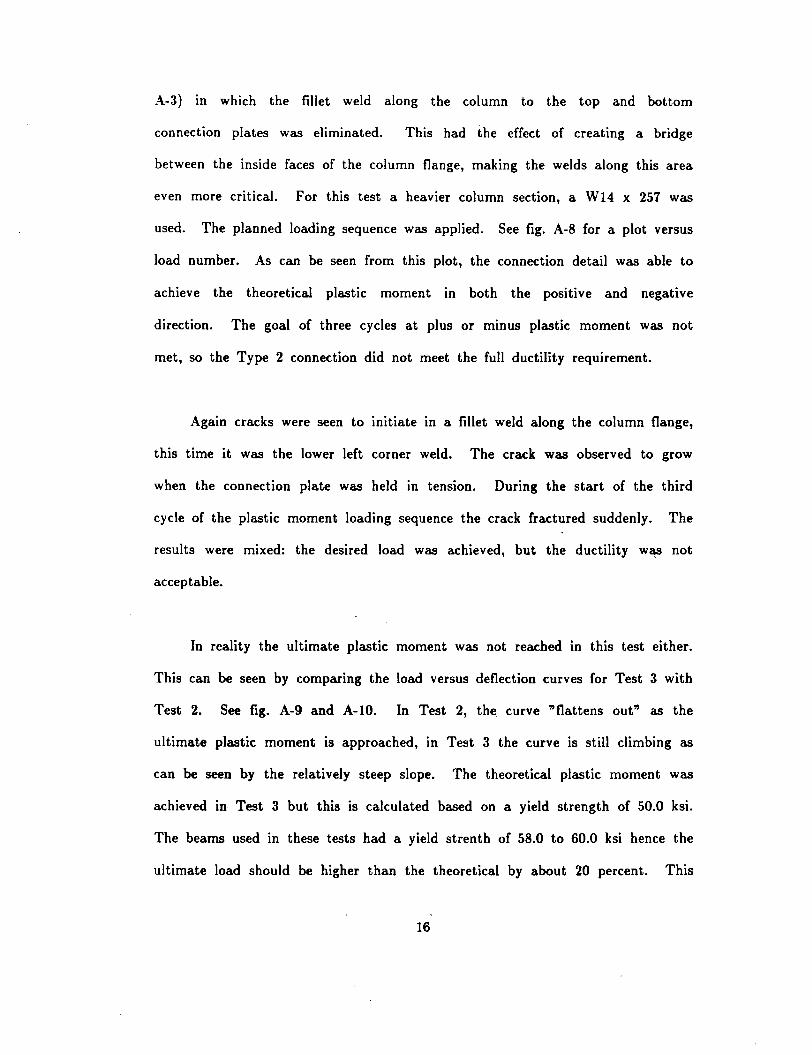
A-3) in which the fillet weld along the column to the top and bottom
connection plates was eliminated. This had the effect of creating a bridge
between the inside faces of the column flange, making the welds along this area
even more critical. For this test a heavier column section, a W14 x 257 was
used. The planned loading sequence was applied. See fig. A-8 for a plot versus
load number. As can be seen from this plot, the connection detail was able to
achieve the theoretical plastic moment in both the positive and negative
direction. The goal of three cycles at plus or minus plastic moment was not
met, so the Type 2 connection did not meet the full ductility requirement.
Again cracks were seen to initiate in a fillet weld along the column flange,
this time it was the lower left corner weld. The crack was observed to grow
when the connection plate was held in tension. During the start of the third
cycle of the plastic moment loading sequence the crack fractured suddenly. The
results were mixed: the desired load was achieved, but the ductility was not
acceptable.
In reality the ultimate plastic moment was not reached in this test either.
This can be seen by comparing the load versus deflection curves for Test 3 with
Test 2. See fig. A-9 and A-10. In Test 2, the. curve "flattens out" as the
ultimate plastic moment is approached, in Test 3 the curve is still climbing as
can be seen by the relatively steep slope. The theoretical plastic moment was
achieved in Test 3 but this is calculated based on a yield strength of 50.0 ksi.
The beams used in these tests had a yield strenth of 58.0 to 60.0 ksi hence the
ultimate load should be higher than the theoretical by about 20 percent. This
16
goal was reached in Test 2 as the ultimate load was about 22 percent higher
than the value calculated using a yield stress of 50.0 ksi. The ultimate value
was higher than the value calculated using a yield stress of 60.0 ksi even
though yielding had not progressed through the entire beam web. It is doubtful
that a moment connection with a bolted web joint will ever develop the full
plastic moment simply because of the high strain rates required to plastify the
web. Something usually fractures in the top flange connection plate assemblage
before the plastic zone extends completely through the web.
17
Chapter 5
Test Data Management
As discussed previously, each of the three tests generated huge volumes of
data. In the past, the general procedure is to use existing software on the data
acquisition system to calculate the desired stress-strain results. This can be
done on certain systems. The software for these machines is somewhat limited
and their fixed output format makes application of some other post-processing
device difficult, i.e., if one wishes to obtain plots of various stress results.
A different strategy was used for this project. A micro with a hard drive
disk was connected to the data system via an RS 232 port running an
interfacing program. This hook-up allowed data file transmission of the
automatically recorded results to an independent hard drive for later post-
processing. This streamlined the data reduction effort while adding much
needed file security to backup the delicate dedicated disk drive. It was no
longer necessary to run the built-in stress-strain processing software and view a
paper printout. Once the raw data files were on the hard disk they could be
neatly copied to floppy disks for convenient storage and transportation.
The raw files had to be reduced and grouped according to the strain
rosettes or linear gages that corresponded to the actual channels read. Also,
there were 13 or 15 manual readings for each load step of each test. These
manual readings had to be combined with the automatic readings taken at the
same time. A scheme was devised to do this using a micro running a Basic
language program. Three programs were used to reduce, collect and combine all
18
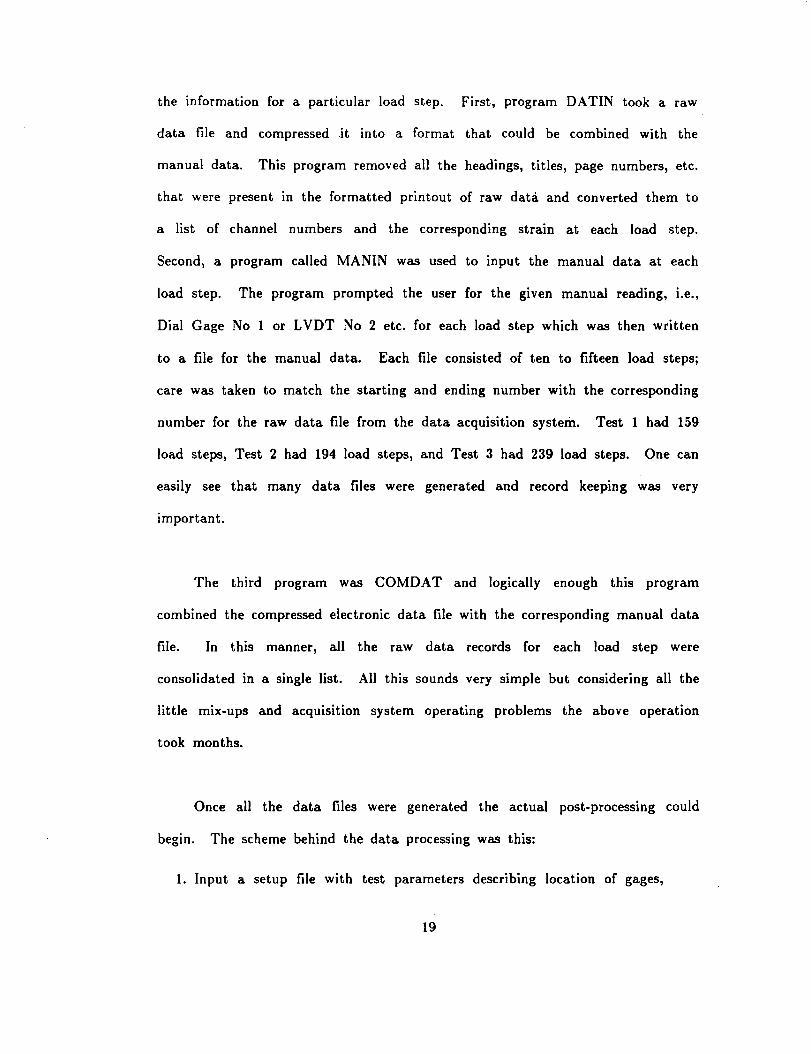
the information for a particular load step. First, program DATIN took a raw
data file and compressed .it into a format that could be combined with the
manual data. This program removed all the headings, titles, page numbers, etc.
that were present in the formatted printout of raw data and converted them to
a list of channel numbers and the corresponding strain at each load step.
Second, a program called MANIN was used to input the manual data at each
load step. The program prompted the user for the given manual reading, i.e.,
Dial Gage No 1 or LVDT No 2 etc. for each load step which was then written
to a file for the manual data. Each file consisted of ten to fifteen load steps;
care was taken to match the starting and ending number with the corresponding
number for the raw data file from the data acquisition system. Test 1 had 159
load steps, Test 2 had 194 load steps, and Test 3 had 239 load steps. One can
easily see that many data files were generated and record keeping was very
important.
The third program was CO MDA T and logically enough this program
combined the compressed electronic data file with the corresponding manual data
file. In this manner, all the raw data records for each load step were
consolidated in a single list. All this sounds very simple but considering all the
little mix-ups and acquisition system operating problems the above operation
took months.
Once all the data files were generated the actual post-processing could
begin. The scheme behind the data processing was this:
1. Input a setup file with test parameters describing location of gages,
19
channel numbers, material properties and desired items to be
calculated.
2. Take all raw data stored and subtract the zero reading to get the
difference.
3. Take the difference readings required for a particular rosette/linear
gage and transfer them to a subroutine to calculate the stress-strain
relationships.
4. Repeat step 3. for manual data
5. Store the load number, date and time at the head of a data file
created for each load step. Then store the differences for strain and
manual readings. Then store the calculated results, the linear stress
results and last store the calculated results for each manual reading.
For each load step there were approximately 400 items (depending on the
number of rosettes per test) to be stored. This was done by opening a direct
access file and writing the list of items to it for each individual load step. The
program that did all this was called DPROC. The program could be run on a
micro with 640 K of central memory.
The key point of the direct access system is that now all the results are
stored at a particular location in a direct access file. Any result can be
20
retrieved by another program designed to select a location in the first load step
stored and then proceeding to the same location in the next load step. This
can be achieved by setting the file pointer to a pre-calculated value depending
on the result desired and simply incrementing this pointer value by the number
of records stored in each load step. The number of records is a preset constant
and this value is added to the initial pointer value for each load step until the
file has been read to the end. The desired result is then stored in a temporary
array for viewing purposes.
In this manner, a stress value at a particular location on the specimen can
be collected for each load step of the test. Once these values have been
collected in an array they can be plotted on the screen of the micro-computer
using a graphics subroutine. Any desired value can be displayed. For added
flexibilty a value could be plotted as an ordinate with the abscissa the load
step number or the value could be plotted on the abscissa with the ordinate
being the load value in kips {eg. load versus displacement). The program that
did this was called DPLOT. Once the graph has been displayed on the screen
the viewer has the option to create a file for an X-Y plot. This file can be
sent to a plotter for hard copy. The plotting software used for this research
project was the AUTO_ GRAPH [3] program on the CAE lab mini-computer at
the Fritz Engineering Laboratory. This program creates high quality plots and
allows the user to plot multiple functions, i.e., two stress results can be
displayed on the same plot. A Hewlett Packard pen plotter was used for all
the plots found in this thesis.
21

The two post processing programs and the data reduction programs were
written and developed by Dr. George C. Driscoll and students at Lehigh
University. The use of these programs on the micro-computer provided
tremendous flexibiliy and power m the data reduction which allowed an in-depth
study of the experimental data.
22
Chapter 6
Computer Modeling
The popular · technique in computer modeling the past several years has
been the finite element method, FEM, using one of the package programs such
as SAPIV, ADINA, ANSYS or some other program in vogue. As is common
knowledge, this method discretizes the structure as a series of small elements.
The number of elements is limited more or less by the size of the computer.
But really, the program is limited by the patience of the programmer. In order
to make an accurate analysis, one must use more and more elements. Hence
the model builder tends to limit the size of his model by making assumptions
or restricting the model to a two-dimensional plane. What one generally
achieves is a very detailed analysis of a small portion of the original structure.
Even with this approach, FEM generates more data than the average engineer
can interpret. A worse effect is that one tends to overlook behavior caused by
the three-dimensional loading of a structure. Important loads, stresses and
reactions are often overlooked by a simplified model.
The intent of this research project was to use a more approximate analysis
technique, matrix analysis, but use a more complete three-dimensional model.
In this manner, the entire structure could be represented and analyzed using the
direct stiffness method program STRUCTR. Some modifications to the program
were necessary for the application to this connection detail. STRUCTR is
generally used for the analysis of large span structures, I.e., bridges, building
frames, truss members, etc. where the length-to-depth ratio is large. This
implies that the major component of the element stiffness matrix is distortion
23
due to bending{flexure). In a beam-to-column connection fabrication, the length
to-depth ratio of the members is about one or less. Shear distortions account
for a large percentage of the overall element distortions. The program
STRUCTR was modified to include the shear distortions' in the element stiffness
matrix. The revised program was called STRSHR.
The development of the model was actually simple. Moment of inertia
section properties were calculated for bending flexure about the strong and weak
axis of each connection plate member and a portion of the column web.
Effective shear area was calculated for shear distortions and polar moment of
inertia for a thin rectangle was calculated for torsional rigidity. Section
properties for the W27 X 94 beam were found in the AISC handbook [1]. The
column web was modeled as two separate fixed end beams to include the
noticeable deflection of the centerline of the column web at the intersection of
the beam web connection plate. See fig. A-ll for a layout of the model.
Members 1 & 2 and 3 & 4 represent the column web with points 1, 3, 16, and
18 being fixed restraints provided by the heavy column flanges. Members 5 &
6 and 7 & 8 represent the bottom and top connection plates respectively.
Members 9 & 10 represent the horizontal connection plate and members 12 &
13 represent the vertical connection plate. Points 4, 6, 10, 19 and 21 are fixed
supports provided by the column flanges. Member 11 IS the cantilever beam
with the load at point 14. Members 14 thru 25 are dummy rigid members
with very high section properties to transfer reactions from one active member
to another while maintaining geometric relationships between the members.
Joints 7 and 22 are pinned allowing Z axis rotation becauses no relative
24
moment can be transferred through the weld. It is assumed that the weld joint
transfers only axial force and vertical shear. Joints 9 & 15 are also pinned
about the global Z axis. Joint 9 represents the center bolt of the lower group
of three bolts while joint 15 represents the center bolt of the upper group of
three bolts. This was done to provide an average moment caused by the
leverage between the upper group of bolts and the lower group of bolts on the
web connection plate.
The model included twenty five elements and twenty three node points,
but it fully described the three-dimensional nature of the connection providing a
valuable insight into the distribution of the member forces and external
reactions for design purposes. An exploded force diagram illustrates this point
(see fig. A-12). Traditionally, connections are designed assuming that the
vertical web carries all the shear force and the horizontal beam connection
plates carry only normal bending stresses uniaxial to the direction of the beam.
Examination of fig. A-12 shows that less than 50% of the vertical shear is
carried by the web plate and a secondary moment is carried by the top and
bottom connection plates due to the component of the vertical shear that is
transferred into these members. Thus, even a simple model such as this one
provides new information regarding the force distribution in the connection
members. The model does have limitations in that stresses due to the through
thickness effects of Poisson's ratio are not included. A comparison of the model
to the actual stress distribution will be discussed in the next chapter.
25
Chapter 7
Discussion of Results
This project was unique in that the theoretical analysis was limited, usmg
only a matrix analysis program to solve a simple geometrical model. On the
other hand the the amount of data collected and assimulated for computer
based retrieval was voluminous. The key to making sense of the data recorded
was knowing what to look for and then spot this trend while interpreting the
data. Probably over a hundred stress versus load value or number plots were
made in order to achieve the few simple observations that will be put forth.
Bolt slip IS one of the pnmary causes for redistribution of the forces in
the connection plate members. Bolt slip begins imm~diately upon application of
the first load cycle and parallels the direction and magnitude of the applied
load. See fig. A-13. As the flanges begin to yield due to plastic flow the bolt
slip becomes at least ten times greater than the elastic range value. A
thorough discussion of the consequences of this behavior will be given later.
The top and bottom flange connection plates are subjected to bending about the
global X and Y axes. Bending about the X axis (YZ plane) approximates the
shape of a fixed end beam with a single concentrated load at the center span.
The plate is bent in reverse curvature as the heavy fillet welds on each end
truly act as fixed supports. This behavior was noticed when analyzing the
rosette results in this plane. See fig. A-14. It can be clearly seen that the
stress at the exterior rosettes must be opposite m s1gn to the center rosette
gage because the exterior rosettes are outside the center zone defined by
inflection points a and b. Although this IS a rather simple and straightforward
26
observation, it took some time to deduce. First the normal stress in the global
Z direction had to be interpolated to the neutral axis of the XZ plane bending
so the normal stress caused by Y axis bending would not influence the X axis
bending stress. Then it was observed that the Z direction normal stress
reversed sign between points 1 & 2 and 2 & 3. Finally, the relative
proportions of the stresses were of such a ratio as to suggest fixed end
conditions. This makes sense when considering the top flange as a thin plate
member with a length-to-depth ratio of about eight to one. The heavy 1-1/8
inch double fillet welds act to restrain rotation of the plate ends creating a
truly fixed condition.
A comparison of the stress distribution with those predicted by STRUCTR
1s shown in Table A-1. If one considers only the length of the top connection
plate that is restrained by the fillet weld to be effective in development of X
axis bending stress, then the moment of inertia at the column flange junction is
reduced by a factor of 1/13.80 (length of weld/width of plate). This has the
effect of increasing the bending stress at this point by a factor of 1.40. This
helps bring the predicted stress more in line with the actual stress along the
column flanges. Another factor to be considered is the through-thickness effect
due to Poisson's ratio. This subject has been examined in a series of reports
by Pourbohloul [7J and these stresses could be superimposed on the results of
STRUCTR. Finally, the shear stress distribution assumed by STRUCTR in the
web connection plate underestimates the actual vertical reaction in the center of
the flange plate. This probably accounts for the fact that the measured
bending stress in the flange plates is higher than the predicted value.
27
Bending about the Z ax1s (XY plane) more closely approximates single
curvature beam bending with a distributed load over a central portion. See fig.
A-15. This was deduced by observing that the Z directed normal stress always
maintained a gradient of the same sign for a given loading direction between
rosettes Rl2 & Rl5, Rl3 & RI6, and Rl4 & RI7 which implies a simple beam
deflected shape with pinned ends. See fig. A-29 for location of rosettes. This
can be supported by observing the relative deflection of the tips of the column
flanges. See fig. A-16. This plot shows that the column flange tips move in
and out in phase with the applied load (ie. as the load is applied upward the
beam action pushes the top column flange out and pulls the bottom flange in).
Another reason for supporting the single curvature hypothesis is the fact that
the horizontal connection plates are not welded along their entire length so
there is no restraint over a portion of their cross section.
The input to STRUCTR was modified to account for the single curvature
bending effect of the horizontal flanges by releasing the global Y rotation at the
node points representing the column flange attachment points. This was done
at node points 4, 6, 19 and 21 on the connection model. The revised
connection model was called Model II and had the effect of increasing the stress
closer to levels measured. Members 14 and 17 were also changed to simple
truss members so they would transmit no bending to the column web. This
more closely approximates the actual condition since the top and bottom
connection plates are not welded to the column web.
An interesting comparison can be made between the measured XY shear
28
stress with that predicted by STRUCTR results on the top flange, see fig. A-17.
The shear stress is plotted at R12 & R15 versus length along the flange. The
shear stress is assumed to increase over the constant thickness portion of the
plate and remain constant as this plate decreases in thickness. Integrating this
stress over the length of the plate gives a resultant shear load for this plate
element. Comparing the STRUCTR prediction at Load Step 146 (P = 125.0
kips) which gives a horizontal shear resultant of 172.8 kips versus the resultant
by integration of 182.9 kips yields an difference of 10.1 kips or 5.5%. Finally,
a comparison of the column centerline deflections shows that the values
predicted by STRUCTR at high load steps were within +/- 0.005 inch to those
recorded. The measured value was 0.010 inch versus 0.014 inch predicted.
As stated previously, the traditional assumption regarding the distribution
of shear stress in the beam web does not apply in the vicinity of the bolted
joint. The bolted joint between the beam web and the vertical connection plate
fails to transmit 100% of the vertical shear and bending stress in the web
section. This is due to the bolt slip that occurs immediately on cyclic loading.
See fig. A-18, A-19, and A-20 for a comparison of shear stress between rosettes
R1 & R2, R5 & R6, and R8 & R9. This clearly shows that the upper and
lower pairs of rosettes, R1 & R2 and R5 & R6 respectively, are influenced
dramatically by this slip action while the center pair, R5 & R6, show relatively
equal values. This is expected because there is no bolt slip at the level of the
neutral axis. See fig. A-30 for a location of the rosettes in the web section.
One can see the dramatic drop m normal stress due to the slip action
29
looking at the normal stress distribution. See fig. A-21 and A-22 that show a
comparison of X direction normal stress for rosettes Rl & R2 and R8 & R9.
No appreciable stress is transferred until the strain becomes so large that· the
bolts actually "bottom out" in their holes. It can be seen that once a bolt
becomes locked m one direction it can resist no load m the other direction. If
the strain rate m the other direction were so great that it caused the bolt to
travel the entire clearance tolerance to lock up on the opposite side, only then
would it be able to develop any force in this direction. The unresisted normal
stress and the percentage of web shear not transferred through the bolts must
flow to the connection plate flanges. A review of the angle to the principal
stress for Rl and R8 shows this effect (see fig. A-23).
Another interesting effect is an unequal distribution of bending normal and
shear stress about the neutral axis for higher load levels. Elementary beam
theory states that these stresses should be equal but opposite for bending stress
and equal for shear stress at the same distance above and below the neutral
axis of the member. See Table A-2 for a companson of these stresses between
rosettes Rl and R8 which are both 9 inches from the neutral axis. The
stresses for rosette Rl are significantly higher. See fig. A-24 for a location of
the rosettes on the bottom flange.
The top flange attracts more bending stress which consequently raises the
stress level in the upper half of the beam. A hypothesis which deals with the
geometry of the flange connection plates will be presented to explain this
phenomenon. The top connection plate is about one inch higher than the top
30
beam flange while the lower beam connection plate is flush with the bottom
side of the beam flange. This has the effect of making the connection plate
assemblage stiffer above the beam neutral axis than below (the beam neutral
axis is below the neutral axis of the connection plate). The resultant normal
stress in the beam is thus slightly higher on the upper side than the lower side.
Looking at Table A-2 the bending stress at R1 is greater than R8 for loads 15,
57, 106 and 155. The measured stress brackets the calculated stress values for
loads 15 and 57. At load 106 the top flange is very near yield and the
calculated stress is slightly greater than the measured. See fig. A-25 which
shows a comparison of stress at R20 of the top flange and R29 of the bottom
flange. At load step 155 the top flange has yielded and the stress at Rl is
still greater than R8 but now less than calculated. At load step 214, both
flanges have yielded and the bending stresses are about equal, but much less
than calculated.
This behavior shows how the bending stress redistributes itself in the web
due to yielding and bolt capacity. At high strain rates approaching the plastic
moment of the beam, the bolts have reached their maximum capacity to carry
load and the bending stress in the web becomes equalized between the top and
bottom halves. Once this limit has been reached the additional amount of
stress that would normally be carried in the web by a welded joint must be
transferred to the beam flanges. This hypothesis violates the plane sections
remain plane assumption of simple beam theory and St. Venant's principle does
not apply.
31
.;
In comparing the measured shear stress with the calculated shear stress,
the value measured at Rl is again higher than R8 for load steps 15, 57, 106
and 155. The measured values bracket the calculated value at this location.
At load step 214, both the top and bottom flanges have yielded and the
measured value is greater than the calculated value. The shear stress at R8 is
slightly greater than at Rl. The measured shear values are greater than
required to be in equilibrium with the applied load. This suggests that the
yielding action has increased the shear stress above what would normally be
expected in simple beam theory.
Next the measured shear stress in the beam web was compared to the
value predicted by STRUCTR. A plan was devised to integrate the shear
stress over the depth of the web to obtain a vertical resultant which could be
compaired with the applied load. The shear stress value at a particular rosette
was assumed to be the average value for an assigned area. Since the off-center
gages are plus or minus nine inches from the beam centerline and the beam is
twenty seven inches deep, the effective length for each gage was chosen to be
nine inches. This allowed integration along vertical rows of gages: RI, R5 &
R8; R2, R6 & R9 and R4, R7 & Rll. See fig. A-26 for a general description
of the assumed shear stress distribution along the first row of vertical gages,
Rl, R5 & R8. A simple formula was used to calculate the resultant load:
Peale t*h*(Rl + R5 + R8)
where RI IS the shear stress at rosette I
32
t 0.51 inch for the beam web
t 0.625 inch for the connection plate
h 9.0 inch
See Table A-3 for a comparision of the load at three locations along the
beam and connection plate assemblage. It can be seen that the actual load
value is greater just inside the row of bolts than predicted by STRUCTR but
this switches at the column flange junction where STRUCTR predicts a value
much closer to that actually recorded. This also explains why the measured Z
direction bending stress in the top connection plate is greater that predicted.
The unresisted vertical shear in the web plate becomes a concentrated load at
the center of the top horizontal member. See fig. A-27 for a general plot of
the shear stress in the web. Shear decreases as one proceeds from the beam
web into the connection plate and over. to the column web. The STRUCTR
model could possibly be improved by changing the properties for the members
that model the vertical connection plate.
Some final comments regarding the beam flange and connection plate
junction should be made on the distribution of X direction normal stress in this
area. The normal stress was higher on the tips of the beam flanges than the
value calculated by simple beam theory while the stress at the centerline was
less than this value. This pattern has been observed by past reseachers on
weak-axis moment connections because the stiffer column flanges attract more
33
stress than the flexible column web. Also, the normal stress did suffer some
effects of eccentricity going from the thinner beam flange to the thicker
connection plate. The stress was reduced in magnitude between the two plates
but not by as much as it should have been considering the two areas. An
effective moment arm could be deduced for the eccentricity effect using the
given stress results if it were considered important.
The next important topic to be discussed is welding. Test 1 failed early
due to an undersized fillet weld design that did not account for the through
thickness Poisson's effect. When this condition was included in the calculation
and the weld repaired, Test 2 gave good results well into the range of ductile
behavior. The weld was resized to account for the through-thickness effect by
using a three-dimensional vector addition that included longitudinal, horizontal
and vertical shear. An overall resultant weld size was calculated that could be
divided by the allowable force per unit length of fillet weld to find the required
size. For the case of the Type 2 connection used in Test 3 the calculated fillet
weld size was almost twice the plate thickness, so an alternative method was
used to find the weld s1ze. The throat dimension of the fillet weld was chosen
to be one half the plate thickness, giving an effective weld size equal to the
plate thickness. Therefore, Test 3 had very large welds but they still failed
early before a full ductile cycle could be completed. The problem appears to be
more of a weld type than a weld size. Fillet welds are poor welds for any type
of cyclic loading because there is always a crack initiation site at the root.
The problem is compounded by the direction of the applied load. Extreme
tensile forces are applied to the longitudinal direction of the welds through the
34
connection plate. As this force increases, the Poisson effect tends to contract
the plate in the thickness direction which wants to stretch the weld. At the
same time, a vertical force in the center of the connection plate wants to rotate
the ends of the plate away from the column flanges. Thus to put it literally,
the welds are being stretched and pried apart at the same time. See fig. A-28.
Yield lines were seen to develop in the weld surface during the test.
This effect is worst at the column flange tips where there is a re-entrant
corner. Fracture mechanics predicts the highest stress concentration at this
point. In each of the three tests, cracks were seen to initiate at this junction
in the load cycles well below the yield load. As each following cycle was
applied these cracks spread around the corner and down the length of the weld.
Eventually crack growth was unstable and brittle fracture occurred.
The Poisson effect caused through-thickness forces between the roots of the
welds, creating a plane strain condition at this joint. This condition has been
observed by researchers working on connection details in previous studies. A
full penetration weld will negate the Poisson effect because it will allow the
weld material to expand and contract with the plate material. A sound full
penetration weld will have no "starter" crack to work through the weld material
as does a fillet weld and it will resist the effects of plate delamination that can
be caused by cyclic loading.
Poor weld preparation may have hastened the destruction but the end
result would still be the same. Each of the three tests failed in a different
35

corner of the beam connection. Metallurgical examination did cite a problem
with some heavy mill scale on the base of one of the broken welds which could
have caused poor penetration. This may have reduced the ultimate strength of
the weld, but since the crack had already grown to such a critical length,
brittle failure was unavoidable. Thus the mill scale can not be blamed for the
failure mode but only for the final violent action.
36
Chapter 8
Conclusions
This research has resulted in a simplified analysis of the connection,
experimental results that corrrespond favorably with analysis, design
recommendations based on the analysis and experimental results, and
recommendations for further study.
It has been shown that a simple three-dimensional model was sufficient to
analyze the connection assemblage using a direct stiffness method matrix
analysis program. The analytical and experimental study was able to provide a
description of the significant force distributions in the connection members.
• Biaxial bending stresses in the top and bottom connection plates were caused by a transfer of a vertical shear force component from the beam web.
• These stresses acted upon the double fillet weld on the ends of the plate causing moment about the longitudinal axis of the weld.
• A vertical force component on the fillet welds was also added by the reaction of the vertical shear not carried by the web connection plate; this is about 0.125 P per double fillet weld.
• Shear distortions are not negligible and must be included m the element stiffness matrix for the plate members.
1
Observations from the experiments resulted in the following conclusions:
• Load capacity of a single row of bolts was shown to be inadequate to transfer the shear and bending stresses from the beam web to the vertical connection plate. This was evident from the start of the test by bolt slippage (applied force being greater than the static friction clamping force) until the very end of the test where the plastic flow in the flanges caused a redistribution of the normal bending stress.
37
• The previously discussed Poisson effect caused internal stress between the roots of the welds that also should be included in the design calculations.
• The redistributed stress pattern intensified yielding of the top and bottom beam flanges.
• Flexing of the column flanges and web was observed in each of these two connection designs demonstrating the local effects of a high stress concentration on these members.
A data management strategy was incorporated into the test procedure to
account for all possible items (automatic or manual) to be recorded, reduced,
combined and retrieved for analysis. The micro-computer programs described in
this text provided data files that could be viewed using plotting software
making a detailed stress analysis feasible.
• The results of the STRUCTR model compare favorably with the overall stress distribution found· by experimental strain gage readings except near the bolted joint.
• It was found that the "web carries all the shear" assumption of simple beam theory does not hold up in a fully welded connection detail, as the horizontal plate members carry significant amounts of the vertical shear.
This approximate analysis was shown to be more informative and realistic about
the actual stress distribution than many sophisticated finite element method
efforts.
Certain contributions to design recommendations may be extracted from
the results of this study:
• For large fabrications involving heavy plate members, the combination of horizontal shear, horizontal bending, vertical shear, and vertical bending requires unusually large fillet welds to join the beam flange connection plates to the column.
• One possible recommendation is to use a full penetration bevel weld on the connection plate to the column flange joint (See fig. A-31 ). However, there must be a range of column and beam web sizes where fillet welds can be used to join the horizontal connection plates to the column flanges.
• The fillet weld on the Type 1 connection along the column web will probably be adequate for the small force observed.
• The use of a backup stiffener would decrease the observed flexing of the flanges and web.
Attempts to formulate design recommendations based of this study and the
results of prior investigations, reveal the need for some further studies.
• Further study should be conducted to find the range of structural sizes where fillet welds will be adequate to join the connection plate members.
• Additional investigations are required to determine the influence of the backup stiffener on the ultimate strength and ductility of the assemblage.
• One final topic for further study concerns a suggestion to reduce the stress concentrat~on at the re-entrant corner where crack initiation was seen to start. A "fitted" plate (see fig. A-31 ) may spread the stress out over a wider area and convert some of the shear stress along the inside of the column flanges to direct pull or tension on the edges of the column flanges. In terms of fracture mechanics, this may eliminate the mathematical singularity point due to the reentrant corner.
Large scale beam-to-column connections of the types tested in this research
project are often thought of as rigid or fully restrained assemblages. In reality, '
each connection is a fabrication involving individual plate members with very
high section properties about the major axis but significantly reduced properties
about the minor axis. When visualized in this light, connections can be
designed using fundamental classical methods once the three-dimensional nature
of the loading system is fully understoo~9and applied to each component.
References
[1] Manual of Steel Construction,Eighth Edition AISC, Chicago, ILL, 1980.
[2] American Welding Society. Dt.t-86 1986 Structural Welding Code. ANSI/ A WS, Miami, FL, 1986.
[3] Wiedorn, P. G., Seiler, K. W., & Racine, J. Auto_ graph User's Guide CAE Lab, Fritz Lab, Lehigh University, 1986.
[4] Driscoll, G. C. STRUCTR--STRUCTURAL ANALYSIS PROGRAM. Technical Report C. E. 451, Fritz Lab, Lehigh Univ., Sept., 1981.
[5] Driscoll, G. C. & Beedle, L. S. RESEARCH PROPOSAL SUBMITTED TO THE NATIONAL SCIENCE
FOUNDATION--CYCLIC BEHAVIOR OF MOMENT CONNECTIONS.
Technical Report, Fritz Lab, Lehigh Univ., March, 1984.
[6] Popov, E. P. & Pinkney, R. B. CYCLIC YIELD REVERSAL IN STEEL BUILDING CONNECTIONS. Journal of the Structural Division 95(ST3):327:353, Mar., 1969.
[7] Pourbohloul, A., Wang, X., & Driscoll, G. C. TESTS ON SIMULATED BEAM TO COLUMN WEB MOMENT
CONNECTION DETAILS. Technical Report FL 469.7, Fritz Lab, Lehigh Univ., Feb., 1983.
[8] Rentschler, Glenn P., Chen, Wai F., & Driscoll, George C. TESTS OF BEAM TO COLUMN WEB MOMENT CONNECTIONS. Journal of the Structural Division 106(ST5):1005:1022, May, 1980. Fritz Lab, Lehigh Univ.
[9] Plumier, A. Recommended Testing Procedure for Evaluating Earthquake Resistance of
Structural Elements. Technical Report, University of Liege, Oct., 1983. European Convention Tech. Com. 13.

Appendix A
Tables & Figures
41
1.4x Oi/o: 0"'3/ 0"'2 Ld. Gage Measured Calc. Calc. 2
No. Line Stress• Stress• Stress* (-0.626) (-0.366) -------------------------------------------------------------
16 1 -3.362 -2.317 -3.243 -0.602
16 2 6.677 4.416 -0.804
16 3 -6.366 -1.617 -2.264
21 1 3.100 2.216 3.101 -0.399
21 2 -7.770 -4.222 -0.184
21 3 1.430 1.646 2.166
67 1 -4.370 -3.120 -4.368 -0.466
67 2 9.600 6.947 -0.661
67 3 -6.343 -2.178 -3.049
66 1 4.804 3.126 4.376 -0.466
66 2 -10.099 -6.966 -0.416
66 3 4.206 2.181 3.064
106 1 -6.990 -4.685 -6.559 -0.457
106 2 15.310 8.930 -0.534
106 3 -8.175 -3.270 -4.678
114 1 6.399 4.680 6.652 -0.449
114 2 -14.266 -8.920 -0.618
114 3 7.392 3.267 4.673
165 1 -10.360 -6.240 -8.736 -0.486
166 2 21.327 11.893 -0.497
155 3 -10.698 -4.356 -6.098
163 1 7.698 6.240 8.736 -0.418
163 2 -18.422 -11.893 -0.603
163 3 11.103 4.356 6.098 Notez Gage Line 1 connects R12 It R16 Gage Line 2 connects R13 It R16 •-These values ksi Gage Line 3 connects R14 It R17
Table A-1: Com parisian of STRUCTR and Test Results
42'
Ld. No.
15
57
106
155
214
Note1 All
Bending Stress R1 R8 Calc.
-11.21 9.97 10.77
-15.06 12.12 14.51
-20.92 15.49 21.79
-24.45 18.60 29.02
-22.85 23.82 36.30
values ksi
Shear Stress R1 R8 Calc.
-3.68 -2.58 -3.37
-5.19 -3.55 -4.54
-8.54 -5.72 -6.81
-12.72 -8.28 -9.07
-15.38 -16.98 -11.35
Table A-2: Comparision of Stresses for Rl & R8
Load Number 155 Applied Load 125.0 kips
Location
Beam Web (Rl, R5 .t RS)
Bolted Joint. (R2, R8 .t R9)
Near Column Web (R4, R7 A Rll)
'Measured Load
(kips)
119.0
88.2
51.8
STRUCTR Prediction
(kips)
125.0
38.8
60.0
Table A-3: Comparison of STRUCTR with Measured Loads
43
Figure A-1: Typical Connection Detail
44
_J ____ _ ---t---1-~
: ~ ~+
I .o
l ~
Figure A-2: Type 1 Connection Detail
45
TYP.
Figure A-3: Type 2 Connection Detail
46
,...~
Figure A-4: Reaction Frame & Test Setup
47
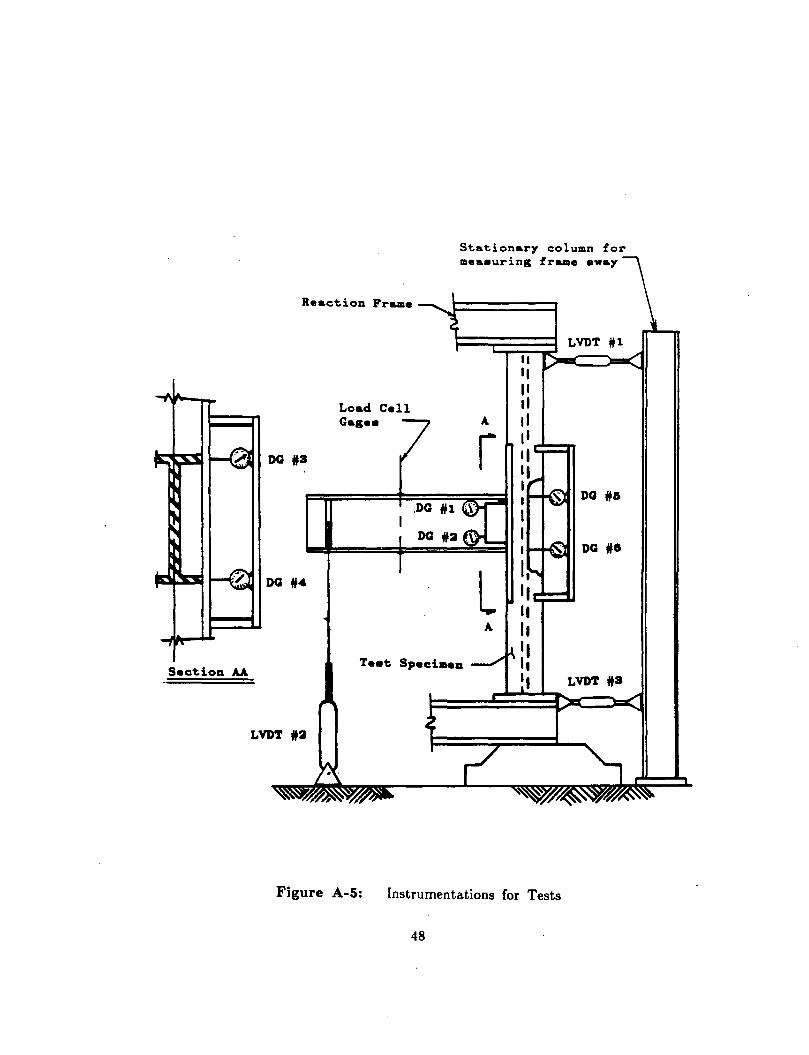
Section AA
Reaction Frame
DC ff3
DQ ff4
Load Cell Gas••
Stationary column for mea•uring frame &way
A
r DQ ff&
DG ff8
A
Te•t Specimen
LVDT *a
LVDT *3
Figure A-5: Instrumentations for Tests
48
~ ..... OQ
= ... II
> I
~ -t""' (/)
0 Q. ~
~ 0..
""" :;· ........, c.c OQ
Ul 0 ('!) < .0 0 c ('!) ...J ::s n ('!)
0' .., o-3 ('!) CIJ ~ -
TEST 1 LOAD AT BEAM TIP
160.0~---------------------------------------------,
80.0
.0
-80.0
11th Load Cycle Fracture of Specimen
-160.0+-----------~--------~~--------~----------~ .0 40.0 80.0 120.0 160.0
LOAD STEP NUMBER
TEST 2 LOAD AT BEAM TIP
200.0 Fracture of Specimen
~ 120.0 o'Q' £::: ... ID
> I
:-:- ~
40.0 (/)
~ ~ -
~ ~
~ J n.
t"" ~ 0
Cll '-"
"' 9: ::::! 0 0 OQ < en 0 -40.0 ID .0 ...J t: ID
\ \
' ' \ \ •t- '
v ::::! n ID v 0' .., 1-3 -120.0 ·-ID rn ~
t-.:) ' ~
\ -200.0 . . .
.0 40.0 80.0 120.0 160.0 200.0
LOAD STEP NUMBER
TEST 3 LOAD AT BEAM TIP
200.0 Fracture of Specimen
~ ~ A
..... 120.0 OQ
c: ..
'1 II>
> I
OD .. .........
40.0 (/) t:""' a.. 0
~ ~ c;,n -· ........ - 0
OQ 0 en < ~ 0 -40.0 ..0 = ..J ~ 0
~ A ~ ~ A A
\ \
~ ' v v v ·- v v n ~
0' ... 1-:3 -120.0 ~ ·-(/l .... ~ ~ ' -200.0 .
.0 40.0 80.0 120.0 160.0 200.0 240.0
LOAD STEP NUMBER
T2 LOAD VERSUS DEFLECTION
~ 120.0 o'ii. c: ., ID
> I
~ ............ Vl 40.0
t""' a.
0 ~ Pl 1:11 0.. -N I
0 0 ~ c( :::a
-40.0 ~ 0 (") .,.. _J c;· ::s
0' .., >-3 ~ -120.0 en .,.. N
-200.0+---------~--------~----~----~--------~ -5.0 -3.0 -1.0 1.0 3.0
DEFLECTION (INCHES)
T3 LOAD VERSUS DEFLECTION
~ .... (IQ
100.0 ~ tD
> I .... ......... ~ (/)
Q_
t'"" ~ .0 0 -Ill 1:11 Cl..
~ I 0 0 < til !:::1 0 til ~ t"l ..... a· ::s
0' -100.0 .... 1-3 til Ill ..... ~
-200.0-'-----f-------+----'----jl-----+-------4 -2.5 -:-1.5 -.5 .5 1.5 2.5
DEFLECTION (INCHES)
lU
~ ~ ... 0 23 OQ
~ ... 23 ID
~ > I ~ ~ ..
21
J1 ·1& 00 1-3 £ ~ ::::0 p c 0 £ b1 1-3 13 ::::0
"' ;s:: .,. 0
10 11 14 0..
~ tf1. 0' .... y Members: & 0 0 g ::l ::l ('!)
Joints: 1"1 j .... ii1 s·
::s
~ ('!)
3 0'" 8 ('!) .... Cll
I ''
"'%j .... OQ c:: "i ID
> I
'"" N .. 1:':1 >C
"'0 0 0.. ~ 0..
"rj 0 ... n
1:11 ~
1:11 9. fill
CTQ ... fill 3 0' ... () 0 :s :s ~ n .,... c;· :s
s:: ~
3 C"" ~ ... Ul
0.27V
\W14x2S7 Column
O.llV t 0.0018VL t.•tv ..;..._ / ~o.oo•ovL
O.liV~~· o.toV:------Top Plate .-. -.:: -J.lOV O.llV O.J.V
•·••v---.~ -, o.oo•ovL 0.0018VL
"-" O.OIVL
0.48V
o.o~~ 0.17VL
0
0
0
0
O.JIV
*053V
0.07VL
o.tW t o.089V O.llV O.OOIIVL
0.0040VL t /_ --- --t.JIV
O.OOIIVL
)O.I6VL
--w27x94 Beam
-2 TEST 3 BOLT SLIP X10
2.0
" •• .. • • " lo:lj . ' ' ' ...
' I I I ... oq •• ~ .. ' ' s:: I " ... " ' "-' '· CD
> • - ' I (/) .... "' w -1.0 ..
:I: u
tJ:I z 0 ~ .........
"" ~ z 0) "0 0
I» t-.... u t":l w 0.. ~ (JQ -4.0 DIAL GAGE 1 I'D ~ Ill w 0 0 ..... :e I'D 0"
DIAL GAGE 2 -------· '"0 i» .... I'D
-7.0 .0 40.0 80.0 120.0 160.0 200.0 240.0
LOAD STEP NUMBER
Gage Lin• 1
Inflection Point a
Figure A-14:
Gage Line 2
(+)I I I
Web Plate
Gage Lin• 3
--Bending Moment Diagram-
-1.0
Fixed End Beam Supports for Top Flange Plate
57
Wl4 x 267 Column
Flange Connection
Plate~
I I I I I I
-1 I I
lf2'7 X 04 Beaa
Di•tributed Load
Single Curvature Bendina
Figure A-15: Simple Span Bending of Top Flange Plate
58
> I .... ~
•
"""' (/) w J: u z
z 0 i= u w _J lL. w 0
-J X10
TEST 3 DEFL. OF COLUMN FLANGE TIPS
1.0~------------------------------------------------,
-1.0
-3.0
-5.0
-7.0
II l I I fl II e, \ I ll'tl
' ' .. ' ' ',, ' '• ' ''•' _,,I 'tel "~ ., .. ~ '-• I I
•'
DIAL GAGE 3
DIAL GAGE 4 -------·
. ' fl .. I I tl I I 1 I
I ~ 1 I
~ •" '. .. ' . I I I l I I
'' I, tl I I
' ' ' ' ' ' I I
"
• h ..
I I I I I I
' ' ' ' I I I
• I
' ' I '
,I I I I I
I I
' I I I I I I I I I I
' ' ' I
' ' • ' ' I I
'
-9.0+-------+-------+-------~------~------~------~ .0 40.0 80.0 120.0 160.0 200.0 240.0
LOAD STEP NUMBER
••••
o.o
Figure A-17:
Seetioa AA
7.83
W14 X 257 Colu11111
A
13.70
Shear Stress Between. Rosettes 12 & 15
60-
X
~ .... (JQ
= .., Ill
> I I-" OD .. ...........
(/) U) ~ ::r' ('!)
......., I»
(/) .... U) (/) .,....
LaJ ~ ... ('!) Q: - en en 1-t:C (/) ('!) .,....
Q: ~ ('!) L!i ('!)
::s ::0 :t: 0 (/) en ('!) .,... .,.... ('!) en -F." t-.:1
3 X10
TEST 3 ROSETTE NO 1 & 2
20.0
. A
10.0 --
.0 ~ ~ ~ ~ ~ ~
,.,
A p. ~ ~ ' ' ' ' ' I I
~I ' ' ' ' J ' ' ' ' J ' ' '
V{v .l J ' I ' ~ ' ' : ' ' '
~ I ' I ' I ' ' ~ l ' J 'I I • ' ' ' I
' ,, , ,,
-10.0 - ROSETTE 1
ROSETTE 2 ------- u v
-20.0 . . .0 50.0 . 100.0 150.0 200.0
LOAD STEP NUMBER
~
,\ I I
' ' ' ' I
'
250.0
1-zj ... (JQ
£::: '1 ID
> I ..... '!? ,......
(/)
en :X: :::r' -('!)
II> (/) .. en (/) .,.... w
~ ..
0:: ('!) N Ul
CIJ t-t:C (/) ('I) .,....
0:: ~ ('!) ~ ('I)
::I I
:::0 (/) 0 Ul ('I) .,.... .,.... ('!) CIJ
CJ1
~ 0)
3 X10
8.0
4.0
.0
~ ~ ~ J
I
-4.0 -~
ROSETTE 5 -8.0 --
ROSETTE 6
-12.0 • . .0 40.0
TEST 3 ROSETTE NO 5 & 6
I ~ I . I
I I I
' I I I I I I I I I I I I I I I
'~ I I I
' ~ ~ ' • ,• ' • • • • • •
'
-------· _.._ . . . 80.0 120.0 160.0
LOAD STEP NUMBER
!
I I I ' I I I I I I
I I I I ~ I I I I
I ' I • ' • I • • I
\ ~ ~ II ,, ',. ~ I
' f
200.0 240.0
l'2j .... OQ t: ""' ID
> I w c ""' ..
(/) ~ en ......_,
::r In
(/) ~ ... (/)
U)· w .,. ... a::: C) In
"' C/.1 ..__ C/.1
c:l (/)
In a::: .... =e
~ In In ::s I ::0 (/) 0 C/.1 In .,. .,. In C/.1
00
F." co
3 X10
TEST 3 ROSETTE NO 8 & 9
15.0~--------------------------------------------~
10.0
5.0 I I
I I I I
I .0 ' ' ' ' ' ' ' ' I ' ' ' ' I I
' ' ,, -5.0
. -10.0 ROSETTE 8
ROSETTE 9 --------15.0
-20.0 .0 50.0 100.0 150.0 200.0 250.0
LOAD STEP NUMBER
~ .... ~ ... II
> I t-:1
"""' .. .......... Vl
t:O ~ ..........
1'0 :;:!
Vl 9-: ::J Vl
OQ L&J r:n 0:::
a> .... I-~ ., 1'0 Vl Ul Ul
t:O .....J 1'0 <( ....
~ ~ 1'0 0::: 1'0
0 :;:!
~ z 0 Ul 1'0 .... .,... 1'0 Ul -~ N
4 X DIR NORMAL STRESS ROSETIES NO 1 & 2 X10
3.0
2.0 ~
1.0
" ,, ,'• • ,.
• " I' I \ 1 ... ,
.0 . \ \ ,, 1\ \ • ' •
I~ I ' I ' ,I I , j\ I ,,
'I I I' I j
\ I " '. .. v ,, ,, 'l " v ' .. 1
, , ...
-1.0
-2.0 ROSETTE 1
u \ ROSETTE 2 -------·
-3.0 . . .0 40.0 80.0 120.0 160.0 200.0
LOAD STEP NUMBER
...
240.0
x1o 3 X DIR NORMAL STRESS ROSETTES NO 8 & 9
JO.O I'Zj
o'Q" ROSmE 8 s:: ... ID
> 20.0 I
-~ ROSmE 9 ------- ~ w .. w ~ ..
(/')
c:o ~ ......, I!) :::1
(/') 10.0 9: :::1 (/')
OQ w -~.
00 0:: 0') ~ 1-~·
.... I!) (/') Ul Ul
c:o ....J .0 I!) c( ~
~ ~ I!) 0:: I!) :::1 0
.. .- ,, ,, , ,, .. " " ,,
' J.
~ ... , .. ... , .. .. , \ ' .. \ • \ \ \ \
,' ' , ,
::::0 z 0 Ul
-10.0 I!) ~ ~ ~ I!) Ul
00
~ 10
-20.0 -'L . .0 50.0 100.0 150.0 200.0 250.0
LOAD STEP NUMBER
~ 0 Uea•ured
Str••• Di•tr. .... oq
= ... ID 0.
> I w CoO .. en .... .... (1)
~ Theoretical_/' m ~ m 0 4
Siaple Beaa '
~
~
::;- 0 0 3 0 :e (1)
c:r .... 0
~ ;-:::1
OQ
!i o. + CTy
0 Str••• at @G)
y
lo:rj .... OQ c: '1 tD Gas• 0
> Line 3 _IL ~..:. I 0 N lllo. R23 I R28 IL 1"'4 .. ::a:~ I R29 0 VI ~ Gas• .,.._
X .,.._ ~ Line a IL ll: IL 0') 1:""' ~ --0 t'l R22 R25 R28 I» .,.._ c;·
6.6 t:l
0 .... o::l 0 Gaa•
R271L .,.._
....L .,.._ 0 Line 1 _ll: R2' ~ _.:... 3 I torj .L ;- 0.6 t:l
OQ
--1 ~
1.6
Note: All dimeneiona are in inches
4 X DIR NORMAL STRESS ROSETTES NO 20 & 29 X10
16.0 ~ ..... , ...
I I ' ~· I ' ' I
= I ' ' I
"" I I ' I ID I '
I I I I > I I I
I I ' I ~ 8.0 I I I (11 ' I ' .. ~
' I I I (/) I • I I I
tD ~ II I I I ~
........._, ~~ " I I I ::s I l I I I I I
0... (/) I I s· I l I l I I I
(/) I l I l I oq w I I I I I I I . I I en a::: .0 .,...
~ ..., t-
00 ~ en (/) I I I en I I I I I tD
__. I I I I I I ~ 4:( l I I I It .,... . , ., •' ~ ::E ~
,, ~ f ~ a::: • ::s 0
::0 z -8.0 ROSETTE 20 I 0 I en ~ I .,...
I .,... ~ I en , N ROSETTE 29 -------· I 0 I
~ ..,I
N ~ -16.0
.0 40.0 80.0 120.0 160.0 200.0 240.0
LOAD STEP NUMBER
1-,:j p .... oq
= Theoretical
"1 Cl)
> , ,
I to.)
~ t -., .,... 71 t h
(!) oq ..... ~ .,...
en c;·
10 ., 0 -. ;:l;l 0
t v
h 71 ~ ·>. -:-
Cll (!) .,... .,... (!) Cll t 0' .., ~
71 h
• (!)
C"'
00 ::r (!)
_l..J Aasumed Shear Stress
~ .... Be- Web Shear Stresa
o. 13.31 o. 5.<i8
I 7 I
I 7 I
1 7
7 1
s.u. •• 78
1
\ o. 8.<i7 o. 5.<i3
0.
/,-----.,.;;;;(u· 83
Note: All values are KSI
Figure A-27: Shear Stress Distribution m Beam Web
70
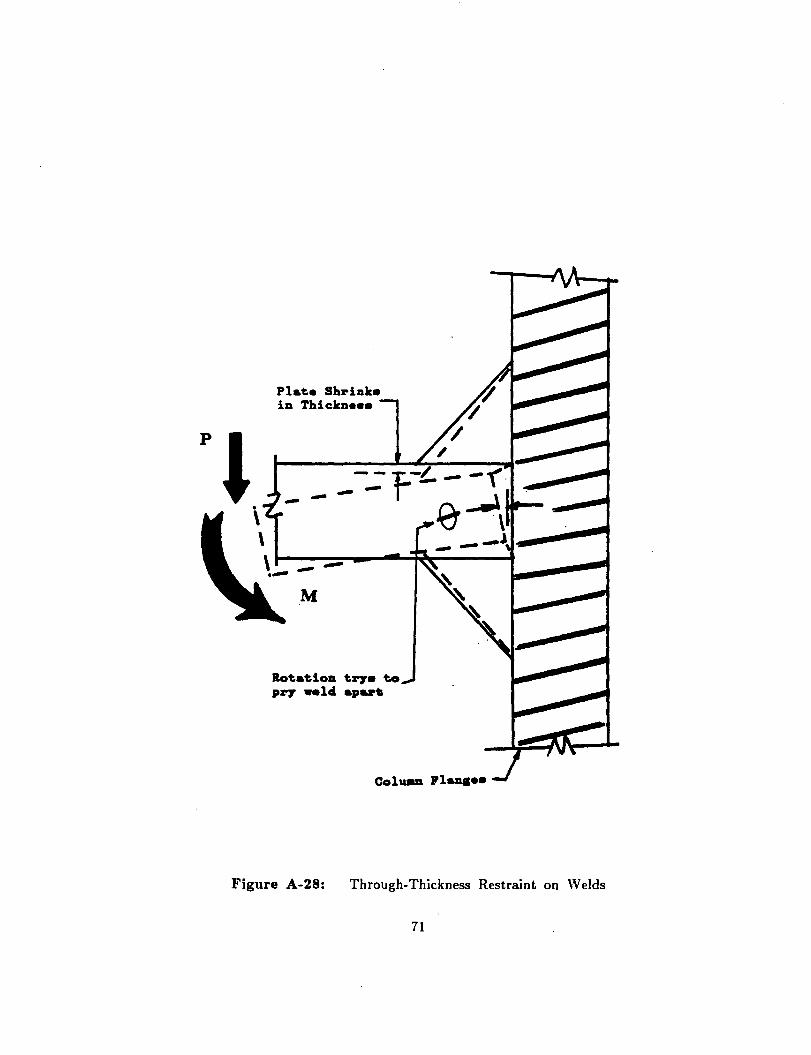
\ \
Plate Shriak• ia Thicka•••
--\ --·- M
Rotatioa tZ'7• to PZ'7 welcl apar•
Figure A-28: Through-Thickness Restraint on Welds
71
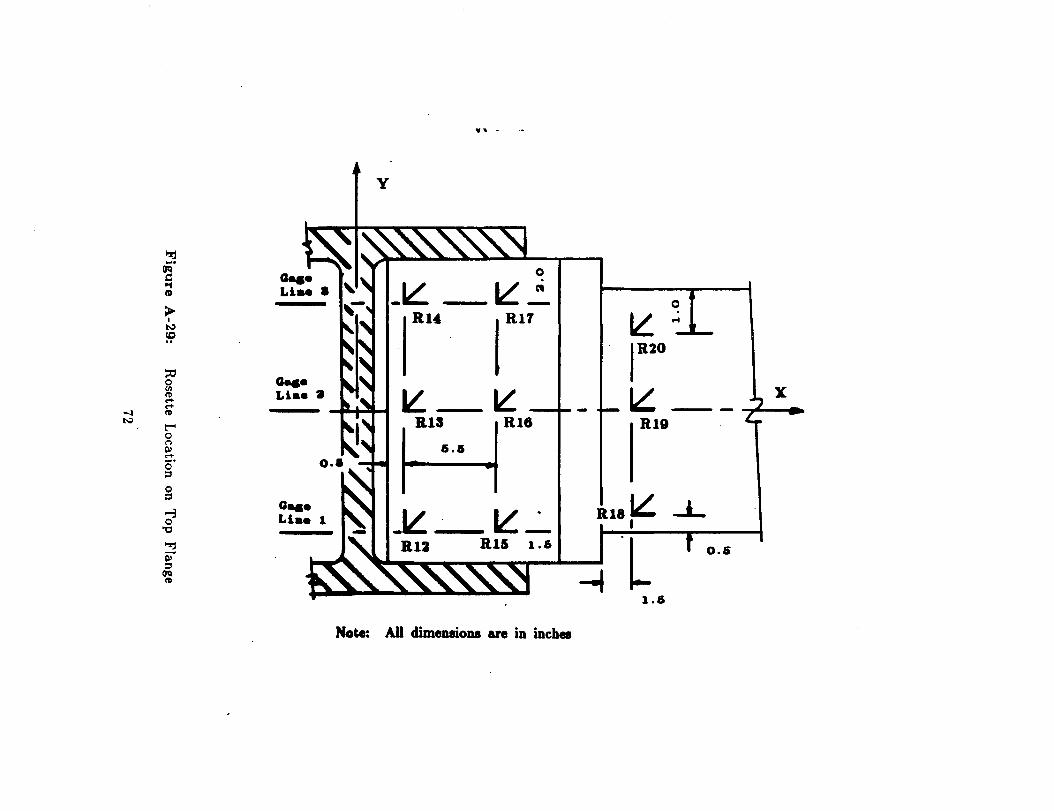
.,, -
~ oq• 0 =
~.:. ... _IL ID
0 > R14 I RU ll: f"4 I ~
~ IR20 ::tl 0 a ... Ul
Liae a IL ~ IL ~ ~ ~
...:t ~ N RlS Rl6 Rl9 I:""
0 (") a.a ~ ~ o· :;:!
0 :;:!
R18~ _J_ t-3 a ...
-~ ~~ 0 Liae 1 I "0
"!j .L 0.6 iii :;:!
--1 ()q ~
1.6
Note: All climellliona are in inches
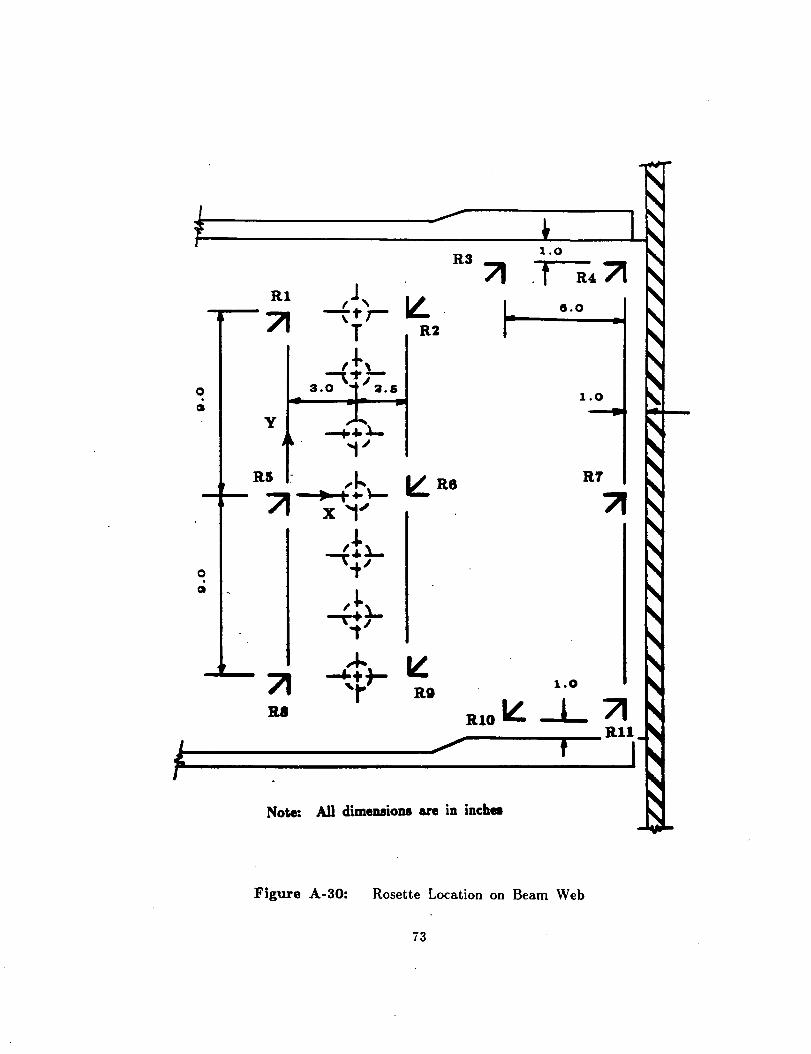
Rl
71
y
R5
71 Rl
R3 71
1.0
. f R4 71
.... ~·l
"1~
IL R2
,_ (t\- ~ R8
X 't~
,.1-l... 't'
,l.l.. '1' ... tr- ~ 'r RO
8.0
1.0
R7
1.0
RlO I£ _L 71 -----...--Rll
~~--------------~" t I
Note: All dimenaioaa are in incha
Figure A-30: Rosette Location on Beam Web
73
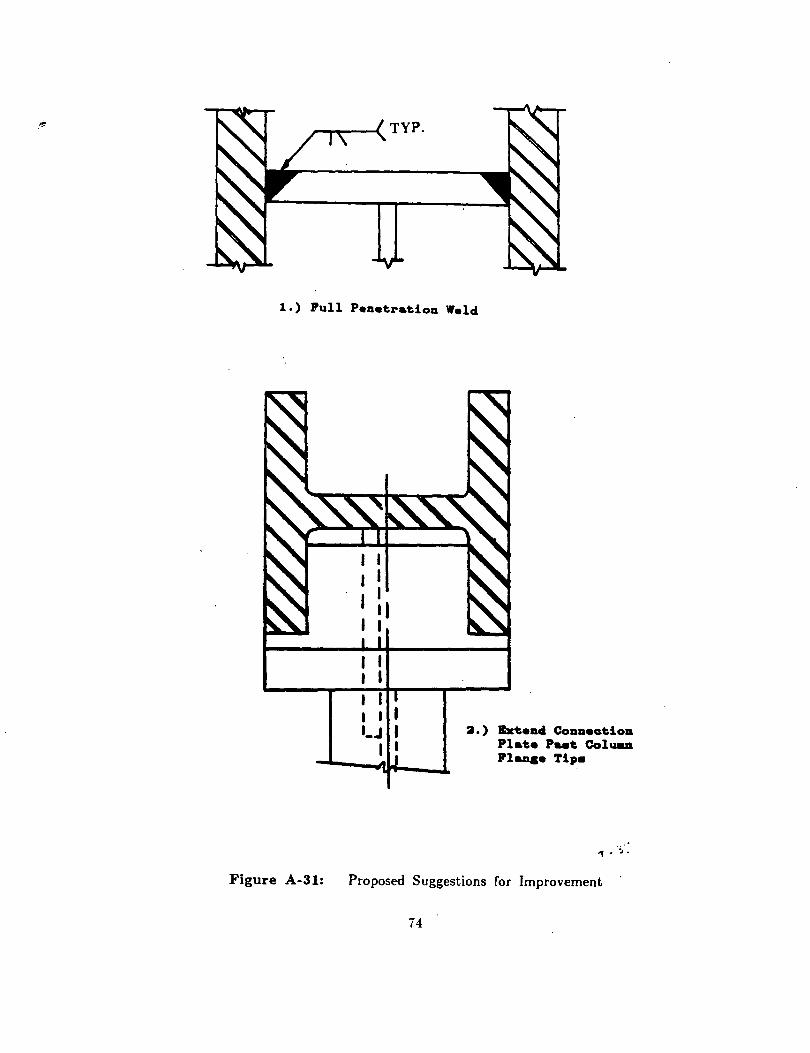
1.) Pull Penetration Weld
Figure A-31:
3,) ~end ConnectioD Plate P .. t ColuaA Plana• Tip•
., • ':1 •
Proposed Suggestions for Improvement
i4
,..
..J
Vita
The author was born in Sunbury, PA. on June 27, 1952 the first child of
Blair L. and Marion W. Heaton. He graduated from Selinsgrove High School m
1970 and attended Lehigh University, Bethlehem, PA. where he received a
Bachelor of Science degree in Civil Engineering in June, 197 4.
The author was employed by Bechtel Power Corporation, Gaithersburg,
MD., from June 1974 to October 1977, by Mid-Penn Engineering, Lewisburg,
PA., from November 1977 to January 1979 and by Koppers Co., Williamsport,
PA., from January 1979 to July 1985. He returned to Lehigh University in
August 1985 to pursue a Master of Science Degree m Civil Engineering where
he worked as a research assistant on Project. 504.
75