Embed Size (px)
Citation preview
Geophys. J . Int. (1992) 111, 617-629
Cyclic crustal movement, steady uplift of marine terraces, and evolution of the island arc-trench system in southwest Japan
Toshinori Sato' and Mitsuhiro Matsu'ura2 'Earthquake Research Institute, Universify of Tokyo, Tokyo 113, Japan 'Department of Earth and Planetary Physics, Uniuersify of Tokyo, Tokyo 113, Japan
Accepted 1992 June 22. Received 1992 June 22; in original form 1992 March 2
S U M M A R Y In southwest Japan, where the Philippine Sea Plate is descending beneath the Eurasian Plate at the Nankai Trough, we can observe cyclic crustal movement related to the periodic occurrence of interplate earthquakes with the time interval of 10' yr, steady uplift of the marine terraces formed by eustatic sea-level changes for the last lo5 yr, and gradual evolution of the island arc-trench system through the last 4 x 10' yr. We demonstrate that these phenomena with very different characteristic time-scales can be consistently explained by a single-plate subduction model. In our model, the lithosphere-asthenosphere system is represented by a stratified vis- coelastic half-space under gravity, consisting of a high-viscosity surface layer and a low-viscosity substratum, and interaction between oceanic and continental plates by steady slip motion over the whole plate boundary and its perturbation associated with the periodic occurrence of earthquakes. The effects of accretion of oceanic sediments at plate boundaries, erosion on land, and sedimentation on inner trench walls are also considered in the model. From comparison of theoretical results with observed data we obtained the following conclusions valid for young subduction zones: observed deformation cycles cannot be explained by a simple rebound model in which the effect of steady-plate subduction is ignored. The steady-plate subduction brings about steady uplift of marine terraces. The present patterns of surface topography and gravity anomalies are held nearly stable by the balance of erosion (sedimentation) rates and substantial growth rates.
Key words: earthquake cycle, gravity anomalies, marine terrace uplift, plate subduction, southwest Japan.
1 INTRODUCTION
Interaction between oceanic and continental plates at subduction zones produces various phenomena such as cyclic crustal deformation associated with the periodic occurrence of earthquakes, steady uplift of marine terraces, and evolution of island arc-trench systems. In southwest Japan, where the Philippine Sea Plate is descending beneath the Eurasian Plate at the Nankai Trough, we can observe the periodic occurrence of large interplate earthquakes with a recurrence interval of 10'yr (Ando 1975). From the comparison of repeated geodetic measurements, crustal deformation during the last earthquake cycle (1890-1980) has been revealed in detail by Thatcher (1984) and Miyashita (1987). The crustal deformation cycle is characterized by instantaneous changes associated with the occurrence of the 1946 Nankaido earthquake, rapid
recovery motion in the postseismic period, and gradual movements in the interseismic period. An important fact indicated by these geodetic data is that a certain amount of permanent vertical displacement remains after the comple- tion of one earthquake cycle. Along coastlines in southwest Japan we can observe a series of well-developed marine terraces, formed by eustatic sea-level changes for the last 10'yr (Yoshikawa, Kaizuka & Ota 1964; Yonekura 1968; Ota 1975). The uplift rate of these marine terraces is 2 mm yr-' at Muroto, Shikoku Island, and decreases gradually with distance from the Nankai Trough. The rate and pattern of uplift of marine terraces roughly agree with those of the permanent surface deformation on a long-term average. This suggests that the characteristic patterns of topography and gravity anomalies observed in southwest Japan have been formed as a result of the accumulation of the permanent deformation. According to the detailed maps
617
Dow
nloaded from https://academ
ic.oup.com/gji/article-abstract/111/3/617/774162 by guest on 10 April 2019
618 T. Sat0 and M. Matsu’ura
of ocean-bottom topography and free-air gravity anomalies in and around Japan (Tomoda & Fujimoto 1982), the patterns of topography and gravity anomalies across the Nankai Trough are characterized by island-arc high, trench low, and outer-rise gentle high. Such characteristic patterns of topography and gravity anomalies are commonly observed at all subduction zones in the world.
A number of authors have quantitatively explained each of these phenomena in each time-scale with conceptually independent models. Thatcher & Rundle (1984) have explained the cyclic crustal deformation in southwest Japan by using a viscoelastic coupling model based on the general formalism for earthquake cycles developed by Savage (1983). They assumed that steady-state plate subduction did not contribute to vertical surface deformation, and so the deformation process was completely cyclic. This assumption is clearly in contradiction with the secular uplift motion observed at Muroto Promontory. Stuart (1988) has simulated the cyclic earthquake process at the Nankai Trough by using a rate- and state-dependent friction law. In this simulation, however, viscoelastic properties of the asthenosphere are not taken into account. The viscosity of the asthenosphere is of the order of 1018-10’9Pas. Then, the relaxation time of the asthenosphere is of the order of 1-10 yr, but the effective relaxation time of the lithosphere- asthenosphere system, which depends on the characteristic wavelength of deformation, is much longer than it (Matsu’ura & Sat0 1989). In any case the effect of viscoelastic relaxation in the asthenosphere cannot be neglected.
Yoshikawa, Kaizuka & Ota (1964) have explained the rate and pattern of uplift of the marine terraces at Muroto Promontory by assuming that a fraction of coseismic vertical displacement remains after the completion of each earthquake cycle. However their explanation is inconsistent with the fact that the marine terraces are developed even at places where the coseismic change is subsidence.
A number of attempts to explain the whole patterns of topography and/or gravity anomalies across island arc- trench systems have been made, for example, by Davies (1981) in terms of the bending of a thin elastic plate subject to stresses transmitted through a descending slab and a mantle wedge, by Melosh (1978), Melosh & Raefsky (1980) and Zhang, Hager & Raefsky (1985) in terms of the stress induced by viscous flow in the lower part of a bending plate, and by Tharp (1985) in terms of the deflection of a surface layer with a low-strength megathrust zone and a high-density descending slab subject to horizontal short- ening at a constant rate. None of these models, however, could explain consistently the gross features of topography and/or gravity anomalies across island arc-trench systems, namely, island-arc high, trench low, and outer-rise gentle high.
In these studies, phenomena with different time-scales are treated independently, but the fundamental cause of them is the same: the subduction of oceanic plates. We have constructed a plate subduction model, which explains consistently all of the phenomena with different time-scales, in a series of papers (Matsu’ura & Sat0 1989; Sat0 & Matsu’ura 1988, 1992). Matsu’ura & Sato (1989) have developed a dislocation model for the earthquake cycle at subduction zones. They considered the perfectly elastic
lithosphere overlying the viscoelastic asthenosphere under gravity, and demonstrated that the steady-plate subduction brought about the permanent vertical deformation of the lithosphere. This permanent deformation continuously develops the marine terraces near subduction zones. As a natural extension of the earthquake cycle model, Sat0 & Matsu’ura (1988) have treated long-term (-lo6 yr) defor- mation of the elastic lithosphere at subduction zones, and successfully explained the characteristic patterns of topog- raphy and gravity anomalies across island arc-trench systems. The assumption of the perfectly elastic lithosphere leads to the conclusion that island arc-trench systems go on growing at a constant rate unless the steady-plate subduction is interrupted. The steady growth of island arc-trench systems is consistent with the steady uplift of marine terraces, but inconsistent with the fact that the patterns of topography and gravity anomalies are nearly stable at old subduction zones. To overcome this contradiction, Sato & Matsu’ura (1992) have constructed a plate subduction model which explains the whole evolution process of island arc-trench systems, considering viscoelasticity of the lithosphere, accretion of oceanic sediments and rocks at plate boundaries, and effects of erosion and sedimentation.
In the present paper, using the plate subduction model, we explain the cyclic crustal movement, the steady uplift of marine terraces, and the characteristic patterns of topography and gravity anomalies observed at the subduction zone in southwest Japan.
2 PLATE SUBDUCTION MODEL
We model the lithosphere-asthenosphere system by a stratified viscoelastic half-space under gravity, which consists of a high-viscosity surface layer and a low-viscosity substratum. The analyses of post-glacial uplift data (Cathles 1975; Iwasaki & Matsu’ura 1982) show that the astheno- sphere behaves like a Maxwell fluid, and the lithosphere behaves like a perfectly elastic body on a time-scale shorter than 105yr. On the other hand, the studies on the deformation of the lithosphere subjected to passive loads such as volcanic islands or sea mounts (Walcott 1970; Sleep & Snell 1976; Beaumont 1978; Lambeck & Nakiboglu 1981) show that relaxation of stresses takes place even in the lithosphere on a time-scale longer than lo6 yr. Although the physical mechanism of the stress relaxation in the lithosphere may differ from that in the asthenosphere, we simply assume that both layers behave like a Maxwell fluid in shear and an elastic solid in bulk. Then the constitutive equations for the kth layer (k = 1,2) are written in tensor form as
where A ( k ) and p(*) are the Lam6 constants, q(k ) is the viscosity, and q,, E,) and b,, are the stress tensor, strain tensor, and the unit diagonal tensor, respectively. The dot indicates differentiation with respect to time.
We introduce an infinitely long dislocation surface Z, which divides the stratified viscoelastic half-space into two parts, oceanic and continental parts, as shown in Fig. 1. Here, it should be noted that the infinitely long dislocation
Dow
nloaded from https://academ
ic.oup.com/gji/article-abstract/111/3/617/774162 by guest on 10 April 2019
Crustal movement in southwest Japan 619
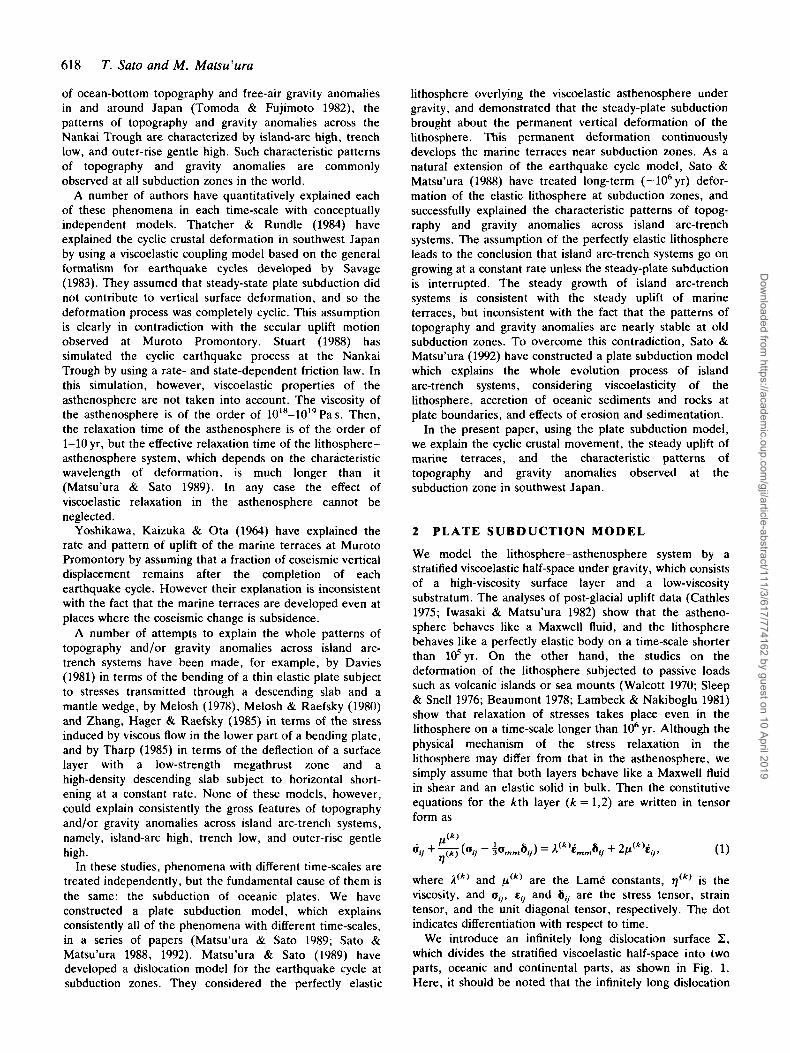
Figure 1. Schematic diagram showing the coordinate system and the structure model used in the present study. The two-layered, viscoelastic half-space is divided into continental (left) and oceanic (right) parts by a plate interface P.
surface is not the approximation of an isolated plate boundary with a finite length, but the approximation of a sequence of various types of plate boundaries, which makes the circuit of the earth. We represent interaction between oceanic and continental plates by the increase of discontinuity in tangential displacement across the plate boundary. The displacement discontinuity (dislocation) is mathematically equivalent to the force system of a double couple without moment (Maruyama 1963; Burridge & Knopoff 1964). The force system of a double couple has no net force and no net torque. In general, such a property must be satisfied for any force system acting on the plate boundary, since it is the internal force imposed by a
T - T +
Depth
dynamic process within the earth. This is one of the reasons why we represent the plate interaction by the displacement discontinuity. Another reason is more practical; that is, the configurations of plate boundaries and the average slip rates across them can be precisely determined from present-day observations.
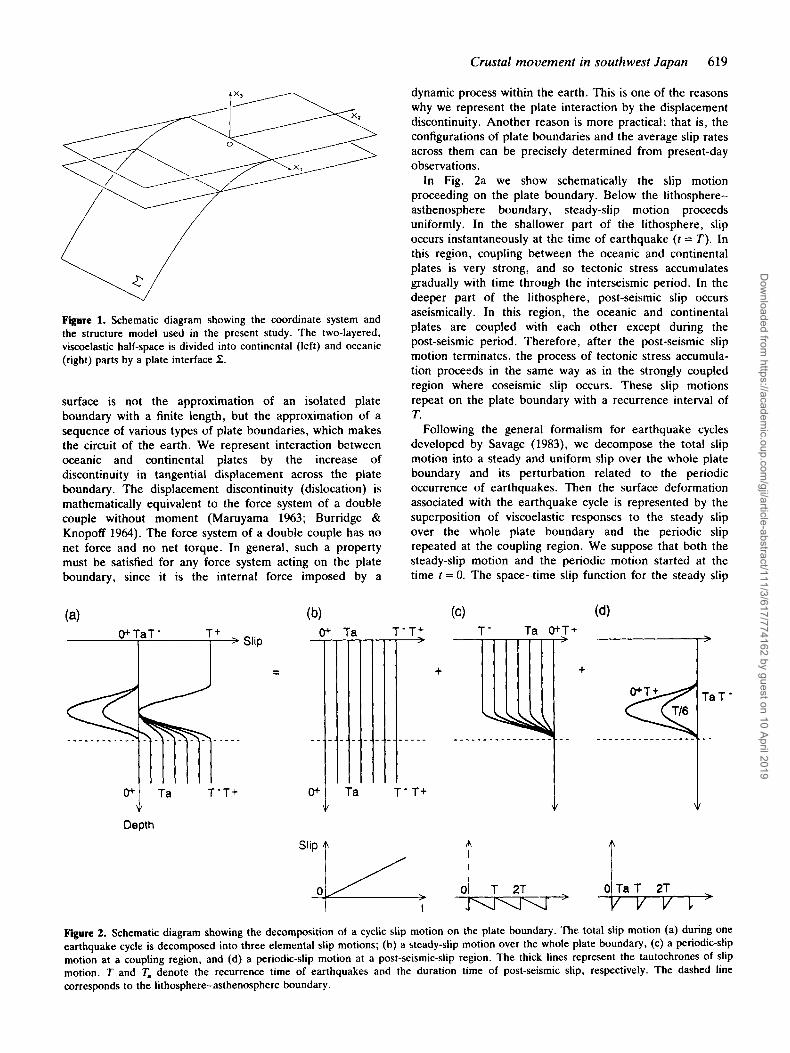
In Fig. 2a we show schematically the slip motion proceeding on the plate boundary. Below the lithosphere- asthenosphere boundary, steady-slip motion proceeds uniformly. In the shallower part of the lithosphere, slip occurs instantaneously at the time of earthquake (r = T). In this region, coupling between the oceanic and continental plates is very strong, and so tectonic stress accumulates gradually with time through the interseismic period. In the deeper part of the lithosphere, post-seismic slip occurs aseismically. In this region, the oceanic and continental plates are coupled with each other except during the post-seismic period. Therefore, after the post-seismic slip motion terminates, the process of tectonic stress accumula- tion proceeds in the same way as in the strongly coupled region where coseismic slip occurs. These slip motions repeat on the plate boundary with a recurrence interval of T.
Following the general formalism for earthquake cycles developed by Savage (1983), we decompose the total slip motion into a steady and uniform slip over the whole plate boundary and its perturbation related to the periodic occurrence of earthquakes. Then the surface deformation associated with the earthquake cycle is represented by the superposition of viscoelastic responses to the steady slip over the whole plate boundary and the periodic slip repeated at the coupling region. We suppose that both the steady-slip motion and the periodic motion started at the time t = 0. The space-time slip function for the steady slip
T - Ta OtT+
+
Ta T - T +
f
P +
1 0 Ta T 2T
Figure 2. Schematic diagram showing the decomposition of a cyclic slip motion on the plate boundary. The total slip motion (a) during one earthquake cycle is decomposed into three elemental slip motions; (b) a steady-slip motion over the whole plate boundary, (c) a periodic-slip motion at a coupling region, and (d) a periodic-slip motion at a post-seismic-slip region. The thick lines represent the tautochrones of slip motion. T and Ta denote the recurrence time of earthquakes and the duration time of post-seismic slip, respectively. The dashed line corresponds to the lithosphere-asthenosphere boundary.
Dow
nloaded from https://academ
ic.oup.com/gji/article-abstract/111/3/617/774162 by guest on 10 April 2019
620 T. Sat0 and M . Matsu'ura
(Fig. 2b) is given by
L(L t ) = U,ltH(t), (2)
where upl denotes the plate convergence rate, H ( t ) the unit step function, and E the coordinates of a point on the plate boundary. The periodic slip motion is further divided into two parts. One part represents the effect of interseismic coupling between the oceanic and continental plates (Fig. 2c). This effect can be expressed by a steady back slip at the coupling region, namely the region where coseismic or post-seismic slip occurs. We denote the degree of coupling at 5 by C(5) ; C(E) = 1 corresponds to complete coupling, and C(E)=O to complete decoupling. Another part represents the post-seismic slip (Fig. 2d). We denote the rate of the post-seismic slip by u,, which is assumed to be constant for simplicity, the duration time by Ta, and the normalized distribution of slip by A(5) . The total amount of post-seismic slip over a cycle at 5 is given by u,TdA(E). Then the space-time slip function for the periodic slip during the (n + 1)th earthquake cycle is written as
n
Here, u , , D ( ~ ) T gives the amount of coseismic slip at 5. The first term of equation (3) corresponds to the steady back slip representing the effect of interseismic coupling, the second term to the coseismic slip, and the third term to the post-seismic slip.
The vertical surface displacement w ( x , t ) due to the slip motion on the plate boundary can be obtained from viscoelastic response to a unit-step slip by using technique of hereditary integral;
= upl [ u s ( x . t - t) d t - upl ' u , (x , t - t) dt 1,
+ u,(x, t - t) d t , nT I t < ( n + 1)T, Jn T 1
the
( 5 )
(6)
and
t , = min(t, n T + T,). (10) Here, q ( x , t ; 6, t) indicates the vertical component of surface displacement at a point x and a time t due to a unit-step slip at a point E and a time t. Concrete expressions for q ( x , t ; E, t ) are given in Sat0 & Matsu'ura (1992). Equation (5) gives a general expression for the crustal deformation at subduction zones: the first term represents the surface displacement due to the steady-plate subduction, the second term the effect of interseismic coupling, the third term the viscoelastic response to the sequence of periodic coseismic slips, and the fourth term the viscoelastic response to the sequence of periodic post-seismic slips. The summations in the third and fourth terms of equation (5) can be analytically evaluated (Matsu'ura & Sat0 1989).
To measure the surface deformation during an earthquake cycle, we need a frame of reference. As the frame of reference we take the configuration of the earth's surface just after the occurrence of the nth earthquake ( t = nT+), and define the surface displacement for the ( n + 1)th earthquake cycle by
Aw(x, I ) W(X, nT + t ) - W(X, n T + ) . (11)
Here, the time t is also measured from just after the occurrence of the nth earthquake. At t = T - , just before the occurrence of the next earthquake, the surface displacement becomes
We consider two representative cases: the first is the case of young subduction zones, where the duration time ( n T ) of steady-plate subduction is much longer than the effective stress relaxation time in the asthenosphere (ta - 10-102 yr, assuming the viscosity of the asthenosphere to be 1018-10'y Pas), but much shorter than that in the lithosphere ( t l - 106-107 yr, assuming the viscosity of the lithosphere to be 1023-1024Pas). The second is the case of old subduction zones, where the duration time of steady-plate subduction is much longer than the effective stress relaxation time in the lithosphere. In the first case (t, << nT << t l ) , as demonstrated by Matsu'ura & Sat0 (1989), viscoelastic response to a step slip in the asthenosphere vanishes at t = nT, but to a step slip in the lithosphere it becomes constant in time, because the lithosphere still behaves like an elastic plate on this time-scale. Therefore, all of the integrands in equation (12) can be regarded as constants. Then, using the relation (4),
Dow
nloaded from https://academ
ic.oup.com/gji/article-abstract/111/3/617/774162 by guest on 10 April 2019
Crustal movement in southwest Japan 621
we may rewrite equation (12) as with
(20) du,(x, t )
g h , t ) = L__. 3x2
In the case of young subduction zones (t, << t << tJ, both u,(x, t) and g,(x, t) become constant in time. Therefore, denoting them by u:(x) and g:(x), we can evaluate the growth rate as
(21)
+s(x, t ) up!( u:(x) - uac / ' K : [ x - uac(t - t)e21 dt I = uplu:(x - uaCfez), x 5 0.
This means that the pattern of the growth rate does not change in time; it migrates seaward at the accretion rate ua, as a whole. When subduction zones are sufficiently old (r, << tl << t ) , both u,(x, 1 ) and gs(x, t ) vanish, and so the growth rate can be evaluated as
~ s ( ~ 9 t ) = -uplu,, g:[x - u,Jt - t)ezl dt r = uPl[u:(x - u,,te2) - u:(x - u,,te2 + uactleZ)l ,
x s o . (22)
In the second case (t, << tl << n T ) , viscoelastic step response at f = n T vanishes even for the slip in the lithosphere, because not only the asthenosphere but also the lithosphere behaves like a perfect fluid on this time-scale. Therefore, all of the terms in equation (12) vanish, except for uplTud(x,O+). Then we may rewrite equation (12) as
AW(X, T - ) = -uplTud(x, O+). (14)
Here, u,,Tud(x, O + ) is the elastic response to the coseismic slip, and so the surface displacement just after the occurrence of the next earthquake (t = T + ) becomes
Aw(x, T + ) = uplTu,(x, nT) (15) for the young subduction zones, and
Aw(x, T + ) = 0
for the old subduction zones. Namely, at the young subduction zones, a certain amount of surface displacement due to the steady-plate subduction remains after the completion of one earthquake cycle, but not at the old subduction zones. The surface deformation at the old subduction zones is completely cyclic. This means that the island arc-trench systems grow at a constant rate in the early stage of plate subduction, but its growth rate decreases with time and finally becomes zero, because of the viscoelastic relaxation of the lithosphere.
On a very long time-scale, as demonstrated by Sat0 & Matsu'ura (1992), the accretion of oceanic sediments and rocks at plate boundaries strongly affects the deformation process of island arc-trench systems. In southwest Japan the existence of a large amount of accreted material has been reported by Taira et al. (1982), and so we must consider the effect of accretion. Since the accreted oceanic sediments and rocks ultimately coalesce into continental land masses (Moore & Silver 1987), the accretion process can be regarded as the process of successively creating a new plate boundary in front of old plate boundaries. In the present study, we simply assume that the plate boundary migrates seaward at a constant accretion rate u,, without change in its shape. The effect of accretion on the long-term deformation of continental plates can be incorporated into our model by replacing the first term of equation (5) by
with
u,(x - v,,se,, t - t) = q ( x , I; 5 + uatzez, t) 4, (18) I, where e2 denotes the unit vector pointing in the direction of the x 2 axis. Then the growth rate ~ s ( x , t ) of island arcs due to steady-plate subduction becomes
W , t ) = upl[ u,(x, t ) - u,, [gS+ - u,,(t - t ) e2 , Z) d r ] ,
x ~ 0 , (19)
In this case the growth rate depends on the accretion rate uac; if u,, is very small, +,(x, t) becomes zero.
Other important factors controlling the evolution process of island arc-trench systems are erosion and sedimentation. The rate of erosion depends generally on various factors such as climate, vegetation, properties of rocks, height and inclination of land surfaces (Bloom 1978). From the detailed study on erosion at mountainous regions in Japan, Ohmori (1978) has obtained an empirical relation that the rate of erosion depends mainly on land height and is in proportion to its square. We adopt this relation in our modelling. As to the rate of sedimentation, unfortunately, we have little information. In the present study, we simply assume the sedimentation rate on inner trench walls to be in proportion to the square of marine depth, on the basis of the fact that inner trench walls are generally covered with thick sediments (e.g. Iwasaki et al. 1990). We neglect the effect of sedimentation on oceanic plates, because the sediments covering ocean floors and outer trench walls are very thin. Then the height change, Aw,(x,t), due to erosion and sedimentation during a short time interval At can be expressed as
Aw,(x, t) = - y sgn [w(x, t - At)][w(x, t - At)12 At (23)
for the continental region, and
Aw,(x,t)=O (24)
for the oceanic region. Here, y denotes the rate of erosion (sedimentation), and w(x, t - At) is the height of the earth's surface at the time t - At. The direct effect of erosion and sedimentation is, of course, the levelling of surface topography. This process is always accompanied by mass transfer from island arcs to trenches and brings about loading and unloading on the earth's surface. Therefore, as pointed out by King, Stein & Rundle (1988), the crustal deformation caused by the loading and unloading must be taken into account as the secondary effect of erosion and
Dow
nloaded from https://academ
ic.oup.com/gji/article-abstract/111/3/617/774162 by guest on 10 April 2019
622 T. Sat0 and M . Matsu'ura
sedimentation. We denote the surface deformation prod- uced by the height change Awc due to erosion and sedimentation during a period from t = (k - 1) At to t = k At by Aw,(x, t ; k At). A concrete expression for Aw, is given in Sat0 & Matsu'ura (1992). Then the height of the earth's surface at each time step can be successively evaluated by the following algorithm:
w(x, n At) = w,(x, n At) + c Aw,(x, k At) n
k = l
n
+ c Aw,(x, n At; k At). k = l
Here, the first term corresponds to the vertical surface displacement due to the steady-plate subduction, the second term to the direct effect of erosion and sedimentation, and the third term to the effect of the loading and unloading associated with erosion and sedimentation.
3 APPLICATION TO SOUTHWEST JAPAN
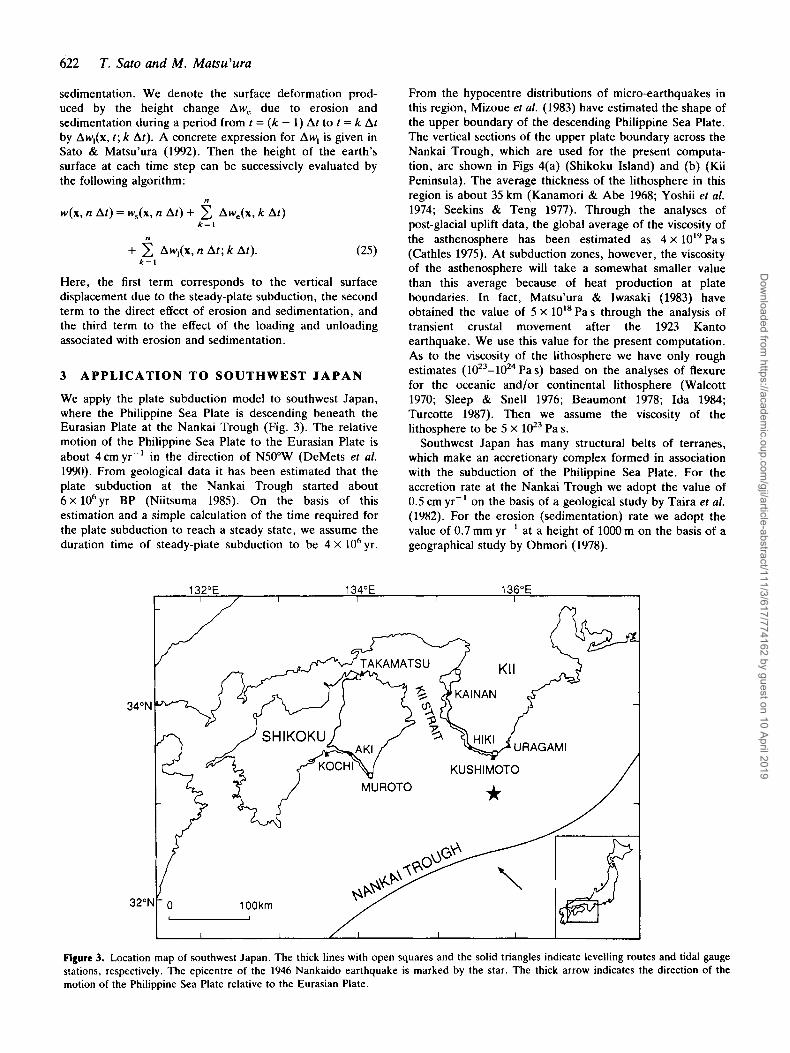
We apply the plate subduction model to southwest Japan, where the Philippine Sea Plate is descending beneath the Eurasian Plate at the Nankai Trough (Fig. 3). The relative motion of the Philippine Sea Plate to the Eurasian Plate is about 4 cm yr-' in the direction of N50"W (DeMets et al. 1990). From geological data it has been estimated that the plate subduction at the Nankai Trough started about 6~ 10"yr BP (Niitsuma 1985). On the basis of this estimation and a simple calculation of the time required for the plate subduction to reach a steady state, we assume the duration time of steady-plate subduction to be 4 x 10" yr.
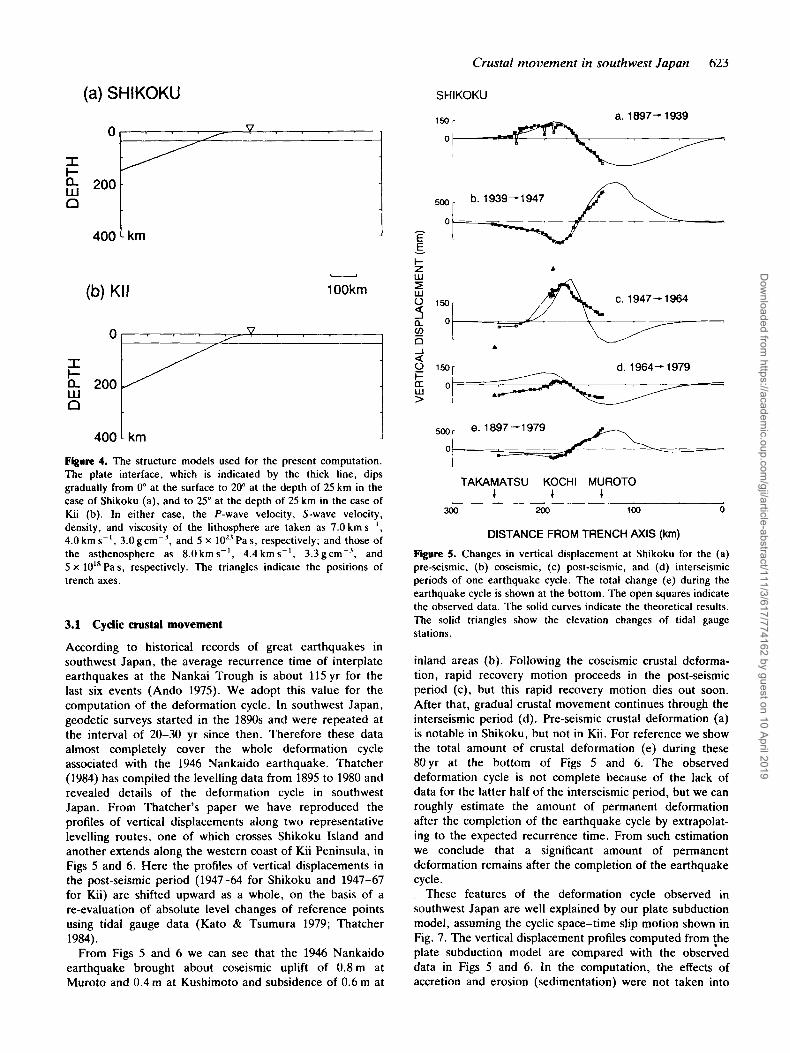
From the hypocentre distributions of micro-earthquakes in this region, Mizoue et al. (1983) have estimated the shape of the upper boundary of the descending Philippine Sea Plate. The vertical sections of the upper plate boundary across the Nankai Trough, which are used for the present computa- tion, are shown in Figs 4(a) (Shikoku Island) and (b) (Kii Peninsula). The average thickness of the lithosphere in this region is about 35 km (Kanamori & Abe 1968; Yoshii et al. 1974; Seekins & Teng 1977). Through the analyses of post-glacial uplift data, the global average of the viscosity of the asthenosphere has been estimated as 4 x 10'' Pa s (Cathles 1975). At subduction zones, however, the viscosity of the asthenosphere will take a somewhat smaller value than this average because of heat production at plate boundaries. In fact, Matsu'ura & Iwasaki (1983) have obtained the value of 5 x 10l8 Pas through the analysis of transient crustal movement after the 1923 Kanto earthquake. We use this value for the present computation. As to the viscosity of the lithosphere we have only rough estimates ( 1023-1024 Pa s) based on the analyses of flexure for the oceanic and/or continental lithosphere (Walcott 1970; Sleep & Snell 1976; Beaumont 1978; Ida 1984; Turcotte 1987). Then we assume the viscosity of the lithosphere to be 5 X loz3 Pa s.
Southwest Japan has many structural belts of terranes, which make an accretionary complex formed in association with the subduction of the Philippine Sea Plate. For the accretion rate at the Nankai Trough we adopt the value of 0.5 cm yr-l on the basis of a geological study by Taira et al. (1982). For the erosion (sedimentation) rate we adopt the value of 0.7 mm yr-' at a height of 1000 m on the basis of a geographical study by Ohmori (1978).
Figure 3. Location map of southwest Japan. The thick lines with open squares and the solid triangles indicate levelling routes and tidal gauge stations, respectively. The epicentre of the 1946 Nankaido earthquake is marked by the star. The thick arrow indicates the direction of the motion of the Philippine Sea Plate relative to the Eurasian Plate.
Dow
nloaded from https://academ
ic.oup.com/gji/article-abstract/111/3/617/774162 by guest on 10 April 2019
Crustal movement in southwest Japan 623
$ 200- n
(a) SHIKOKU S H I KOKU
(b) KII - 1 OOkm
E h n u 200 Y
400 I km J Figure 4. The structure models used for the present computation. The plate interface, which is indicated by the thick line, dips gradually from 0" at the surface to 20" at the depth of 25 km in the case of Shikoku (a), and to 25" at the depth of 25 km in the case of Kii (b). In either case, the P-wave velocity, S-wave velocity, density, and viscosity of the lithosphere are taken as 7.0 km s-I, 4.0 km s-' , 3.0 g cm-3, and 5 x loz3 Pas, respectively; and those of the asthenosphere as 8.0 km s-', 4.4 km s-'. 3.3gcm-', and 5 x 10" Pas, respectively. The triangles indicate the positions of trench axes.
3.1 Cyclic crustal movement
According to historical records of great earthquakes in southwest Japan, the average recurrence time of interplate earthquakes at the Nankai Trough is about 115yr for the last six events (Ando 1975). We adopt this value for the computation of the deformation cycle. In southwest Japan, geodetic surveys started in the 1890s and were repeated at the interval of 20-30 yr since then. Therefore these data almost completely cover the whole deformation cycle associated with the 1946 Nankaido earthquake. Thatcher (1984) has compiled the levelling data from 1895 to 1980 and revealed details of the deformation cycle in southwest Japan. From Thatcher's paper we have reproduced the profiles of vertical displacements along two representative levelling routes, one of which crosses Shikoku Island and another extends along the western coast of Kii Peninsula, in Figs 5 and 6. Here the profiles of vertical displacements in the post-seismic period (1947-64 for Shikoku and 1947-67 for Kii) are shifted upward as a whole, on the basis of a re-evaluation of absolute level changes of reference points using tidal gauge data (Kato & Tsumura 1979; Thatcher 1984).
From Figs 5 and 6 we can see that the 1946 Nankaido earthquake brought about coseismic uplift of 0.8 m at Muroto and 0.4 m at Kushimoto and subsidence of 0.6 m at
A
a 2 (I w >
d. 1964- 1979 1% r 0
A L
5,,,, e. 1897 - 1979 0
I TAKAMATSU KOCHI MUROTO
I I I L
300 200 loo 0
DISTANCE FROM TRENCH AXIS (km)
Figure 5. Changes in vertical displacement at Shikoku for the (a) pre-seismic, (b) coseismic, (c) post-seismic, and (d) interseismic periods of one earthquake cycle. The total change (e) during the earthquake cycle is shown at the bottom. The open squares indicate the observed data. The solid curves indicate the theoretical results. The solid triangles show the elevation changes of tidal gauge stations.
inland areas (b). Following the coseismic crustal deforma- tion, rapid recovery motion proceeds in the post-seismic period (c), but this rapid recovery motion dies out soon. After that, gradual crustal movement continues through the interseismic period (d). Pre-seismic crustal deformation (a) is notable in Shikoku, but not in Kii. For reference we show the total amount of crustal deformation (e) during these 80yr at the bottom of Figs 5 and 6. The observed deformation cycle is not complete because of the lack of data for the latter half of the interseismic period, but we can roughly estimate the amount of permanent deformation after the completion of the earthquake cycle by extrapolat- ing to the expected recurrence time. From such estimation we conclude that a significant amount of permanent deformation remains after the completion of the earthquake cycle.
These features of the deformation cycle observed in southwest Japan are well explained by our plate subduction model, assuming the cyclic space-time slip motion shown in Fig. 7. The vertical displacement profiles computed from {he plate subduction model are compared with the observed data in Figs 5 and 6. In the computation, the effects of accretion and erosion (sedimentation) were not taken into
Dow
nloaded from https://academ
ic.oup.com/gji/article-abstract/111/3/617/774162 by guest on 10 April 2019
624 T. Sat0 and M . Matsu’ura
0-
KII
0 a I-
a. 1899- 1929 15Or
o--
0
-, , 0- I -_- 4f - -
KAINAN KUSHIMOTO
300 200 100 0
DISTANCE FROM TRENCH AXIS (km)
. 1 I
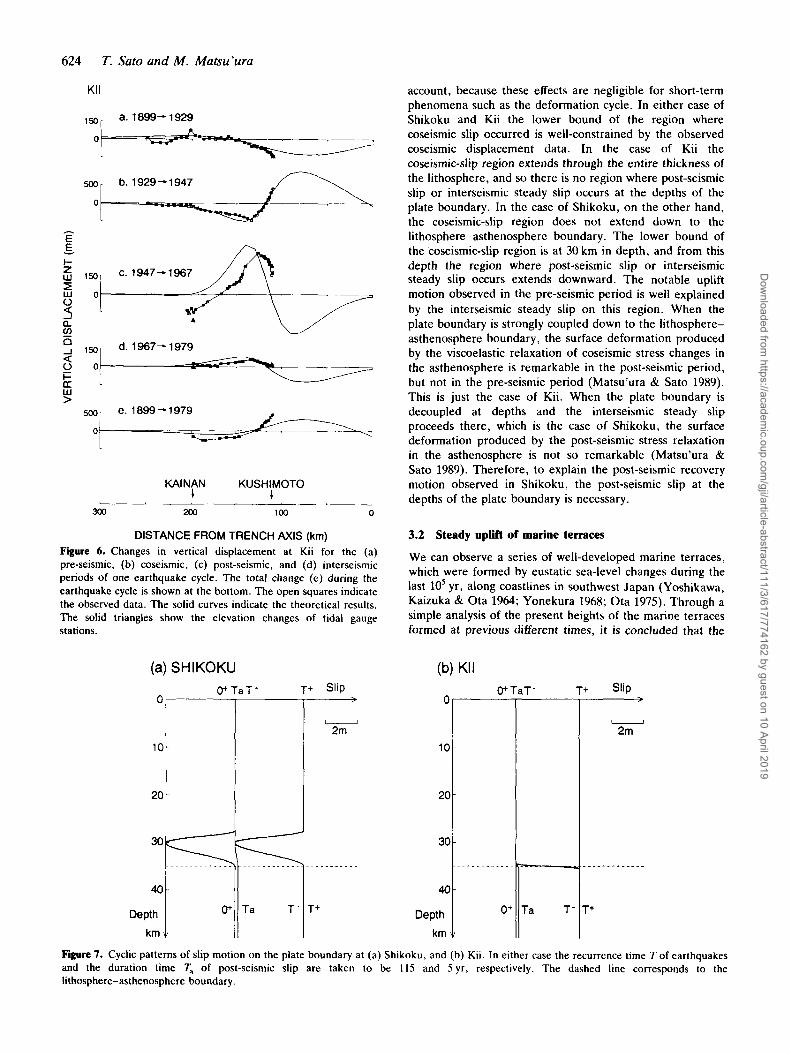
Figure 6. Changes in vertical displacement at Kii for the (a) pre-seismic, (b) coseismic, (c) post-seismic, and (d) interseismic periods of one earthquake cycle. The total change (e) during the earthquake cycle is shown at the bottom. The open squares indicate the observed data. The solid curves indicate the theoretical results. The solid triangles show the elevation changes of tidal gauge stations.
(a) SHIKOKU OC T a T - Tt Slip
I I I
20 1
30K 1 . . . . . . . . . . .
account, because these effects are negligible for short-term phenomena such as the deformation cycle. In either case of Shikoku and Kii the lower bound of the region where coseismic slip occurred is well-constrained by the observed coseismic displacement data. In the case of Kii the coseismic-slip region extends through the entire thickness of the lithosphere, and so there is no region where post-seismic slip or interseismic steady slip occurs at the depths of the plate boundary. In the case of Shikoku, on the other hand, the coseismic-slip region does not extend down to the lithosphere-asthenosphere boundary. The lower bound of the coseismic-slip region is at 30 km in depth, and from this depth the region where post-seismic slip or interseismic steady slip occurs extends downward. The notable uplift motion observed in the pre-seismic period is well explained by the interseismic steady slip on this region. When the plate boundary is strongly coupled down to the lithosphere- asthenosphere boundary, the surface deformation produced by the viscoelastic relaxation of coseismic stress changes in the asthenosphere is remarkable in the post-seismic period, but not in the pre-seismic period (Matsu’ura & Sat0 1989). This is just the case of Kii. When the plate boundary is decoupled at depths and the interseismic steady slip proceeds there, which is the case of Shikoku, the surface deformation produced by the post-seismic stress relaxation in the asthenosphere is not so remarkable (Matsu’ura & Sat0 1989). Therefore, to explain the post-seismic recovery motion observed in Shikoku, the post-seismic slip at the depths of the plate boundary is necessary.
3.2 Steady uplift of marine terraces
We can observe a series of well-developed marine terraces, which were formed by eustatic sea-level changes during the last lo5 yr, along coastlines in southwest Japan (Yoshikawa, Kaizuka & Ota 1964; Yonekura 1968; Ota 1975). Through a simple analysis of the present heights of the marine terraces formed at previous different times, i t is concluded that the
(b) KII OC TaT- Slip
I u I 2m
Depth km
Figure 7. Cyclic patterns of slip motion on the plate boundary at (a) Shikoku, and (b) Kii. In either case the recurrence time T of earthquakes and the duration time T, of post-seismic slip are taken to be 115 and 5 yr, respectively. The dashed line corresponds to the lithosphere-asthenosphere boundary.
Dow
nloaded from https://academ
ic.oup.com/gji/article-abstract/111/3/617/774162 by guest on 10 April 2019
Crustal movement in southwest Japan 625
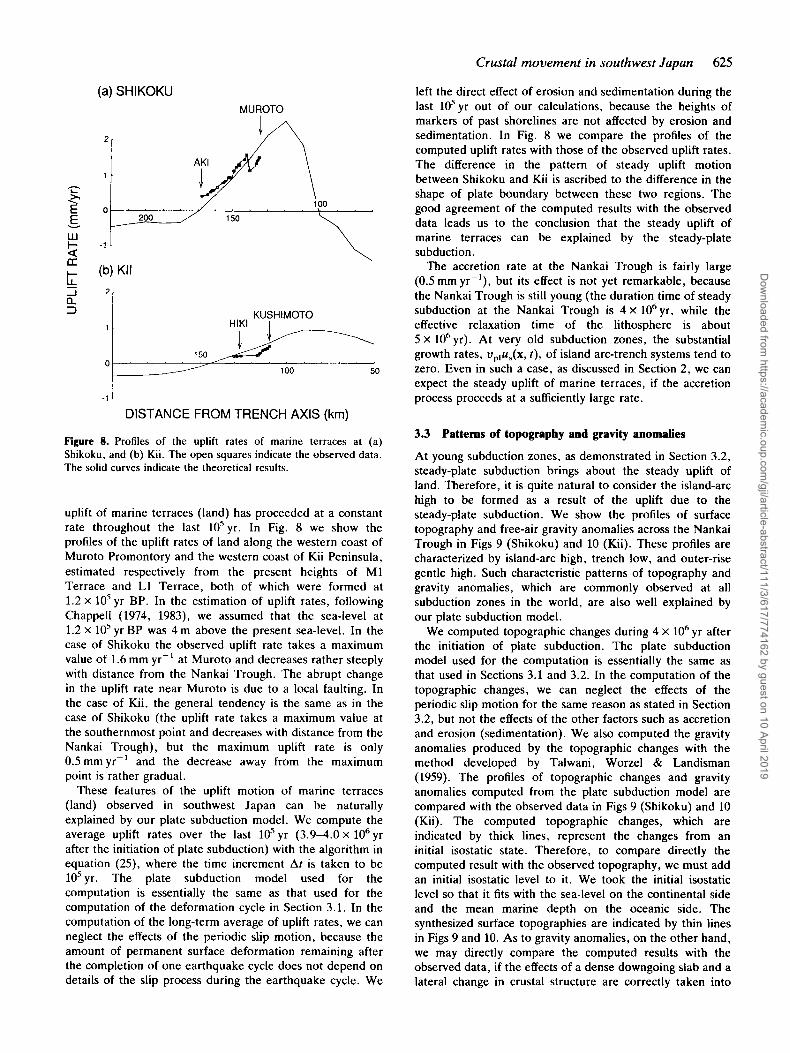
left the direct effect of erosion and sedimentation during the last 10'yr out of our calculations, because the heights of markers of past shorelines are not affected by erosion and sedimentation. In Fig. 8 we compare the profiles of the computed uplift rates with those of the observed uplift rates. The difference in the pattern of steady uplift motion between Shikoku and Kii is ascribed to the difference in the shape of plate boundary between these two regions. The good agreement of the computed results with the observed data leads us to the conclusion that the steady uplift of marine terraces can be explained by the steady-plate subduction.
The accretion rate at the Nankai Trough is fairly large (0.5 mm yr-'), but its effect is not yet remarkable, because the Nankai Trough is still young (the duration time of steady subduction at the Nankai Trough is 4 X 10⁶yr, while the effective relaxation time of the lithosphere is about 5 X 10'yr). At very old subduction zones, the substantial growth rates, uplu,(x, t ) , of island arc-trench systems tend to zero. Even in such a case, as discussed in Section 2, we can expect the steady uplift of marine terraces, if the accretion process proceeds at a sufficiently large rate.
1 .
0
(a) SHIKOKU
KUSHIMOTO
. --.- 150 1 2 ' "
100 50
MUROTO
1 .
0
* r
KUSHIMOTO
. --.- 150 1 2 ' "
100 50
(b) KII
'i
., i DISTANCE FROM TRENCH AXIS (km)
Figure 8. Profiles of the uplift rates of marine terraces at (a) Shikoku, and (b) Kii. The open squares indicate the observed data. The solid curves indicate the theoretical results.
uplift of marine terraces (land) has proceeded at a constant rate throughout the last 10'yr. In Fig. 8 we show the profiles of the uplift rates of land along the western coast of Muroto Promontory and the western coast of Kii Peninsula, estimated respectively from the present heights of M1 Terrace and L1 Terrace, both of which were formed at 1.2 x 1O'yr BP. In the estimation of uplift rates, following Chappell (1974, 1983), we assumed that the sea-level at 1.2 x 10syr BP was 4 m above the present sea-level. In the case of Shikoku the observed uplift rate takes a maximum value of 1.6 mm yr-' at Muroto and decreases rather steeply with distance from the Nankai Trough. The abrupt change in the uplift rate near Muroto is due to a local faulting. In the case of Kii, the general tendency is the same as in the case of Shikoku (the uplift rate takes a maximum value at the southernmost point and decreases with distance from the Nankai Trough), but the maximum uplift rate is only OSmmyr-' and the decrease away from the maximum point is rather gradual.
These features of the uplift motion of marine terraces (land) observed in southwest Japan can be naturally explained by our plate subduction model. We compute the average uplift rates over the last lo5 yr (3.9-4.0 x lo6 yr after the initiation of plate subduction) with the algorithm in equation (25), where the time increment At is taken to be 105yr. The plate subduction model used for the Computation is essentially the same as that used for the computation of the deformation cycle in Section 3.1. In the computation of the long-term average of uplift rates, we can neglect the effects of the periodic slip motion, because the amount of permanent surface deformation remaining after the completion of one earthquake cycle does not depend on details of the slip process during the earthquake cycle. We
3.3 Patterns of topography and gravity anomalies
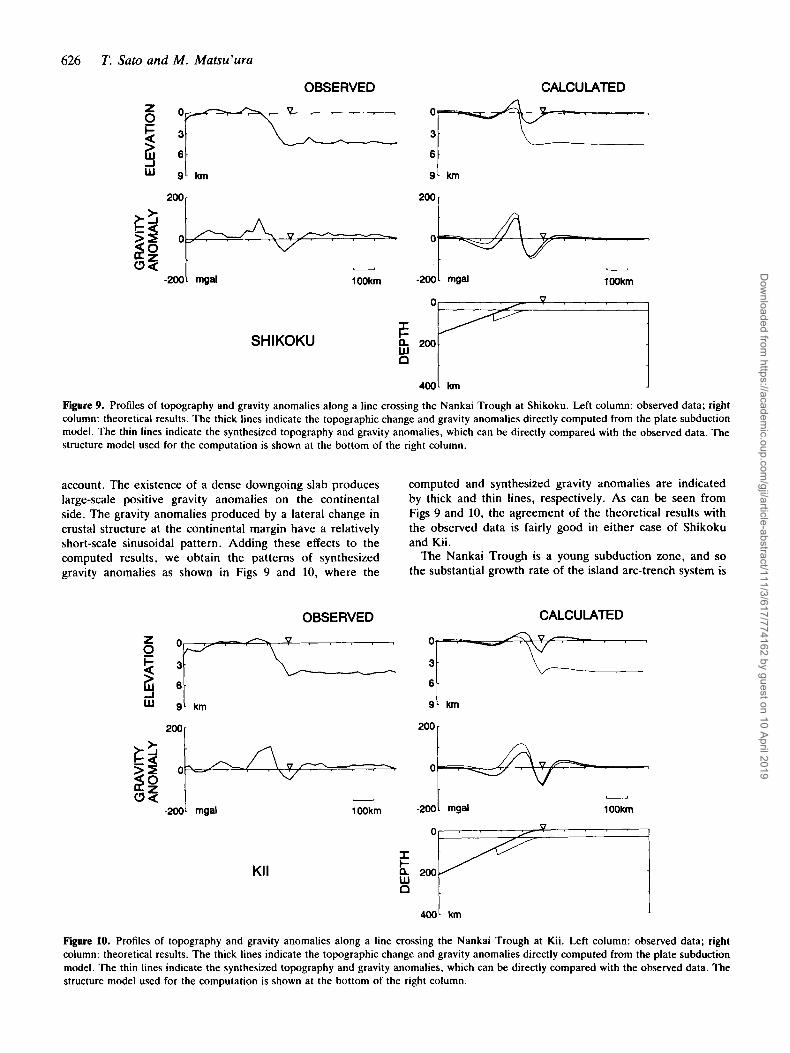
At young subduction zones, as demonstrated in Section 3.2, steady-plate subduction brings about the steady uplift of land. Therefore, it is quite natural to consider the island-arc high to be formed as a result of the uplift due to the steady-plate subduction. We show the profiles of surface topography and free-air gravity anomalies across the Nankai Trough in Figs 9 (Shikoku) and 10 (Kii). These profiles are characterized by island-arc high, trench low, and outer-rise gentle high. Such characteristic patterns of topography and gravity anomalies, which are commonly observed at all subduction zones in the world, are also well explained by our plate subduction model.
We computed topographic changes during 4 x 10" yr after the initiation of plate subduction. The plate subduction model used for the computation is essentially the same as that used in Sections 3.1 and 3.2. In the computation of the topographic changes, we can neglect the effects of the periodic slip motion for the same reason as stated in Section 3.2, but not the effects of the other factors such as accretion and erosion (sedimentation). We also computed the gravity anomalies produced by the topographic changes with the method developed by Talwani, Worzel & Landisman (1959). The profiles of topographic changes and gravity anomalies computed from the plate subduction model are compared with the observed data in Figs 9 (Shikoku) and 10 (Kii). The computed topographic changes, which are indicated by thick lines, represent the changes from an initial isostatic state. Therefore, to compare directly the computed result with the observed topography, we must add an initial isostatic level to it. We took the initial isostatic level so that it fits with the sea-level on the continental side and the mean marine depth on the oceanic side. The synthesized surface topographies are indicated by thin lines in Figs 9 and 10. As to gravity anomalies, on the other hand, we may directly compare the computed results with the observed data, if the effects of a dense downgoing slab and a lateral change in crustal structure are correctly taken into
Dow
nloaded from https://academ
ic.oup.com/gji/article-abstract/111/3/617/774162 by guest on 10 April 2019
626 T. Sat0 and M . Matsu'ura
OBSERVED
E O E
$ :t
-2001 mgal 1 OOkm
CALCULATED
9 k m 6 ::
-200 I mgal I
l00km
SHIKOKU w 0 E 2:;l 400 km
Figure 9. Profiles of topography and gravity anomalies along a line crossing the Nankai Trough at Shikoku. Left column: observed data; right column: theoretical results. The thick lines indicate the topographic change and gravity anomalies directly computed from the plate subduction model. The thin lines indicate the synthesized topography and gravity anomalies, which can be directly compared with the observed data. The structure model used for the computation is shown at the bottom of the right column.
account. The existence of a dense downgoing slab produces large-scale positive gravity anomalies on the continental side. The gravity anomalies produced by a lateral change in crustal structure at the continental margin have a relatively short-scale sinusoidal pattern. Adding these effects to the computed results, we obtain the patterns of synthesized gravity anomalies as shown in Figs 9 and 10, where the
OBSERVED
-2001 mgd 1 OOkm
computed and synthesized gravity anomalies are indicated by thick and thin lines, respectively. As can be seen from Figs 9 and 10, the agreement of the theoretical results with the observed data is fairly good in either case of Shikoku and Kii.
The Nankai Trough is a young subduction zone, and so the substantial growth rate of the island arc-trench system is
CALCULATED
9 l km
2oo I
-200 I mgal u
1 OOkm
KI I w E n 2:;1 400 km
Figure 10. Profiles of topography and gravity anomalies along a line crossing the Nankai Trough at Kii. Left column: observed data; right column: theoretical results. The thick lines indicate the topographic change and gravity anomalies directly computed from the plate subduction model. The thin lines indicate the synthesized topography and gravity anomalies, which can be directly compared with the observed data. The structure model used for the computation is shown at the bottom of the right column.
Dow
nloaded from https://academ
ic.oup.com/gji/article-abstract/111/3/617/774162 by guest on 10 April 2019
Crustal movement in southwest Japan 627
still large. The simple extrapolation of the present uplift rate of land over 4 X lo6 yr yields an island-arc of 8000 m high. On the other hand, the actual height of the island-arc in southwest Japan is only 2000m. This difference is mainly ascribed to the effects of erosion. The rate of erosion (sedimentation) is in proportion to the square of land height (marine depth). Therefore the levelling of surface topography due to erosion and sedimentation is accelerated as the growth of the island arc-trench system. From these considerations we can conclude that the present patterns of surface topography and gravity anomalies are held nearly stable by the balance of the levelling due to erosion and sedimentation and the substantial growth due to steady- plate subduction.
4 DISCUSSION AND CONCLUSIONS
We demonstrated that the cyclic crustal movement, the steady uplift of marine terraces, and the patterns of topography and gravity anomalies observed in southwest Japan could be consistently explained by a single-plate subduction model based on elastic dislocation theory. The agreement of the theoretical results with the observed data is fairly good, but there still exists a significant discrepancy between them.
The significant discrepancy is found in the post-seismic recovery motion in Kii (Fig. 6c). In this region we assumed the interplate coupling to be complete through the entire thickness of the lithosphere; otherwise the observed pre-seismic and coseismic crustal deformation could not be explained. Hence the cause of the rapid recovery motion
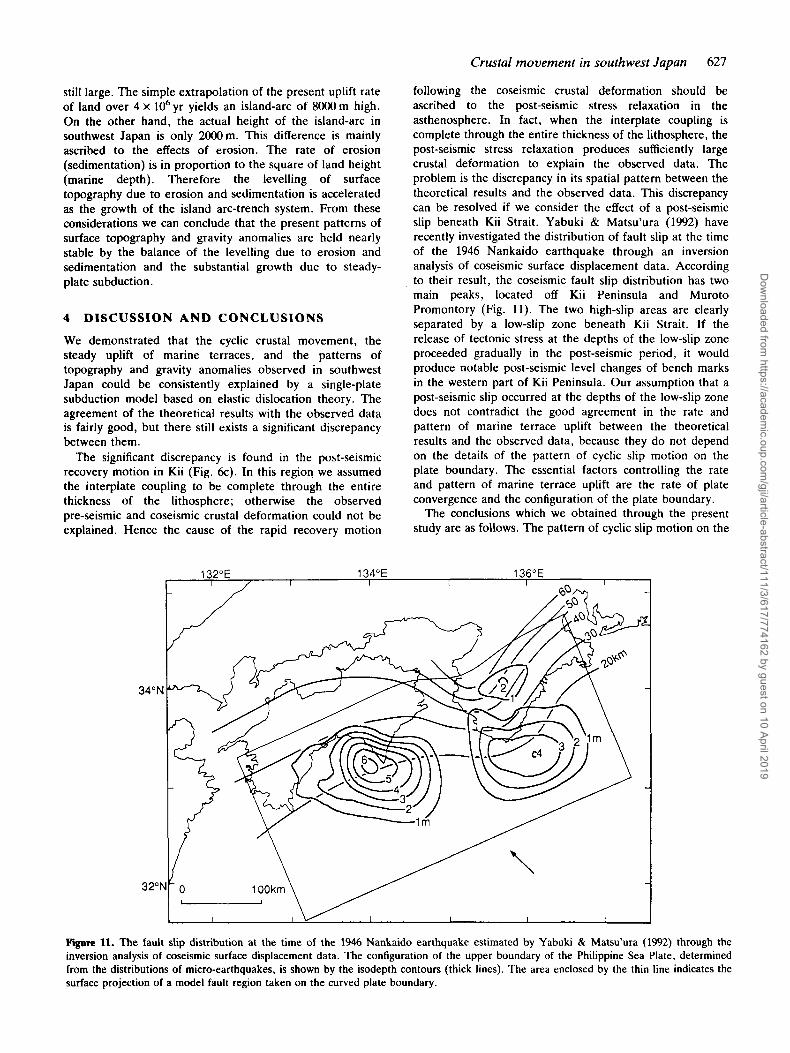
following the coseismic crustal deformation should be ascribed to the post-seismic stress relaxation in the asthenosphere. In fact, when the interplate coupling is complete through the entire thickness of the lithosphere, the post-seismic stress relaxation produces sufficiently large crustal deformation to explain the observed data. The problem is the discrepancy in its spatial pattern between the theoretical results and the observed data. This discrepancy can be resolved if we consider the effect of a post-seismic slip beneath Kii Strait. Yabuki & Matsu'ura (1992) have recently investigated the distribution of fault slip at the time of the 1946 Nankaido earthquake through an inversion analysis of coseismic surface displacement data. According to their result, the coseismic fault slip distribution has two main peaks, located off Kii Peninsula and Muroto Promontory (Fig. 11). The two high-slip areas are clearly separated by a low-slip zone beneath Kii Strait. If the release of tectonic stress at the depths of the low-slip zone proceeded gradually in the post-seismic period, it would produce notable post-seismic level changes of bench marks in the western part of Kii Peninsula. Our assumption that a post-seismic slip occurred at the depths of the low-slip zone does not contradict the good agreement in the rate and pattern of marine terrace uplift between the theoretical results and the observed data, because they do not depend on the details of the pattern of cyclic slip motion on the plate boundary. The essential factors controlling the rate and pattern of marine terrace uplift are the rate of plate convergence and the configuration of the plate boundary.
The conclusions which we obtained through the present study are as follows. The pattern of cyclic slip motion on the
Figure 11. The fault slip distribution at the time of the 1946 Nankaido earthquake estimated by Yabuki & Matsu'ura (1992) through the inversion analysis of coseismic surface displacement data. The configuration of the upper boundary of the Philippine Sea Plate, determined from the distributions of micro-earthquakes, is shown by the isodepth contours (thick lines). The area enclosed by the thin line indicates the surface projection of a model fault region taken on the curved plate boundary.
Dow
nloaded from https://academ
ic.oup.com/gji/article-abstract/111/3/617/774162 by guest on 10 April 2019
628 T. Sato and M. Matsu’ura
plate boundary is essentially different between Kii and Shikoku, as far as the latest cycle is concerned. In the case of Kii the coseismic-slip region extends down to the lithosphere-asthenosphere boundary. In the case of Shikoku, on the other hand, the plate boundary is decoupled at depths, where the steady slip proceeds at a constant rate. In either case the observed deformation cycle cannot be explained by a simple rebound model, in which the effect of steady-plate subduction is ignored. The steady-plate subduction brings about the steady uplift of marine terraces at young subduction zones regardless of the rate of accretion at plate boundaries. The present patterns of surface topography and gravity anomalies across the Nankai Trough are held nearly stable by the balance of the levelling due to erosion and sedimentation and the substantial growth due to steady-plate subduction.
ACKNOWLEDGMENTS
We gratefully acknowledge Tetsuichiro Yabuki of the Hydrographic Department, Maritime Safety Agency, for providing us with the original figure of coseismic fault slip distribution. The computations were made on HITAC S-820 at the Computer Centre, University of Tokyo.
REFERENCES
Ando, M., 1975. Source mechanisms and tectonic significance of historical earthquakes along the Nankai Trough, Japan, Tectonophysics, 27, 119-140.
Beaumont, C., 1978. The evolution of sedimentary basins on a viscoelastic lithosphere: theory and examples, Geophys. 1. R. astr. SOC., 55, 471-497.
Bloom, A. L., 1978. Geomorphology. Prentice-Hall, Inc., Englewood Cliffs, NJ.
Burridge, R. & Knopoff, L., 1964. Body force equivalents for seismic dislocations, Bull. sebrn. SOC. A m . , 54, 1875-1888.
Cathles, L. M., 1975. The Viscosity of the Earrh’s Mantle, Princeton University Press, Princeton, NJ.
Chappell, J., 1974. Gcology of coral terraces, Huon Peninsula, New Guinea: a study of Quaternary tectonic movements and sea level change, Geol. SOC. Am. Bull., 85, 553-570.
Chappell, J . , 1983. A revised sea level record for the last 300000 years from Papua New Guinea, Search, 14, 99-101.
Davies, G. F., 1981. Regional compensation of subducted lithosphere: Effects on geoid, gravity and topography from a preliminary model, Earth planer. Sci. Lett., 54, 431-441.
DeMets, C., Gordon, R. G., Argus, D. F. & Stein, S., 1990. Current plate motions, Geophys. 1. Int., 101, 425-478.
Ida, Y., 1984. Stress and relaxation time in the viscoelastic lithosphere inferred from the outer topographic rise, 1. geophys. Res., 89, 3211-3221.
Iwasaki, T. & Matsu’ura, M., 1982. Quasi-static crustal deformations due to a surface load: Rheological structure of the Earth’s crust and upper mantle, 1. Phys. Earth, 30,
Iwasaki, T., Hirata, N., Kanazawa, T., Melles, J., Suyehiro. K., Urabe, T., Moller, L., Makris, J. & Shimamura, H., 1990. Crustal and upper mantle structure in the Ryukyu Island Arc deduced from deep seismic sounding, Geophys. 1. Int., 102,
Kanamori, H. & Abe, K., 1968. Deep structure of island arcs as revealed by surface waves, Bull. Earfhq. Res. Imr. Tokyo Uniu., 46, 1001-1025.
469-508.
631-651.
Kato, T. & Tsumura, K. , 1979. Vertical land movement in Japan as deduced from tidal record (in Japanese with English summary), Bull. Earthq. Res. Inst. Tokyo Univ., 54, 559-628.
King, G. C. P., Stein, R. S. & Rundle, J. B., 1988. The growth of geological structures by repeated earthquakes 1. Conceptual framework, 1. geophys. Res., 93, 13 307-13 318.
Lambeck, K. & Nakiboglu, S. M., 1981. Seamount loading and stress in the ocean lithosphere, 2, viscoelastic and elastic- viscoelastic models, 1. geophys. Res., 86, 6961-6984.
Maruyama, T., 1963. On the force equivalents of dynamical elastic dislocations with reference to the earthquake mechanism, Bull. Earthq. Res. Inst. Tokyo Univ., 41, 467-486.
Matsu’ura, M. & Iwasaki, T. , 1983. Study on coseismic and postseismic crustal movements associated with the 1923 Kanto earthquake, Tectonophysics, 97, 201-215.
Matsu’ura, M. & Sato, T., 1989. A dislocation model for the earthquake cycle at convergent plate boundaries, Geophys. 1.
Melosh, H. J., 1978. Dynamic support of the outer rise. Geophys. Res. Lett., 5, 321-324.
Melosh, H. J. & Raefsky, A., 1980. The dynamical origin of subduction zone topography, Geophys. 1. R. astr. SOC., 60, 333-354.
Miyashita, K., 1987. A model of plate convergence in southwest Japan, inferred from leveling data associated with the 1946 Nankaido earthquake, J . Phys. Earth, 35, 449-467.
Mizoue, M., Nakamura, M., Seto, N. & Ishiketa, Y., 1983. Three-layered distribution of microearthquakes in relation to focal mechanism variation in the Kii Peninsula, Southwestern Honshu, Japan, Bull. Earthq. Res. Inst . Tokyo Univ., 58,
Moore, J. C. & Silver, E. A., 1987. Continental margin tectonics: submarine accretionary prisms, Rev. Geophys., 25, 1305-1312.
Niitsuma, N. , 1985. Varying Japanese Islands-Neogene tectonics and plate subduction (in Japanese), Kagaku, 55, 53-61.
Ohmori, H. , 1978. Relief structure of the Japanese mountains and their stages in geomorphic development, Bull. Dept. Geogr. Tokyo Uniu., 10, 31-85.
Ota, Y., 1975. Late Quaternary vertical movement in Japan estimated from deformed shorelines, Quaternary Studies, R.
Sato, T. & Matsu’ura, M., 1988. A kinematic model for deformation of the lithosphere at subduction zones, 1. geophys. Res., 93, 6410-6418.
Sato, T. & Matsu’ura, M., 1992. A kinematic model for evolution of island arc-trench systems, Geophys. 1. Int. , submitted.
Savage, J. C., 1983. A dislocation model of strain accumulation and release at subduction zone, 1. geophys. Res., 88, 4984-4996.
Seekins, L. C. & Teng, T., 1977. Lateral variations in the structure of the Philippine Sea Plate, J . geophys. Res., 82, 317-324.
Sleep, N. H. & Snell, N. S., 1976. Thermal contraction and flexure of mid-continent and Atlantic marginal basins, Geophys. 1. R. astr. SOC., 45, 125-154.
Stuart, W. D., 1988. Forecast model for great earthquakes at the Nankai Trough subduction zone, Pure appl. Geophys., 1M,
Taira, A., Okada, H., Whitaker, J. H. McD. & Smith, A. J. , 1982. The Shimanto belt of Japan: Cretaceous-lower Miocene active-margin sedimentation, in Trench-forearc Geology: Sedimentation and tectonics on Modern and Ancient Active Plate Margins, pp. 5-26. ed. Leggett, J . K., Blackwell, Oxford.
Talwani, M., Worzel, J. L. & Landisman, M., 1959. Rapid gravity computations for two-dimensional bodies with application to the Mendocino submarine fracture zone, 1. geophys. Res., 64, 49-59.
Tharp, T. M., 1985. Numerical models of subduction and forearc deformation, Geophys. 1. R . astr. SOC., 80, 419-437.
Thatcher, W., 1984. The earthquake deformation cycle at the
Int. ~ 96, 23-32.
287-310.
SOC. N . Z . Bull, 13, 231-239.
619-641.
Dow
nloaded from https://academ
ic.oup.com/gji/article-abstract/111/3/617/774162 by guest on 10 April 2019
Crustal movement in southwest Japan 629
Nankai Trough, southwest Japan, 1. geophys. Res., 89,
Thatcher, W. & Rundle. J. B., 1984. A viscoelastic coupling model for the cyclic deformation due to periodically repeated earthquakes at subduction zones, J . geophys. Res., 89,
Tomoda, Y. & Fujimoto, H., 1982. Maps of gravity anomalies and bottom topography in the Western Pacific, Bull. Ocean Res. h r . Tokyo Univ., 14, 158 pp.
Turcotte, D. L., 1987. Rheology of the oceanic and continental
3087-3101.
7631-7640.
lithosphere, in Composition, Srrucrure and Dynamics of the Lithosphere-Asthenosphere System, Geodynamin ser., vol. 16, pp. 61-67, eds Fucks, K. & Froidevaux, C., AGU, Washington, DC.
Walcott, R. I., 1970. Flexural rigidity, thickness, and viscosity of the lithosphere, 1. geophys. Res., 75, 3941-3954.
Yabuki, T . & Matsu’ura, M., 1992. Geodetic data inversion using a
Bayesian information criterion for spatial distribution of fault slip, Geophys. J . Inr., 109, 363-375.
Yonekura, N., 1968. Geomorphic development and mode of crustal movement on the south coast of the Kii Peninsula, Southwestern Japan (in Japanese with English summary), J. Geogr. Tokyo, 77, 1-23.
Yoshii, T., Sasaki, Y., Tada, T., Okada, H., Asano, S., Muramatu, I., Hashizume, M. & Moriya, T., 1974. The third Kurayosi explosion and the crustal structure in the western part of Japan, 1. Phys. Earrh, 22, 109-121.
Yoshikawa, T., Kaizuka, S. & Ota, Y., 1964. Mode of crustal movement in the late Quaternary on the southeast coast of Shikoku, southwestern Japan (in Japanese with English summary), Geogr. Rev. Japan, 37,627-648.
Zhang, J., Hager, B. H. & Raefsky, A., 1985. A critical assessment of viscous models of trench topography and corner flow, Geophys. 1. R. astr. SOC., 83, 451-475.
Dow
nloaded from https://academ
ic.oup.com/gji/article-abstract/111/3/617/774162 by guest on 10 April 2019