Embed Size (px)
Citation preview
Cytotoxic T Lymphocytes
CTLs can kill virus-infected cells. Here, a CTL (arrow) is attacking and killing a much larger influenza virus-infected target cell.
http://www.cellsalive.com/
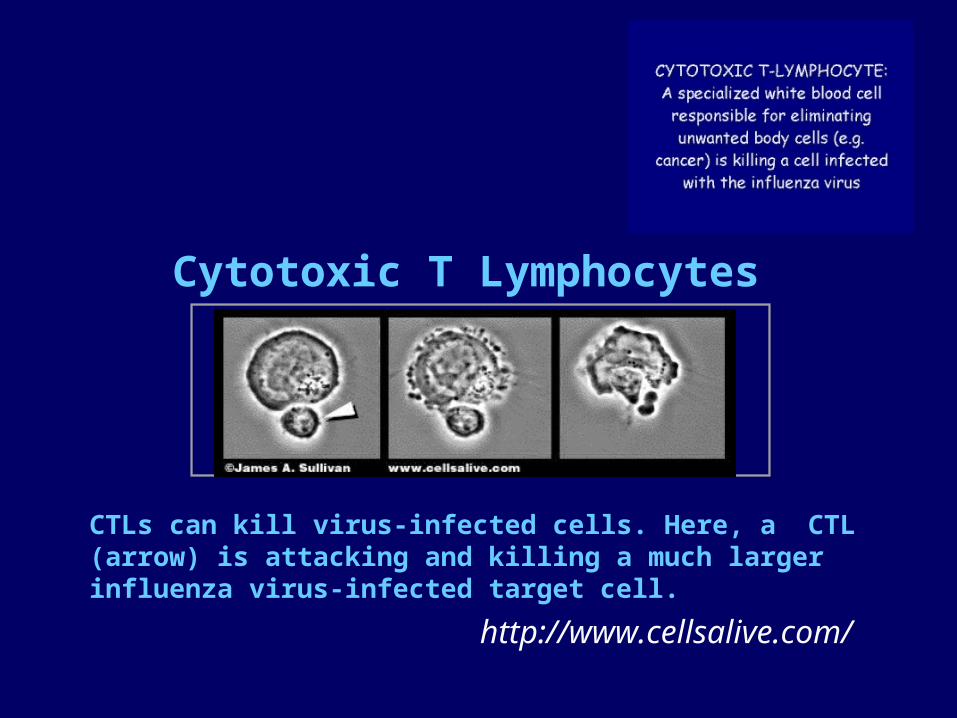
Models of CTL ResponseModels of CTL Response
dT/dt = dT/dt = – dT – kVT – dT – kVT
dT*/dt = kVT – dT*/dt = kVT – VVT* - T* - EEET*ET*
dV/dt = pT* - cVdV/dt = pT* - cV
dE/dt = kdE/dt = kEEET* - ET* - E CTL EffectorsE CTL Effectors
Nowak and Bangham, Nowak and Bangham, ScienceScience 272272, 74 1996, 74 1996
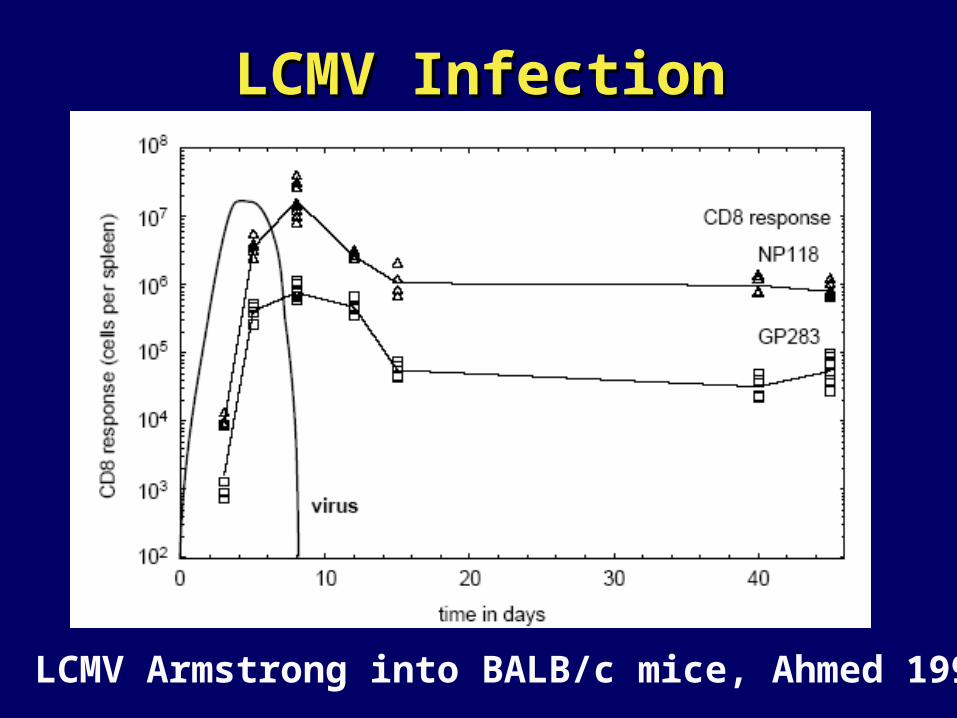
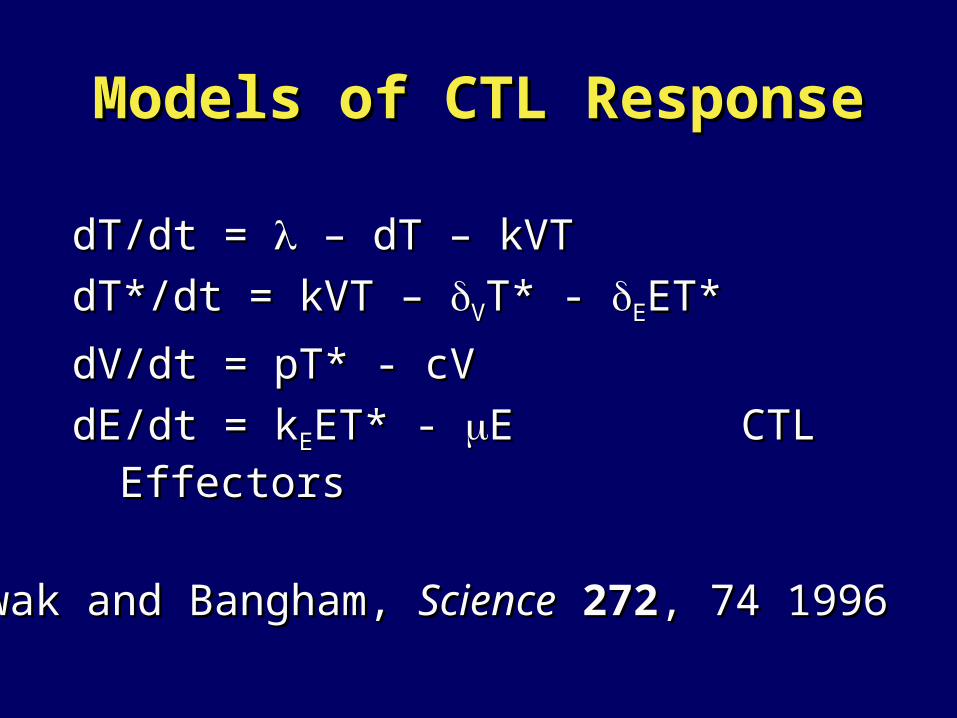
LCMV InfectionLCMV Infection
LCMV Armstrong into BALB/c mice, Ahmed 1998
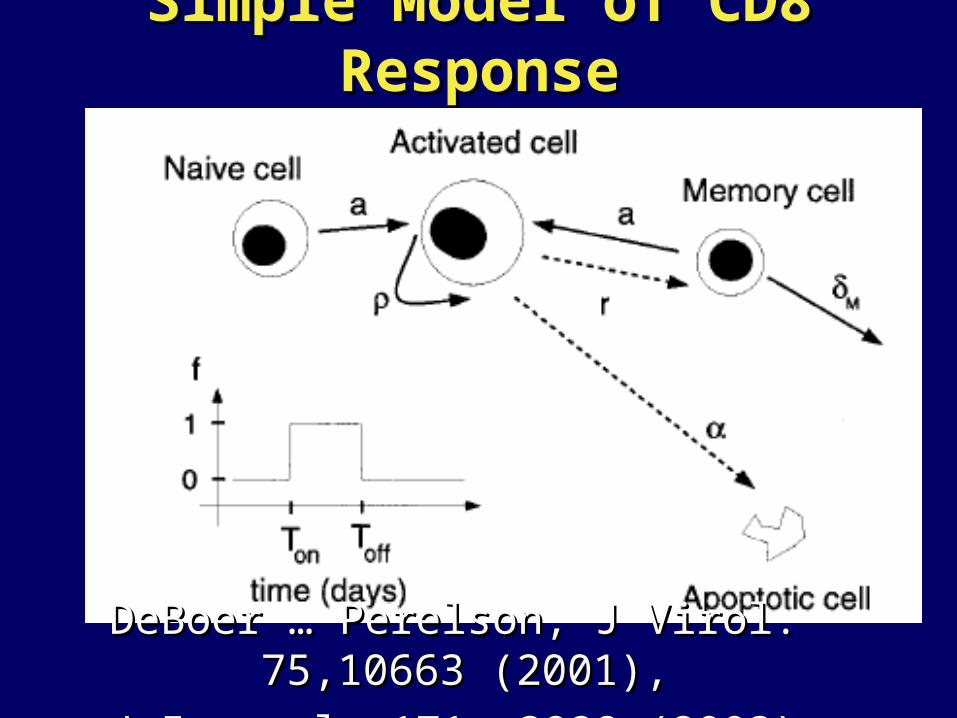
Simple Model of CD8 ResponseSimple Model of CD8 Response
DeBoer … Perelson, J Virol. 75,10663 (2001), DeBoer … Perelson, J Virol. 75,10663 (2001),
J Immunol. 171, 3928 (2003)J Immunol. 171, 3928 (2003)
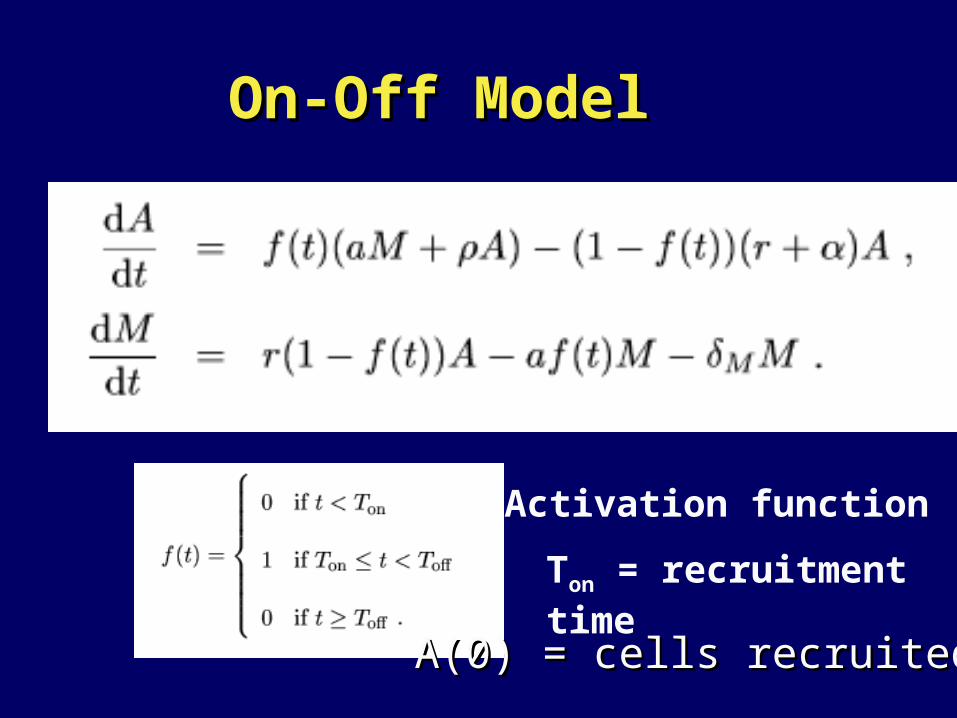
On-Off ModelOn-Off Model
Activation function
Ton = recruitment time
A(0) = cells recruitedA(0) = cells recruited
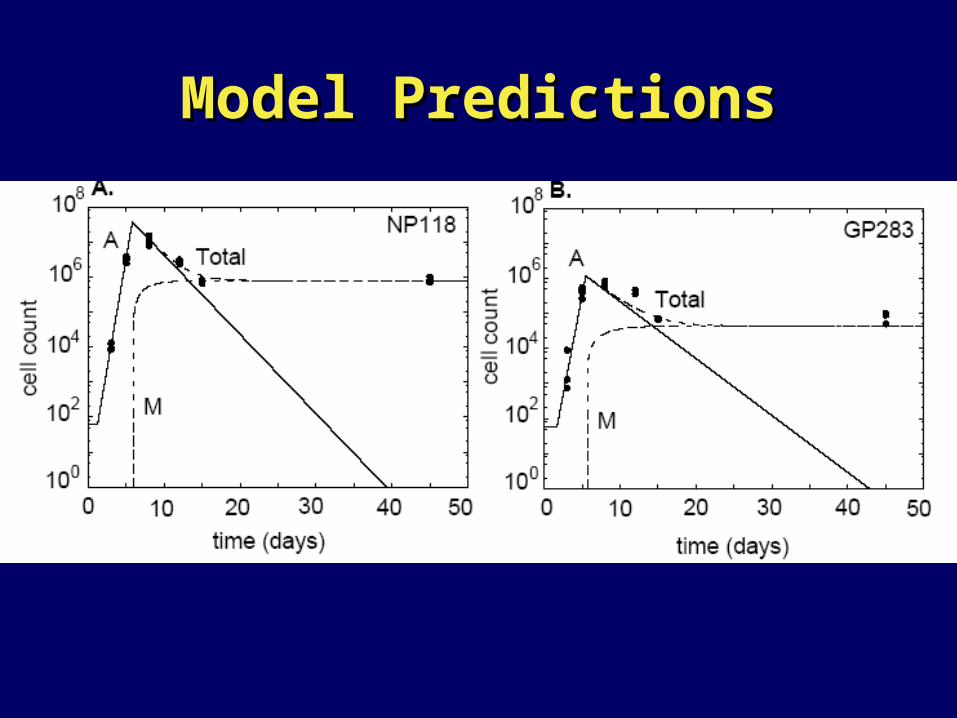
Model PredictionsModel Predictions
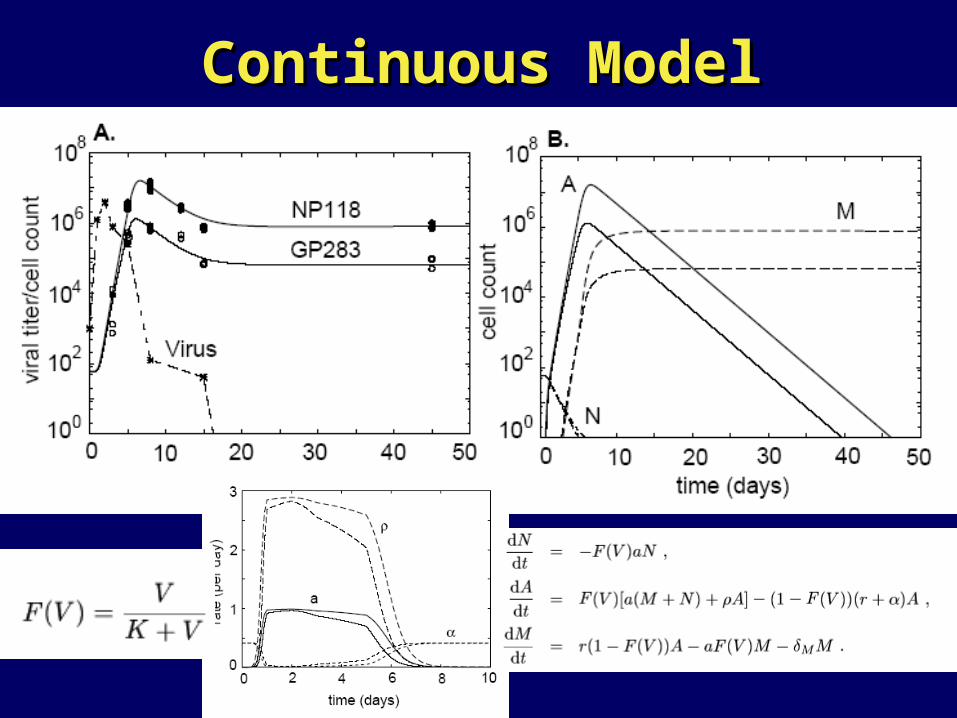
Continuous ModelContinuous Model
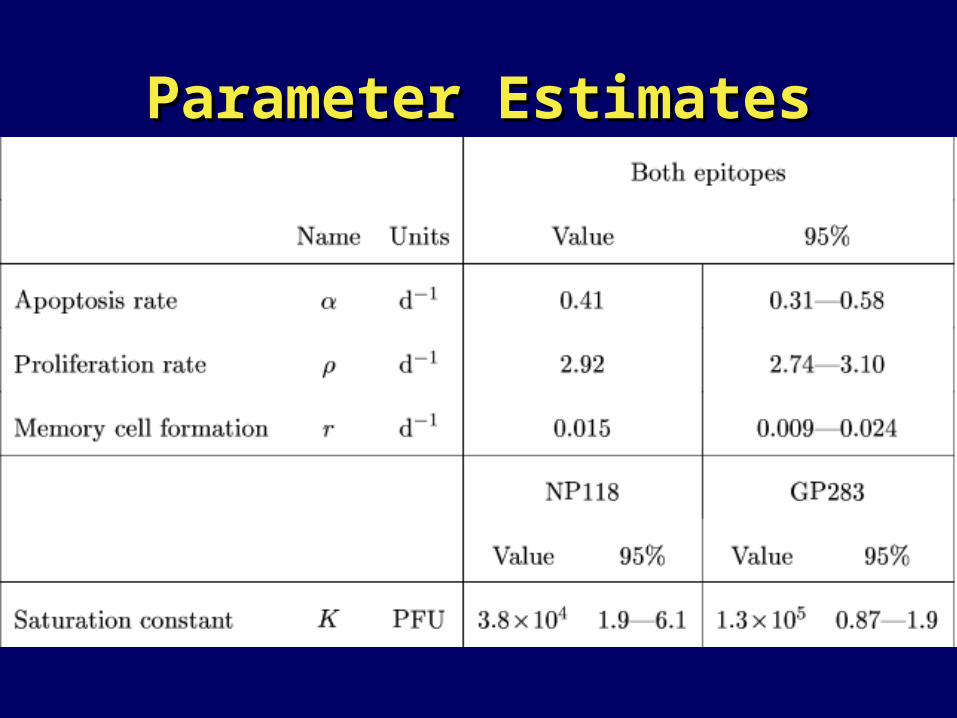
Parameter EstimatesParameter Estimates
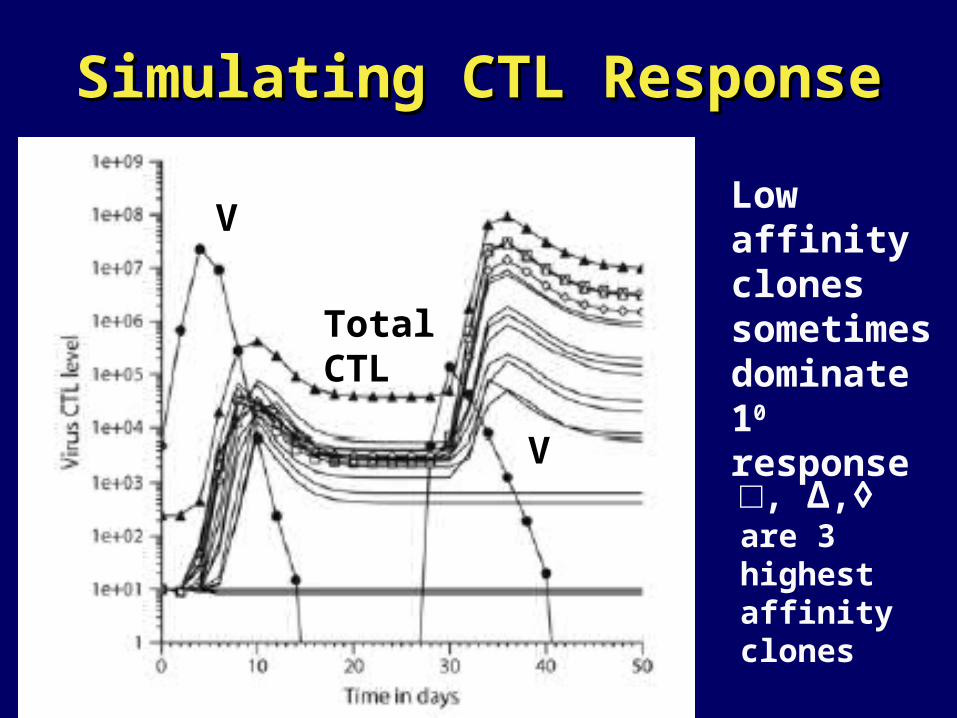
Simulating CTL ResponseSimulating CTL Response
V
TotalCTL
Low affinity clones sometimes dominate 10
response
V□, ∆,◊ are 3 highest affinity clones
Modeling the Kinetics of Modeling the Kinetics of Hepatitis B and C InfectionsHepatitis B and C Infections
Alan S. Perelson, Alan S. Perelson, PhDPhD
Theoretical Biology & BiophysicsTheoretical Biology & BiophysicsLos Alamos National LaboratoryLos Alamos National Laboratory
Los Alamos, NMLos Alamos, NM
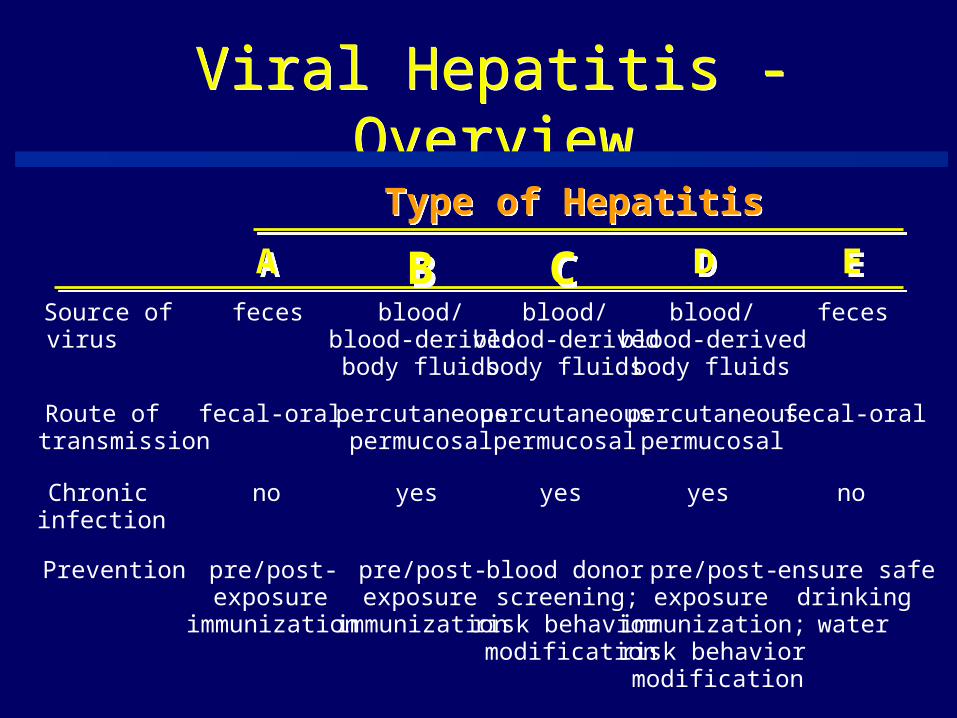
Viral Hepatitis - OverviewViral Hepatitis - Overview
AA BB CC DD EESource ofvirus
feces blood/blood-derived
body fluids
blood/blood-derived
body fluids
blood/blood-derived
body fluids
feces
Route oftransmission
fecal-oral percutaneouspermucosal
percutaneouspermucosal
percutaneouspermucosal
fecal-oral
Chronicinfection
no yes yes yes no
Prevention pre/post-exposure
immunization
pre/post-exposure
immunization
blood donorscreening;
risk behaviormodification
pre/post-exposure
immunization;risk behaviormodification
ensure safedrinkingwater
Type of HepatitisType of Hepatitis
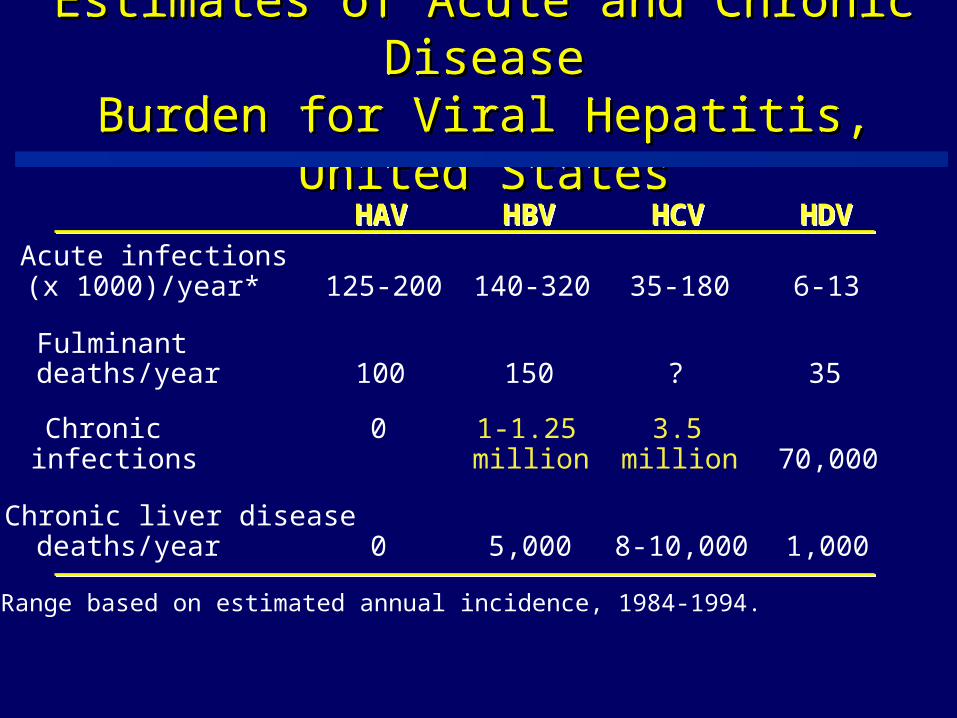
Estimates of Acute and Chronic Estimates of Acute and Chronic DiseaseDisease
Burden for Viral Hepatitis, United Burden for Viral Hepatitis, United StatesStates
Estimates of Acute and Chronic Estimates of Acute and Chronic DiseaseDisease
Burden for Viral Hepatitis, United Burden for Viral Hepatitis, United StatesStates
HAVHAV HBVHBV HCVHCV HDVHDV
Acute infections(x 1000)/year* 125-200 140-320 35-180 6-13
Fulminant deaths/year 100 150 ? 35
Chronicinfections
0 1-1.25 million
3.5million 70,000
Chronic liver disease deaths/year 0 5,000 8-10,000 1,000
* Range based on estimated annual incidence, 1984-1994.
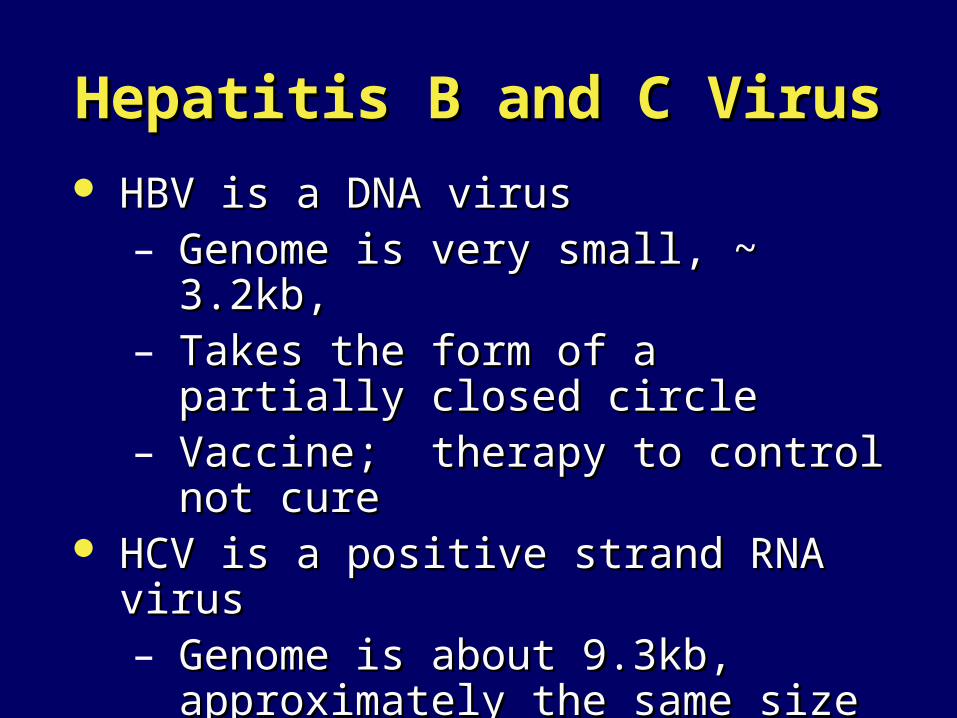
Hepatitis B and C VirusHepatitis B and C Virus HBV is a DNA virusHBV is a DNA virus
– Genome is very small, ~ 3.2kb,Genome is very small, ~ 3.2kb,– Takes the form of a partially closed Takes the form of a partially closed
circlecircle– Vaccine; therapy to control not cureVaccine; therapy to control not cure
HCV is a positive strand RNA virusHCV is a positive strand RNA virus– Genome is about 9.3kb, Genome is about 9.3kb,
approximately the same size as HIVapproximately the same size as HIV– No vaccine; therapy successful in No vaccine; therapy successful in
50% of people treated50% of people treated
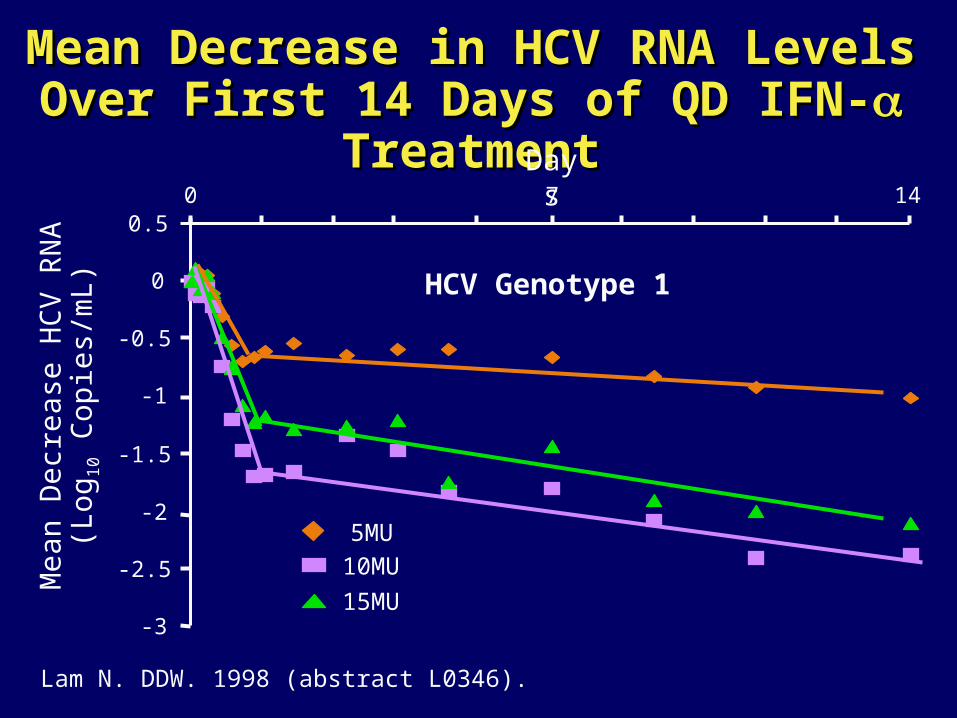
Mean Decrease in HCV RNA Levels Over Mean Decrease in HCV RNA Levels Over First 14 Days of QD IFN-First 14 Days of QD IFN- Treatment Treatment
Lam N. DDW. 1998 (abstract L0346).
Mea
n D
ecre
ase
HC
V R
NA
(Log
10 C
opie
s/m
L)
Days
-3
-2.5
-2
-1.5
-1
-0.5
0
0.50 7 14
5MU
10MU
15MU
HCV Genotype 1
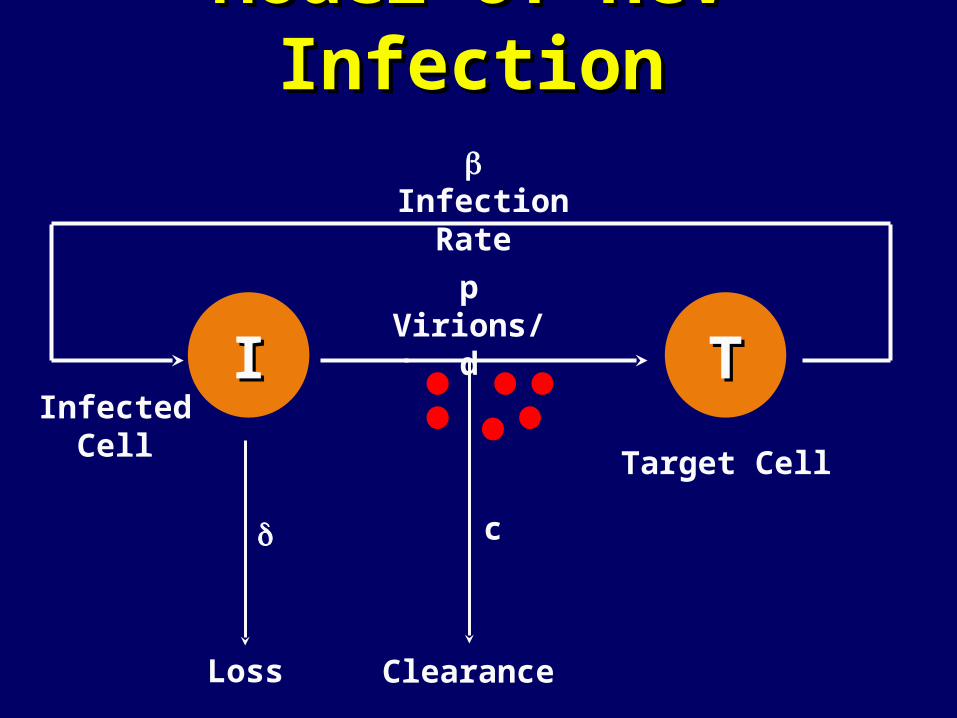
II TT
Infection Rate
c
Clearance
pVirions/d
Target Cell
InfectedCell
Loss
Model of HCV InfectionModel of HCV Infection
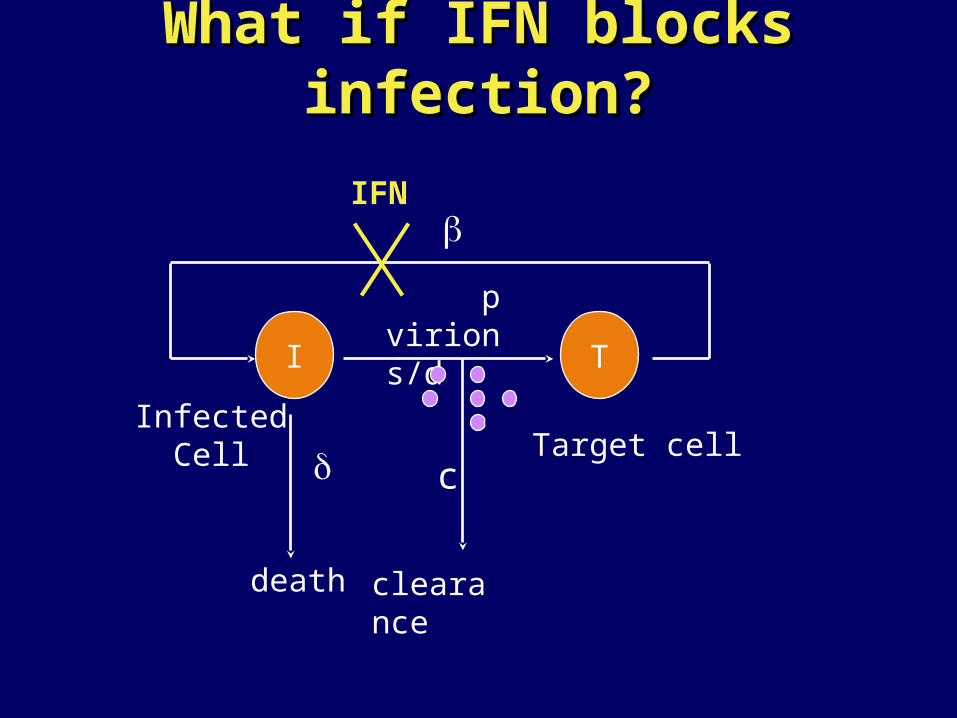
What if IFN blocks infection?What if IFN blocks infection?
I T
c
clearance
pvirions/d
Target cellInfected
Cell
death
IFN
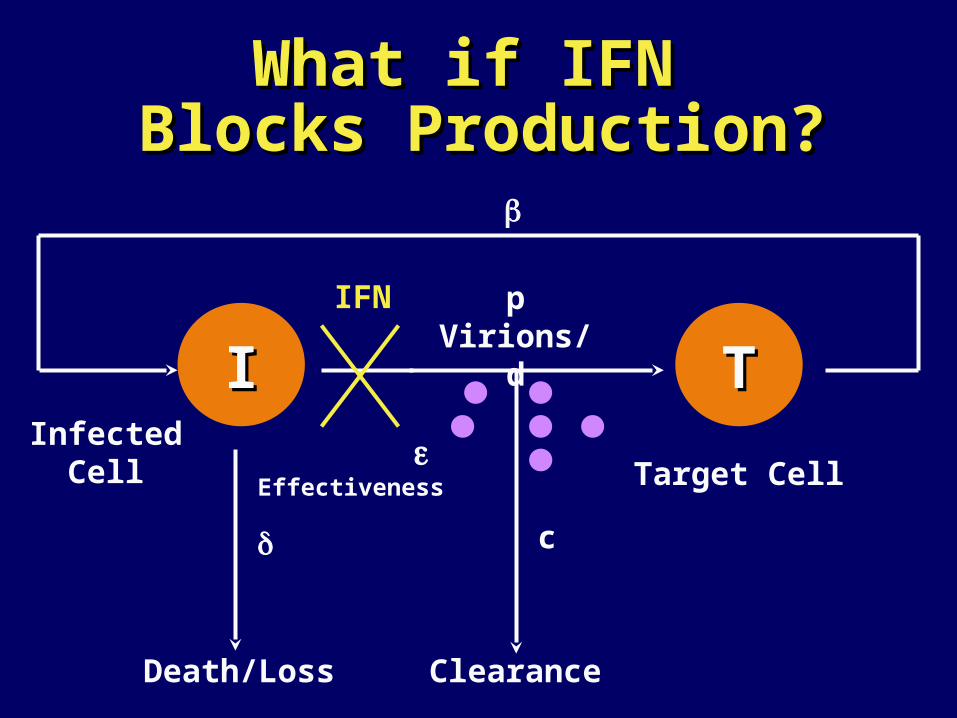
What if IFN What if IFN Blocks Production?Blocks Production?
II TT
Clearance
pVirions/d
Target CellInfected
Cell
Death/Loss
IFN
c
Effectiveness
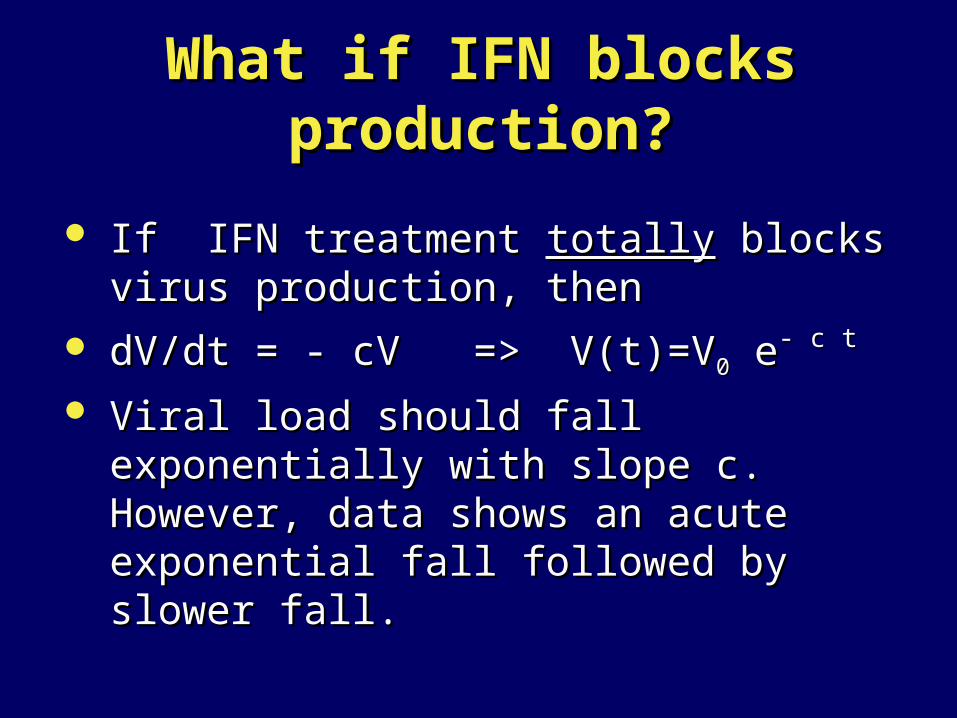
What if IFN blocks What if IFN blocks production?production?
If IFN treatment If IFN treatment totallytotally blocks virus blocks virus production, thenproduction, then
dV/dt = - cV => V(t)=VdV/dt = - cV => V(t)=V00 e e- c t- c t
Viral load should fall exponentially with Viral load should fall exponentially with slope c. However, data shows an acute slope c. However, data shows an acute exponential fall followed by slower fall.exponential fall followed by slower fall.
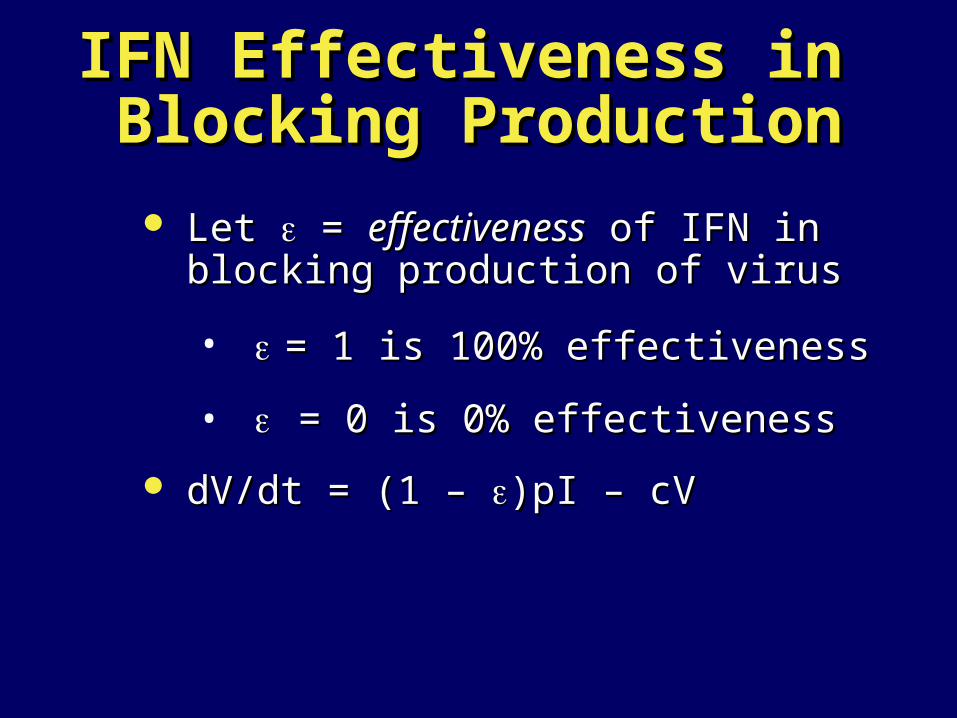
IFN Effectiveness in IFN Effectiveness in Blocking ProductionBlocking Production
Let Let = = effectivenesseffectiveness of IFN in of IFN in blocking production of virusblocking production of virus
• = 1 is 100% effectiveness= 1 is 100% effectiveness
• = 0 is 0% effectiveness= 0 is 0% effectiveness
dV/dt = (1 – dV/dt = (1 – )pI – cV)pI – cV
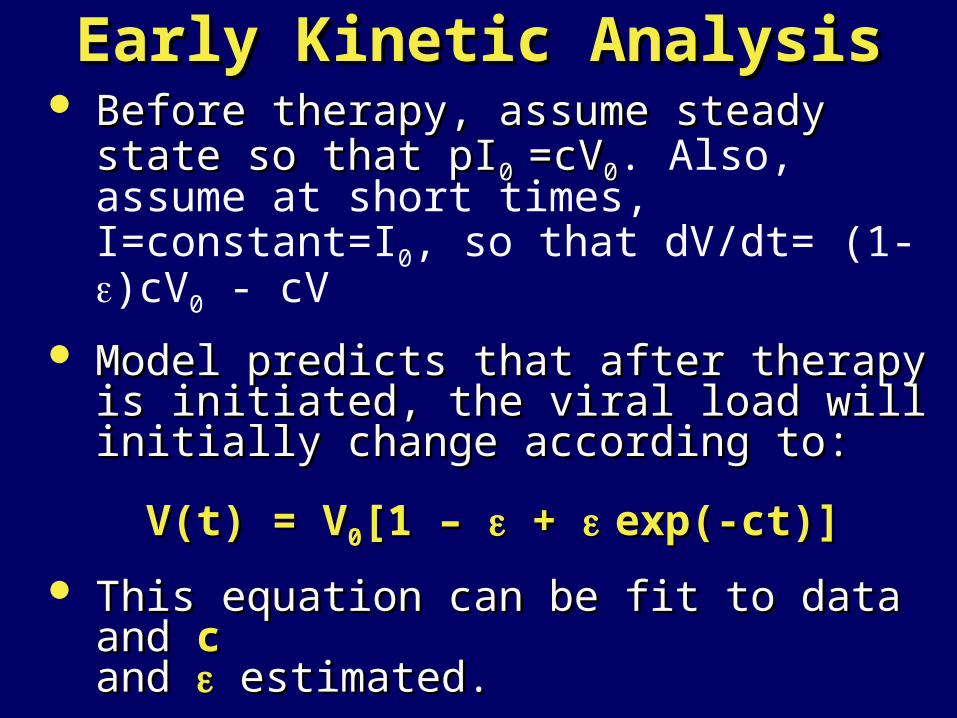
Early Kinetic AnalysisEarly Kinetic Analysis Before therapy, assume steady state so that Before therapy, assume steady state so that
pIpI0 0 =cV=cV00. Also, assume at short times, I=constant=I0, so that dV/dt= (1-)cV0 - cV
Model predicts that after therapy is initiated, Model predicts that after therapy is initiated, the viral load will initially change according the viral load will initially change according to:to:
V(t) = VV(t) = V00[1 – [1 – + + exp(-ct)]exp(-ct)]
This equation can be fit to data and This equation can be fit to data and cc and and estimated. estimated.
Thus drug effectiveness can be determined Thus drug effectiveness can be determined within the first few days!within the first few days!
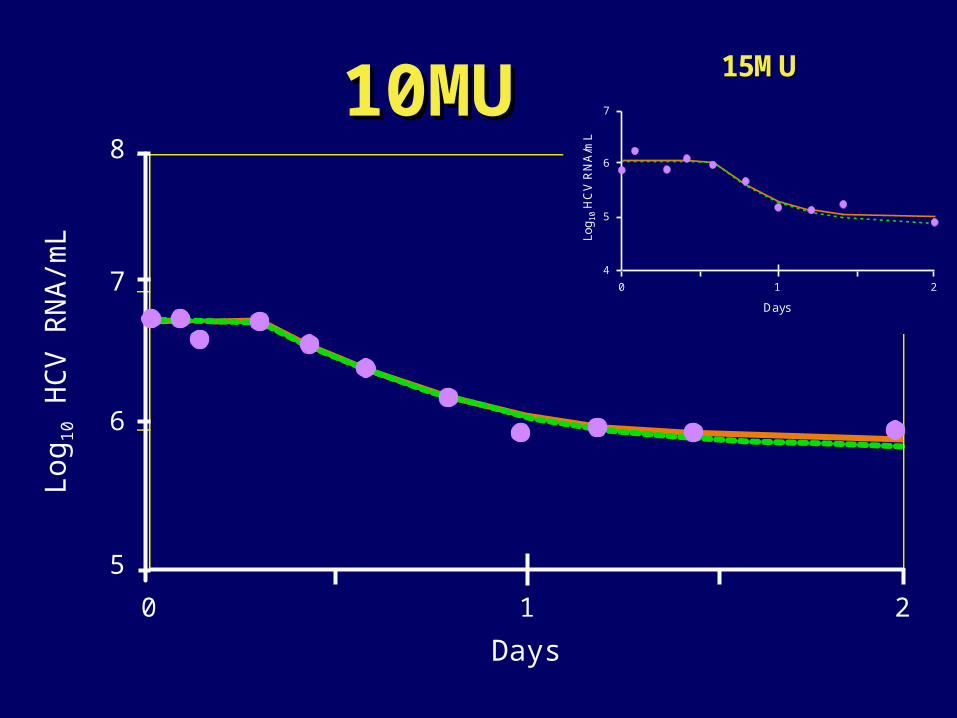
10MU10MU
0 1 2
Log 1
0 H
CV
RN
A/m
L
Days
8
7
6
5Lo
g10
HC
V R
NA
/mL
Days
0 1 2
7
6
5
4
15MU15MU
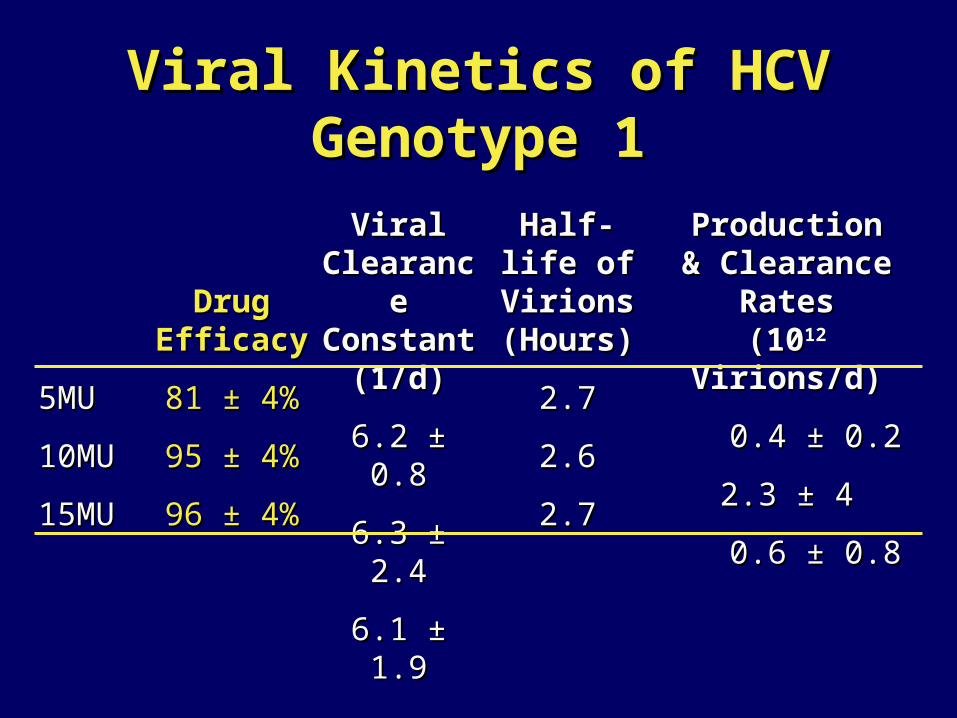
Viral Kinetics of HCV Genotype 1Viral Kinetics of HCV Genotype 1
5MU5MU
10MU10MU
15MU15MU
Drug Drug EfficacyEfficacy
81 ± 4%81 ± 4%
95 ± 4%95 ± 4%
96 ± 4%96 ± 4%
Viral Viral Clearance Clearance Constant Constant
(1/d)(1/d)
6.2 ± 0.86.2 ± 0.8
6.3 ± 2.46.3 ± 2.4
6.1 ± 1.96.1 ± 1.9
Half-life Half-life ofof
VirionsVirions(Hours)(Hours)
2.72.7
2.62.6
2.72.7
ProductionProduction& Clearance & Clearance
RatesRates(10(101212 Virions/d) Virions/d)
0.4 ± 0.20.4 ± 0.2
2.3 ± 42.3 ± 4
0.6 ± 0.80.6 ± 0.8
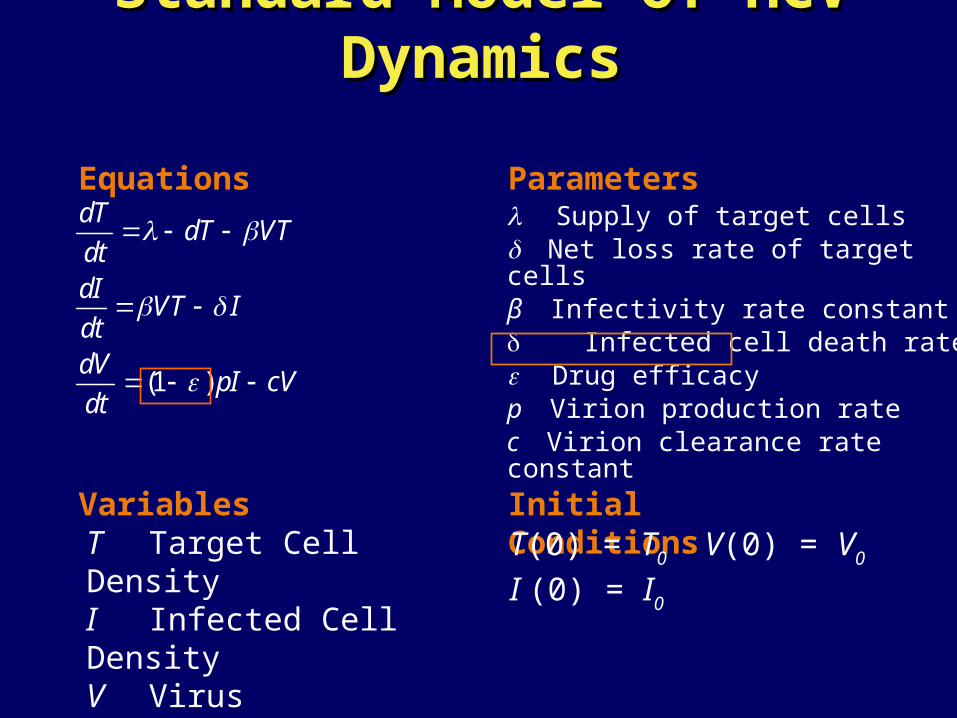
Standard Model of HCV DynamicsStandard Model of HCV Dynamics
T Target Cell DensityI Infected Cell DensityV Virus Concentration
Equations Supply of target cells Net loss rate of target cellsβ Infectivity rate constant Infected cell death rate Drug efficacyp Virion production rate c Virion clearance rate constant
Initial ConditionsT(0) = T0
I (0) = I0
V(0) = V0
Variables
Parameters
(1 )
dTdT VT
dtdI
VT IdtdV
pI cVdt
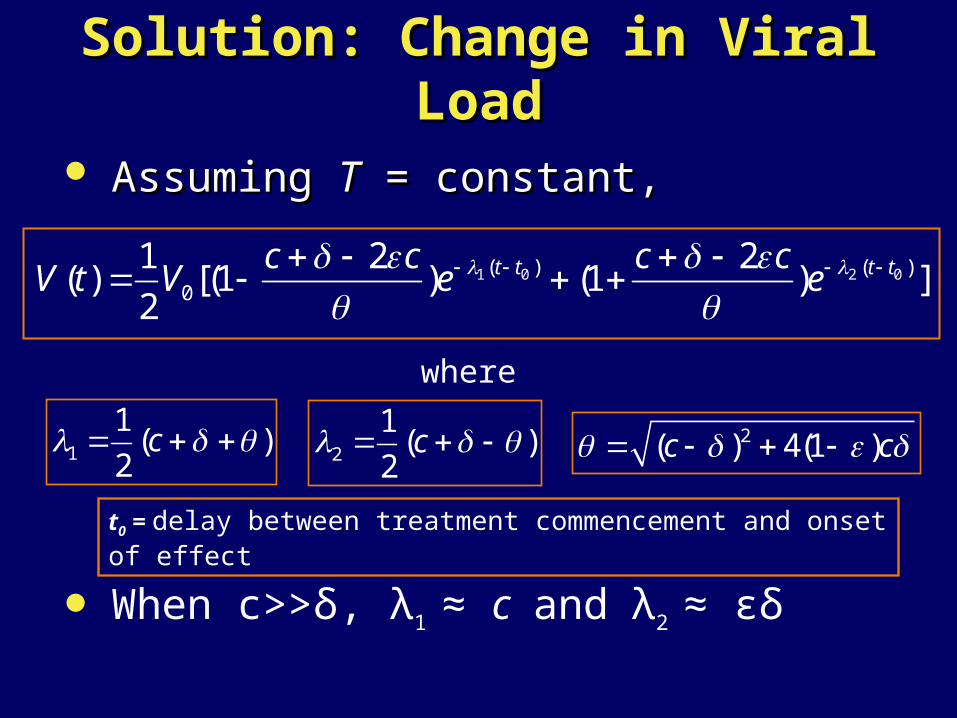
Solution: Change in Viral LoadSolution: Change in Viral Load Assuming Assuming TT = constant, = constant,
When c>>δ, λ1 ≈ c and λ2 ≈ εδ
where
1
1( )
2c 2
1( )
2c 2( ) 4(1 )c c
1 0 2 0( ) ( )0
1 2 2( ) [(1 ) (1 ) ]
2t t t tc c c c
V t V e e
t0 = delay between treatment commencement and onset of effect

10MU10MU
Days
Log 1
0 H
CV
RN
A/m
L
0 7 14
8
7
6
5
4
15MU15MU
Days
Log
10H
CV
RN
A/m
L
0 7 14
7
6
5
4
3
Current Therapy:Current Therapy:
Peg-IFN Peg-IFN 2b + RBV2b + RBV
Major Point: Drug Pharmacokinetics Matters!
Peg-IFN given once a week
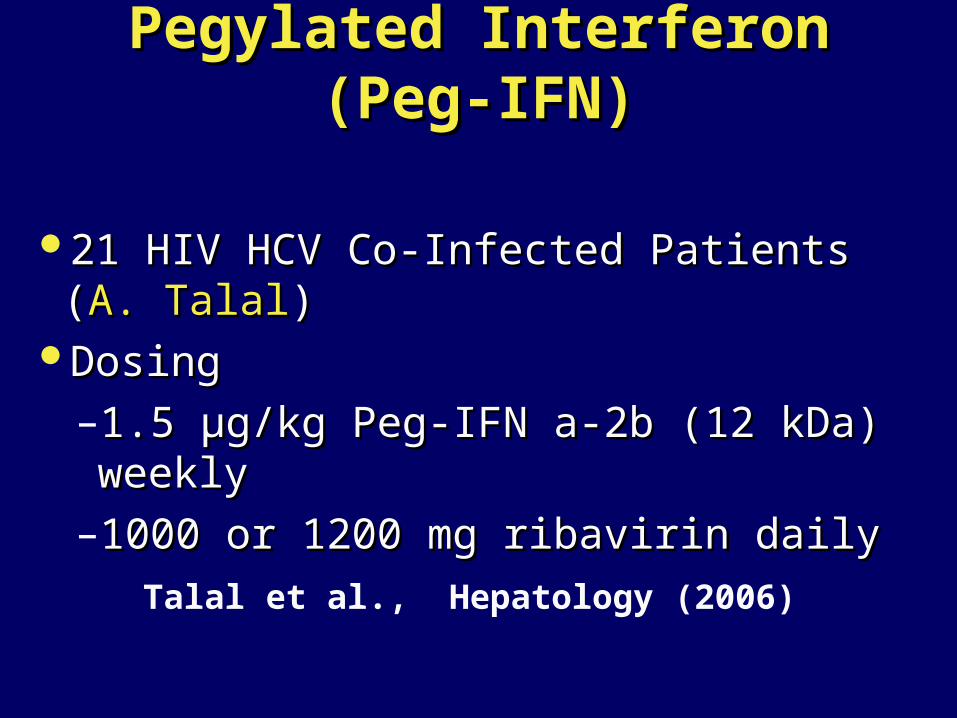
Pegylated Interferon (Peg-IFN)Pegylated Interferon (Peg-IFN)
21 HIV HCV Co-Infected Patients (21 HIV HCV Co-Infected Patients (A. TalalA. Talal))DosingDosing
–1.5 μg/kg Peg-IFN a-2b (12 kDa) weekly1.5 μg/kg Peg-IFN a-2b (12 kDa) weekly
–1000 or 1200 mg ribavirin daily1000 or 1200 mg ribavirin daily
Talal et al., Hepatology (2006)
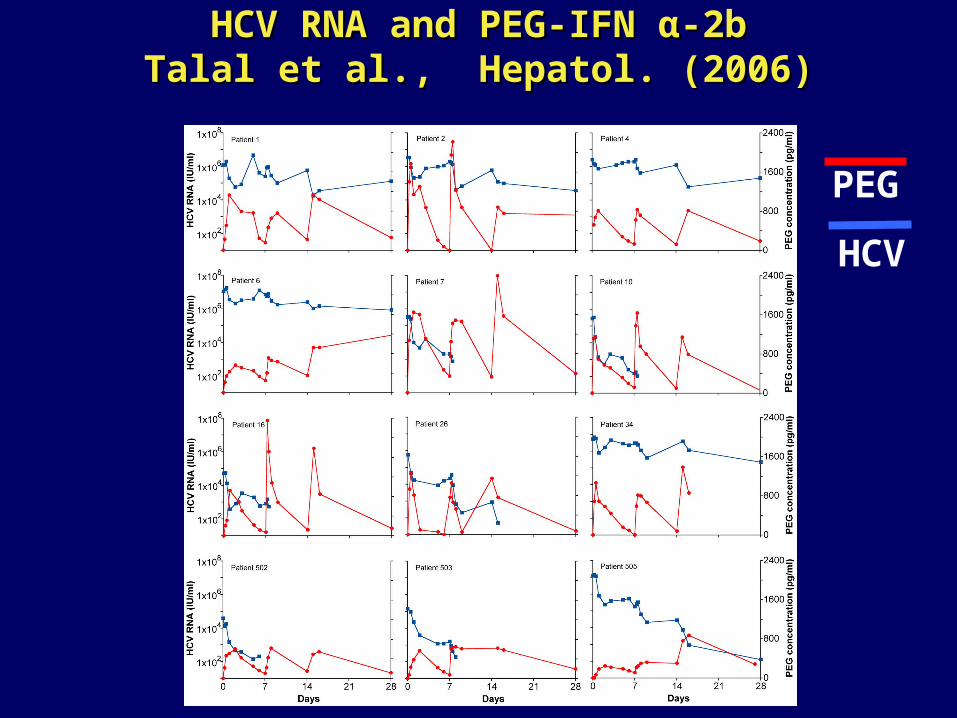
HCV RNA and PEG-IFN HCV RNA and PEG-IFN αα-2b-2bTalal et al., Hepatol. (2006)Talal et al., Hepatol. (2006)
PEG
HCV
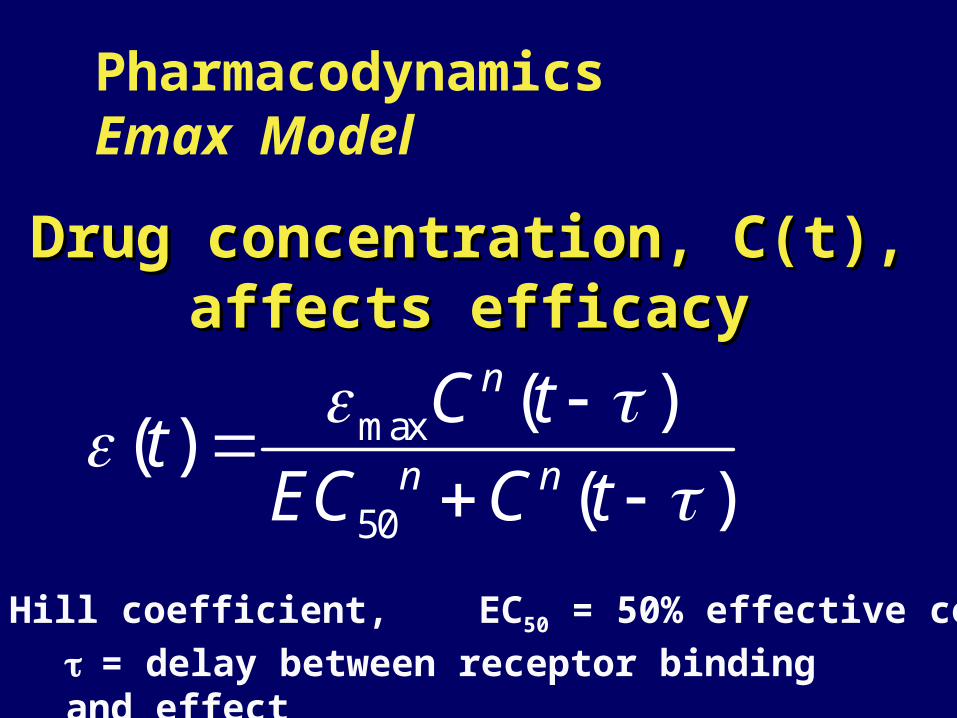
Drug concentration, C(t), Drug concentration, C(t), affects efficacyaffects efficacy
max
50
( )( )
( )
n
n n
C tt
EC C t
n = Hill coefficient, EC50 = 50% effective conc.
PharmacodynamicsEmax Model
= delay between receptor binding and effect
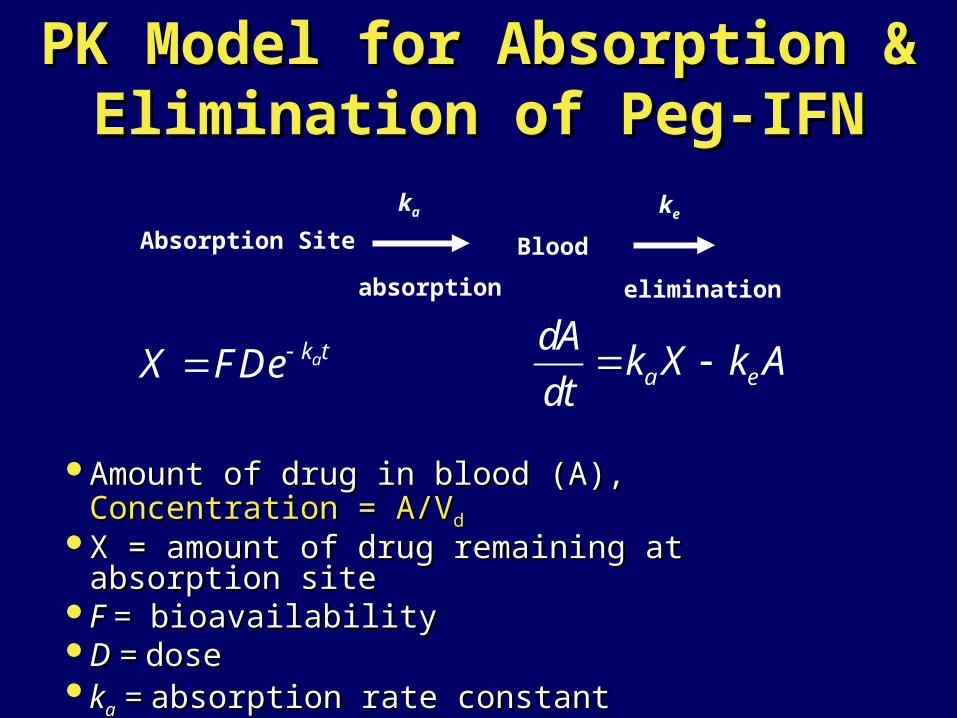
PK Model for Absorption & PK Model for Absorption & Elimination of Peg-IFNElimination of Peg-IFN
Amount of drug in blood (A), Amount of drug in blood (A), Concentration = A/VConcentration = A/VddX = amount of drug remaining at absorption siteX = amount of drug remaining at absorption siteF =F = bioavailability bioavailabilityD = D = dosedosekkaa = = absorption rate constantabsorption rate constantkke e == elimination rate constant elimination rate constant
a e
dAk X k A
dt ak tX FDe
Absorption Site Blood
ka ke
eliminationabsorption
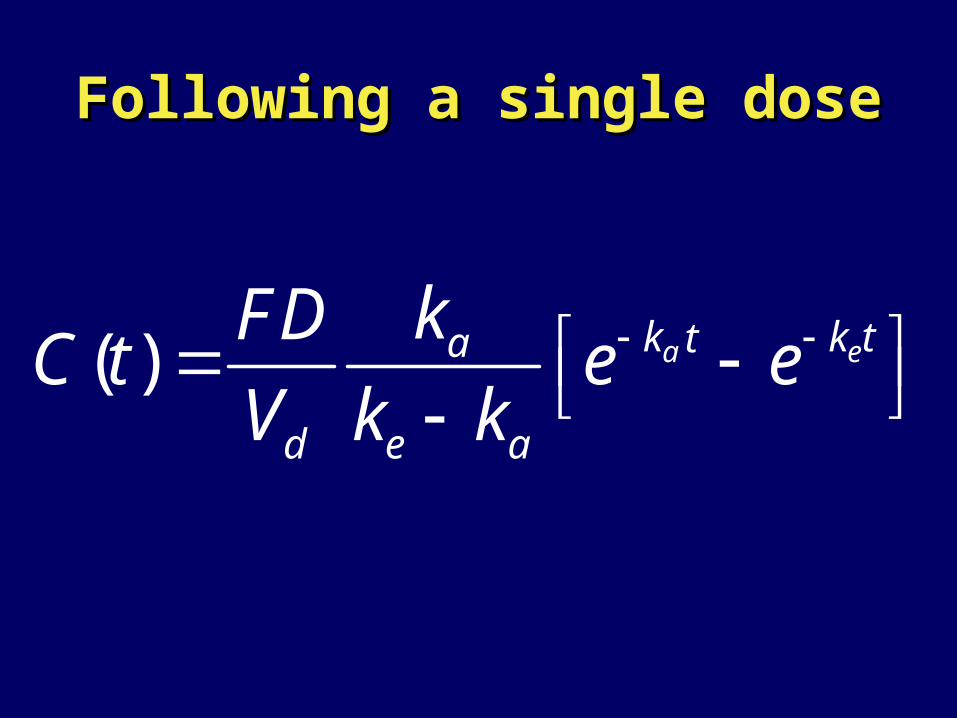
Following a single doseFollowing a single dose
( ) a ek k tta
d e a
kFDC t e e
V k k
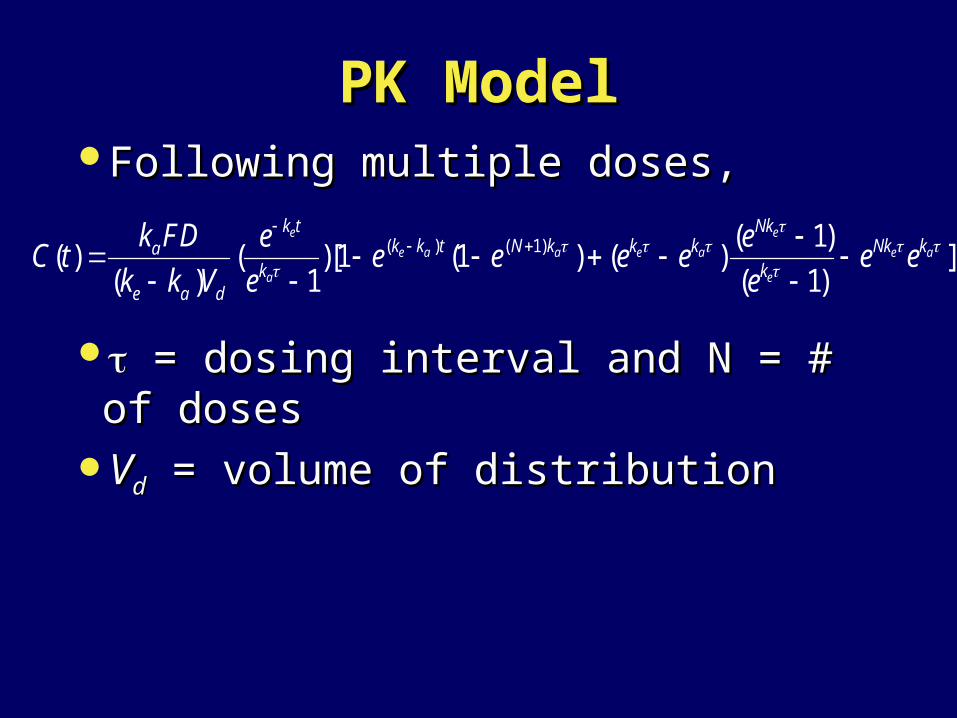
Following multiple doses, Following multiple doses,
= dosing interval and N = # of doses= dosing interval and N = # of dosesVVdd = volume of distribution = volume of distribution
PK ModelPK Model
( ) ( 1) ( 1)( ) ( )[1 (1 ) ( ) ]
( ) 1 ( 1)
e e
e a a e a e a
a e
k t Nkk k t N k k k Nk ka
k ke a d
k FD e eC t e e e e e e
k k V e e
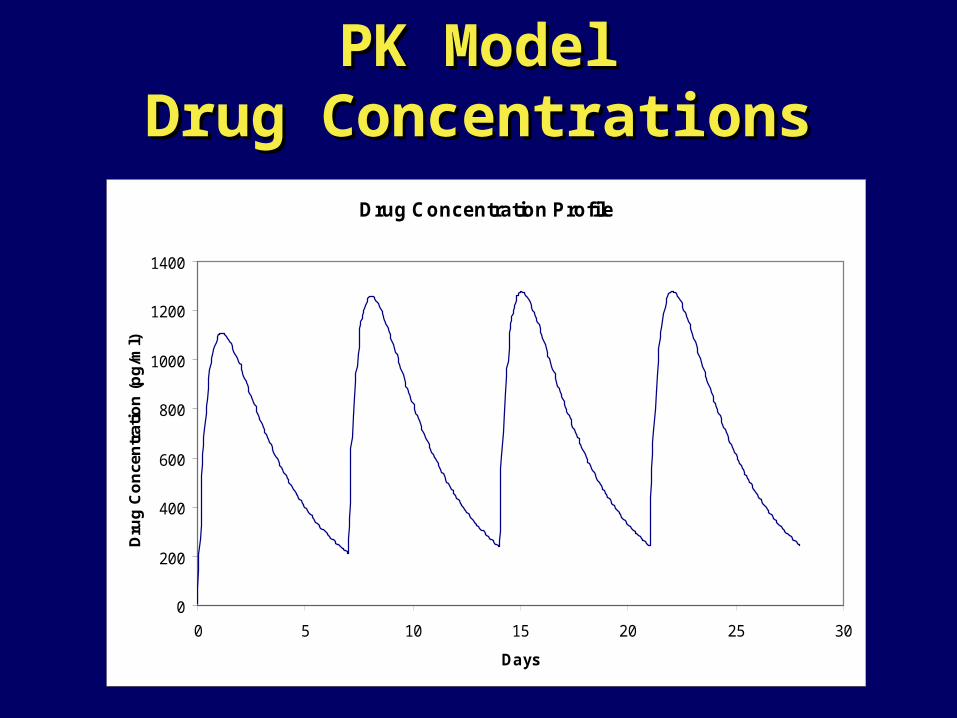
PK ModelPK ModelDrug ConcentrationsDrug Concentrations
Drug Concentration Profile
0
200
400
600
800
1000
1200
1400
0 5 10 15 20 25 30
Days
Dru
g C
on
cen
trat
ion
(p
g/m
l)
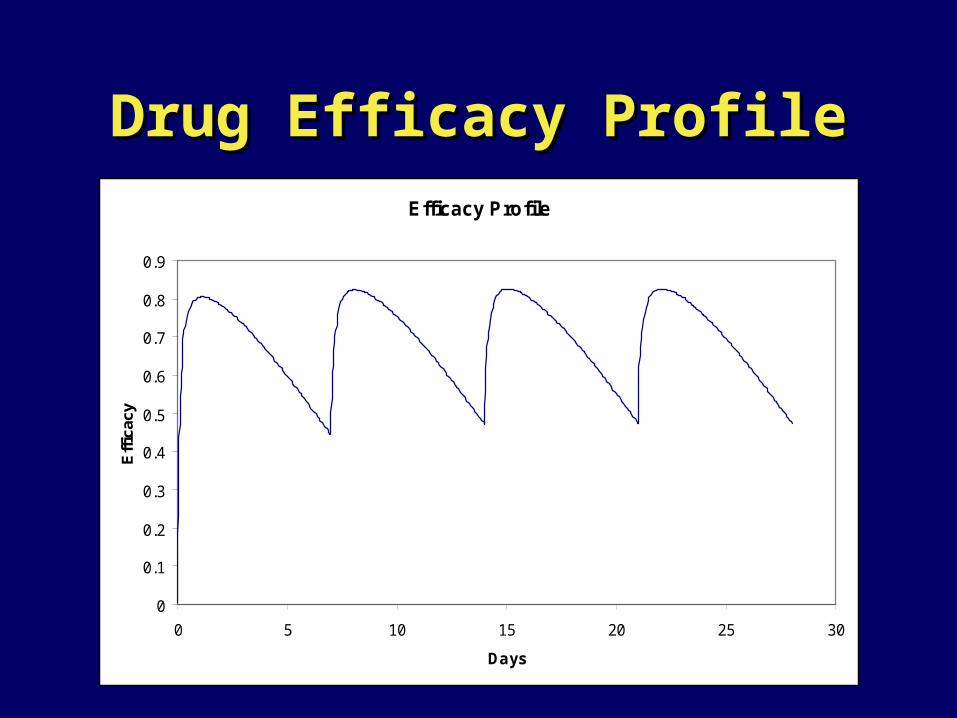
Efficacy Profile
0
0.1
0.2
0.3
0.4
0.5
0.6
0.7
0.8
0.9
0 5 10 15 20 25 30
Days
Eff
icac
yDrug Efficacy ProfileDrug Efficacy Profile
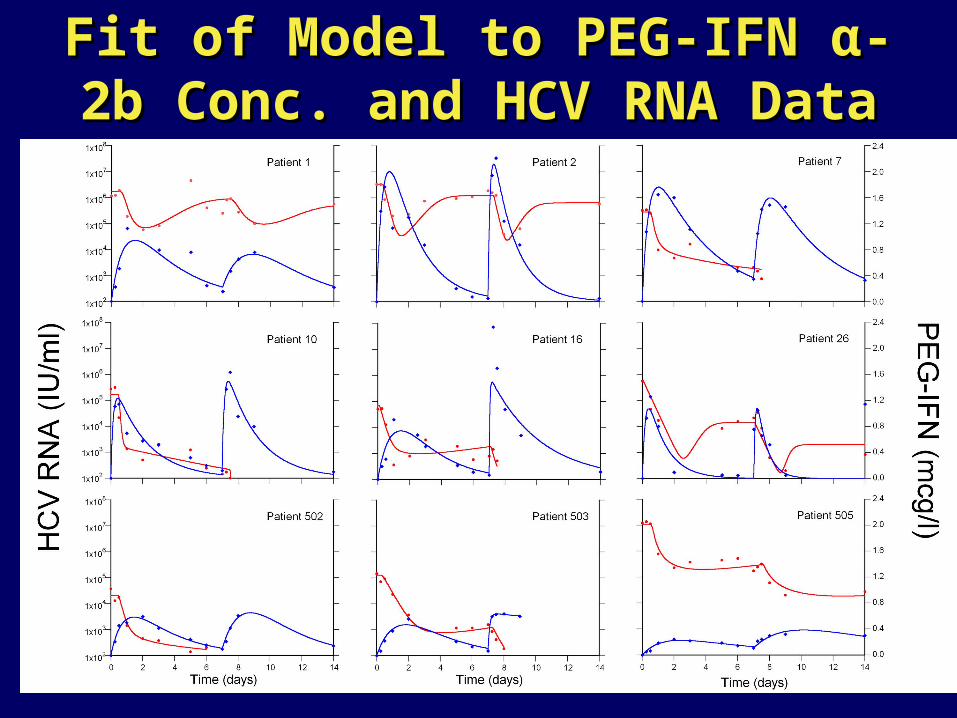
Fit of Model to PEG-IFN Fit of Model to PEG-IFN αα-2b -2b Conc. and HCV RNA DataConc. and HCV RNA Data
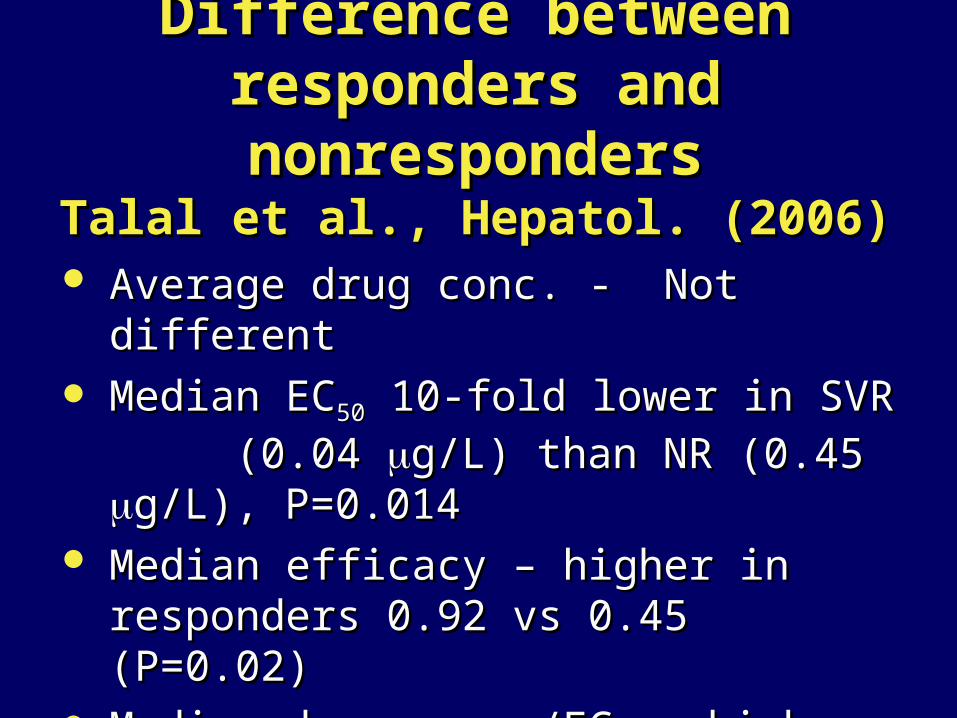
Difference between responders Difference between responders and nonrespondersand nonresponders
Talal et al., Hepatol. (2006)Talal et al., Hepatol. (2006) Average drug conc. - Not differentAverage drug conc. - Not different Median ECMedian EC5050 10-fold lower in SVR 10-fold lower in SVR
(0.04 (0.04 g/L) than NR (0.45 g/L) than NR (0.45 g/L), P=0.014g/L), P=0.014 Median efficacy – higher in responders Median efficacy – higher in responders
0.92 vs 0.45 (P=0.02)0.92 vs 0.45 (P=0.02) Median drug conc./ECMedian drug conc./EC50 50 – higher in – higher in
responders 10.1 vs 1.0 (P=0.012)responders 10.1 vs 1.0 (P=0.012)
ConclusionsConclusions HCV kinetic models can be used to HCV kinetic models can be used to
quantitatively estimate the effectiveness quantitatively estimate the effectiveness of different drug regimes, and help of different drug regimes, and help establish appropriating dosing.establish appropriating dosing.
They can give quantitative insights into They can give quantitative insights into biology of viral infection – rates of virion biology of viral infection – rates of virion production, clearance, cell loss, etc.production, clearance, cell loss, etc.
When using peg-IFN When using peg-IFN 2b drug 2b drug effectiveness can change during the effectiveness can change during the dosing interval and models need to be dosing interval and models need to be modified to take this into consideration.modified to take this into consideration.
Viral dynamics and immune Viral dynamics and immune responses in acute hepatitis responses in acute hepatitis
B infectionB infection
Stanca M. Ciupe, Ruy M. Ribeiro, Stanca M. Ciupe, Ruy M. Ribeiro, Patrick W. Nelson, Alan S. PerelsonPatrick W. Nelson, Alan S. Perelson
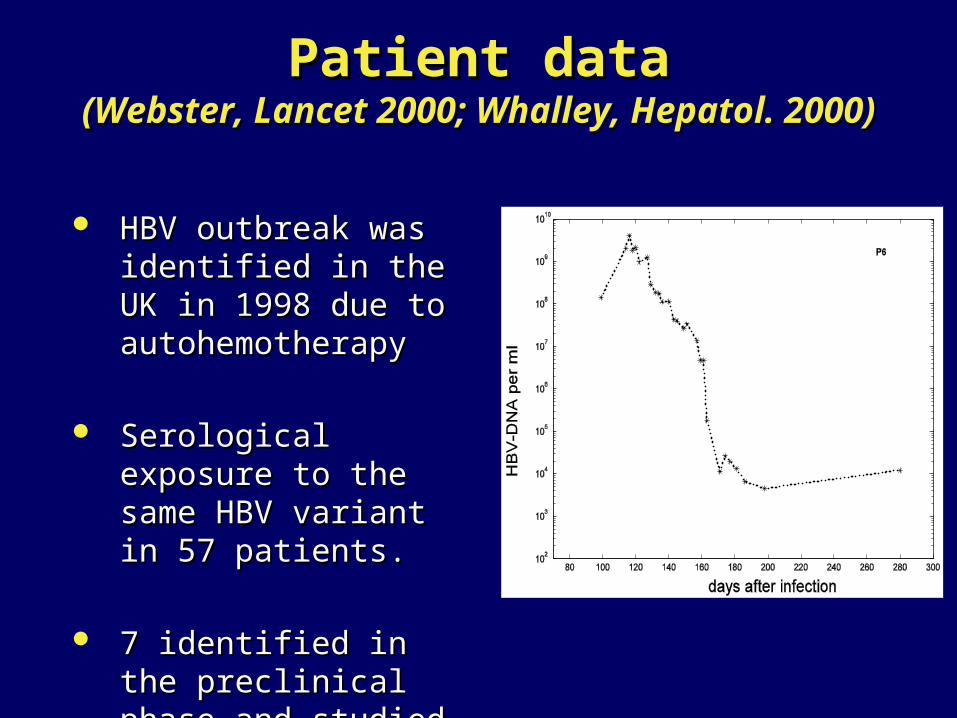
Patient dataPatient data(Webster, Lancet 2000; Whalley, Hepatol. 2000)(Webster, Lancet 2000; Whalley, Hepatol. 2000)
HBV outbreak was HBV outbreak was identified in the UK in identified in the UK in 1998 due to 1998 due to autohemotherapyautohemotherapy
Serological exposure to Serological exposure to the same HBV variant in the same HBV variant in 57 patients.57 patients.
7 identified in the 7 identified in the preclinical phase and preclinical phase and studied here.studied here.
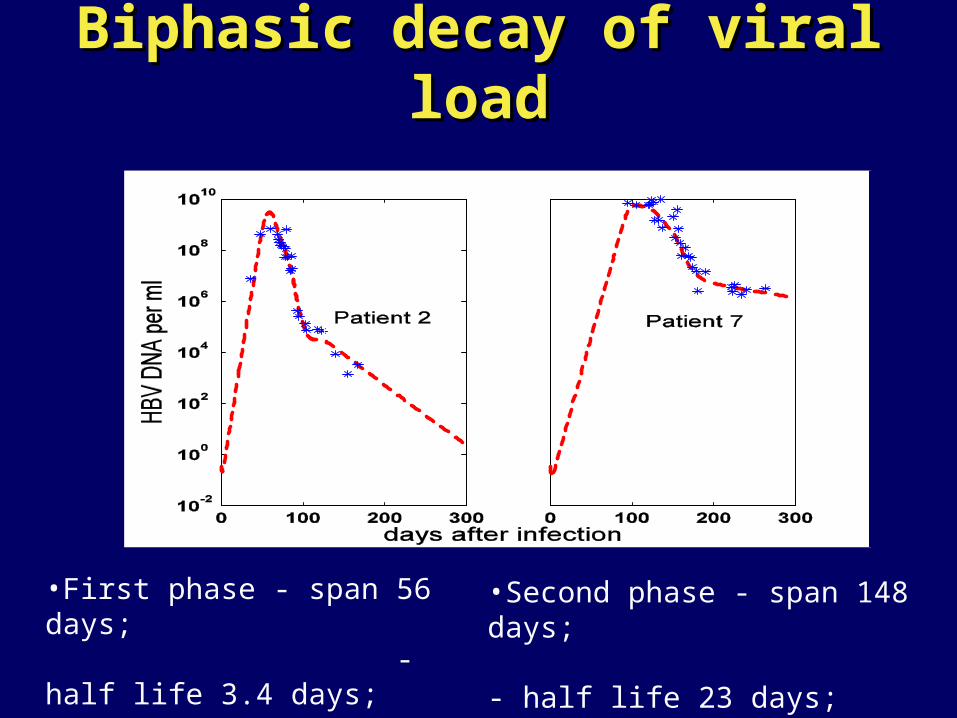
Biphasic decay of viral loadBiphasic decay of viral load
•First phase - span 56 days; - half life 3.4 days;
•Second phase - span 148 days; - half life 23 days;
ModelsModelsA number of models of HBV infection exist:A number of models of HBV infection exist:
Nowak & Thomas, PNAS 1996; Tsiang et Nowak & Thomas, PNAS 1996; Tsiang et al Hepatol., 1999; Levin et al Hepatol. al Hepatol., 1999; Levin et al Hepatol. 2001; Murray & Chisari, PNAS 2005.2001; Murray & Chisari, PNAS 2005.
With exception of Murray & Chisari (2005) With exception of Murray & Chisari (2005) they were developed to analyze drug they were developed to analyze drug therapy and are missing a number of therapy and are missing a number of key features of HBV infection that are key features of HBV infection that are important during acute infection.important during acute infection.
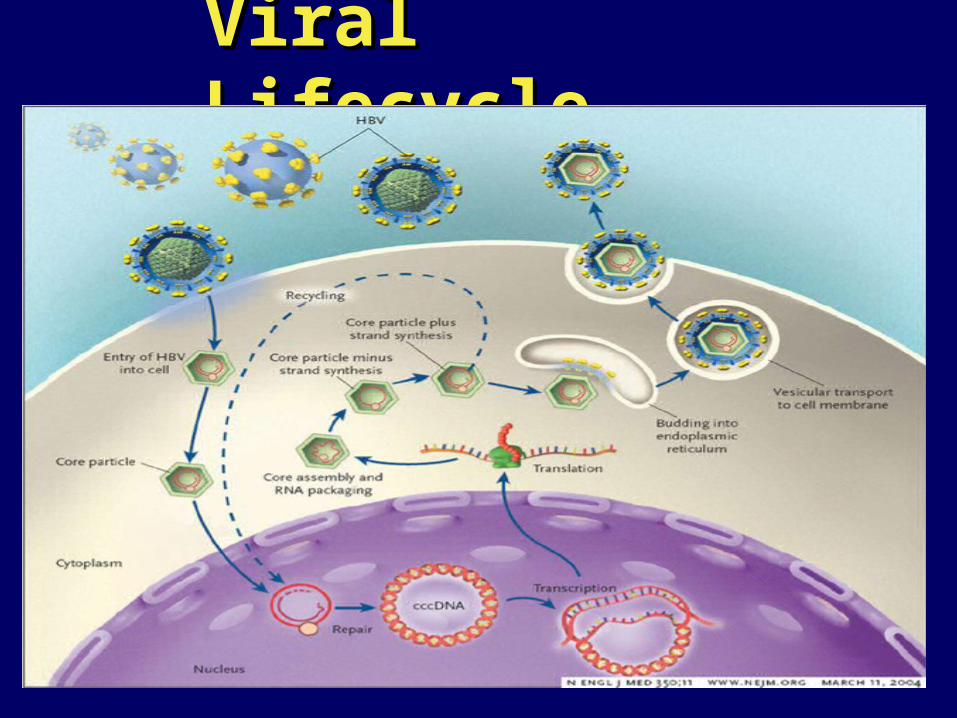
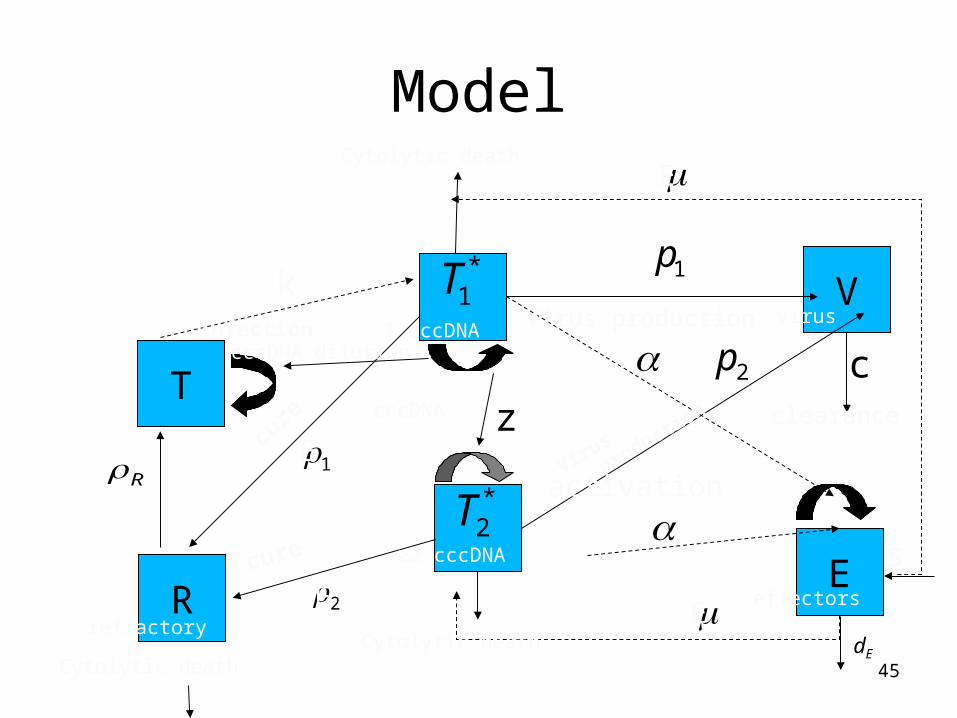
Viral LifecycleViral Lifecycle
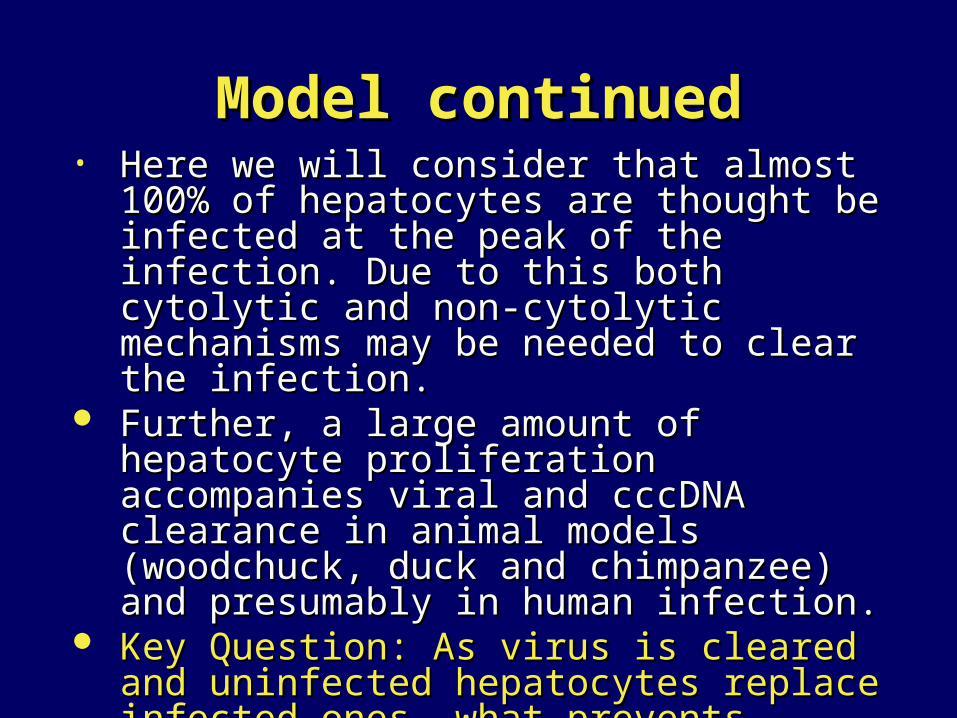
Model continuedModel continued• Here we will consider that almost 100% of Here we will consider that almost 100% of
hepatocytes are thought be infected at the hepatocytes are thought be infected at the peak of the infection. Due to this both cytolytic peak of the infection. Due to this both cytolytic and non-cytolytic mechanisms may be and non-cytolytic mechanisms may be needed to clear the infection.needed to clear the infection.
Further, a large amount of hepatocyte Further, a large amount of hepatocyte proliferation accompanies viral and cccDNA proliferation accompanies viral and cccDNA clearance in animal models (woodchuck, duck clearance in animal models (woodchuck, duck and chimpanzee) and presumably in human and chimpanzee) and presumably in human infection.infection.
Key Question: As virus is cleared and Key Question: As virus is cleared and uninfected hepatocytes replace infected ones, uninfected hepatocytes replace infected ones, what prevents infection of these newly what prevents infection of these newly generated hepatocytes?generated hepatocytes?
45
T
V
E
T1*
T2*
c
1z
Model
Ed
2p
1pk
2s
R
R
infection Virus production
clearance
effectors
virus
refractoryCytolytic death
Cytolytic death
Virus
producti
on
cure
cure
E
E
E
E
activation
≥2 cccDNA
1 cccDNA
cccDNA
Cytolytic death
cccDNA dilution
46
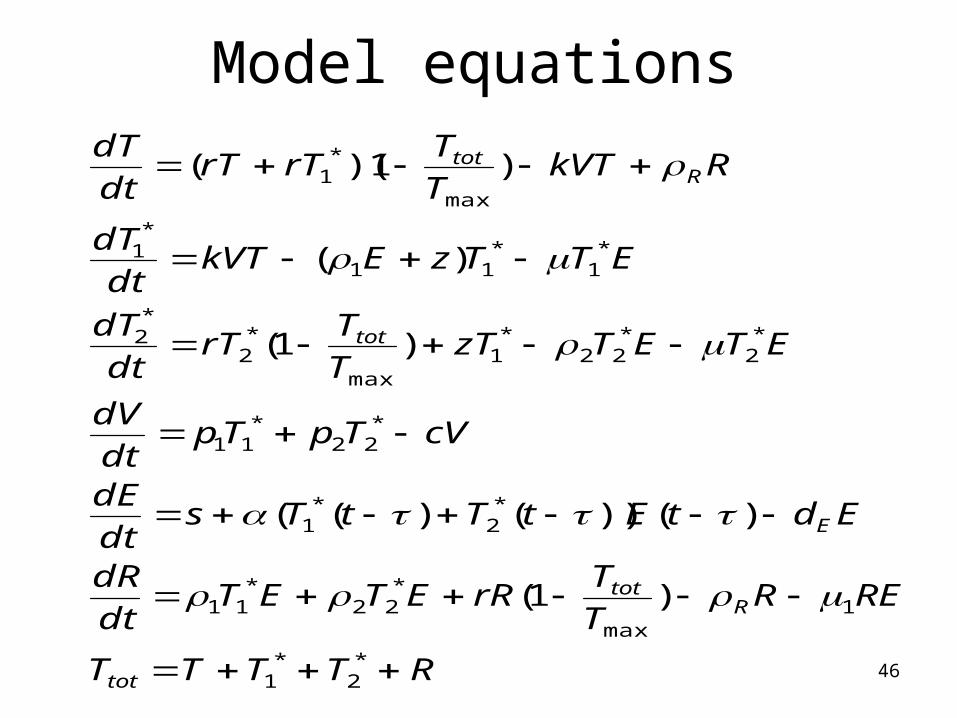
Model equations
RTTTT
RERT
TrRETET
dt
dR
EdtEtTtTsdt
dE
cVTpTpdt
dV
ETETzTT
TrT
dt
dT
ETTzEkVTdt
dT
RkVTT
TrTrT
dt
dT
tot
Rtot
E
tot
Rtot
*2
*1
1max
*22
*11
*2
*1
*22
*11
*2
*22
*1
max
*2
*2
*1
*11
*1
max
*1
)1(
)())()((
)1(
)(
)1)((
47
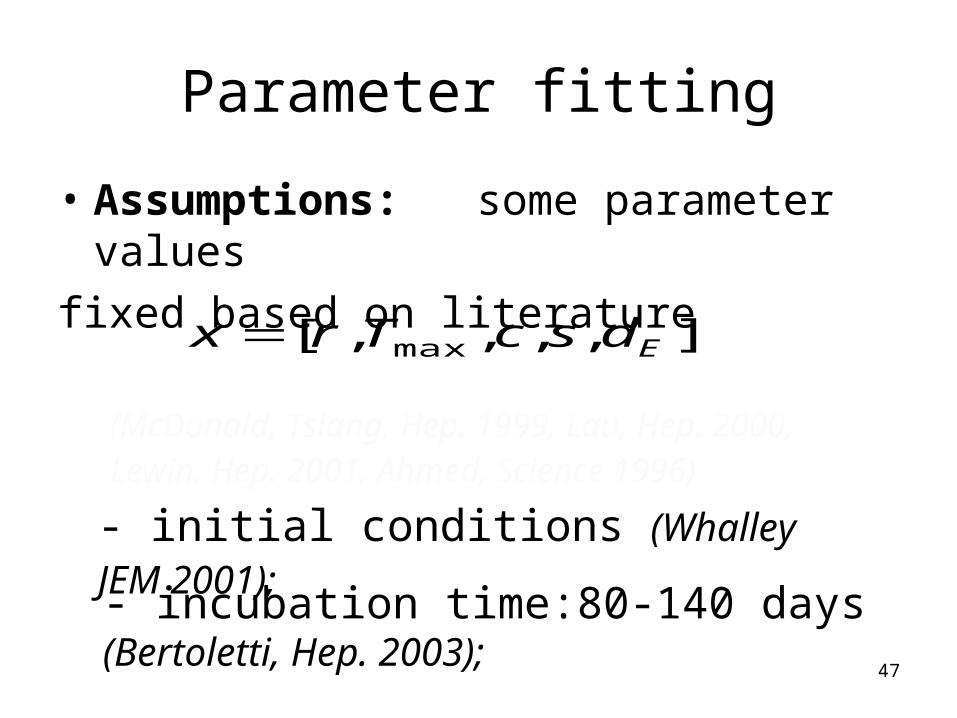
Parameter fitting
• Assumptions: some parameter values
fixed based on literature
],,,,[ max EdscTrx
- initial conditions (Whalley JEM 2001);
- incubation time:80-140 days (Bertoletti, Hep. 2003);
(McDonald, Tsiang, Hep. 1999, Lau, Hep. 2000, Lewin, Hep. 2001, Ahmed, Science 1996)
48
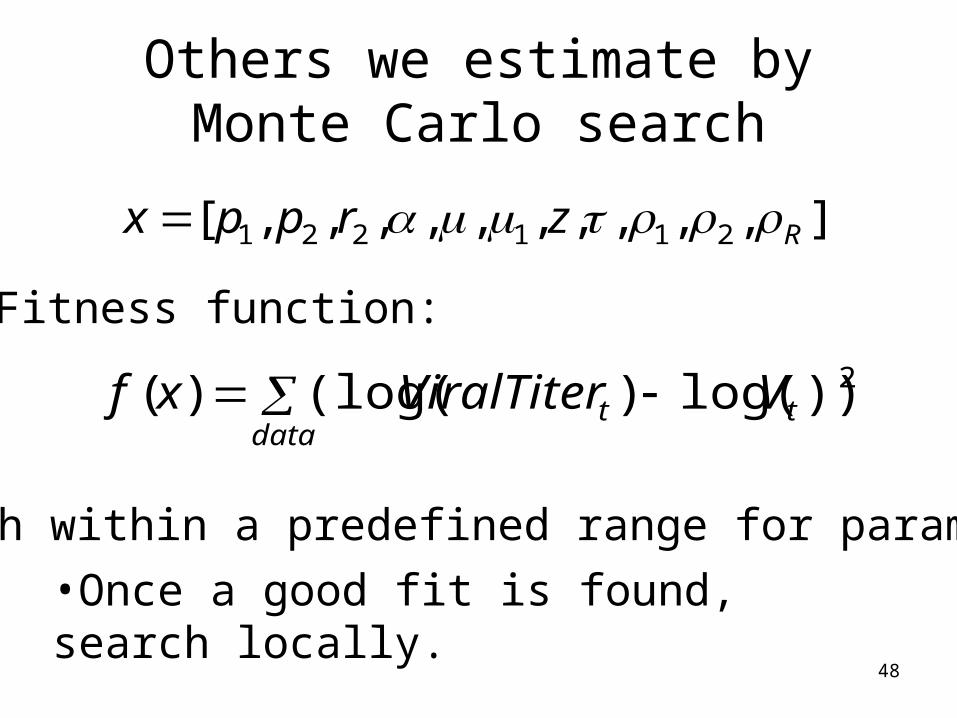
Others we estimate by Monte Carlo search
],,,,,,,,,,[ 211221 Rzrppx
•Fitness function:
data
tt VViralTiterxf 2))log()(log()(
•Search within a predefined range for parameters;
•Once a good fit is found, search locally.
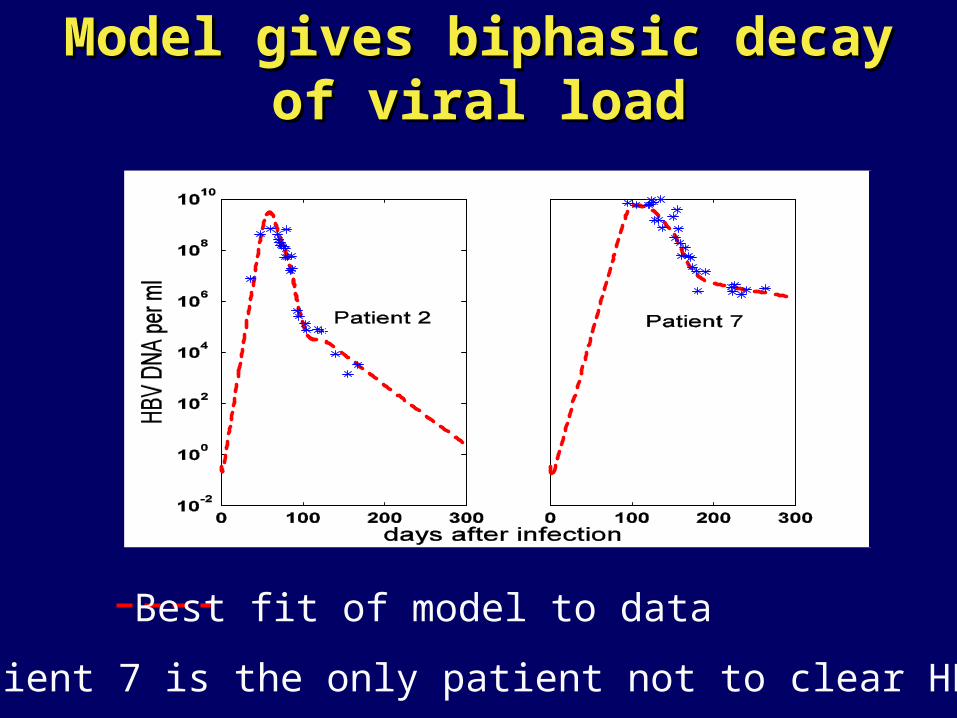
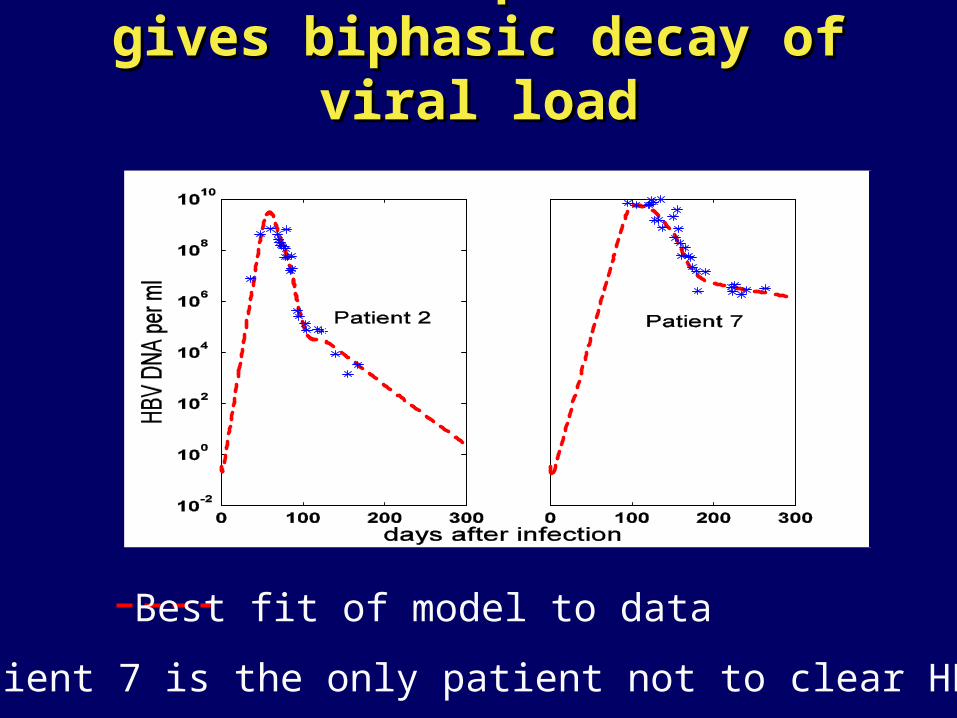
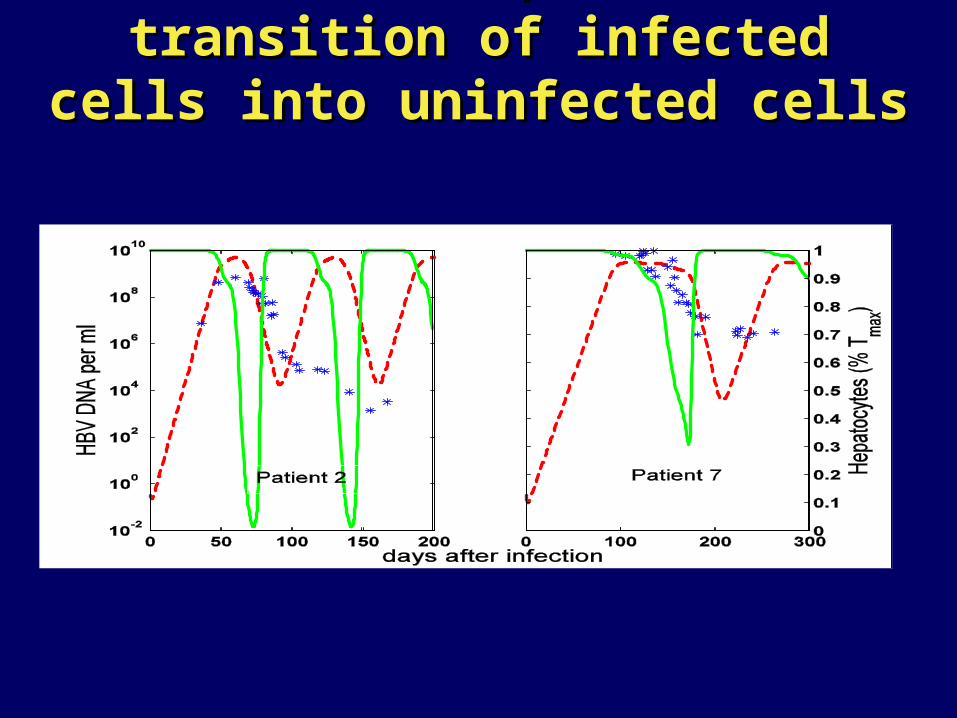
Model gives biphasic decay of Model gives biphasic decay of viral loadviral load
Best fit of model to data
Patient 7 is the only patient not to clear HBV
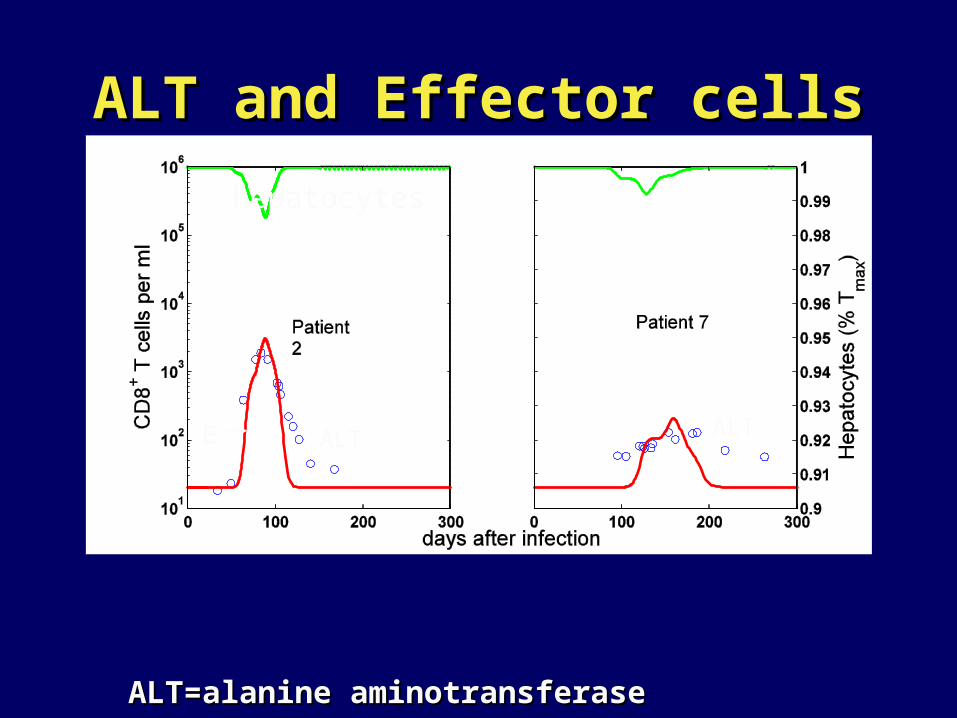
ALT and Effector cellsALT and Effector cells
ALT ALTE
hepatocytes
ALT=alanine aminotransferaseALT=alanine aminotransferase
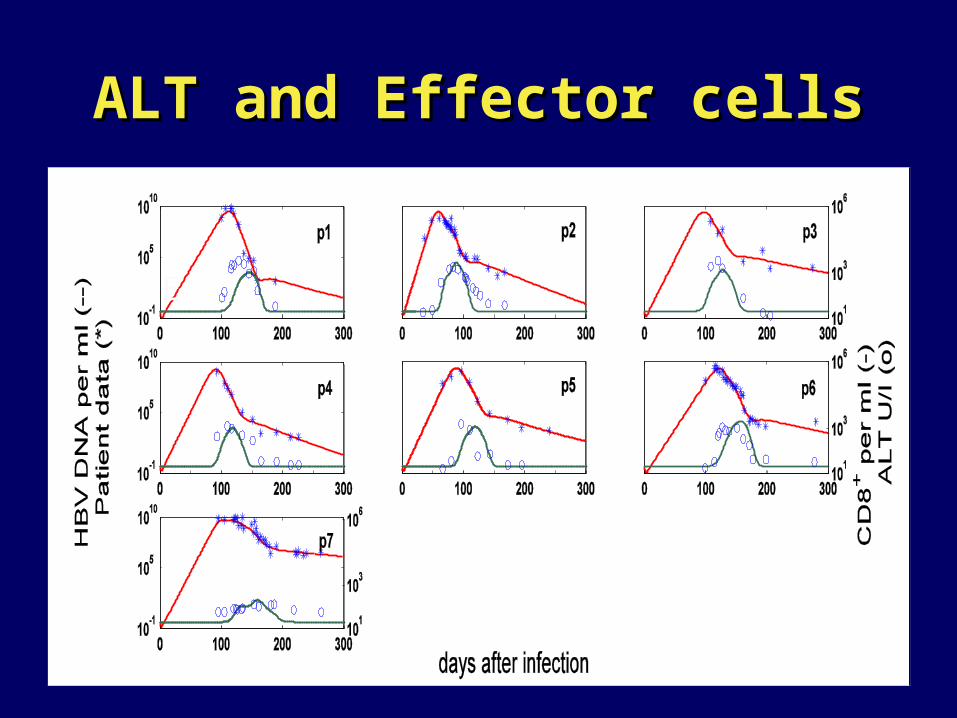
ALT and Effector cellsALT and Effector cells
E
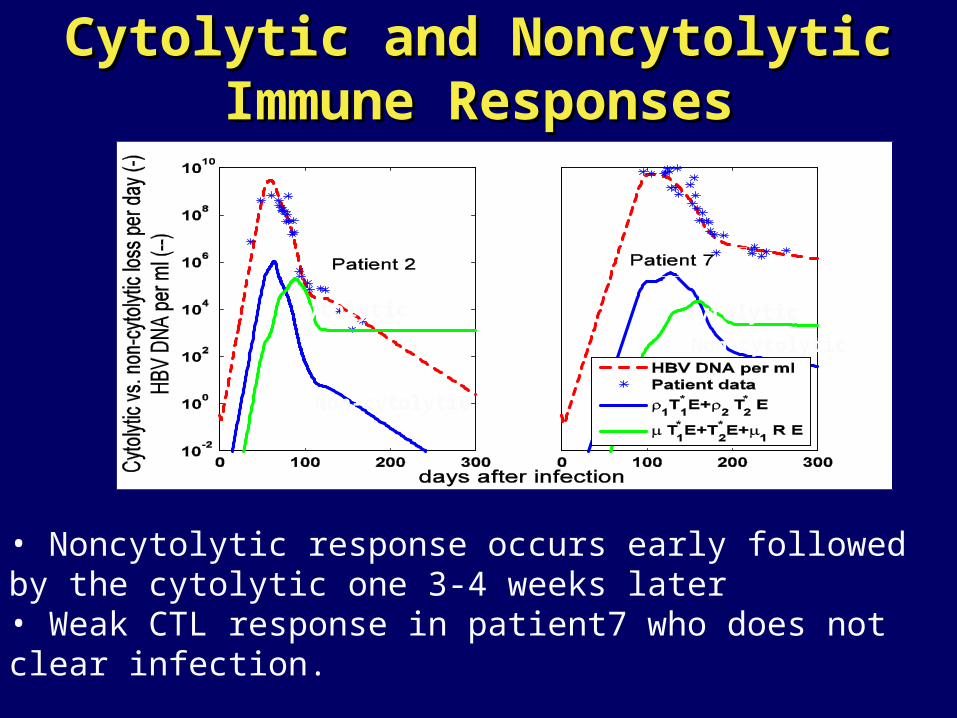
Cytolytic and Noncytolytic Cytolytic and Noncytolytic Immune ResponsesImmune Responses
• Noncytolytic response occurs early followed by the cytolytic one 3-4 weeks later• Weak CTL response in patient7 who does not clear infection.
Non-cytolytic
Non-cytolytic
cytolytic cytolytic
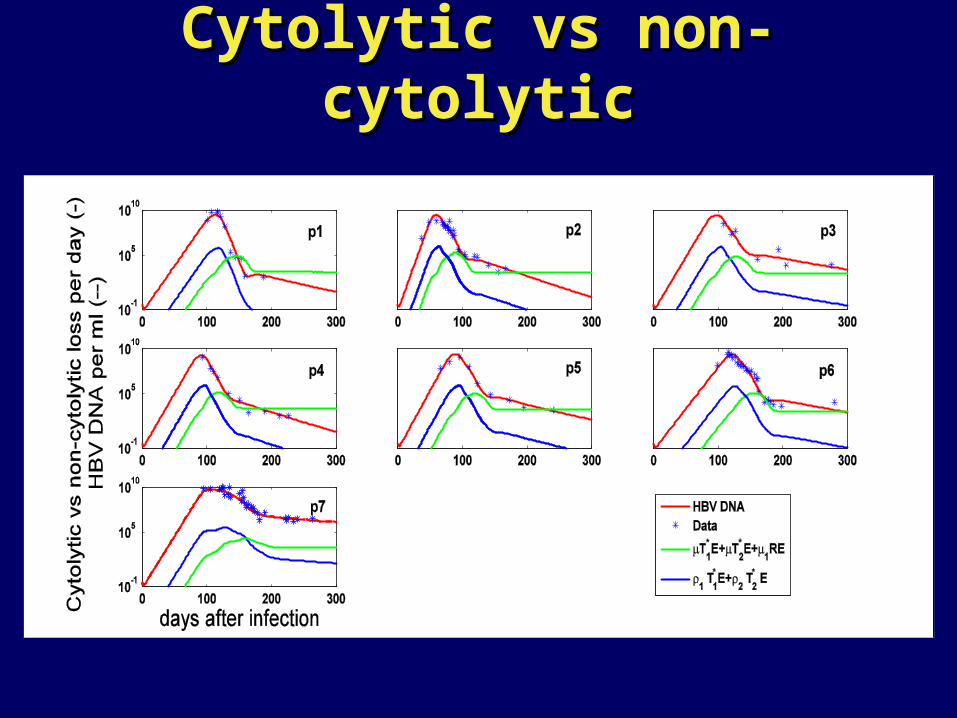
Cytolytic vs non-cytolyticCytolytic vs non-cytolytic
Model ResultsModel Results
99% hepatocytes are infected cells at the peak99% hepatocytes are infected cells at the peak Viral production by is estimated to be Viral production by is estimated to be
approximately half the production by .This approximately half the production by .This suggests that all cccDNAs may not be good suggests that all cccDNAs may not be good replicative templates. Needs to be examined replicative templates. Needs to be examined experimentally. experimentally.
*1T
*2T
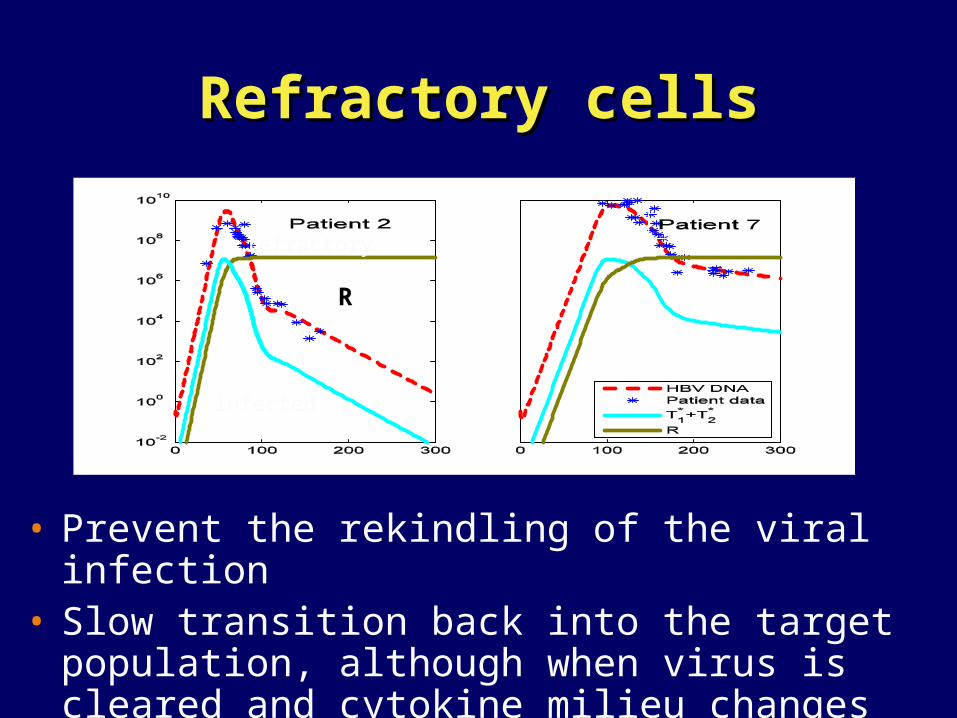
Refractory cellsRefractory cells
• Prevent the rekindling of the viral infection• Slow transition back into the target
population, although when virus is cleared and cytokine milieu changes this rate may increase.
infected
refractory
R
Are all model assumptions Are all model assumptions needed?needed?
This model is very complicated and involves four This model is very complicated and involves four features not present in the drug therapy models features not present in the drug therapy models used so far to fit HBV DNA data:used so far to fit HBV DNA data:– Proliferation of infected and uninfected Proliferation of infected and uninfected
hepatocyteshepatocytes – – with no proliferation hepatocyte mass with no proliferation hepatocyte mass
decreases substantially during the course of decreases substantially during the course of infection if a cytolytic response occurs. Also, infection if a cytolytic response occurs. Also, proliferation contributes to loss of cccDNA by proliferation contributes to loss of cccDNA by dilution and allows uninfected cells to dilution and allows uninfected cells to repopulate the liver as infected ones are repopulate the liver as infected ones are killed.killed.
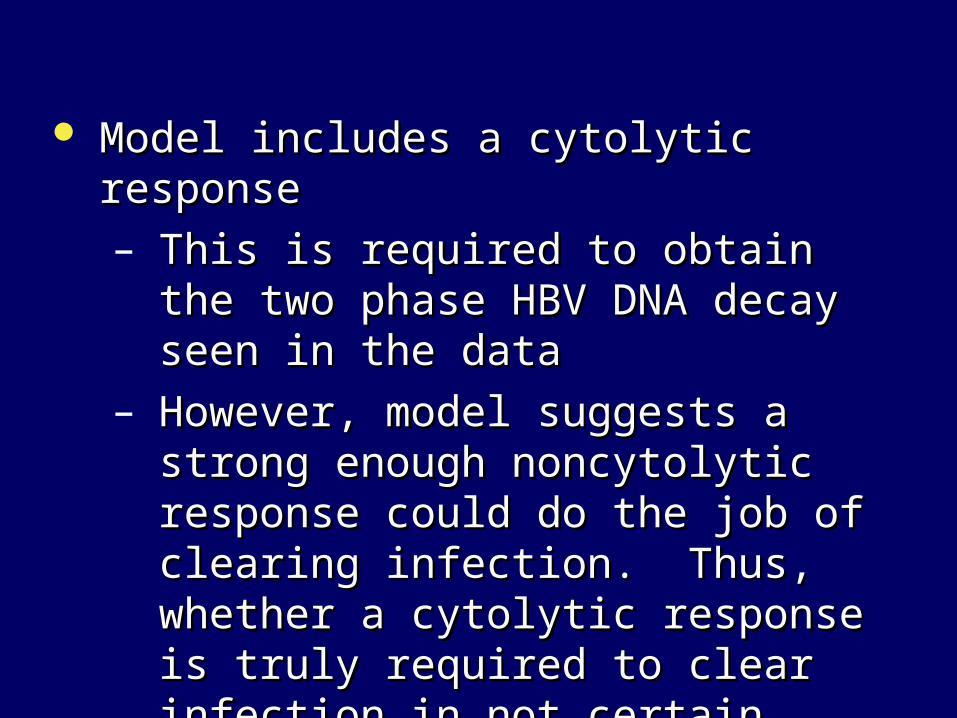
Model includes a cytolytic responseModel includes a cytolytic response
– This is required to obtain the two This is required to obtain the two phase HBV DNA decay seen in the phase HBV DNA decay seen in the datadata
– However, model suggests a strong However, model suggests a strong enough noncytolytic response could enough noncytolytic response could do the job of clearing infection. do the job of clearing infection. Thus, whether a cytolytic response is Thus, whether a cytolytic response is truly required to clear infection in not truly required to clear infection in not certain. certain.
With CTL response model gives With CTL response model gives biphasic decay of viral loadbiphasic decay of viral load
Best fit of model to data
Patient 7 is the only patient not to clear HBV
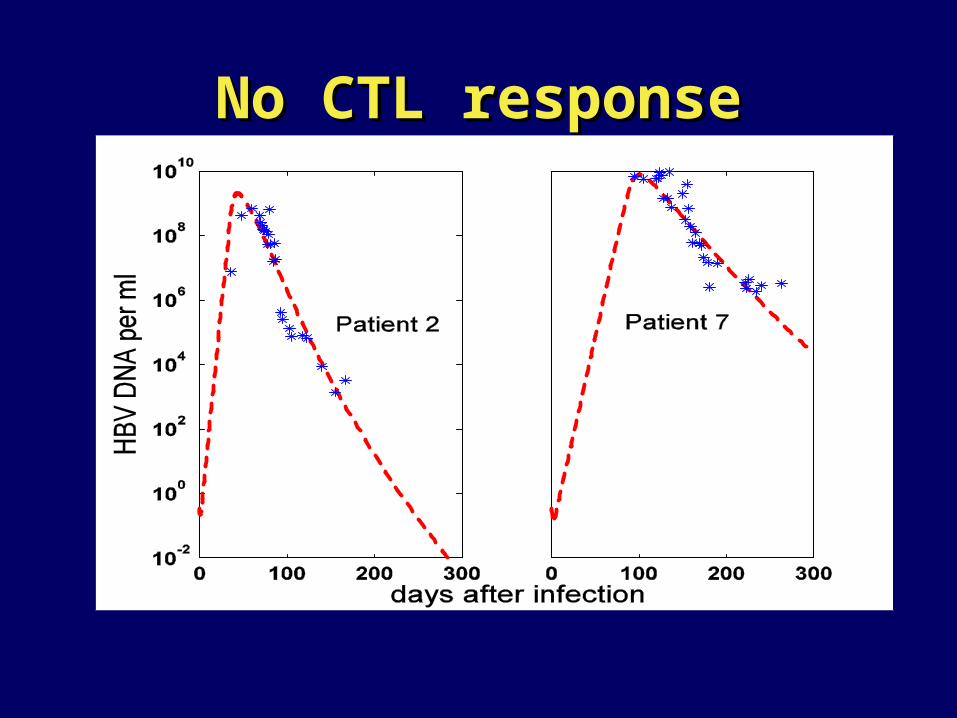
No CTL responseNo CTL response
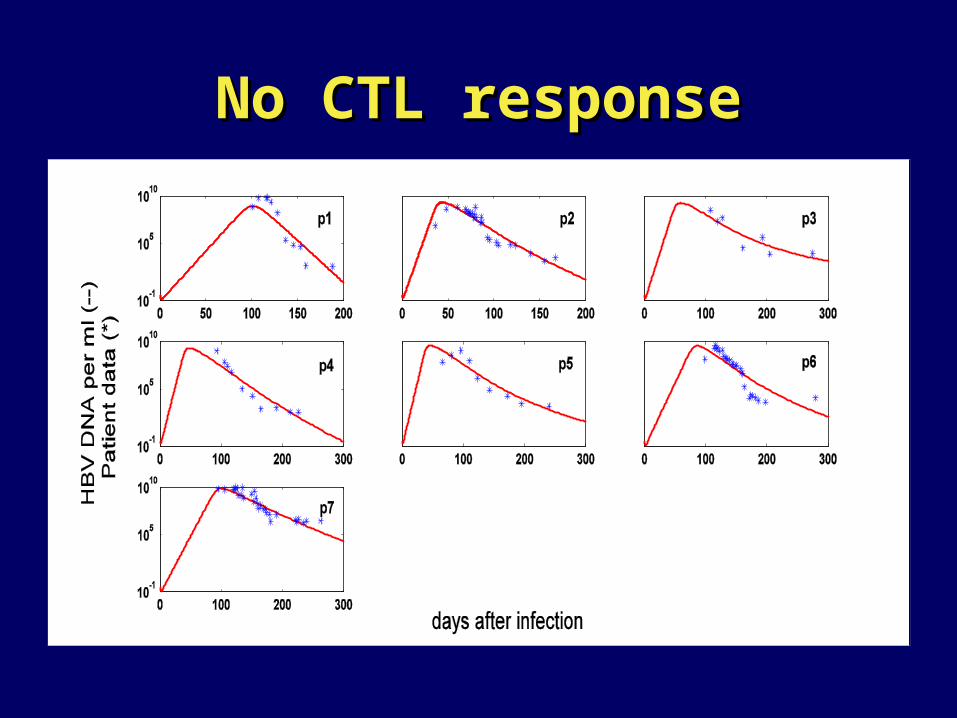
No CTL responseNo CTL response
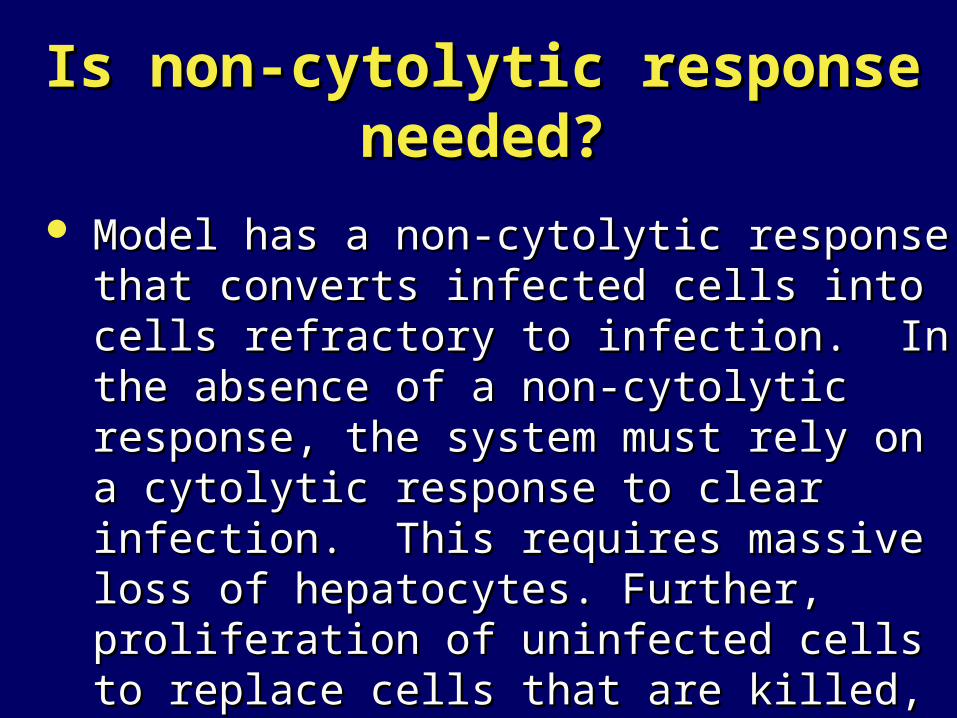
Is non-cytolytic response Is non-cytolytic response needed?needed?
Model has a non-cytolytic response that Model has a non-cytolytic response that converts infected cells into cells refractory to converts infected cells into cells refractory to infection. In the absence of a non-cytolytic infection. In the absence of a non-cytolytic response, the system must rely on a cytolytic response, the system must rely on a cytolytic response to clear infection. This requires response to clear infection. This requires massive loss of hepatocytes. Further, massive loss of hepatocytes. Further, proliferation of uninfected cells to replace proliferation of uninfected cells to replace cells that are killed, generates new targets cells that are killed, generates new targets and rekindles the infection.and rekindles the infection.
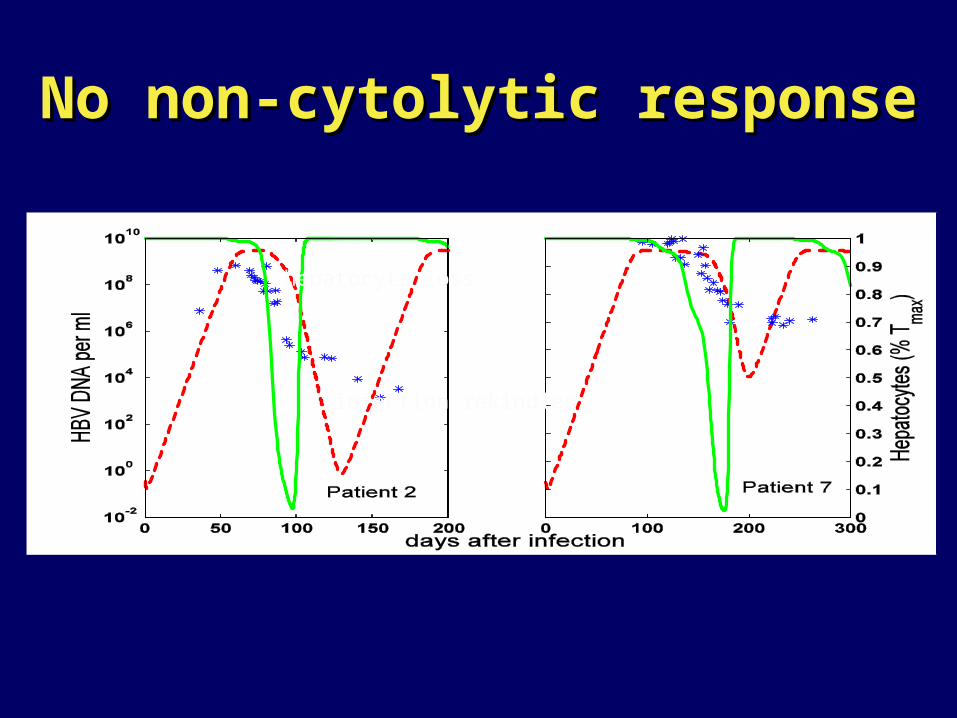
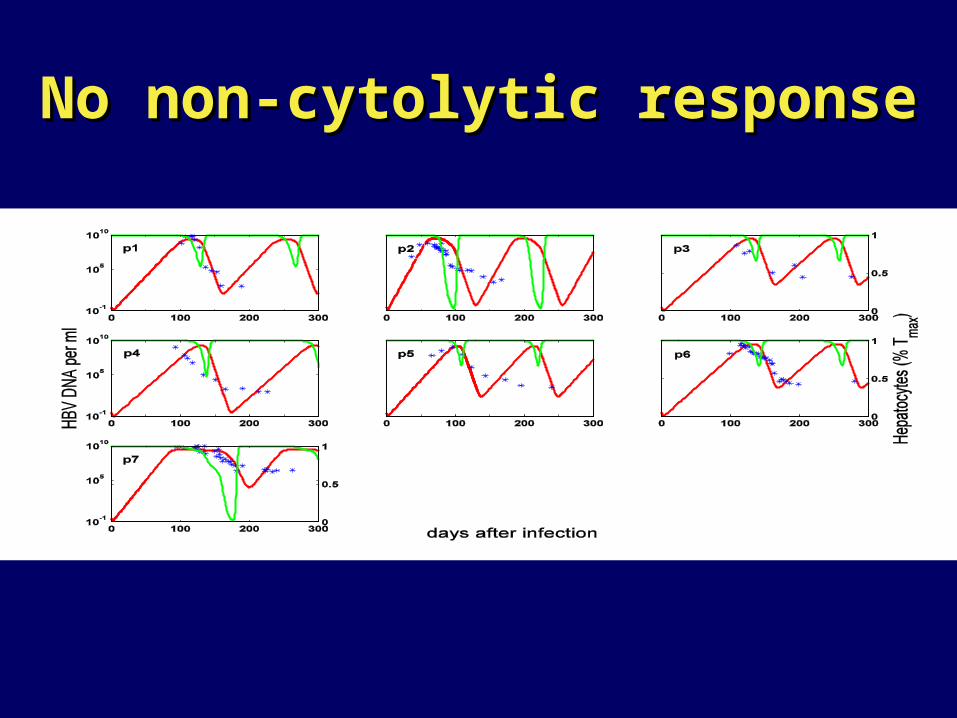
No non-cytolytic responseNo non-cytolytic response
hepatocyte loss
infection rekindles
No non-cytolytic responseNo non-cytolytic response
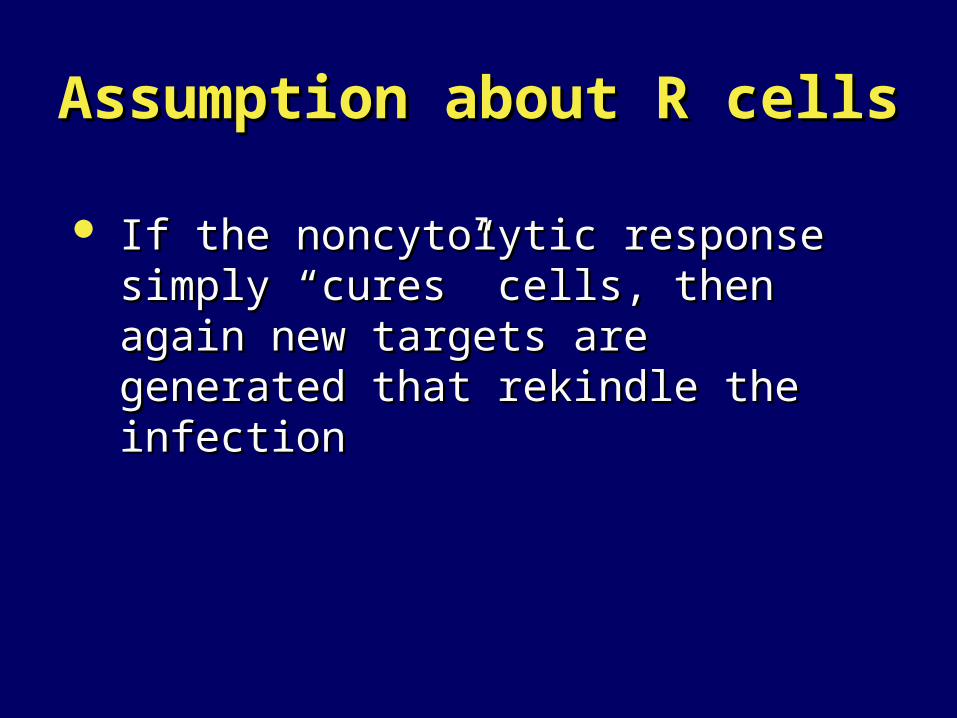
Assumption about R cellsAssumption about R cells
If the noncytolytic response simply If the noncytolytic response simply “cures” cells, then again new targets are “cures” cells, then again new targets are generated that rekindle the infectiongenerated that rekindle the infection
No R cells; direct transition of No R cells; direct transition of infected cells into uninfected cellsinfected cells into uninfected cells
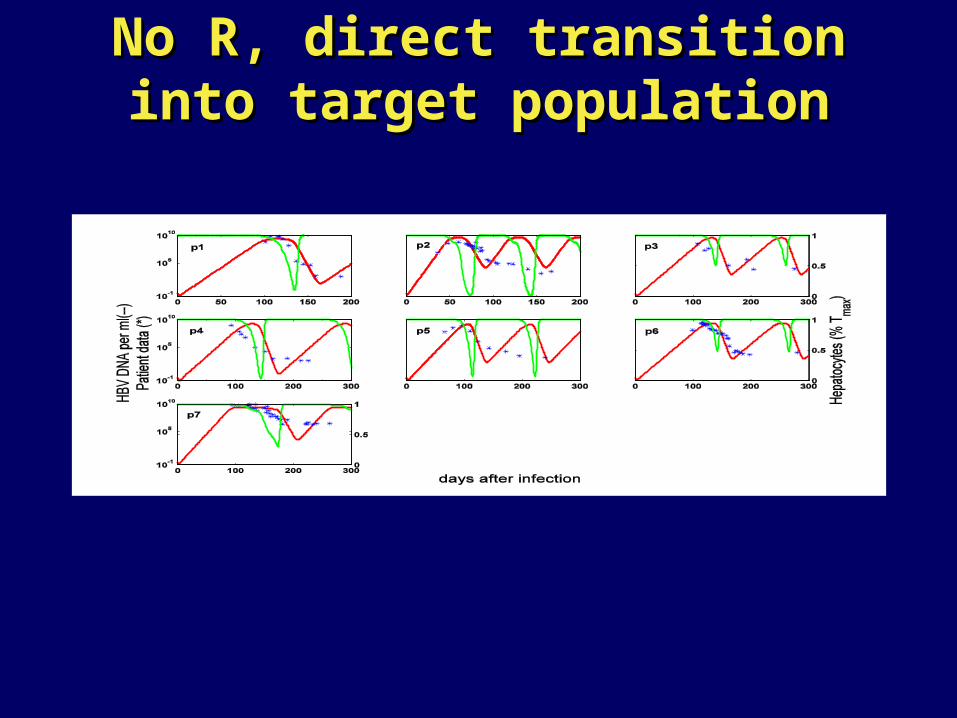
No R, direct transition into target No R, direct transition into target populationpopulation
Can antibodies replace R cells and prevent Can antibodies replace R cells and prevent re-establishment of infection?re-establishment of infection?
If an anti-HbsAg response occurs, then If an anti-HbsAg response occurs, then these antibodies may neutralize these antibodies may neutralize remaining virus and prevent re-remaining virus and prevent re-establishment of infection as infected establishment of infection as infected cells are replaced by uninfected ones.cells are replaced by uninfected ones.
AntibodiesAntibodies
Anti-HBs antibodies are detectable, but after Anti-HBs antibodies are detectable, but after the resolution of acute infection.the resolution of acute infection.
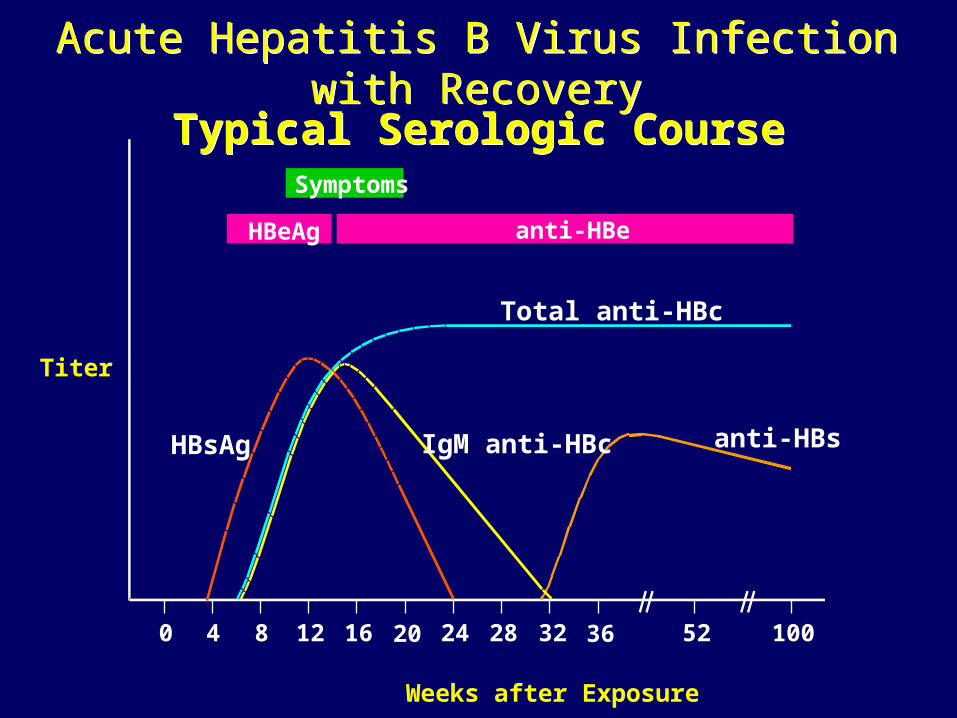
Acute Hepatitis B Virus Infection with RecoveryAcute Hepatitis B Virus Infection with Recovery
Typical Serologic CourseTypical Serologic CourseSymptoms
HBeAg anti-HBe
Total anti-HBc
IgM anti-HBc anti-HBsHBsAg
0 4 8 12 16 20 24 28 32 36 52 100
Titer
Weeks after Exposure
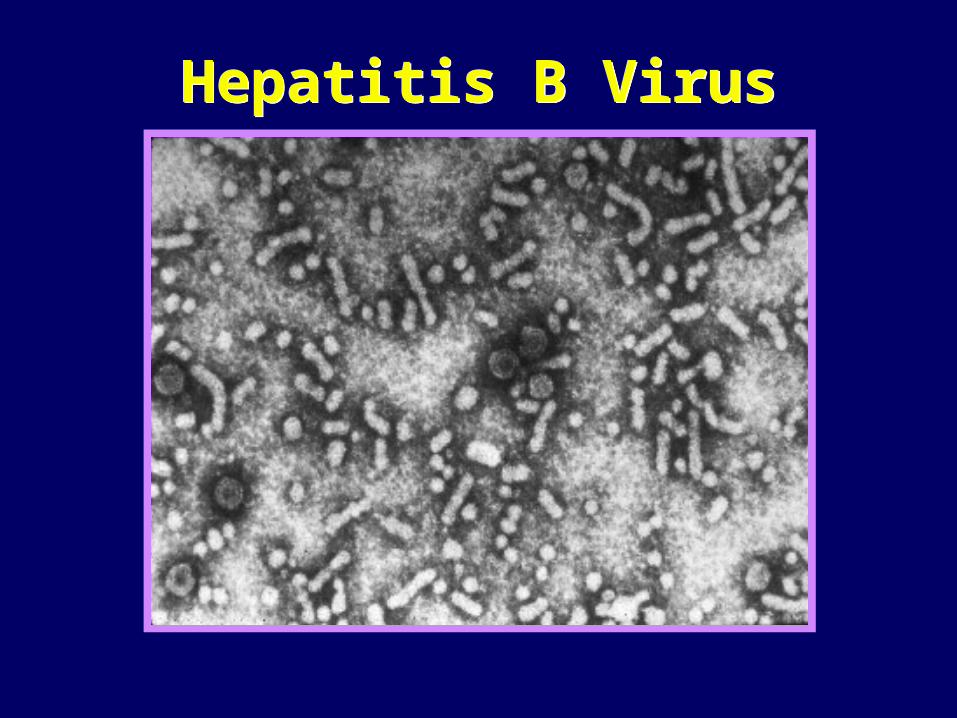
Hepatitis B VirusHepatitis B Virus
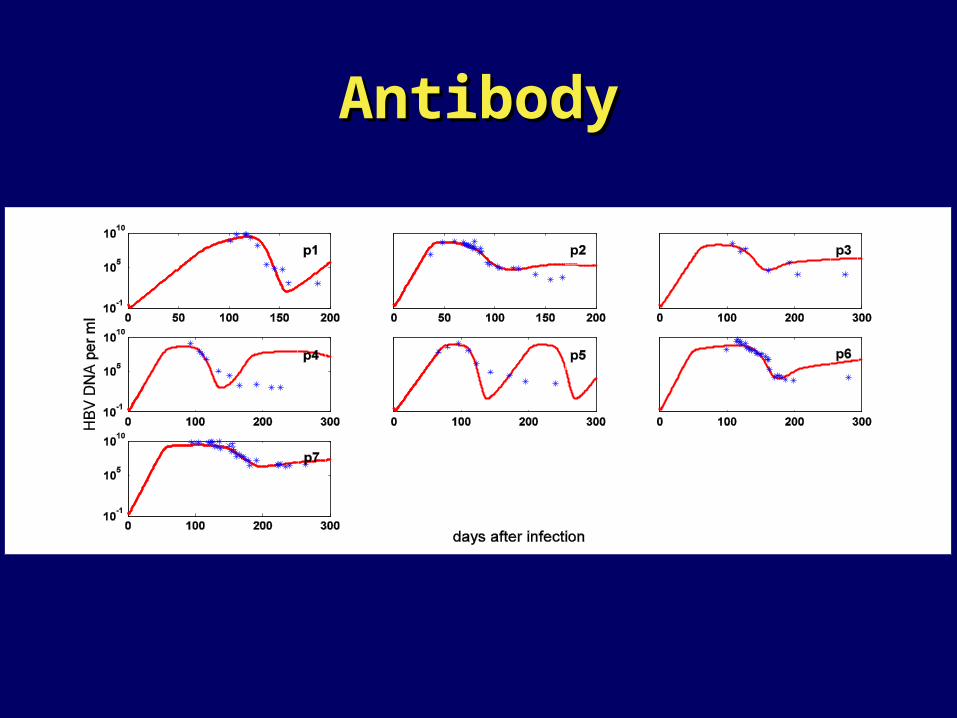
Model of Ab responseModel of Ab response
We consider:We consider:-the production of free antibodies by plasma -the production of free antibodies by plasma
cells.cells.
-attachment of antibody to both subgenomic -attachment of antibody to both subgenomic and infectious viral particles.and infectious viral particles.
-allow antibodies to neutralize the virus, i.e. -allow antibodies to neutralize the virus, i.e. reduce the infectivity rate k depending on reduce the infectivity rate k depending on the amount of antibody bound.the amount of antibody bound.
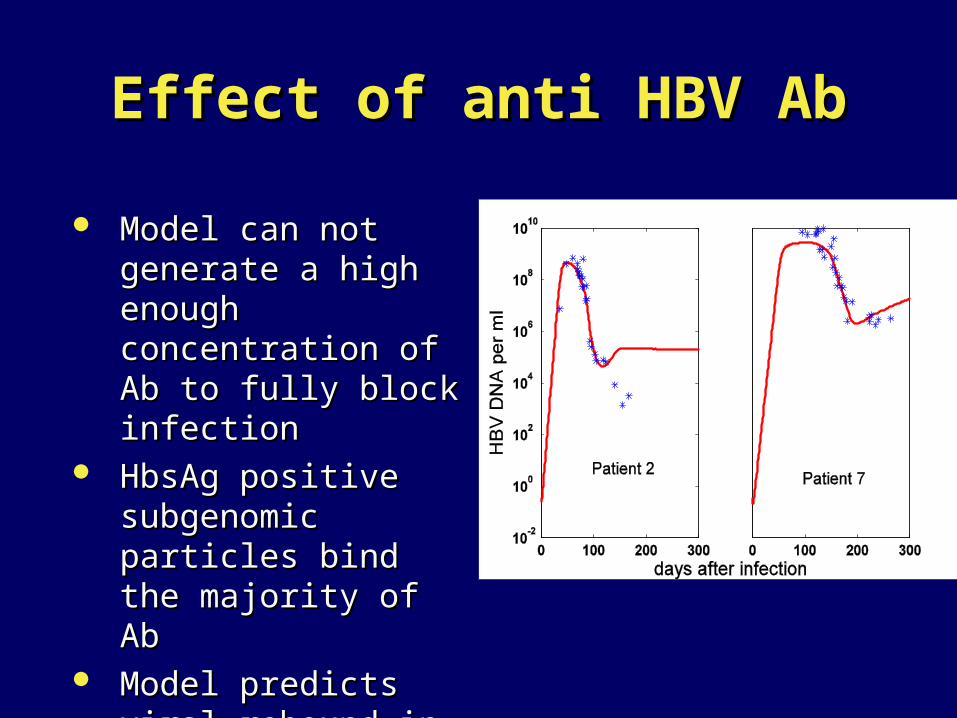
Effect of anti HBV AbEffect of anti HBV Ab
Model can not generate Model can not generate a high enough a high enough concentration of Ab to concentration of Ab to fully block infectionfully block infection
HbsAg positive HbsAg positive subgenomic particles subgenomic particles bind the majority of Ab bind the majority of Ab
Model predicts viral Model predicts viral rebound in most rebound in most patients at the end of patients at the end of the second phasethe second phase
710
AntibodyAntibody
SummarySummary
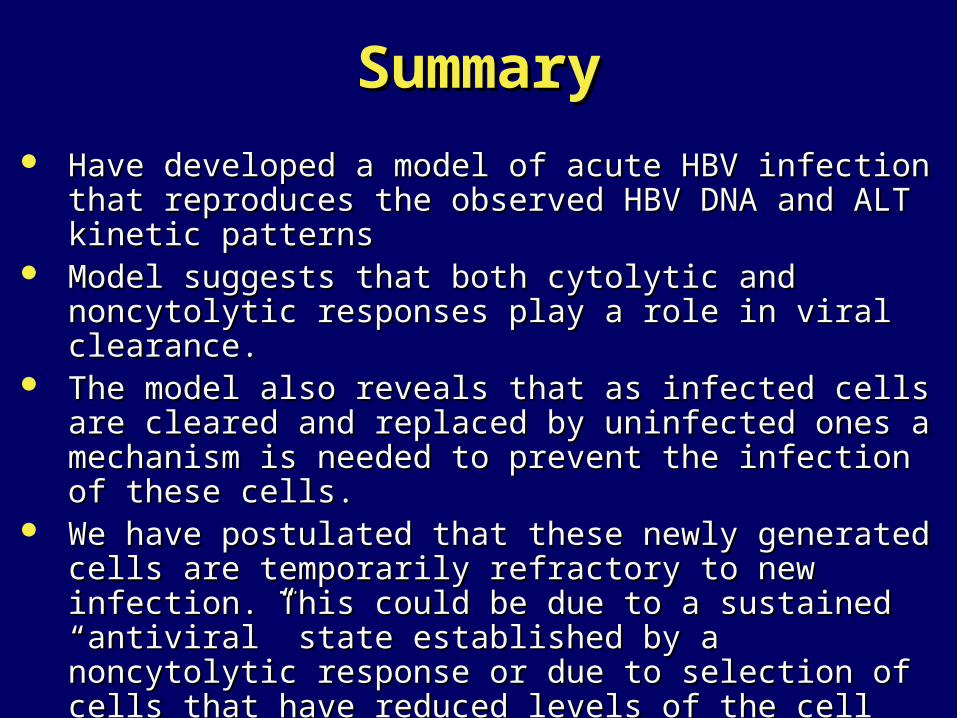
Have developed a model of acute HBV infection that Have developed a model of acute HBV infection that reproduces the observed HBV DNA and ALT kinetic patternsreproduces the observed HBV DNA and ALT kinetic patterns
Model suggests that both cytolytic and noncytolytic responses Model suggests that both cytolytic and noncytolytic responses play a role in viral clearance.play a role in viral clearance.
The model also reveals that as infected cells are cleared and The model also reveals that as infected cells are cleared and replaced by uninfected ones a mechanism is needed to replaced by uninfected ones a mechanism is needed to prevent the infection of these cells.prevent the infection of these cells.
We have postulated that these newly generated cells are We have postulated that these newly generated cells are temporarily refractory to new infection. This could be due to a temporarily refractory to new infection. This could be due to a sustained “antiviral” state established by a noncytolytic sustained “antiviral” state established by a noncytolytic response or due to selection of cells that have reduced levels response or due to selection of cells that have reduced levels of the cell surface receptors HBV uses to enter cells.of the cell surface receptors HBV uses to enter cells.
Anti-HbsAg antibodies could play a similar role, but ongoing Anti-HbsAg antibodies could play a similar role, but ongoing modeling suggests that the great excess of subgenomic modeling suggests that the great excess of subgenomic particles prevents effective antibody neutralization of the virus.particles prevents effective antibody neutralization of the virus.