Embed Size (px)
Citation preview
1
Industrial Research and Innovation Monitoring and Analysis (IRIMA II)
D3.2. Second Report on
Global Value Chains
2
R&D and innovation activities in
companies across Global Value
Chains
Summary report
Prepared by: IDEA Consult VDI Technologiezentrum
1
Table of Contents
Table of Contents .................................................................................................. 1 List of Figures ....................................................................................................... 2 List of Tables ........................................................................................................ 3 1. Introduction .............................................................................................. 4
Background of the study ............................................................................. 4 1.1.
Objectives of the study ............................................................................... 5 1.2.
Structure of ............................................................................................. 6 1.3.
2. Study approach and methodology ................................................................ 7 Approach .................................................................................................. 7 2.1.
Methodology ............................................................................................. 7 2.2.
3. Functional and geographical fragmentation of corporate R&D&I activities ........ 10 Introduction ............................................................................................ 10 3.1.
Pharmaceutical sector .............................................................................. 12 3.2.
3.2.1. Literature study ................................................................................ 12 3.2.2. Functional distribution of R&D&I activities ............................................ 16 3.2.3. Geographical distribution of R&D&I activities ........................................ 17 3.2.4. Analysis of R&D activities on the company level based on the EU R&D
Scoreboard ................................................................................................... 19 Automotive sector .................................................................................... 21 3.3.
3.3.1. Literature review ............................................................................... 21 3.3.2. Functional description of the R&D&I value chain .................................... 23 3.3.3. Geographical distribution of R&D&I activities ........................................ 24 3.3.4. Analysis of R&D activities on the company level based on the EU R&D
Scoreboard ................................................................................................... 27 Aerospace sector ..................................................................................... 30 3.4.
3.4.1. Literature review ............................................................................... 30 3.4.2. Functional distribution of R&D&I activities ............................................ 31 3.4.3. Geographical distribution of R&D&I activities ........................................ 32 3.4.4. Analysis of R&D activities on the company level based on the EU R&D
scoreboard .................................................................................................... 34 ICT sector ............................................................................................... 35 3.5.
3.5.1. Literature review ............................................................................... 35 3.5.2. Functional description of the R&D&I value chain .................................... 37 3.5.3. Geographical distribution of R&D&I activities ........................................ 38 3.5.4. Analysis of R&D activities on the company level based on the EU R&D
scoreboard .................................................................................................... 42 4. Locational drivers for international R&D&I activities, governance modes,
interactions and impact on home and host region .................................................... 44 Literature review: Analytical framework on drivers and impact of location 4.1.
decisions ................................................................................................ 44 4.1.1. Locational drivers .............................................................................. 44 4.1.2. Impact of location decisions on home and host country and interactions .. 47
Cross-sector analysis based on case studies and interviews .......................... 49 4.2.
5. Attractiveness of sites in Europe from a company perspective ....................... 56 6. Policy toolbox for the upgrade of the EU industry in GVCs ............................. 61 7. Conclusion .............................................................................................. 65 Annex ................................................................................................................ 71 References.......................................................................................................... 91
2
List of Figures
Figure 1: Overview of tasks and activities ................................................................. 7 Figure 2: TRL scale and three pillar bridge strategy from the European perspective ..... 11 Figure 3: TRL classification of pharmaceutical RDI activities ...................................... 13 Figure 4: Allocation of R&D investments by function (%) .......................................... 13 Figure 5: Annual motor vehicle production by World Region (1950-2015) ................... 21 Figure 6: R&D expenditures of vehicle manufacturers, billion euros, top 20 companies in
2015/2016 ......................................................................................................... 29 Figure 7: R&D expenditures of automotive parts suppliers, billion euros, top 20
companies in 2015/2016 ...................................................................................... 29 Figure 8: Aerospace Global Value Chain.................................................................. 31 Figure 9: R&D expenditures of ICT companies, billion euros, top 20 companies in
2015/2016 ......................................................................................................... 43 Figure 10: Refined analytical framework ................................................................. 44 Figure 11: Policy instruments for an ambitious short term policy: Option 1 ................. 61 Figure 12: Policy instruments for an ambitious short term policy: Option 2 ................. 62 Figure 13: Policy instruments for an ambitious short term policy: Option 3 ................. 63 Figure 14: Policy instruments for an ambitious short term policy: Option 4 ................. 64 Figure 15: New forms of industrial policy linked with a policy toolbox (short/medium/long
term) ................................................................................................................. 64
3
List of Tables
Table 1: Distribution of R&D across TRLs ................................................................ 16 Table 2: Functional distribution of non-R&D innovation activities ............................... 16 Table 3: Pharmaceutical industry R&D expenses in Europe, top 10 of countries in 2015 18 Table 4: Overview locations of technological clusters in Europe ................................. 18 Table 5: Top 10 US pharmaceutical clusters ............................................................ 19 Table 6: Overview of top 20 companies in Pharma and biotech sector (in R&D
expenditures in 2015) .......................................................................................... 19 Table 7: Decomposition of the R&D&I activities for the automotive sector ................... 24 Table 8: Business enterprise R&D expenditures for the sector “Manufacturing of motor
vehicles, trailers and semi-trailers (ISIC 29)” by country, 2014 ................................. 24 Table 9: Distribution of R&D budget across TRLs ..................................................... 32 Table 10: Distribution of budget across R&D activities .............................................. 32 Table 11: Overview locations of technological clusters in Europe ............................... 33 Table 12: Overview of top 20 companies in aerospace and defence, worldwide ........... 35 Table 13: Decomposition of the R&D&I activities for the ICT sector ............................ 38 Table 14: Business enterprise R&D expenditures for ICT industries (ISIC 26, 61, 62) by
country, 2014 ..................................................................................................... 40 Table 15: Impact of R&D&I Internationalization on home and host countries ............... 47 Table 16: Cross-sector analysis ............................................................................. 54 Table 17: Factors determining the attractiveness of Europe, for companies based in the
pharmaceutical sector .......................................................................................... 57 Table 18: Factors determining the attractiveness of Europe, for companies based in the
automotive sector ................................................................................................ 57 Table 19: Factors determining the attractiveness of Europe, for companies based in the
aerospace sector ................................................................................................. 58 Table 20: Factors determining the attractiveness of Europe, for companies based in the
ICT sector ........................................................................................................... 59
4
1. Introduction
Background of the study 1.1.
The world economy has changed in significant ways during the past several decades,
especially in the areas of international innovation activities and industrial organization.
Two of the most important new features of the contemporary economy are the
globalization of innovation, production and trade, which have fuelled the growth of
industrial capabilities in a wide range of developing countries, and the vertical
disintegration of transnational corporations, which are redefining their core competencies
to focus on innovation and product strategy, marketing, and the highest value-added
segments of manufacturing and services; while reducing their direct ownership over
‘non-core’ functions such as generic services and volume production. Together, these two
shifts have laid the groundwork for a variety of network forms of governance situated
between arm's length markets, on the one hand, and large vertically integrated
corporations, on the other1.
In 2010, the Commission adopted the flagship initiative "An Integrated Industrial Policy
for the Globalisation Era" (COM(2010)614) in the context of the Europe 2020 strategy for
smart, sustainable and inclusive growth. This initiative sets out a fresh approach to
industrial policy, emphasising the importance of industry for the EU economy. It focuses
on strengthening industrial competitiveness to underpin growth and jobs and to enable
the transition to a low-carbon and a resource-efficient economy. The Council and the
European Parliament strongly endorsed this approach, requesting its implementation and
further development. In October 2012 the Commission adopted an Update of the
Industrial Policy flagship initiative, the Communication "A Stronger European Industry for
Growth and Economic Recovery" (COM (2012) 582 final). After an extensive public
consultation, the Commission proposed to jointly focus investment and innovation on six
priority action lines: advanced manufacturing technologies (for Clean Production), Key
Enabling Technologies (micro- and nanoelectronics, advanced materials, industrial
biotechnology, photonics, nanotechnology and advanced manufacturing systems), bio-
based products, sustainable industrial and construction policy and raw materials, clean
vehicles, and smart grids. The Communication includes policy proposals to enhance
performance in global markets. It proposes that EU companies would be supported and
accompanied in their internationalisation process, in order to increase the share of
internationally active EU SMEs (currently estimated at 13%).
The current industrial policy, as set out in the Industrial Policy Communications of 2010
and 2012, remains in place but it has been prolonged and reactivated by a recent
Communication in January 2014 (EC, 2014, , For a European Industrial Renaissance).
The new Communication stresses the importance of full and effective implementation of
industrial policy in the EU and focuses therefore on concrete measures, such as pursuing
industrial modernisation through investment in innovation, resource efficiency, new
technologies, skills and access to finance. Investment on the innovation process is pivotal
for industrial recovery, thus understanding the role of R&D and innovation in a firm's
delocalisation and geographical dispersion of the value chain at EU level, is of high
importance. This is all the more important because firms are increasingly relying on
internationally dispersed sources of knowledge (especially multinational enterprises that
1 Gereffi, Gary; Humphrey, John; Sturgeon, Timothy (2005). The governance of global value chains.
Review of International Political Economy,Vol. 12, Iss. 1
5
account for most of private R&D expenditure), and because the non-traditional locations
(i.e. emerging economies) are climbing up the hierarchy of MNE’s R&D and innovation
activities, disrupting the well-known patterns of re-localisation and the overall
architecture of global value chains.
In a more recent communication (2017), The European Commission also emphasizes that
we have arrived in “a new industrial age” with economic, societal and environmental
transformations and technological breakthroughs that occur at fast pace (e.g. robotics,
Internet of Things, artificial intelligence). Within this new industrial age, the integration
of industry in global value chains is becoming more key. Therefore, it is argued that the
EU requires important efforts to maintain and reinforce its’ industrial leadership. New
initiatives have also been unveiled for a smart, innovative and sustainable industry. One
important goal hereby is to further facilitate the integration of European companies in
global value chains in R&D and innovation which are considered as the essential drivers
of industrial competitiveness. In this Communication it is also stressed that there has to
be a focus on “strategic value chains” in new technology which has to be well coordinated
and financed by public authorities and industries from several Member States. The
present study has the aim to further advance our knowledge on the geographical and
functional fragmentation of R&D and innovation activities from a company perspective.
For this purpose, it has built upon the state of the art knowledge on firms’ global
research and innovation networks and Global Value Chains (GVCs). The concept of GVC
refers to the increasing geographical fragmentation (at worldwide scale) of the full range
of activities that firms engage in to bring a product to the market, from conception to
final use (i.e. including design, production, marketing, logistics, distribution and support
to customers). This study also aims to further complement the analyses conducted at the
European Commission (e.g. recently DG RTD conducted an analysis on the drivers,
geographical dispersion and impact of international R&D activities, but in this study they
did not take the large heterogeneity of sub-functions of R&D activities into account that
may have an impact on all these aspects). As this study also aims to further unravel the
strategic competences of the EU’s industry in global value chains, it can also serve as
relevant background info for the recently proposed European framework for the
screening of foreign direct investments into the European Union (COM(2017)487)2.
Objectives of the study 1.2.
The objective of the study is to better understand the geographical and organizational
patterns of corporate R&D and innovation across GVCs and their interactions with home
and host-countries’ economies and policy initiatives. In addition, a better understanding
of the drivers and barriers to improving the location of high-value creation and
knowledge-intensive activities in Europe and the competitive position of EU industry in
strategic GVCs is aimed for.
The study focused on the following questions for companies in selected sectors which are
strategic for European competitiveness:
(a) How do companies organise their R&D and innovation (R&D&I) activities across
GVCs?
(b) What is the relationship between R&D&I locational decisions and the location of
production activities?
2 Within this framework, the European Commission – together with the Members States – wants to “screen third country foreign direct investments in the EU in strategic industries, infrastructure and key future technologies, or other assets that are important in the interests of security and protection of access to them" in order to enable Europe to preserve its essential interests.
6
(c) Which industrial differences can be observed?
(d) How functions/activities are sliced (or not) across different subsidiaries, external
partners and different territories?
(e) Which corporate governance mechanisms and modes sustain corporate R&D and
innovation across GVCs? (alliances, subcontracting, collaborative contracts, IP
licensing, subsidiaries chain, …)
(f) What are the main implications for the locational strategy of EU firms, and for EU
innovation/ attractiveness policy? Which corporate challenges can be derived?
(g) Which policy challenges can be derived?
Furthermore, the study has focused on the analysis of individual companies in selected
sectors which allow generating an overall representative picture from the firm
perspective. The study has been based on empirical evidence and has aimed to better
explain the link between R&D and innovation, and the geographical dispersion thereof in
Global Value Chains (GVCs). The study has also provided a synthetic analysis of firms'
perceptions and opinions about future drivers, determinants and barriers for research
and innovation investments in Europe, in relation to location decisions and overall
competitiveness issues.
Structure 1.3.
This study provides a summary of all activities, findings and conclusions of the entire
project. The report includes:
Chapter 2: details the study approach and the methodology used in the project;
Chapter 3: provides an overview of the functional and geographical fragmentation of
R&D&I within the pharmaceutical sector, the automotive sector, the aerospace sector
and the ICT sector;
Chapter 4: provides a summary of the locational determinants of international R&D&I
activities, its governance modes, the impact of these activities on the home and host
region and the interactions with local ecosystems;
Chapter 5: provides an overview of the attractiveness of Europe for R&D&I activities
within the selected sectors (pharmaceuticals, automotive, aerospace, ICT);
Chapter 6: provides a summary of the policy toolbox that we have developed as part
of this study;
Chapter 7: provides a brief conclusion of the project;
An annex with complementing information;
A list of all references used throughout the project.
7
2. Study approach and methodology
Approach 2.1.
The main objective of the study is to analyse the geographical and organizational
patterns of corporate R&D and innovation across GVCs and their interactions with home
and host-countries’ economies and policy initiatives to create a better understanding.
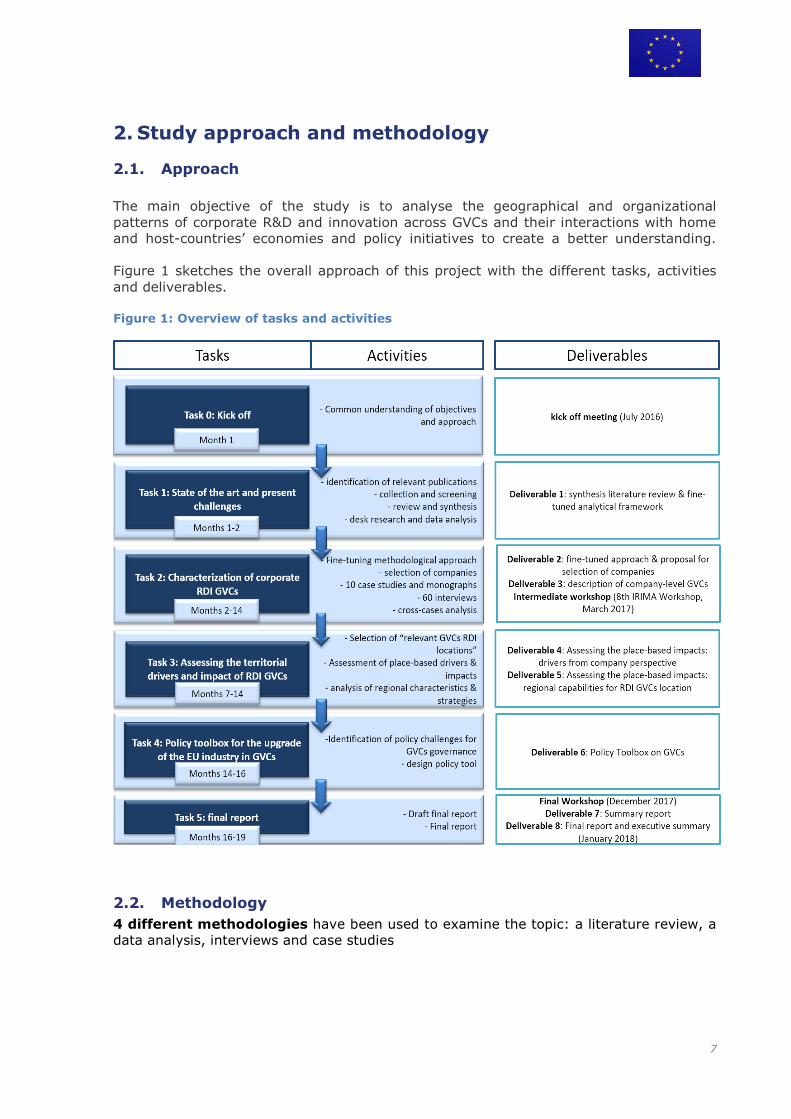
Figure 1 sketches the overall approach of this project with the different tasks, activities
and deliverables.
Figure 1: Overview of tasks and activities
Methodology 2.2.
4 different methodologies have been used to examine the topic: a literature review, a
data analysis, interviews and case studies
8
The literature review focused on obtaining a comprehensive and recent overview of
the existing evidence on the interrelation between R&D and innovation localisation
decisions and their impact on the home and the host countries. All references that
have been used throughout the project can be found at the back of this document.
References to company reports or websites of the firms that have examined in the
case studies have been removed in order to safeguard the confidentiality.
Data analysis has been performed (mainly based on the 2016 EU R&D Scoreboard
and patent data) to obtain an overview of R&D activities and innovation across global
value chains in Europe by specific companies.
Information from the desk research has been complemented with multiple
interviews to obtain a more comprehensive assessment of corporate
internationalization strategies, organizational processes and challenges. 10 companies
have been selected for this purpose (see below). Interviews with company managers
have also been complemented by interviews with external sector experts.
10 case studies at company level have been conducted, distributed across three of
the most knowledge-intensive sectors (with the highest overall R&D expenditures) of
the European Union. These case studies enabled us to better understand the
geographical and organizational patterns of corporate R&D and innovation (R&D&I)
activities across global value chains and their interactions with home and host
countries’ economies and policy initiatives. Additionally, the case studies enabled us
to gain a better understanding of the locational drivers and barriers to improving the
attractiveness of Europe as a location for R&D&I activities. The case studies have also
shed more light on the competitive position of the European Union in strategic GVCs.
A ‘case’ refers here to the entire global value chain of a company’s product (group).
More specifically, this study has looked at R&D&I activities (both R&D and non-R&D)
within the global value chain. This global value chain covers the sequence of
operations going from early research activities to the marketing of the developed
products. The value chain can also include external partner firms and (research)
institutions when the company outsources activities or engages in collaborations.
The selection of the 10 company cases was guided by the outcome of the literature
review and it took into account some of the priority action lines as set out in the
Terms of Reference of the project. In consultation with the EC it has been decided to
focus on companies in the three industries with the highest R&D expenditures in
Europe, in particular:
o Health (Pharmaceuticals & Biotechnology, Health Care Equipment), further
specified to pharmaceutical companies (we examined 3 companies)
o Mobility (Automobiles & Parts, Airplanes, Public Transport), further
specified to automobile companies (2 companies) and aerospace
companies (2 companies).
o ICT (Technology Hardware & Equipment, Electronic & Electrical Equipment,
Software & Computer Services, Fixed Line Telecommunication), further
specified to ICT manufacturing and software (3 companies).
Other key criteria that have been taken into account for the case selection are:
o A well balanced mix of sectors (as indicated above) taking into account the
technology level: pharmaceuticals – high tech, automotive and aerospace
– medium-high tech and ICT manufacturing – high tech
o R&D intensity of the company - high R&D intensity

9
o Origin/nationality of companies – EU companies
o Geographical coverage (headquartered in the EU, but with dispersed GVCs)
o Company type – established MNEs and fast growing firms
o Indication of recent noticeable trends with respect to location decisions.
For each case study, we conducted around 6 interviews, so a total of 60 interviews with
business representatives, company managers and industry experts have been
undertaken in this study.
10.
3. Functional and geographical fragmentation of corporate R&D&I activities
Introduction 3.1.
In this chapter, we discuss the functional and geographical fragmentation of corporate
R&D&I activities of companies within the 3 sectors of our investigation. For each sector
we first provide a literature review on the functional and geographical fragmentation of
R&D&I activities within that sector and afterwards we provide specific figures on these
fragmentation patterns. Before proceeding we however first indicate in this chapter how
we define R&D&I activities and how these activities can be functionally distributed.
R&D and Innovation (R&D&I)
An innovation is “the implementation of a new or significantly improved product (good or
service), or process, a new marketing method, or a new organizational method in
internal business practices or in the open workplace” (OECD, 2005). Given the
comprehensive nature of the innovation concept, an innovative activity might include
research and development but not all the research and development activities necessarily
lead to an innovative outcome (such as product or process innovation). It is therefore an
important yet a difficult task to delineate R&D and innovation due to the overlapping
nature of concepts.
In line with the approach of the OECD Frascati Manual (2015), this study defines R&D as
a “creative and systematic work undertaken in order to increase the stock of knowledge -
including knowledge of humankind, culture and society, and to devise new applications of
available knowledge”. According to the OECD Frascati Manual 2015, for an activity to be
an R&D activity, it must satisfy five core criteria. The activity must be novel, creative,
uncertain, systematic, and transferable and/or reproducible. Innovative activities that do
not satisfy these criteria can be considered as non-R&D innovation activities. These
include among others design activities, staff training activities related to market
introduction or product preparations, technology forecasting and product innovation. For
firms not active in R&D activities, non-R&D innovation activities are among critical factors
to explain how these firms achieve both production and process innovation (Barge-Gil et
al., 2011; Arundel, Bordoy & Kanerva, 2008). Furthermore, Love & Roper (1999) nuance
this contribution of non-R&D innovation activities by arguing that R&D expenditures
explain better any innovations in products whereas non-R&D innovation activities explain
better innovations in process. The most common non-R&D innovation activities are
design, training, technology forecasting and innovation management.
Design covers a wide range of activities, including architectural, fashion, graphic,
interior, engineering and industrial design and can be implemented in a broad
variety of contexts (Walsh, 1996).
Training refers to improving the skills of employees and the updating of
knowledge of existing staff. Training is mainly aimed at increasing the human
capital and absorptive capacity of the firm (Cohen & Levinthal, 1990).
Technology forecasting equals the systematic process of describing the
emergence, performance, features, or impact of a technology in the coming
future. Technology forecasting can take on many forms and this process could be
oriented towards identifying new technological opportunities, seeking leadership in
nascent technologies, looking for technology licensing, or learning more about
potential technologies to develop. Technology forecasting is about anticipating
11
future technological development and trends and several authors have
documented that it is a vital activity for the firm’s competitiveness.
Innovation management refers to all activities aimed at organising the
innovation process in a way that maximises market success with new processes
and products (Barge-gil et al., 2011). This can take on different forms such as
Human Resource Management (HRM), team-working, and co-opetition. HRM aims
at stimulating employees and managers to engage in innovation activities and
develop skills needed for effective innovation efforts. Team working is aimed at
facilitating knowledge sharing within the team, removing organisational barriers
and developing mutual trust. Co-opetition is intended at sourcing external
knowledge flows by cooperating with external partners. All these mechanisms are
aimed at developing organizational skills for identifying innovation ideas and as
such are essential for innovation success.
Functional description of R&D&I activities
The debate on R&D and innovation localization and organization is a complex one.
Disentangling the different functions is important in order to be sufficiently precise in the
discussion on R&D&I location decisions, which may affect R&D&I as a total overall
function, or just a sub-activity. The location of ‘Research’ can be different than the
location of ‘Development’. Depending on the type of production (routine versus non-
routine), development can be more or less closely (also physically) connected to
production. Simon et al. (2008) distinguish between five phases in the R&D process:
research, platform development, application development, process development and
production support as integrated components of a GVC functioning. These different
phases however do not cover the whole R&D&I global value chain of companies. Design,
validation and demonstration are for example important steps in the value chain of high
tech companies.
The Technology Readiness Level (TRL) scale takes these tasks and functions related
to innovation better into account. Initially developed during the 1970s and 1980s,
Technology Readiness Levels (TRL) are a type of measurement system used to assess
the maturity level of a particular technology based on the projects progress (NASA,
2015). The scale covers gained widespread acceptance to align individual technological
trajectories. Today, the TRLs scale is mainly used as a tool for facilitating the decision
making process on R&D&I investments at the EU level.
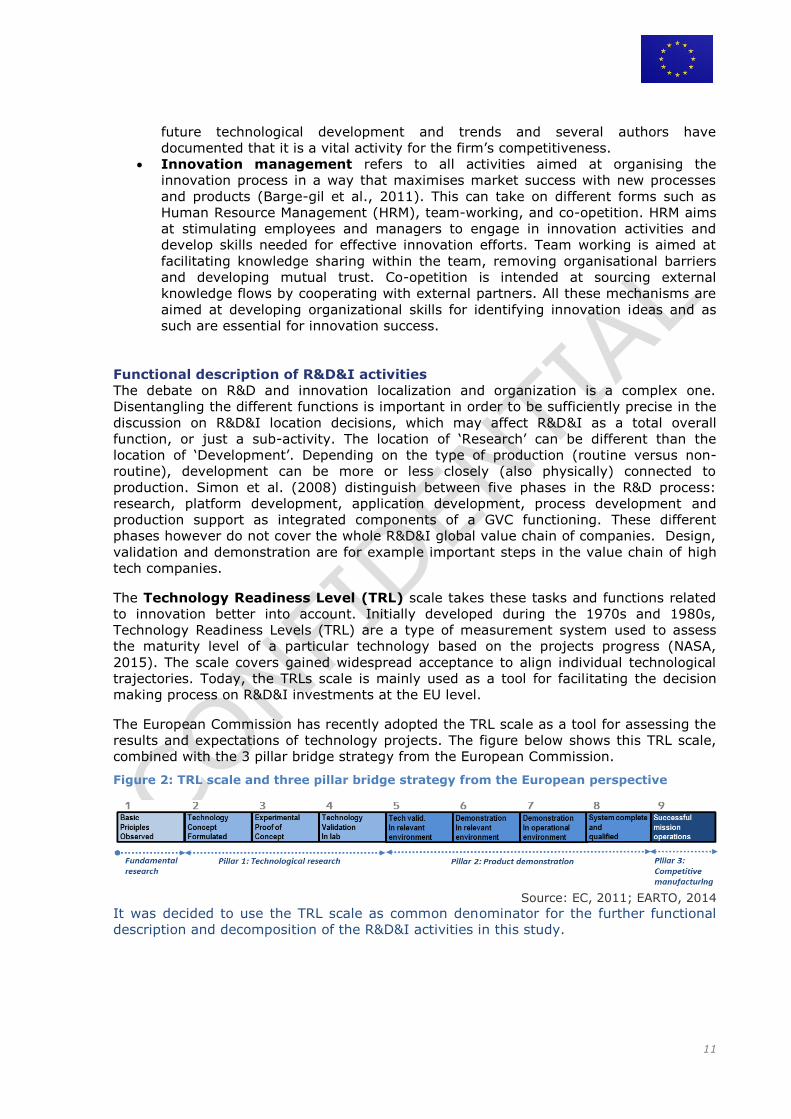
The European Commission has recently adopted the TRL scale as a tool for assessing the
results and expectations of technology projects. The figure below shows this TRL scale,
combined with the 3 pillar bridge strategy from the European Commission.
Figure 2: TRL scale and three pillar bridge strategy from the European perspective
Source: EC, 2011; EARTO, 2014
It was decided to use the TRL scale as common denominator for the further functional
description and decomposition of the R&D&I activities in this study.
12
Pharmaceutical sector 3.2.
3.2.1. Literature study
The pharmaceutical industry is one of the most important industries of Europe. In 2015,
this industry invested an estimated €31,500 million in R&D activities in Europe.
Furthermore, it employs almost 725,000 people and it generates 3 to 4 times more
employment indirectly (EFPIA, 2016). It is also the industry with the highest R&D
intensity in the European Union (Eurostat, 2015). According to the 2016 EU R&D
Scoreboard, 19% of total business R&D expenses worldwide are undertaken by the
pharmaceutical and biotechnology sector. R&D expenditures are essential in the
pharmaceutical industry and cover a major part of the overall innovation structure
(Gassmann et al., 2002). Estimations have shown that R&D activities cover between 20
and 40% of overall costs of developed new drugs.
Traditionally, the different stages in the innovation process of pharmaceutical products
have been well-documented and have a development cycle of 10 years or more (Wadhwa
et al., 2008).
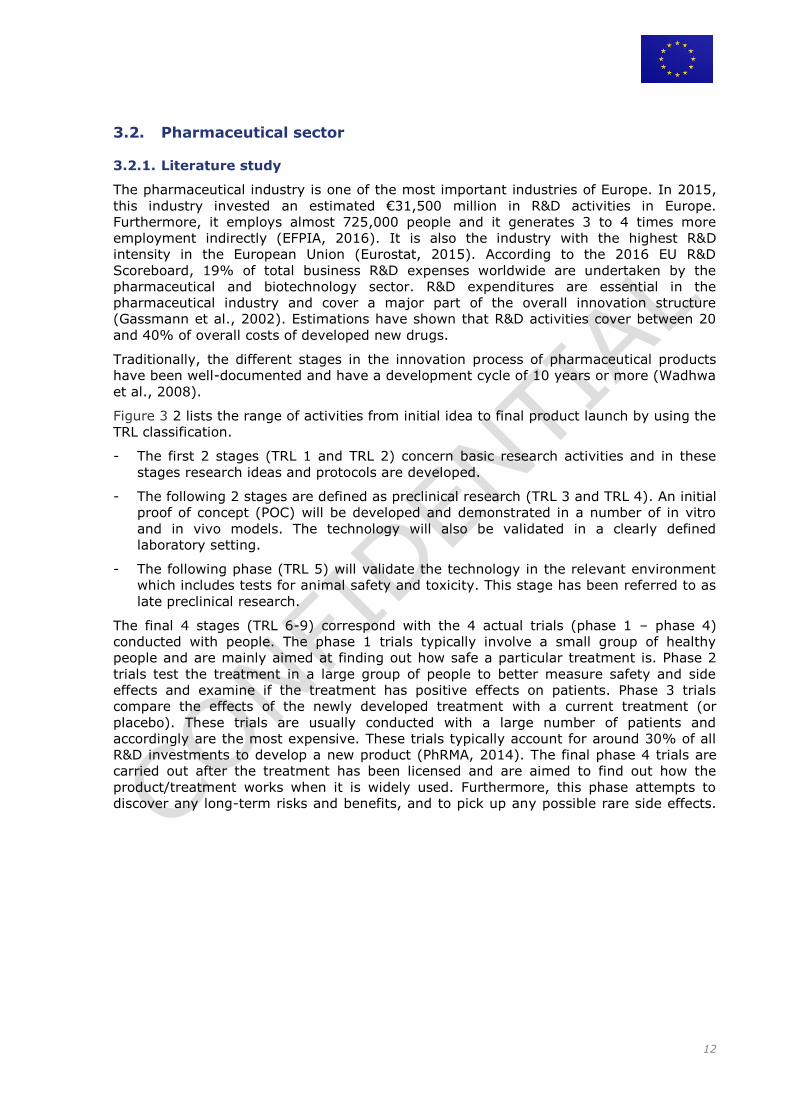
Figure 3 2 lists the range of activities from initial idea to final product launch by using the
TRL classification.
- The first 2 stages (TRL 1 and TRL 2) concern basic research activities and in these
stages research ideas and protocols are developed.
- The following 2 stages are defined as preclinical research (TRL 3 and TRL 4). An initial
proof of concept (POC) will be developed and demonstrated in a number of in vitro
and in vivo models. The technology will also be validated in a clearly defined
laboratory setting.
- The following phase (TRL 5) will validate the technology in the relevant environment
which includes tests for animal safety and toxicity. This stage has been referred to as
late preclinical research.
The final 4 stages (TRL 6-9) correspond with the 4 actual trials (phase 1 – phase 4)
conducted with people. The phase 1 trials typically involve a small group of healthy
people and are mainly aimed at finding out how safe a particular treatment is. Phase 2
trials test the treatment in a large group of people to better measure safety and side
effects and examine if the treatment has positive effects on patients. Phase 3 trials
compare the effects of the newly developed treatment with a current treatment (or
placebo). These trials are usually conducted with a large number of patients and
accordingly are the most expensive. These trials typically account for around 30% of all
R&D investments to develop a new product (PhRMA, 2014). The final phase 4 trials are
carried out after the treatment has been licensed and are aimed to find out how the
product/treatment works when it is widely used. Furthermore, this phase attempts to
discover any long-term risks and benefits, and to pick up any possible rare side effects.
13.
Figure 3: TRL classification of pharmaceutical R&D&I activities
Source: Adopted from written evidence from Professor Chris Mason, TSB: Presentation outlining the vision for a Cell Therapy TIC, May 2011, US Department of Defence: Technology Readiness Assessment (TRA) Deskbook,
July 2009, and op. cit.Strategy for Regenerative Medicine
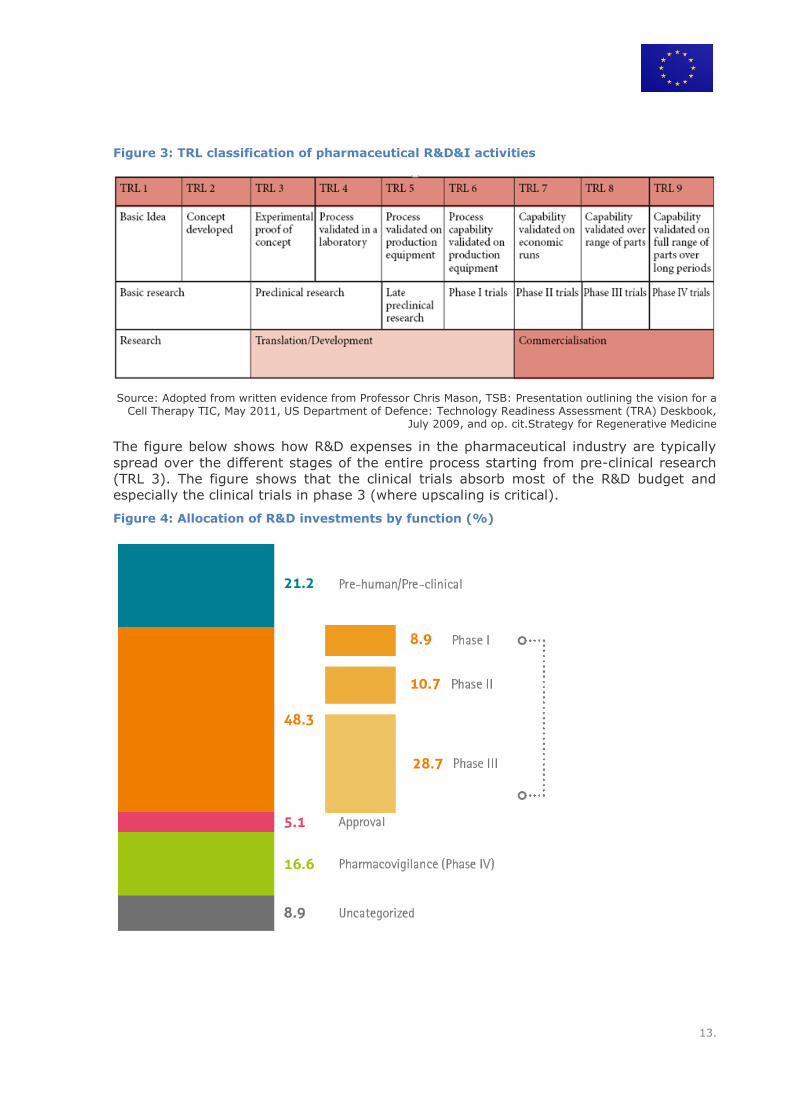
The figure below shows how R&D expenses in the pharmaceutical industry are typically
spread over the different stages of the entire process starting from pre-clinical research
(TRL 3). The figure shows that the clinical trials absorb most of the R&D budget and
especially the clinical trials in phase 3 (where upscaling is critical).
Figure 4: Allocation of R&D investments by function (%)
14
Source: PhRMA, Annual Membership Survey 2016 (percentages calculated from 2014 data, total values may be affected by rounding)
Current trends and challenges
The pharmaceutical industry has changed tremendously in the last 2 decades. More
specifically, the industry has been characterized by 5 different trends:
Rising R&D expenditures but limited output. R&D expenditures have increased
significantly the last 2 decades (Rafols et al., 2014). The expenditures by US firms
have for instance almost doubled over the period 1998-2008 (PhRMA, 2009). At the
same time the output has increased.
Increasing costs. Because of stricter regulations in most countries – partly deriving
from uncertainty about drug safety and efficacy – costs have increased substantially
(Danzon, 2006). Costs have also soared because of lengthier trials (due to the
increasing focus on chronic diseases) and higher costs of product approvals.
The rise of emerging markets. Emerging markets are becoming more and more
important and their markets are expanding rapidly. In 2013, China was for instance
already the third most important market in terms of sales numbers for Bayer
Healthcare (Bayer AG, annual report 2014). The abundance of low-costs scientists in
several of these countries creates additional opportunities. At the same time however,
indigenous firms located in emerging markets are increasing their competitiveness
and intensify global competition.
The rise of generics. More recently, several of the world’s best-selling drugs have lost
their patent protection. When this occurs, firms no longer have the sole license to
produce and sell the particular drug and generic products can enter the market. This
trend has intensified global competition and increases the pressure on established
firms to engage in continuous innovation.
Increasing complexity. The pharmaceutical innovation process becomes increasingly
complex and is more often based on an expanded set of converging technologies
including biology, computational sciences, nanotechnology, and chemistry.
These trends have led to a significant restructuring of the global pharmaceutical industry.
Initially, the number of pharmaceutical firms decreased over time and the industry
became increasingly concentrated. Firms merged or acquired other companies to exploit
economies of scope and scale and to minimize risk. However, more recently, because of
soaring R&D costs and increasing competition, companies became more focused and only
perform in areas in which they excel themselves, while outsourcing remaining products
and processes to firms that can handle these more efficiently. To improve access to local
knowledge and expertise and in order to obtain complementarities and synergies,
pharmaceutical firms are also increasingly engaging in external partnerships and
research collaborations. Soaring R&D costs, increasing complexity and competition, and
the emergence of new geographical markets have not only led to outsourcing but also to
the offshoring of R&D activities. Here below, we elaborate more on the outsourcing and
offshoring trends of pharmaceutical R&D&I activities and show that these are highly
dependent on the type and maturity of the R&D&I activity involved (TRL level).
Outsourcing
Performing everything in-house is not only very capital-intensive, but also risky and the
opportunity costs are extremely high. Accordingly, the large established pharmaceutical
companies (e.g. Pfizer, GlaxoSmithKline, Merck) aim to externalize 40%-50% of the
whole R&D pipeline (Ramirez, 2014). The emergence of genomic sciences, molecular
biology, technological developments in the combinatorial chemistry, and the
15
technological development of the ICT industry have enabled the increased outsourcing of
parts of the innovation process (e.g. Reddy, 2011).
In the wake of this technological revolution, new drugs increasingly originate from
smaller companies, which frequently are biotechnology start-up firms (Comanor and
Sherer, 2011). These small companies typically originate from academic research and
emerge from technology clusters around universities and research institutes (clusters are
predominantly located in the Triad regions). Large pharmaceutical companies are
increasingly relying on these companies and part of the reconfiguration of their R&D
value chain involves the scanning for intellectual property from smaller (biotech) firms
for potential products during the various stages of the R&D pipeline. This typically ends
up in mergers and acquisitions or joint-ventures with these companies. The combination
of both firms can be highly synergetic; small firms specialize in discovery and enjoy the
advantages of a rapidly advancing science base, while large firms have the needed
expertise and resourced to demanding and highly expansive clinical trials and
commercialization.
Pharmaceutical firms also increasingly rely on Contract Research Organizations (CROs)
that provide research services on a contract basis. CROs provide services such as
(bio)pharmaceutical development, biologic assay development, commercialization,
(pre)clinical research, clinical trials management and pharmacovigilance. CROs can be
highly attractive partners as they enable other firms to be more flexible and reduce costs
and risks. Outsourcing to CROs can be done all along the discovery and development
R&D value chain, but pharmaceutical firms make sure to not outsource the whole R&D
value chain or large chunks of it, as it could endanger their competitive composition. All
parts of the discovery process that require judgement, creativity, and that cannot be
articulated in a “Standard Operating Procedure (SOP)” are typically not outsourced
(Ramirez, 2014). Exploratory research and molecule design are also kept in-house.
Other more routine R&D tasks that are well understood can be outsourced. A CRO will
typically perform activities in the later phases of the R&D value chain. The traditional
CROs originate from the US and the European Union, but more recently Asian CROs are
gaining importance and their number has exploded exponentially. These Asian CROs
however often do not have the same capabilities as their advanced country counterparts
and are more engaged in the more routinized clinical trial activities. They are however
also gaining ground in terms of research capabilities and are catching up rapidly (Dierks
et al., 2013; Li and Zhang, 2009).
Offshoring
Traditionally, pharmaceutical companies retained their R&D activities close to
headquarters and manufacturing facilities. Since the late 1990s, this has however been
changed dramatically and firms started to relocate their R&D facilities away from HQ and
production facilities. This relocation is mainly driven by the urge to be located close to
centres of research excellence or clusters of universities and companies with advanced
R&D capabilities. Tijssen (2009) documented that pharmaceutical firms’ FDI investments
are driven towards regions with advanced research capabilities, a specialized science
base, good local universities, research institutes and science parks, and associated
possibilities to tap informal R&D networks. Another study by Abramovsky et al. (2007)
showed that R&D laboratories of foreign-owned pharmaceutical firms tend to be closely
located to highly rated academic departments. Pharmaceutical firms want to be located
close to centres of research excellence and research-intensive clusters as positive
externalities (e.g. knowledge spillovers) are highly localized and research collaborations
are stimulated when firms are located in close proximity. This also enables firms to
recruit highly skilled people from nearby universities or other firms.
16
As reported by Dachs et al. (2012), the top 5 countries in terms of outward greenfield
investments in the pharmaceutical industry over the period 2003-2011 are the United
States, Switzerland, United Kingdom, Germany and Ireland. During that time frame, the
United States is by far the dominant outward investor. US firms invested around 31% of
their projects in the EU-27 member states. These investments mainly flowed to Western-
European countries, as the EU-12 only received 4% of total outward US investments. In
the top 10 of outward investors, India appears on place 7. India has some strong
indigenous pharmaceutical firms such as Ranbaxy and Dr Reddy’s laboratories and these
firms are internationalizing rapidly. Other Asian countries are also gaining ground,
especially in the more recent years.
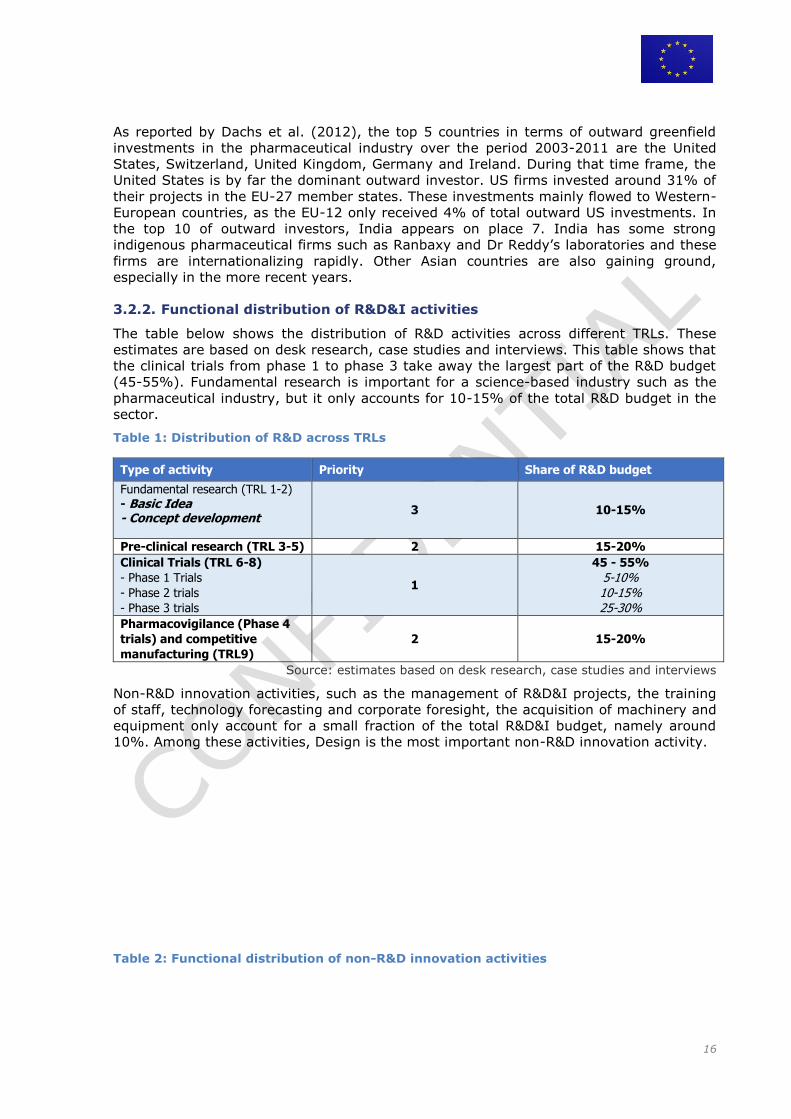
3.2.2. Functional distribution of R&D&I activities
The table below shows the distribution of R&D activities across different TRLs. These
estimates are based on desk research, case studies and interviews. This table shows that
the clinical trials from phase 1 to phase 3 take away the largest part of the R&D budget
(45-55%). Fundamental research is important for a science-based industry such as the
pharmaceutical industry, but it only accounts for 10-15% of the total R&D budget in the
sector.
Table 1: Distribution of R&D across TRLs
Type of activity Priority Share of R&D budget
Fundamental research (TRL 1-2) - Basic Idea - Concept development
3 10-15%
Pre-clinical research (TRL 3-5) 2 15-20%
Clinical Trials (TRL 6-8)
- Phase 1 Trials
- Phase 2 trials
- Phase 3 trials
1
45 - 55%
5-10% 10-15% 25-30%
Pharmacovigilance (Phase 4
trials) and competitive
manufacturing (TRL9)
2 15-20%
Source: estimates based on desk research, case studies and interviews
Non-R&D innovation activities, such as the management of R&D&I projects, the training
of staff, technology forecasting and corporate foresight, the acquisition of machinery and
equipment only account for a small fraction of the total R&D&I budget, namely around
10%. Among these activities, Design is the most important non-R&D innovation activity.
Table 2: Functional distribution of non-R&D innovation activities
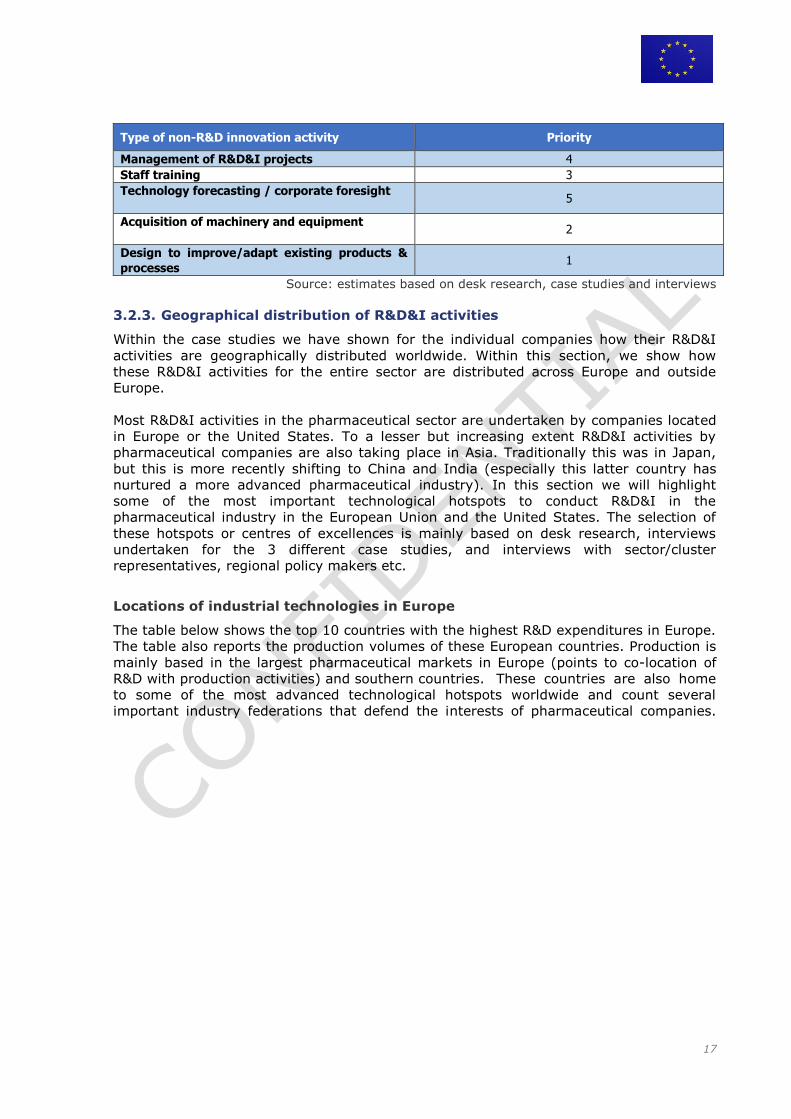
17
Type of non-R&D innovation activity Priority
Management of R&D&I projects 4
Staff training 3
Technology forecasting / corporate foresight
5
Acquisition of machinery and equipment
2
Design to improve/adapt existing products &
processes 1
Source: estimates based on desk research, case studies and interviews
3.2.3. Geographical distribution of R&D&I activities
Within the case studies we have shown for the individual companies how their R&D&I
activities are geographically distributed worldwide. Within this section, we show how
these R&D&I activities for the entire sector are distributed across Europe and outside
Europe.
Most R&D&I activities in the pharmaceutical sector are undertaken by companies located
in Europe or the United States. To a lesser but increasing extent R&D&I activities by
pharmaceutical companies are also taking place in Asia. Traditionally this was in Japan,
but this is more recently shifting to China and India (especially this latter country has
nurtured a more advanced pharmaceutical industry). In this section we will highlight
some of the most important technological hotspots to conduct R&D&I in the
pharmaceutical industry in the European Union and the United States. The selection of
these hotspots or centres of excellences is mainly based on desk research, interviews
undertaken for the 3 different case studies, and interviews with sector/cluster
representatives, regional policy makers etc.
Locations of industrial technologies in Europe
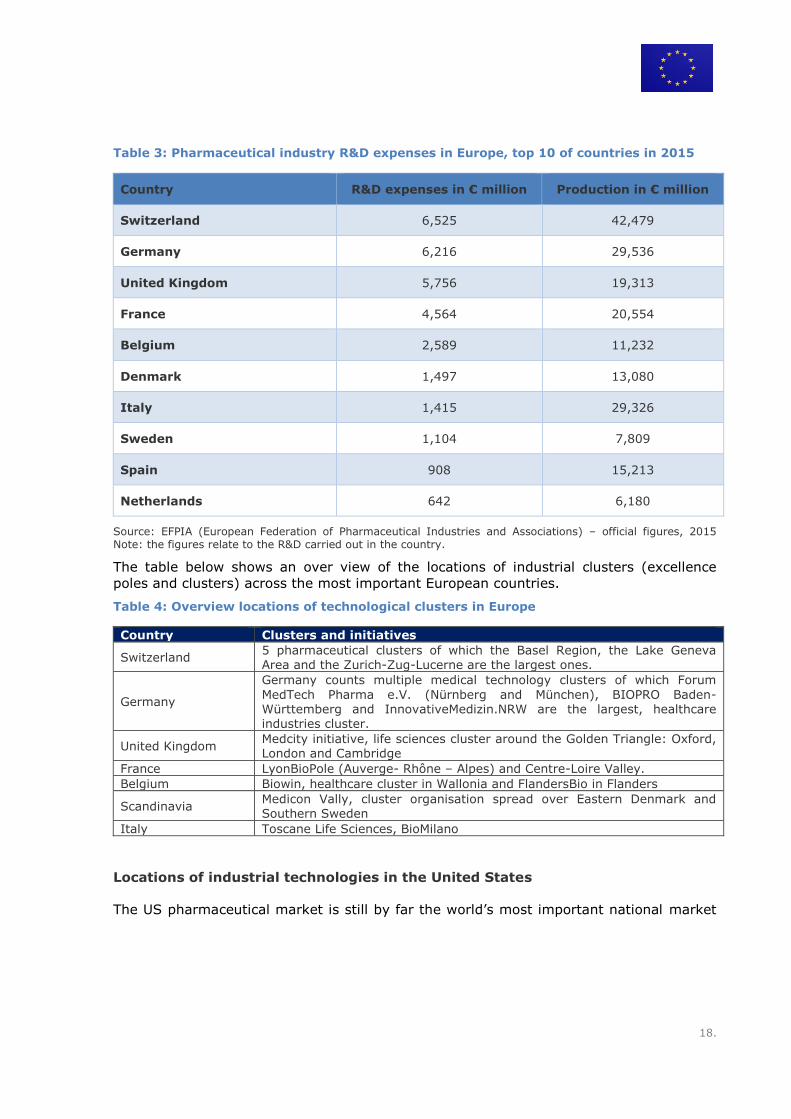
The table below shows the top 10 countries with the highest R&D expenditures in Europe.
The table also reports the production volumes of these European countries. Production is
mainly based in the largest pharmaceutical markets in Europe (points to co-location of
R&D with production activities) and southern countries. These countries are also home
to some of the most advanced technological hotspots worldwide and count several
important industry federations that defend the interests of pharmaceutical companies.
18.
Table 3: Pharmaceutical industry R&D expenses in Europe, top 10 of countries in 2015
Country R&D expenses in € million Production in € million
Switzerland 6,525 42,479
Germany 6,216 29,536
United Kingdom 5,756 19,313
France 4,564 20,554
Belgium 2,589 11,232
Denmark 1,497 13,080
Italy 1,415 29,326
Sweden 1,104 7,809
Spain 908 15,213
Netherlands 642 6,180
Source: EFPIA (European Federation of Pharmaceutical Industries and Associations) – official figures, 2015 Note: the figures relate to the R&D carried out in the country.
The table below shows an over view of the locations of industrial clusters (excellence
poles and clusters) across the most important European countries.
Table 4: Overview locations of technological clusters in Europe
Country Clusters and initiatives
Switzerland 5 pharmaceutical clusters of which the Basel Region, the Lake Geneva Area and the Zurich-Zug-Lucerne are the largest ones.
Germany
Germany counts multiple medical technology clusters of which Forum
MedTech Pharma e.V. (Nürnberg and München), BIOPRO Baden-Württemberg and InnovativeMedizin.NRW are the largest, healthcare industries cluster.
United Kingdom Medcity initiative, life sciences cluster around the Golden Triangle: Oxford, London and Cambridge
France LyonBioPole (Auverge- Rhône – Alpes) and Centre-Loire Valley.
Belgium Biowin, healthcare cluster in Wallonia and FlandersBio in Flanders
Scandinavia Medicon Vally, cluster organisation spread over Eastern Denmark and Southern Sweden
Italy Toscane Life Sciences, BioMilano
Locations of industrial technologies in the United States
The US pharmaceutical market is still by far the world’s most important national market
19
in terms of sales but also in terms of R&D&I activities3,4,5. It is documented that in 2016
North America accounted for 49% of world pharmaceutical sales compared with 21.5%
for Europe. Furthermore, according to IMS Health data (MIDAS May 2017), 64.7% of
sales of new medicines launched during the period 2011-2016 were on the US market,
compared with 17.5% on the European market6. In 2015, the US market reported close
to $ 50 billion R&D expenditures in the pharmaceutical industry. Several of the global top
pharmaceutical companies also have their origins in the United States. In 2016, 6 out of
the top 10 companies were from the United States when based on pure pharmaceutical
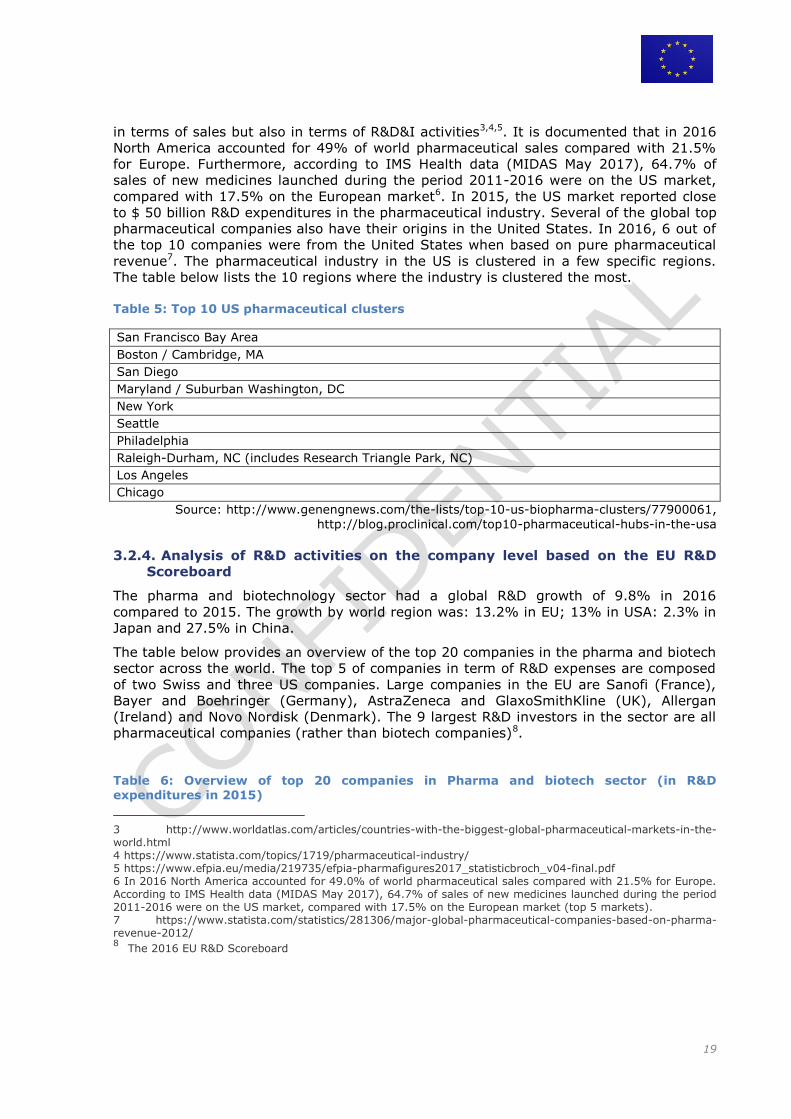
revenue7. The pharmaceutical industry in the US is clustered in a few specific regions.
The table below lists the 10 regions where the industry is clustered the most.
Table 5: Top 10 US pharmaceutical clusters
San Francisco Bay Area
Boston / Cambridge, MA
San Diego
Maryland / Suburban Washington, DC
New York
Seattle
Philadelphia
Raleigh-Durham, NC (includes Research Triangle Park, NC)
Los Angeles
Chicago
Source: http://www.genengnews.com/the-lists/top-10-us-biopharma-clusters/77900061,
http://blog.proclinical.com/top10-pharmaceutical-hubs-in-the-usa
3.2.4. Analysis of R&D activities on the company level based on the EU R&D
Scoreboard
The pharma and biotechnology sector had a global R&D growth of 9.8% in 2016
compared to 2015. The growth by world region was: 13.2% in EU; 13% in USA: 2.3% in
Japan and 27.5% in China.
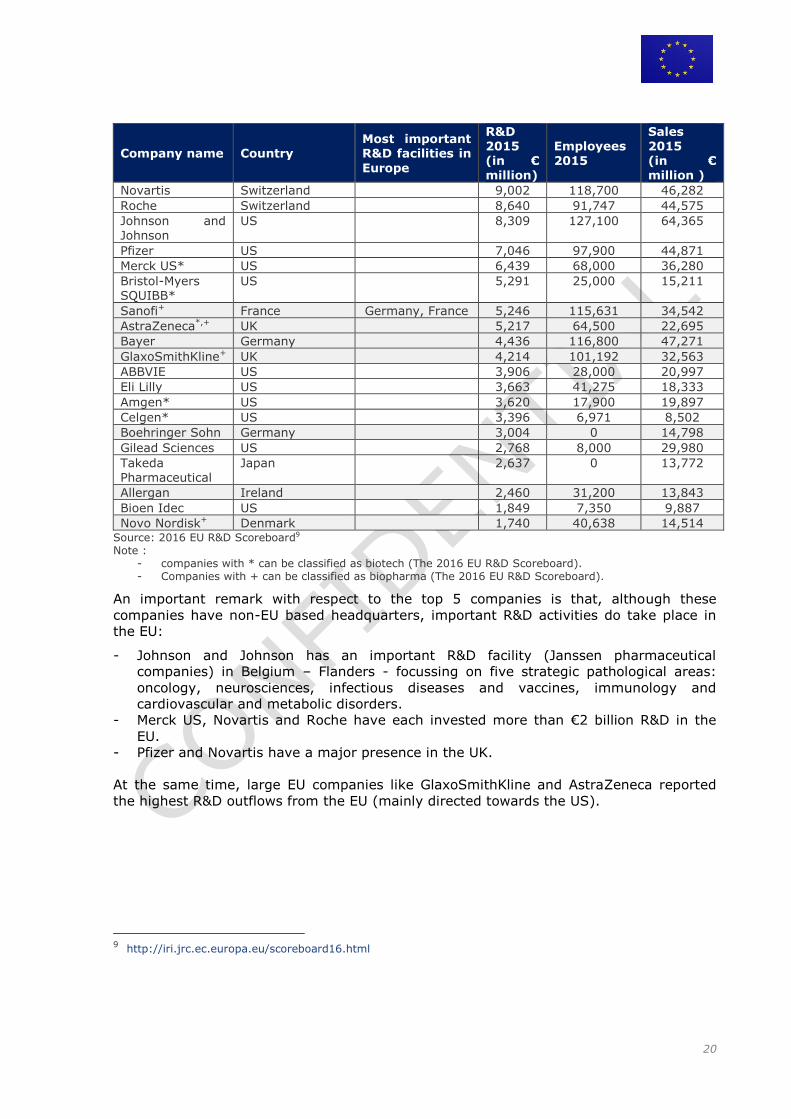
The table below provides an overview of the top 20 companies in the pharma and biotech
sector across the world. The top 5 of companies in term of R&D expenses are composed
of two Swiss and three US companies. Large companies in the EU are Sanofi (France),
Bayer and Boehringer (Germany), AstraZeneca and GlaxoSmithKline (UK), Allergan
(Ireland) and Novo Nordisk (Denmark). The 9 largest R&D investors in the sector are all
pharmaceutical companies (rather than biotech companies)8.
Table 6: Overview of top 20 companies in Pharma and biotech sector (in R&D expenditures in 2015)
3 http://www.worldatlas.com/articles/countries-with-the-biggest-global-pharmaceutical-markets-in-the-world.html 4 https://www.statista.com/topics/1719/pharmaceutical-industry/ 5 https://www.efpia.eu/media/219735/efpia-pharmafigures2017_statisticbroch_v04-final.pdf 6 In 2016 North America accounted for 49.0% of world pharmaceutical sales compared with 21.5% for Europe. According to IMS Health data (MIDAS May 2017), 64.7% of sales of new medicines launched during the period 2011-2016 were on the US market, compared with 17.5% on the European market (top 5 markets).
7 https://www.statista.com/statistics/281306/major-global-pharmaceutical-companies-based-on-pharma-revenue-2012/ 8 The 2016 EU R&D Scoreboard
20
Company name Country Most important R&D facilities in
Europe
R&D 2015 (in € million)
Employees 2015
Sales 2015 (in € million )
Novartis Switzerland 9,002 118,700 46,282
Roche Switzerland 8,640 91,747 44,575
Johnson and Johnson
US 8,309 127,100 64,365
Pfizer US 7,046 97,900 44,871
Merck US* US 6,439 68,000 36,280
Bristol-Myers SQUIBB*
US 5,291 25,000 15,211
Sanofi+ France Germany, France 5,246 115,631 34,542
AstraZeneca*,+ UK 5,217 64,500 22,695
Bayer Germany 4,436 116,800 47,271
GlaxoSmithKline+ UK 4,214 101,192 32,563
ABBVIE US 3,906 28,000 20,997
Eli Lilly US 3,663 41,275 18,333
Amgen* US 3,620 17,900 19,897
Celgen* US 3,396 6,971 8,502
Boehringer Sohn Germany 3,004 0 14,798
Gilead Sciences US 2,768 8,000 29,980
Takeda Pharmaceutical
Japan 2,637 0 13,772
Allergan Ireland 2,460 31,200 13,843
Bioen Idec US 1,849 7,350 9,887
Novo Nordisk+ Denmark 1,740 40,638 14,514 Source: 2016 EU R&D Scoreboard9 Note :
- companies with * can be classified as biotech (The 2016 EU R&D Scoreboard). - Companies with + can be classified as biopharma (The 2016 EU R&D Scoreboard).
An important remark with respect to the top 5 companies is that, although these
companies have non-EU based headquarters, important R&D activities do take place in
the EU:
- Johnson and Johnson has an important R&D facility (Janssen pharmaceutical
companies) in Belgium – Flanders - focussing on five strategic pathological areas:
oncology, neurosciences, infectious diseases and vaccines, immunology and
cardiovascular and metabolic disorders.
- Merck US, Novartis and Roche have each invested more than €2 billion R&D in the
EU.
- Pfizer and Novartis have a major presence in the UK.
At the same time, large EU companies like GlaxoSmithKline and AstraZeneca reported
the highest R&D outflows from the EU (mainly directed towards the US).
9 http://iri.jrc.ec.europa.eu/scoreboard16.html
21
Automotive sector 3.3.
3.3.1. Literature review
Within the mobility industry, we focus on the automotive and the aerospace industry.
Both industries are some of the most important sectors in the EU, supporting millions of
jobs, generating major added value, and investing heavily in R&D. This section focuses
on the automotive sectors. Section x will illustrate the aerospace industry.
According to the European Automobile Manufacturers’ Association (ACEA, 2014)10, the
European automotive industry supports 13 million jobs in Europe directly and indirectly,
is responsible for €32 billion in annual R&D investment, and contributes €95.7 billion in
net exports to the EU economy. Investment in research, development and innovation
(R&D&I) is vital for the competitiveness of the European automotive industry. It has
been documented that the European automobile industry invests €44.7 billion in R&D
annually, about 5% of its total industry turnover (ACEA, 2016)11. At least 80% of these
R&D expenditures go to product innovation, while the remaining 10-20% flow to process
innovation activities (Europe Innova, 2012). Furthermore, it has been documented that
only a small portion of this R&D funding is committed to conducting pure research
(between 3% and 13%).
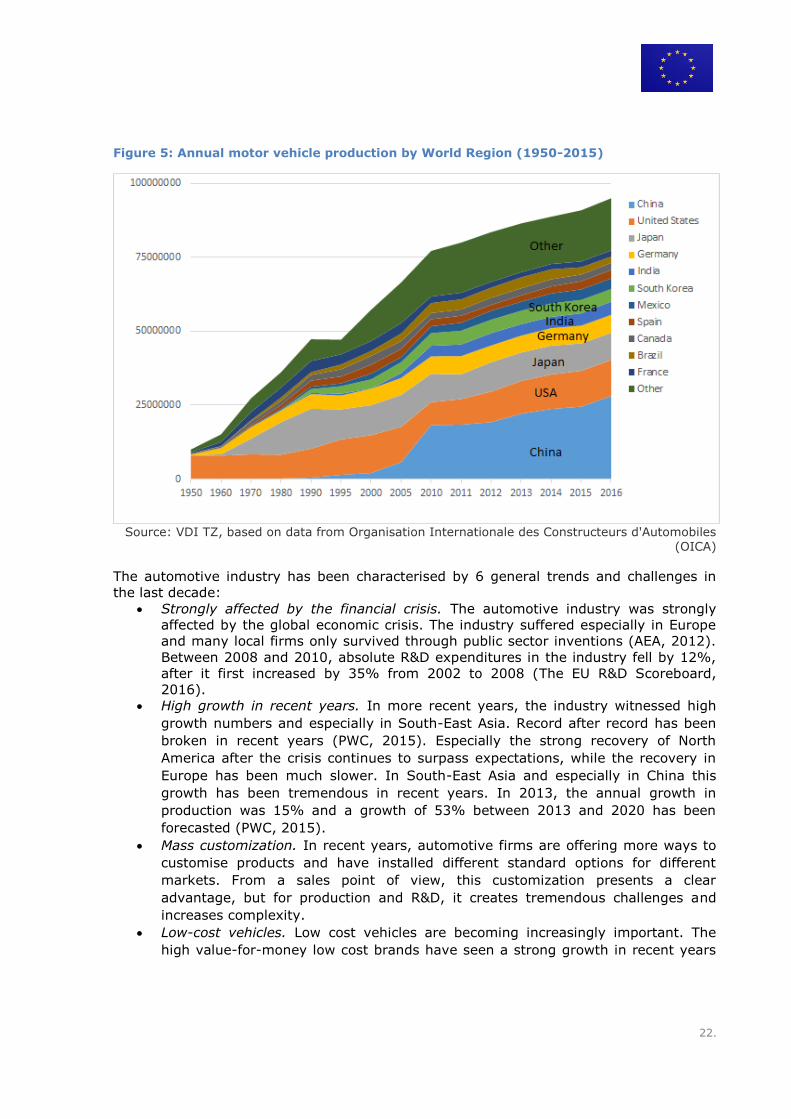
Much of R&D in the automotive industry is still based in Europe, the United States and
Japan. In terms of production emerging economics are playing a bigger role. In 2016
global motor vehicle production reached a value of almost 95 million vehicles12. More
than 30% (over 28 million units) were produced in China. China is followed by the United
States (12.1 million units) and Japan (9.2 million units). The importance of China in
motor vehicle production has significantly increased since 2005 (see ). At the same time
the role of traditional large producer companies like USA, Japan and Germany in
relatively constant. The next pages will discuss if similar developments are likely to be
seen in the R&D sector.
10 ACEA (2014) - Auto industry contributes to Council discussions on EU’s future climate and energy policy. 11 ACEA (2015) - Research and Innovation. http://www.acea.be/industry-topics/tag/category/research-and-
innovation 12 Organisation Internationale des Constructeurs d'Automobiles (OICA)
22.
Figure 5: Annual motor vehicle production by World Region (1950-2015)
Source: VDI TZ, based on data from Organisation Internationale des Constructeurs d'Automobiles (OICA)
The automotive industry has been characterised by 6 general trends and challenges in
the last decade:
Strongly affected by the financial crisis. The automotive industry was strongly
affected by the global economic crisis. The industry suffered especially in Europe
and many local firms only survived through public sector inventions (AEA, 2012).
Between 2008 and 2010, absolute R&D expenditures in the industry fell by 12%,
after it first increased by 35% from 2002 to 2008 (The EU R&D Scoreboard,
2016).
High growth in recent years. In more recent years, the industry witnessed high
growth numbers and especially in South-East Asia. Record after record has been
broken in recent years (PWC, 2015). Especially the strong recovery of North
America after the crisis continues to surpass expectations, while the recovery in
Europe has been much slower. In South-East Asia and especially in China this
growth has been tremendous in recent years. In 2013, the annual growth in
production was 15% and a growth of 53% between 2013 and 2020 has been
forecasted (PWC, 2015).
Mass customization. In recent years, automotive firms are offering more ways to
customise products and have installed different standard options for different
markets. From a sales point of view, this customization presents a clear
advantage, but for production and R&D, it creates tremendous challenges and
increases complexity.
Low-cost vehicles. Low cost vehicles are becoming increasingly important. The
high value-for-money low cost brands have seen a strong growth in recent years
23
and it is expected that about 10% of all automobiles sold in Europe, China and
India will be situated in that product group (AEA, 2012).
Stricter regulations. In order to ensure the overall quality of automobiles and to
make them more environmental friendly, governments have increased regulatory
requirements. More specifically, regulatory requirements are getting stricter and
stricter in terms of emissions, fuel efficiency, software, reliability and product
safety. This necessitate further R&D investments and leads to increasing costs.
Connected and intelligent cars. In the automotive industry, there is an increasing
use of electronic software and a clear trend towards ‘connected and intelligent
cars’. In recent years, software content accounts to an increasing portion of
features offered by cars. Embedded devices and software are increasingly used to
expand the capabilities of cars (e.g. infotainment systems, autonomous parking
and driving, etc). The so-called ‘connected car’ refers to a fully digitized vehicle
equipped with Wi-Fi, advanced infotainment systems and apps, and vehicle-to-
vehicle communication systems. The intelligent car refers to an autonomous
vehicle, which can also take over control in case of danger. It is estimated that
around 15% of new cars sold in 2030 could be fully autonomous (McKinsey,
2016).
These trends make that the automotive industry faces unprecedented challenges.
Automotive manufacturers and suppliers are confronted with ever greater complexity
caused by transforming customer expectations, shortened technology cycles, stricter
regulations, increasing pressure to innovate, and global supply networks. These
pressures and challenges have led to a strong outsourcing and consolidation trends. The
remarkable growth in emerging markets have also led to an increasing offshoring to
these markets.
3.3.2. Functional description of the R&D&I value chain
The following table gives a rough estimate of the business expenditures within the
automotive sector as well as R&D personnel. During various interviews with experts from
two different global companies of the automotive sector, the relevance of the different
innovation activities within their business was discussed. Based on these discussions,
estimated on the overall share for the different R&D activities could be made.
In a second step, based on the 2016 EU R&D Scoreboard, the sector size was estimated.
For the automotive sector all companies of the sector “Automobiles & Parts” were
combined.
24.
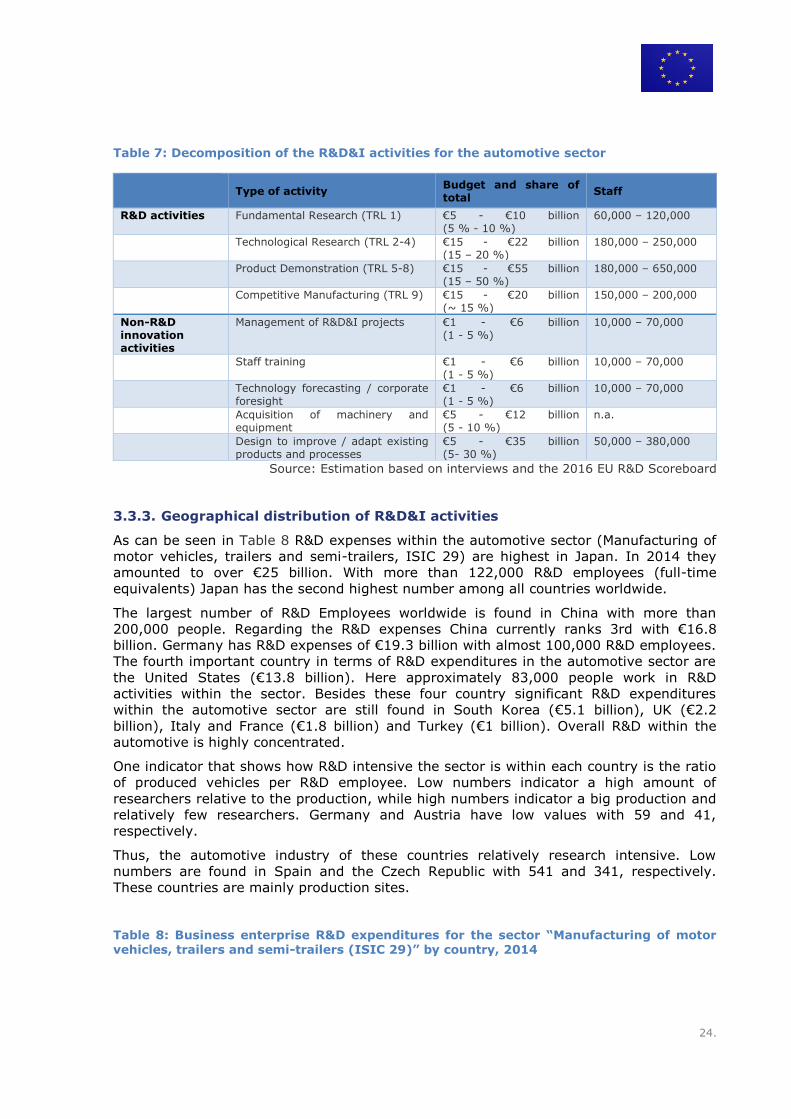
Table 7: Decomposition of the R&D&I activities for the automotive sector
Type of activity
Budget and share of total
Staff
R&D activities Fundamental Research (TRL 1) €5 - €10 billion (5 % - 10 %)
60,000 – 120,000
Technological Research (TRL 2-4) €15 - €22 billion (15 – 20 %)
180,000 – 250,000
Product Demonstration (TRL 5-8) €15 - €55 billion (15 – 50 %)
180,000 – 650,000
Competitive Manufacturing (TRL 9) €15 - €20 billion (~ 15 %)
150,000 – 200,000
Non-R&D innovation activities
Management of R&D&I projects €1 - €6 billion (1 - 5 %)
10,000 – 70,000
Staff training €1 - €6 billion (1 - 5 %)
10,000 – 70,000
Technology forecasting / corporate foresight
€1 - €6 billion (1 - 5 %)
10,000 – 70,000
Acquisition of machinery and equipment
€5 - €12 billion (5 - 10 %)
n.a.
Design to improve / adapt existing products and processes
€5 - €35 billion (5- 30 %)
50,000 – 380,000
Source: Estimation based on interviews and the 2016 EU R&D Scoreboard
3.3.3. Geographical distribution of R&D&I activities
As can be seen in Table 8 R&D expenses within the automotive sector (Manufacturing of
motor vehicles, trailers and semi-trailers, ISIC 29) are highest in Japan. In 2014 they
amounted to over €25 billion. With more than 122,000 R&D employees (full-time
equivalents) Japan has the second highest number among all countries worldwide.
The largest number of R&D Employees worldwide is found in China with more than
200,000 people. Regarding the R&D expenses China currently ranks 3rd with €16.8
billion. Germany has R&D expenses of €19.3 billion with almost 100,000 R&D employees.
The fourth important country in terms of R&D expenditures in the automotive sector are
the United States (€13.8 billion). Here approximately 83,000 people work in R&D
activities within the sector. Besides these four country significant R&D expenditures
within the automotive sector are still found in South Korea (€5.1 billion), UK (€2.2
billion), Italy and France (€1.8 billion) and Turkey (€1 billion). Overall R&D within the
automotive is highly concentrated.
One indicator that shows how R&D intensive the sector is within each country is the ratio
of produced vehicles per R&D employee. Low numbers indicator a high amount of
researchers relative to the production, while high numbers indicator a big production and
relatively few researchers. Germany and Austria have low values with 59 and 41,
respectively.
Thus, the automotive industry of these countries relatively research intensive. Low
numbers are found in Spain and the Czech Republic with 541 and 341, respectively.
These countries are mainly production sites.
Table 8: Business enterprise R&D expenditures for the sector “Manufacturing of motor vehicles, trailers and semi-trailers (ISIC 29)” by country, 2014
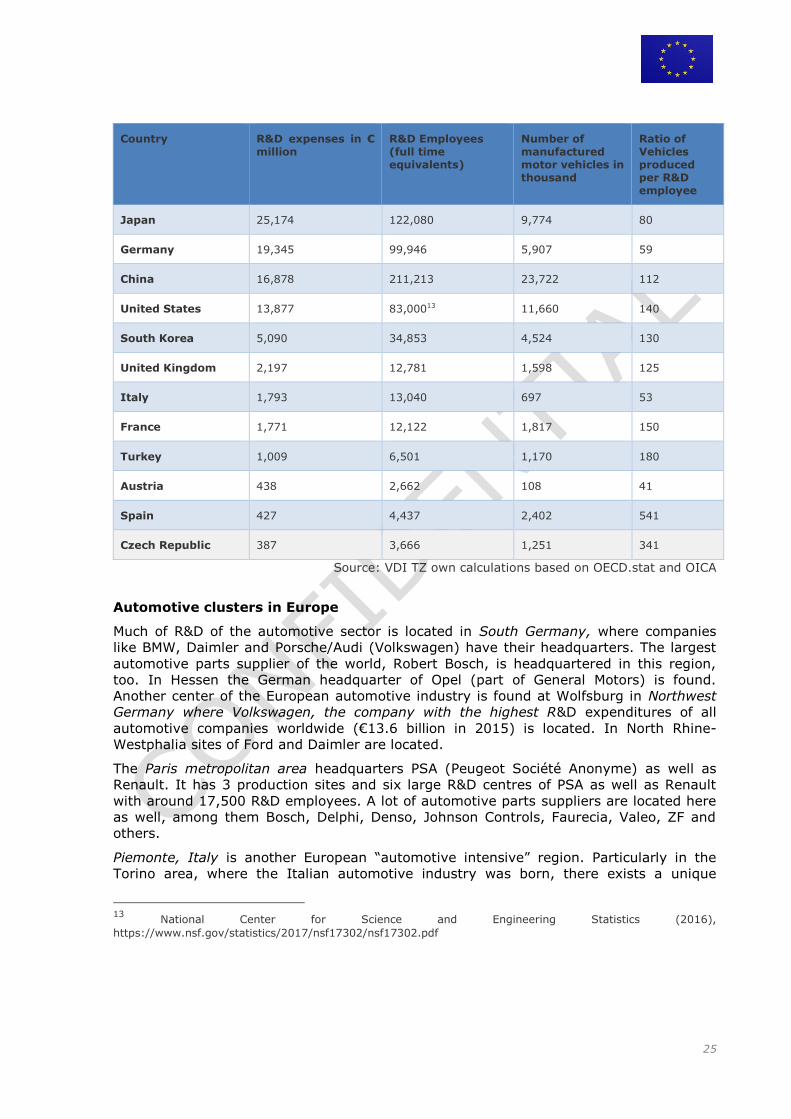
25
Country R&D expenses in € million
R&D Employees (full time equivalents)
Number of manufactured motor vehicles in thousand
Ratio of Vehicles produced per R&D employee
Japan 25,174 122,080 9,774 80
Germany 19,345 99,946 5,907 59
China 16,878 211,213 23,722 112
United States 13,877 83,00013 11,660 140
South Korea 5,090 34,853 4,524 130
United Kingdom 2,197 12,781 1,598 125
Italy 1,793 13,040 697 53
France 1,771 12,122 1,817 150
Turkey 1,009 6,501 1,170 180
Austria 438 2,662 108 41
Spain 427 4,437 2,402 541
Czech Republic 387 3,666 1,251 341
Source: VDI TZ own calculations based on OECD.stat and OICA
Automotive clusters in Europe
Much of R&D of the automotive sector is located in South Germany, where companies
like BMW, Daimler and Porsche/Audi (Volkswagen) have their headquarters. The largest
automotive parts supplier of the world, Robert Bosch, is headquartered in this region,
too. In Hessen the German headquarter of Opel (part of General Motors) is found.
Another center of the European automotive industry is found at Wolfsburg in Northwest
Germany where Volkswagen, the company with the highest R&D expenditures of all
automotive companies worldwide (€13.6 billion in 2015) is located. In North Rhine-
Westphalia sites of Ford and Daimler are located.
The Paris metropolitan area headquarters PSA (Peugeot Société Anonyme) as well as
Renault. It has 3 production sites and six large R&D centres of PSA as well as Renault
with around 17,500 R&D employees. A lot of automotive parts suppliers are located here
as well, among them Bosch, Delphi, Denso, Johnson Controls, Faurecia, Valeo, ZF and
others.
Piemonte, Italy is another European “automotive intensive” region. Particularly in the
Torino area, where the Italian automotive industry was born, there exists a unique
13 National Center for Science and Engineering Statistics (2016),
https://www.nsf.gov/statistics/2017/nsf17302/nsf17302.pdf
26
concentration of expertise and skills. All automotive sectors are found: cars, light and
heavy commercial vehicles, buses and earthmoving machines. The biggest Italian
automotive company is FIAT, headquartered at Torino.
Spain is among the largest automobile producers in the world. In in all, 13 factories are
located in Spain, which are supported by a vital local car components industry
(Volkswagen incl. SEAT, PSA, Daimler, Ford, General Motors, Nissan, Renault).
Other large production sites are located in England (Nissan UK, Toyota, General Motors,
(e.g. Vauxhall Motors), Jaguar Land Rover (part of Tata) and Ford. The England
automotive cluster holds some important sites of premium and sports car brands such as
Aston Martin, Bentley, Caterham Cars, Daimler, Jaguar, Lagonda, Land Rover, Lister
Cars, Lotus, McLaren, MG, Mini, Morgan and Rolls-Royce.
The automotive industry in Sweden is mainly associated with passenger car manufacturer
Volvo Cars. Besides that Sweden is home to two large truck manufacturers: Volvo AB and
Scania AB Volvo.
While many of the above clusters have significant R&D activities, automotive clusters in
Eastern Europe tend to be more focused on manufacturing. These clusters include the
Czech Republic, which is as one of the leading European centres for automotive-related
design and R&D activity. Besides Škoda (subsidiary of Volkswagen the truck and bus
producer Tatra, the Italian truck producer Iveco and the Czech bus manufacturer SOR
Libcha are located in the country as well as the Korean car producer Hyundai. Slovakia
has been the world's largest producer of cars per capita in recent years with production
plants of Volkswagen, PSA, Kia Motors as well as Jaguar Land Rover. The automobile
industry in Poland makes up a sizeable part of the Polish economy, accounting for more
than percent of countries’ industrial production. Major international companies with
significant presence in the Polish automotive sector include Fiat, Opel, Toyota,
Volkswagen, MAN, Solaris, Volvo and Scania. In Hungary there exist large assembly
capacities of Daimler, Suzuki, Audi and Opel in the country. An important manufacturer
headquartered in Romania is Dacia. Many other manufacturers are found in the country
like DAC, Ford Romania, Astra, DAC and Cibro and Robert Bosch.
Automotive clusters worldwide
The heart of the American automotive industry can be found at the Detroit metropolitan
area. The Ford Motor company is the largest employer with over 44,000 employees and
multiple R&D and production sites. The General Motors headquarter is found here, too.
Both companies have a variety of R&D and production sites in the area. Michigan also
hosts R&D sites of Daimler and Toyota. Other companies include Hyundai, Madza and
Robert Bosch.
Although California and Silicon Valley are not traditional hotspots of the automotive
industry, this has changed in recent years. Computer hardware and software as well as
modern IC technology are getting more and more relevant for modern vehicles and the
trend indicates that these technology will further merge together in vehicles. Google
began its work on self-driving vehicles back in 2009, in 2017 Apple has begun its tests on
self-driving vehicles. California is also a very relevant region for electromobility and
hosts the headquarters of Tesla. Many traditional automotive companies have R&D and
production activities in the region, too (e.g. Bosch, Daimler, Ford, Honda, Hyundai Kia
Motors, Madza and BMW).
Japan has the highest R&D expenditures in the automotive industry worldwide, in the
country has a leading role in the field of fuel cell. Most of these activities are
27
concentrated in the Tokyo metropolitan area. The largest automotive company of the
world, Toyota, is headquartered here. Honda, Nissan and Mazda have their headquarters
in Japan and foreign companies like BMW, Daimler and General Motors have important
facilities in the country.
In China joint ventures of global vehicle manufacturers with local Chinese manufacturers
are very common. Volkswagen was the first foreign partner for the Chinese manufacturer
First Automotive Works (FAW), but others soon followed. The eastern region (Beijing,
Shanghai, Shandong byland) as well as the Guangzhou metropolitan are important
automotive clusters in the country. Companies having joint ventures include Volkswagen,
Hyundai, Toyota, Nissan, PSA, Daimler, BMW. Large automotive companies like Daimler,
BMW, Mazda and Ford have R&D centers in the country.
India has two large automotive clusters, the Mumbai-Pune region and the Bangalore-
Chennai cluster. Here sites of Skoda, Audi, Daimler, General Motors, Nissan, Renault,
Ford and Hyundai are located. A lot of production activities of these companies are
located in India. The R&D share of these activities is growing in the Bangalore region,
which has turned into a large ICT cluster in recent years.
The south East Region of Thailand can be regarded as one of the most important clusters
of the automotive industry with a strong focus on manufacturing engines and tires.
3.3.4. Analysis of R&D activities on the company level based on the EU R&D
Scoreboard
This section gives on overview of R&D activities of the main companies in the global
automotive industry. For clarity, the industry is separated into vehicle manufacturers and
suppliers of automotive parts. Overall the R&D expenditures of vehicle manufactures
amounted to about €80 billion in 2016. This is about 4.4 percent of the overall sales of
the vehicle manufacturers that reached more than €1.7 trillion in 2015.
The Volkswagen AG had the highest R&D expenditures with over €13 billion per annum
(see Figure 6). This makes up roughly 17 percent of all vehicle manufacturers’ R&D
expenditures worldwide. Volkswagen has several subsidiaries worldwide, among them
Audi, MAN, Porsche, SEAT, Skoda and Lamborghini, most of them operating worldwide.
At R&D intensity at Volkswagen is relatively high with 4.9 percent, the sales amount to
€213 billion, and the second largest sales of all vehicle manufacturers worldwide. The
headquarters of Volkswagen is found at Wolfsburg, Germany. The top position in the
industry is held by Toyota motor company with sales of €216 billion. R&D expenditures at
Toyota amount to €8 billion, the R&D intensity is 4 percent. Toyota is headquartered in
the city of Toyota, Japan. The company holds the subsidiaries Daihatsu and Hino and the
business unit Lexus.
General Motors is found at the third position with R&D expenditures of €6.9 billion. The
R&D intensity is relatively low with only 2.6 percent. Sales amount to roughly €140
billion. General Motors is headquartered in Detroit, Michigan, USA. The company has
several business units, among them Cadillac, Chevrolet, JieFang, Opel Holden,and
UzDaewoo. Some like JieFang and SAIC-GM focus on the Chinese market, Opel focuses
on the German market, Holden addresses Australian customers and UzDaewoo Russian
and Central Asian markets.
Daimler is found at the fourth position with R&D expenditures of €6.5 billion. In
differences to Toyota, Volkswagen and General motors, who all manufactured more than
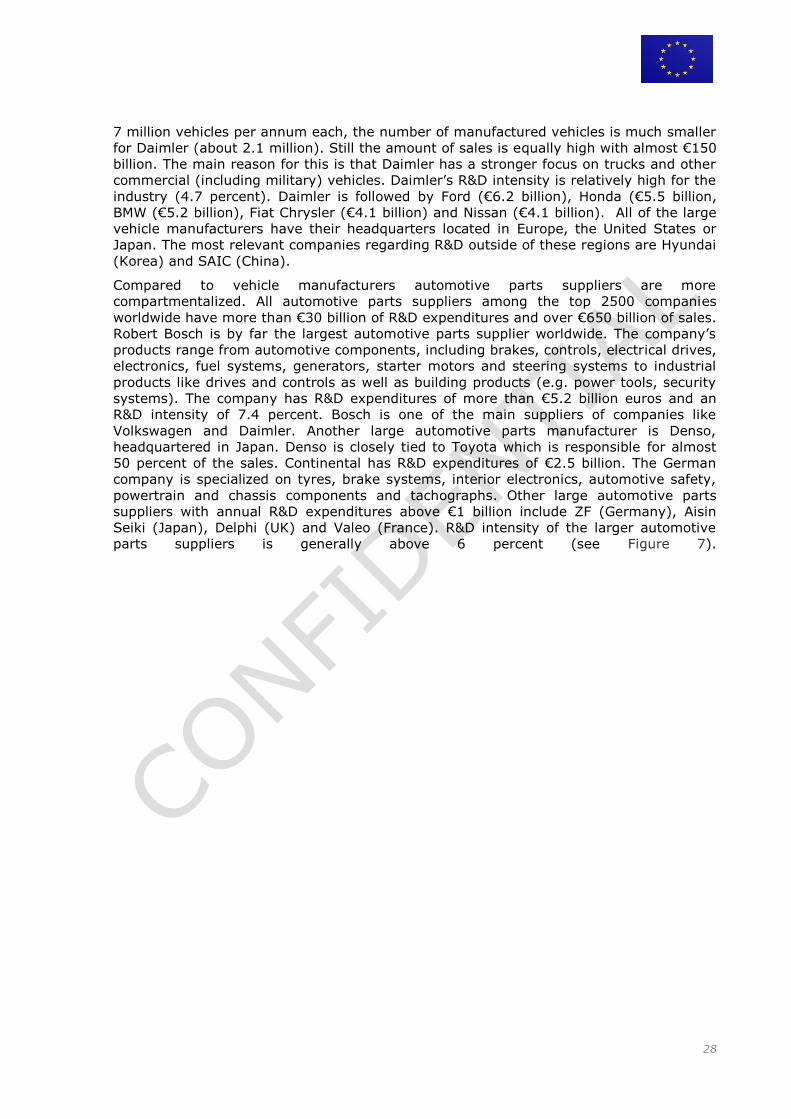
28
7 million vehicles per annum each, the number of manufactured vehicles is much smaller
for Daimler (about 2.1 million). Still the amount of sales is equally high with almost €150
billion. The main reason for this is that Daimler has a stronger focus on trucks and other
commercial (including military) vehicles. Daimler’s R&D intensity is relatively high for the
industry (4.7 percent). Daimler is followed by Ford (€6.2 billion), Honda (€5.5 billion,
BMW (€5.2 billion), Fiat Chrysler (€4.1 billion) and Nissan (€4.1 billion). All of the large
vehicle manufacturers have their headquarters located in Europe, the United States or
Japan. The most relevant companies regarding R&D outside of these regions are Hyundai
(Korea) and SAIC (China).
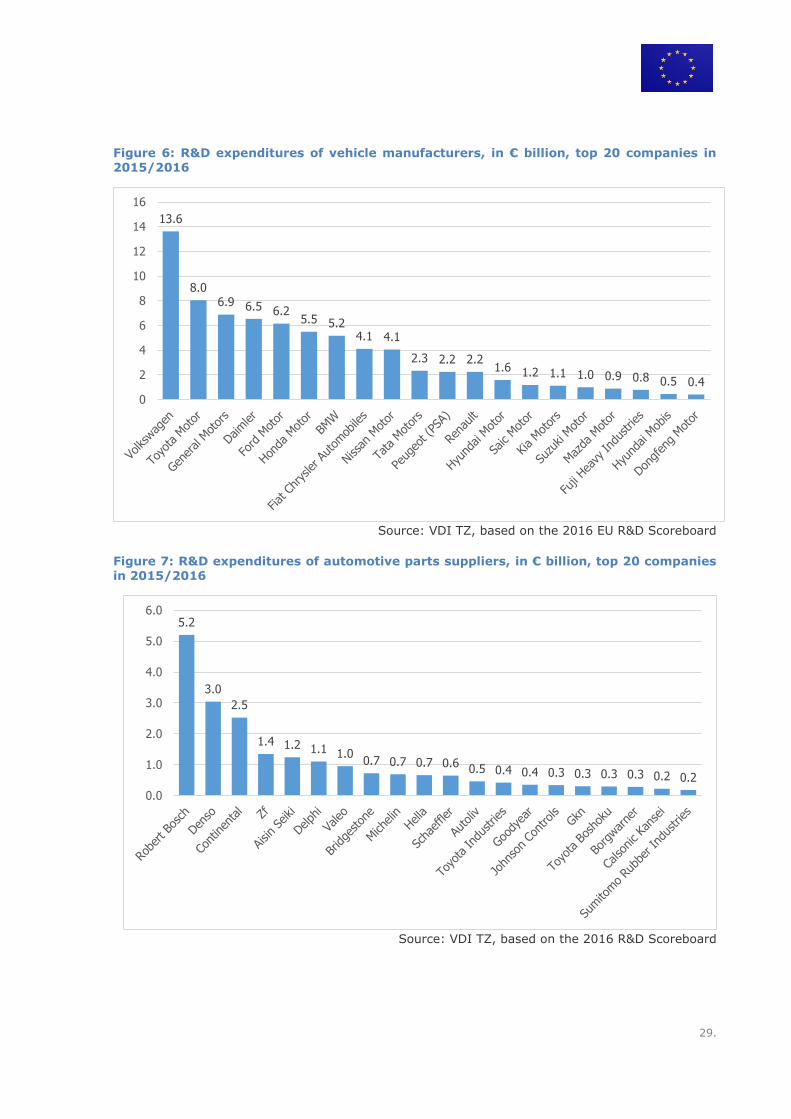
Compared to vehicle manufacturers automotive parts suppliers are more
compartmentalized. All automotive parts suppliers among the top 2500 companies
worldwide have more than €30 billion of R&D expenditures and over €650 billion of sales.
Robert Bosch is by far the largest automotive parts supplier worldwide. The company’s
products range from automotive components, including brakes, controls, electrical drives,
electronics, fuel systems, generators, starter motors and steering systems to industrial
products like drives and controls as well as building products (e.g. power tools, security
systems). The company has R&D expenditures of more than €5.2 billion euros and an
R&D intensity of 7.4 percent. Bosch is one of the main suppliers of companies like
Volkswagen and Daimler. Another large automotive parts manufacturer is Denso,
headquartered in Japan. Denso is closely tied to Toyota which is responsible for almost
50 percent of the sales. Continental has R&D expenditures of €2.5 billion. The German
company is specialized on tyres, brake systems, interior electronics, automotive safety,
powertrain and chassis components and tachographs. Other large automotive parts
suppliers with annual R&D expenditures above €1 billion include ZF (Germany), Aisin
Seiki (Japan), Delphi (UK) and Valeo (France). R&D intensity of the larger automotive
parts suppliers is generally above 6 percent (see Figure 7).
29.
Figure 6: R&D expenditures of vehicle manufacturers, in € billion, top 20 companies in 2015/2016
Source: VDI TZ, based on the 2016 EU R&D Scoreboard
Figure 7: R&D expenditures of automotive parts suppliers, in € billion, top 20 companies in 2015/2016
Source: VDI TZ, based on the 2016 R&D Scoreboard
13.6
8.0 6.9 6.5 6.2
5.5 5.2 4.1 4.1
2.3 2.2 2.2 1.6 1.2 1.1 1.0 0.9 0.8 0.5 0.4
0
2
4
6
8
10
12
14
16
5.2
3.0
2.5
1.4 1.2 1.1 1.0 0.7 0.7 0.7 0.6 0.5 0.4 0.4 0.3 0.3 0.3 0.3 0.2 0.2
0.0
1.0
2.0
3.0
4.0
5.0
6.0
30
Aerospace sector 3.4.
3.4.1. Literature review
In 2014, the aerospace industry employed more than 795,000 people and generated a
turnover of €199.4 billion (ASD, 2015)14. In the aerospace industry, R&D expenditures
are between 11% and 21% of industry turnover (dependent on the countries included in
the sample, this is between 3 and 6 times higher than the average reported by all
manufacturing firms (Europe Innova, 2012)).
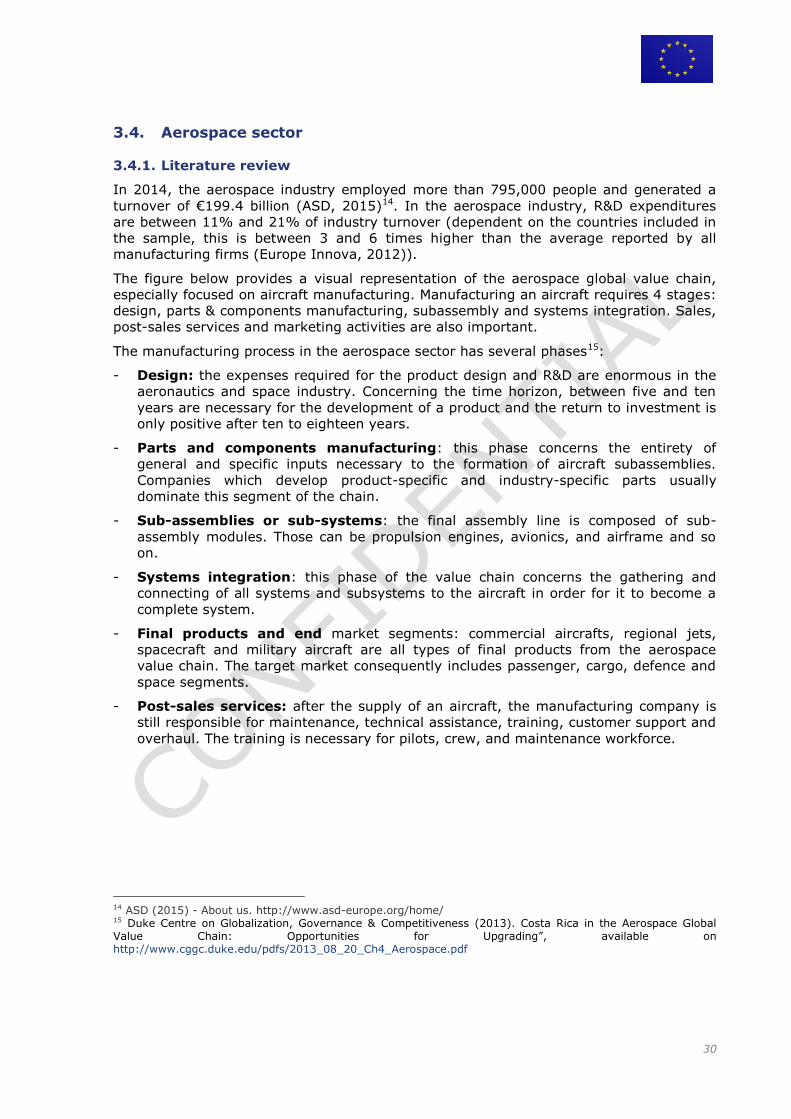
The figure below provides a visual representation of the aerospace global value chain,
especially focused on aircraft manufacturing. Manufacturing an aircraft requires 4 stages:
design, parts & components manufacturing, subassembly and systems integration. Sales,
post-sales services and marketing activities are also important.
The manufacturing process in the aerospace sector has several phases15:
- Design: the expenses required for the product design and R&D are enormous in the
aeronautics and space industry. Concerning the time horizon, between five and ten
years are necessary for the development of a product and the return to investment is
only positive after ten to eighteen years.
- Parts and components manufacturing: this phase concerns the entirety of
general and specific inputs necessary to the formation of aircraft subassemblies.
Companies which develop product-specific and industry-specific parts usually
dominate this segment of the chain.
- Sub-assemblies or sub-systems: the final assembly line is composed of sub-
assembly modules. Those can be propulsion engines, avionics, and airframe and so
on.
- Systems integration: this phase of the value chain concerns the gathering and
connecting of all systems and subsystems to the aircraft in order for it to become a
complete system.
- Final products and end market segments: commercial aircrafts, regional jets,
spacecraft and military aircraft are all types of final products from the aerospace
value chain. The target market consequently includes passenger, cargo, defence and
space segments.
- Post-sales services: after the supply of an aircraft, the manufacturing company is
still responsible for maintenance, technical assistance, training, customer support and
overhaul. The training is necessary for pilots, crew, and maintenance workforce.
14 ASD (2015) - About us. http://www.asd-europe.org/home/ 15 Duke Centre on Globalization, Governance & Competitiveness (2013). Costa Rica in the Aerospace Global Value Chain: Opportunities for Upgrading”, available on http://www.cggc.duke.edu/pdfs/2013_08_20_Ch4_Aerospace.pdf
31
Figure 8: Aerospace Global Value Chain
Source: Duke Centre on Globalization, Governance & Competitiveness (2013). Costa Rica in the Aerospace Global Value Chain: Opportunities for Upgrading”, available on
http://www.cggc.duke.edu/pdfs/2013_08_20_Ch4_Aerospace.pdf
3.4.2. Functional distribution of R&D&I activities
With regards to the functional distribution of R&D activities, and show approximate
figures on how the R&D budget is distributed across TRLs and R&D activities in large
aerospace companies. Interviews confirm that most of the activities are done in
demonstration phase. Fundamental research represents a very small share of the budget
and it is carried out mostly in collaboration with external partners (universities, research
centres, etc.). Non-R&D innovation activities, such as the management of R&D&I
projects, the training of staff, technology forecasting and corporate foresight, the
acquisition of machinery and equipment constitute a small fraction of the R&D budget:
around 10% of the total according to the interviewees.
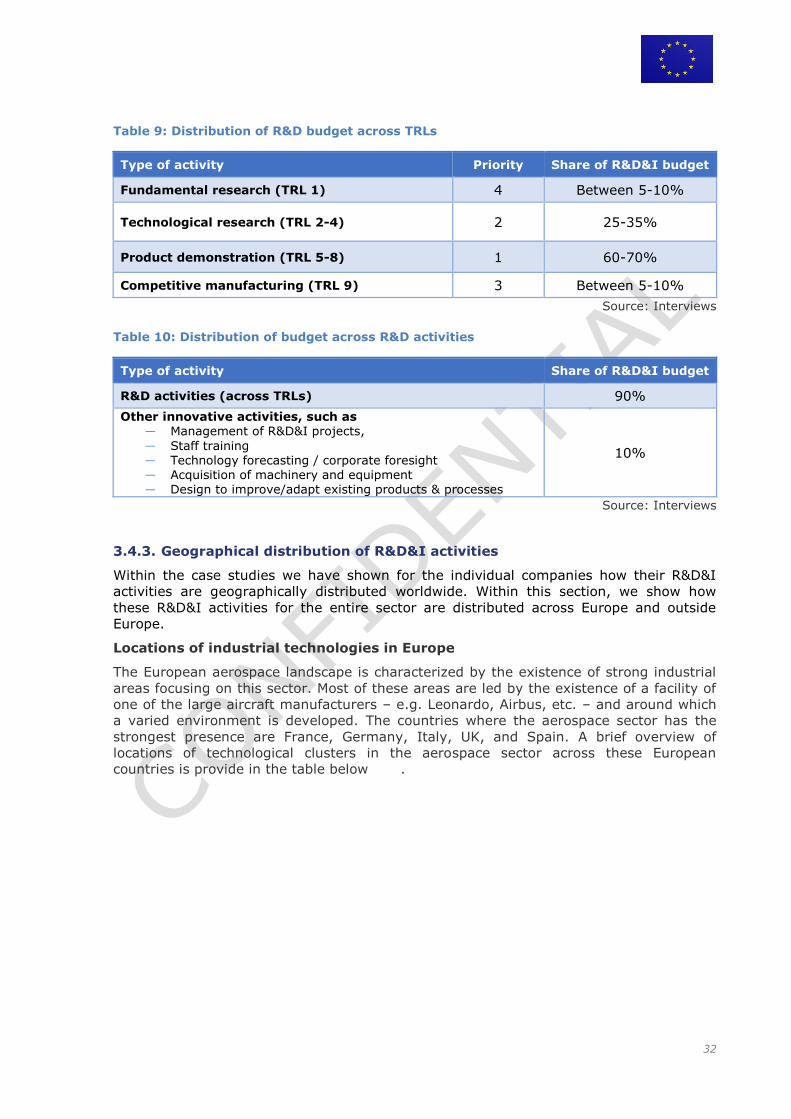
32
Table 9: Distribution of R&D budget across TRLs
Type of activity Priority Share of R&D&I budget
Fundamental research (TRL 1) 4 Between 5-10%
Technological research (TRL 2-4) 2 25-35%
Product demonstration (TRL 5-8) 1 60-70%
Competitive manufacturing (TRL 9) 3 Between 5-10%
Source: Interviews Table 10: Distribution of budget across R&D activities
Type of activity Share of R&D&I budget
R&D activities (across TRLs) 90%
Other innovative activities, such as ― Management of R&D&I projects, ― Staff training ― Technology forecasting / corporate foresight ― Acquisition of machinery and equipment ― Design to improve/adapt existing products & processes
10%
Source: Interviews
3.4.3. Geographical distribution of R&D&I activities
Within the case studies we have shown for the individual companies how their R&D&I
activities are geographically distributed worldwide. Within this section, we show how
these R&D&I activities for the entire sector are distributed across Europe and outside
Europe.
Locations of industrial technologies in Europe
The European aerospace landscape is characterized by the existence of strong industrial
areas focusing on this sector. Most of these areas are led by the existence of a facility of
one of the large aircraft manufacturers – e.g. Leonardo, Airbus, etc. – and around which
a varied environment is developed. The countries where the aerospace sector has the
strongest presence are France, Germany, Italy, UK, and Spain. A brief overview of
locations of technological clusters in the aerospace sector across these European
countries is provide in the table below .
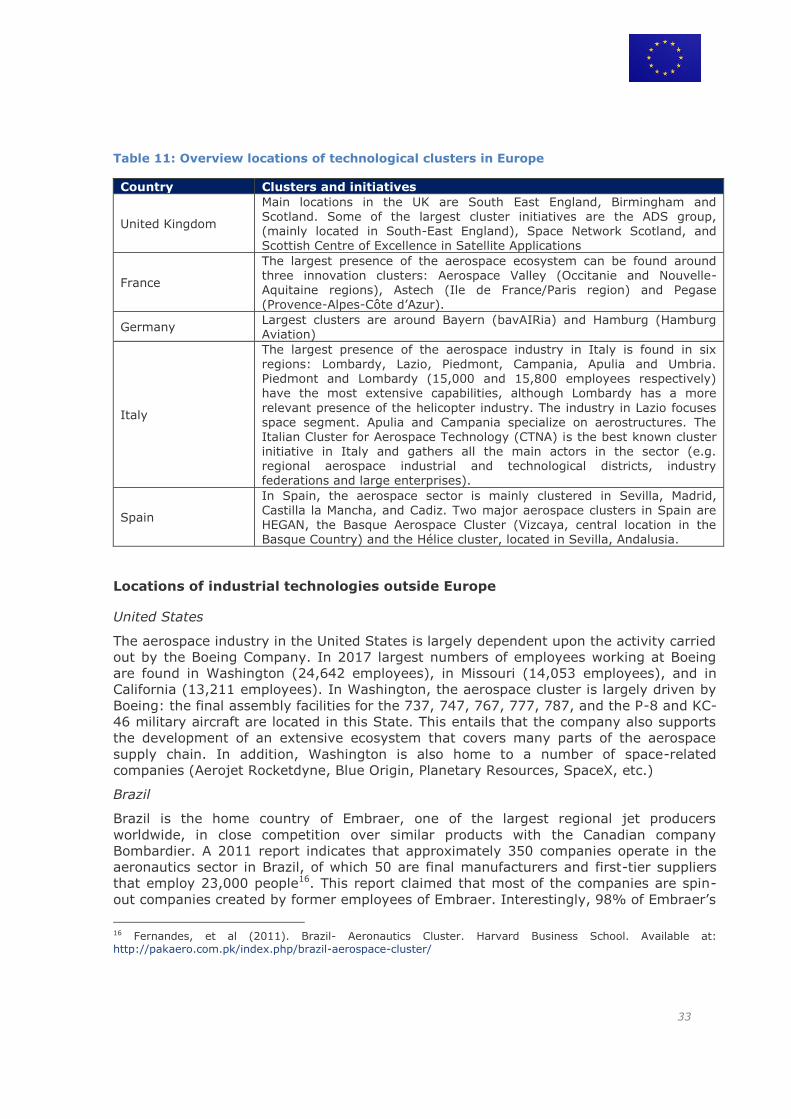
33
Table 11: Overview locations of technological clusters in Europe
Country Clusters and initiatives
United Kingdom
Main locations in the UK are South East England, Birmingham and Scotland. Some of the largest cluster initiatives are the ADS group, (mainly located in South-East England), Space Network Scotland, and Scottish Centre of Excellence in Satellite Applications
France
The largest presence of the aerospace ecosystem can be found around three innovation clusters: Aerospace Valley (Occitanie and Nouvelle-Aquitaine regions), Astech (Ile de France/Paris region) and Pegase (Provence-Alpes-Côte d’Azur).
Germany Largest clusters are around Bayern (bavAIRia) and Hamburg (Hamburg Aviation)
Italy
The largest presence of the aerospace industry in Italy is found in six
regions: Lombardy, Lazio, Piedmont, Campania, Apulia and Umbria. Piedmont and Lombardy (15,000 and 15,800 employees respectively) have the most extensive capabilities, although Lombardy has a more
relevant presence of the helicopter industry. The industry in Lazio focuses space segment. Apulia and Campania specialize on aerostructures. The Italian Cluster for Aerospace Technology (CTNA) is the best known cluster initiative in Italy and gathers all the main actors in the sector (e.g. regional aerospace industrial and technological districts, industry federations and large enterprises).
Spain
In Spain, the aerospace sector is mainly clustered in Sevilla, Madrid, Castilla la Mancha, and Cadiz. Two major aerospace clusters in Spain are HEGAN, the Basque Aerospace Cluster (Vizcaya, central location in the Basque Country) and the Hélice cluster, located in Sevilla, Andalusia.
Locations of industrial technologies outside Europe
United States
The aerospace industry in the United States is largely dependent upon the activity carried
out by the Boeing Company. In 2017 largest numbers of employees working at Boeing
are found in Washington (24,642 employees), in Missouri (14,053 employees), and in
California (13,211 employees). In Washington, the aerospace cluster is largely driven by
Boeing: the final assembly facilities for the 737, 747, 767, 777, 787, and the P-8 and KC-
46 military aircraft are located in this State. This entails that the company also supports
the development of an extensive ecosystem that covers many parts of the aerospace
supply chain. In addition, Washington is also home to a number of space-related
companies (Aerojet Rocketdyne, Blue Origin, Planetary Resources, SpaceX, etc.)
Brazil
Brazil is the home country of Embraer, one of the largest regional jet producers
worldwide, in close competition over similar products with the Canadian company
Bombardier. A 2011 report indicates that approximately 350 companies operate in the
aeronautics sector in Brazil, of which 50 are final manufacturers and first-tier suppliers
that employ 23,000 people16. This report claimed that most of the companies are spin-
out companies created by former employees of Embraer. Interestingly, 98% of Embraer’s
16 Fernandes, et al (2011). Brazil- Aeronautics Cluster. Harvard Business School. Available at: http://pakaero.com.pk/index.php/brazil-aerospace-cluster/
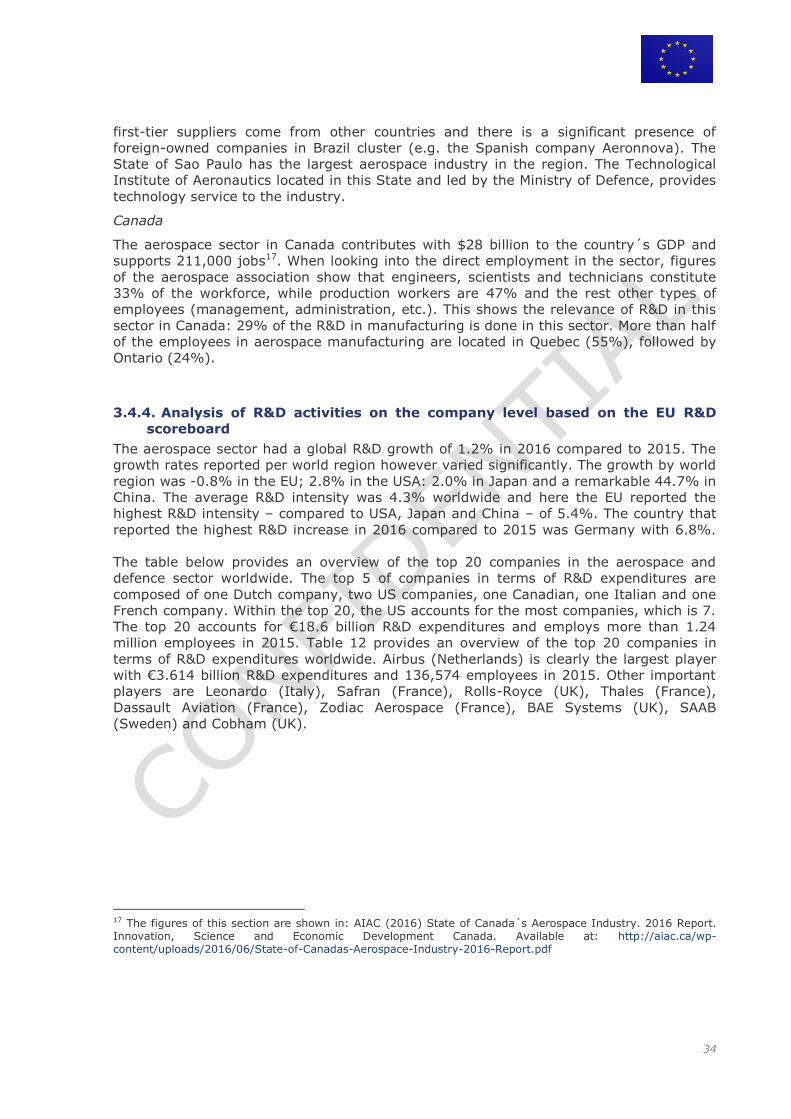
34
first-tier suppliers come from other countries and there is a significant presence of
foreign-owned companies in Brazil cluster (e.g. the Spanish company Aeronnova). The
State of Sao Paulo has the largest aerospace industry in the region. The Technological
Institute of Aeronautics located in this State and led by the Ministry of Defence, provides
technology service to the industry.
Canada
The aerospace sector in Canada contributes with $28 billion to the country´s GDP and
supports 211,000 jobs17. When looking into the direct employment in the sector, figures
of the aerospace association show that engineers, scientists and technicians constitute
33% of the workforce, while production workers are 47% and the rest other types of
employees (management, administration, etc.). This shows the relevance of R&D in this
sector in Canada: 29% of the R&D in manufacturing is done in this sector. More than half
of the employees in aerospace manufacturing are located in Quebec (55%), followed by
Ontario (24%).
3.4.4. Analysis of R&D activities on the company level based on the EU R&D
scoreboard
The aerospace sector had a global R&D growth of 1.2% in 2016 compared to 2015. The
growth rates reported per world region however varied significantly. The growth by world
region was -0.8% in the EU; 2.8% in the USA: 2.0% in Japan and a remarkable 44.7% in
China. The average R&D intensity was 4.3% worldwide and here the EU reported the
highest R&D intensity – compared to USA, Japan and China – of 5.4%. The country that
reported the highest R&D increase in 2016 compared to 2015 was Germany with 6.8%.
The table below provides an overview of the top 20 companies in the aerospace and
defence sector worldwide. The top 5 of companies in terms of R&D expenditures are
composed of one Dutch company, two US companies, one Canadian, one Italian and one
French company. Within the top 20, the US accounts for the most companies, which is 7.
The top 20 accounts for €18.6 billion R&D expenditures and employs more than 1.24
million employees in 2015. Table 12 provides an overview of the top 20 companies in
terms of R&D expenditures worldwide. Airbus (Netherlands) is clearly the largest player
with €3.614 billion R&D expenditures and 136,574 employees in 2015. Other important
players are Leonardo (Italy), Safran (France), Rolls-Royce (UK), Thales (France),
Dassault Aviation (France), Zodiac Aerospace (France), BAE Systems (UK), SAAB
(Sweden) and Cobham (UK).
17 The figures of this section are shown in: AIAC (2016) State of Canada´s Aerospace Industry. 2016 Report. Innovation, Science and Economic Development Canada. Available at: http://aiac.ca/wp-content/uploads/2016/06/State-of-Canadas-Aerospace-Industry-2016-Report.pdf
35
Table 12: Overview of top 20 companies in aerospace and defence, worldwide
World rank Company name Country R&D 2015 (in € million)
Employees 2015
Sales 2015 (in € million)
38 AIRBUS The Netherlands 3,614 136,574 64,450
45 BOEING US 2,796.915 161,400 88,283.31
61 UNITED TECHNOLOGIES US 2,231.102 197,000 51,527.53
80 BOMBARDIER Canada 1,647.838 66,950 16,691.47
99 LEONARDO - FINMECCANICA Italy 1,373 47,156 12,995
114 SAFRAN France 1,191 70,087 18,100
137 ROLLS-ROYCE UK 1,003.179 50,500 18,682
172 LOCKHEED MARTIN US 770.6442 126,000 42,373.49
184 TEXTRON US 714.614 35,000 12,329.39
232 THALES France 553.5 61,848 14,063.2
284 EMBRAER Brazil 405.8971 0 4,776.324
287 DASSAULT AVIATION France 404.238 11,984 4,175.805
322 GENERAL DYNAMICS US 362.8182 99,900 28,905.13
349 ZODIAC AEROSPACE France 334.199 32,388 4,931.754
418 BE AEROSPACE US 252.0438 10,057 2,507.211
422
ROCKWELL
COLLINS US 249.8394 19,500 4,816.756
434 BAE SYSTEMS UK 245.0099 75,000 22,849.89
467 ELBIT SYSTEMS Israel 223.5842 12,134 2,854.397
524 SAAB Sweden 192.1759 14,685 2,958.378
538 COBHAM UK 187.8409 12,527 2,820.336
Source: The 2016 EU R&D scoreboard
ICT sector 3.5.
3.5.1. Literature review
In 2010, the ICT sector value added amounted to €496 billion, representing about 4.0%
of the EU GDP. In 2010, the five largest economies were also the five biggest
contributors to the value added of the ICT sector: Germany, France and the United
Kingdom (€82-83 billion and 16-17%), Italy (€58 billion and 11.6%) and Spain (€37
billion and 7.4%). Together, those five countries represented 69% of the total European
value added of the ICT sector in 2010. Also in 2010, the ICT sector employed about 6.0
million people, with more than 4.0 million people in the ICT services segment, about 1.0
36
million people in the telecommunications segment and the remaining 1.0 million in the
ICT manufacturing industries and the communication equipment segment.18
ICT generates 25% of total business expenditure in Research and Development (R&D),
and investments in ICT account for 50% of all European productivity growth. EU
investments in ICTs are due to increase by about 25% under Horizon 2020 compared to
FP7. This EU investment will support the whole chain from basic research to innovation
that can deliver new business breakthroughs, often on the basis of emerging
technologies.19 In most OECD countries, the ICT sector accounts for the largest share of
business expenditures on research and development (BERD), amounting to almost 33%
of total BERD and 0.5% of GDP in most countries.
Overall, ICT industry and ICT-enabled innovation in non-ICT industries and services
make an important contribution to economic growth of advanced economies. In the EU,
the USA and Japan, the ICT sector is by far the largest R&D-investing sector of the
economy. The EU ICT sector is therefore a significant contributor to the ambition of
achieving the target of investing 3% of GDP in R&D in the EU. But, when comparing ICT
expenditures over GDP, the USA, Japan, and also Taiwan and Korea, are investing
significantly more in ICT R&D than the EU. ICT is a strongly internationalized sector,
especially in ICT goods and – to a lower extent – in ICT services. In addition, the use of
ICT is facilitating and stimulating internationalization of non-ICT sectors, ICT facilitates
both fragmentation as well as international outsourcing.
The ICT industry, as a relatively “new” industry, still shows constant dramatic changes
every decade. In recent years, the following trends have been pointed out by the
literature in particular:
Shift to the ICT world market to emerging economies: In 2009 the share of the
ICT world market in OECD countries declined to 76% from 84% in 2003, as
growth in non-OECD economies became relatively independent from growth in
OECD countries (OECD, 2010). As part of this shift the top 250 ICT firms include
more non-OECD firms, among them manufacturing firms in Chinese Taipei, which
have partly driven the rise of China as the major exporter of ICT goods, IT
services firms from India, and telecommunication services providers from a range
of non-OECD economies.
Trade in ICT services is growing faster than trade in ICT goods: Between 2001
and 2013, the world exports of manufactured ICT goods grew by 6% annually,
reaching over 1.6 trillion US dollars in 2013 (OECD, 2015). Simultaneously, the
share of computers and peripherals in total ICT world exports decreased by 11
percentage points, as a result of widespread prices and inelastic demand curves.
This may indicate a major shift in world trade patterns towards communication
equipment and electronic components.
Regional concentration of production and export of ICT goods: Production and
export of ICT goods are increasingly concentrated in a few economies, in
particular China, Korea, Singapore, United States, Taiwan, but also Germany and
the Netherlands. In particular, 25% of all ICT R&D centres are located in the EU
and around 30% in the US, 16% in Japan 16% and 22% in other Asian countries,
18 European Commission (2014) – Digital Agenda Scoreboard: The EU ICT Sector and its R&D
Performance 19 European Commission - ICT Research & Innovation.
https://ec.europa.eu/programmes/horizon2020/en/area/ict-research-innovation.
37
especially China. Most firms still locate most of their R&D activities in their home
country. Despite the existence of strong linkages between Japan, the US and the
EU, Asia, in particular, is very attractive as a location for R&D centres for
international ICT companies.
Increasing role of the ICT sector in innovation activities: Out of total business
enterprise expenditure (BERD), business in 2013, R&D performed by the ICT
sector accounted for almost 0.5% of GDP (OECD, 2015). While R&D provides a
measure of innovation input, patents, registered designs and trademarks capture
innovation output. Patent applications in ICT technologies accounted for almost
40% of total applications. Although the number of international ICT patents has
steadily increased during the past decades, the level of international collaboration
output remains very low (Nepelski and De Prato ,2012)
Increasing demand for ICT specialists across all sectors: Overall, the contribution
of the ICT sector to total employment growth has varied significantly over the
past 15 years, but remained stable, in sum. At the same time employment of ICT
specialists across all sectors of the economy has risen, reaching at least 3% of
total employment in most OECD countries. This indicates the employment of the
ICT sector is shifting more towards high-skilled.
Challenges of traditional security approaches in a global data-intensive
environment: Data-driven innovation along GVC relies greatly on the quality of
the digital environment. It must be open and interconnected, as well as flexible
and host a massive volume of data of considerable diversity. These interrelated
characteristics increase the complexity of security management to a point where
the traditional security approach cannot scale up (OECD, 2015b). Cybercrime
(such as hacking, industry espionage, and cyberbullying) is an increasing issue for
companies of the ICT and other sectors. While GVC are international, a lot of laws
to prevent cybercrime are still applicable only on the national level and
international agreements are reached only slowly. Recent trends such as cloud
computing, mobility, “bring your own device”, machine-to-machine
communication (M2M) and the “Internet of Things” will further dissolve of
boundaries for information systems and networks and hence the vulnerability of
businesses and individuals.
3.5.2. Functional description of the R&D&I value chain
The following table gives a rough estimate of the business expenditures within the ICT
sector as well as R&D personnel. During various interviews with experts from two
different global companies of the ICT sector, the relevance of the different innovation
activities within their business was discussed. Based on these discussions, estimated on
the overall share for the different R&D activities could be made.
In a second step, based on the 2016 EU R&D Scoreboard, the sector size was estimated.
For the ICT sector all companies of the sectors “Electronic & Electrical equipment”,
“Technology Hardware & Equipment”, “ “Software & Computer Services”, “Fixed Line
Telecommunications”, “Mobile Telecommunications” were combined.
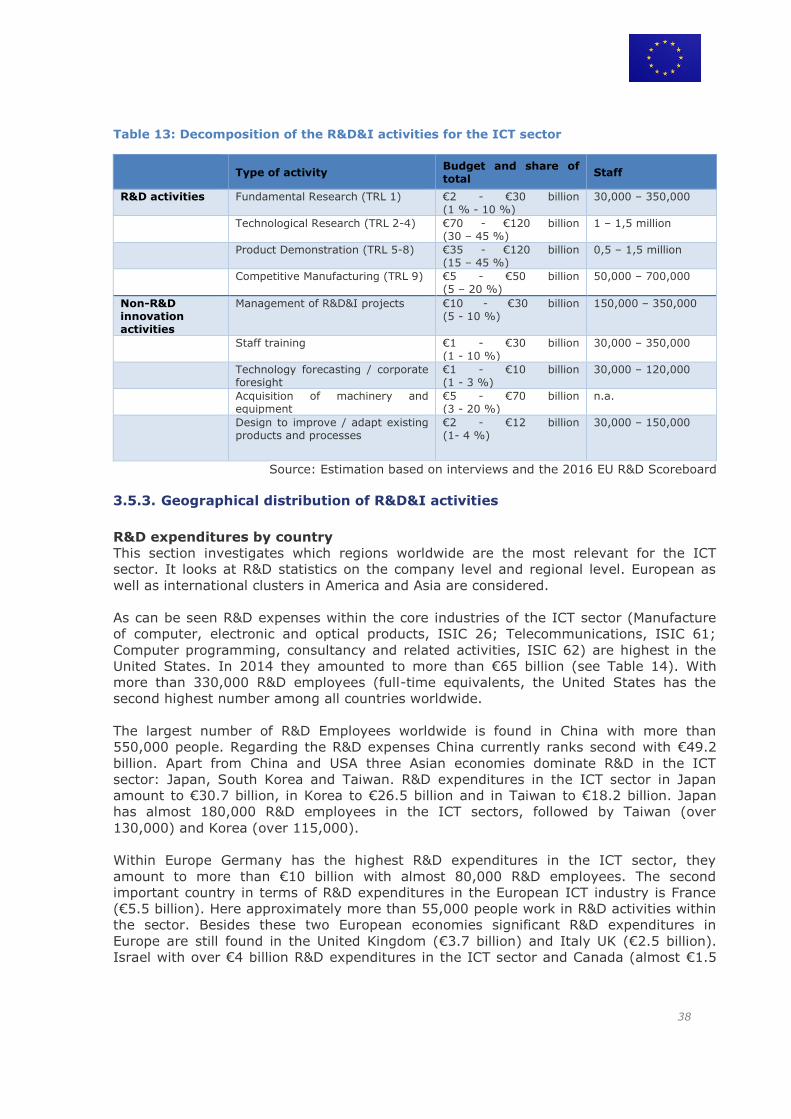
38
Table 13: Decomposition of the R&D&I activities for the ICT sector
Type of activity
Budget and share of total
Staff
R&D activities Fundamental Research (TRL 1) €2 - €30 billion (1 % - 10 %)
30,000 – 350,000
Technological Research (TRL 2-4) €70 - €120 billion (30 – 45 %)
1 – 1,5 million
Product Demonstration (TRL 5-8) €35 - €120 billion (15 – 45 %)
0,5 – 1,5 million
Competitive Manufacturing (TRL 9) €5 - €50 billion (5 – 20 %)
50,000 – 700,000
Non-R&D innovation activities
Management of R&D&I projects €10 - €30 billion (5 - 10 %)
150,000 – 350,000
Staff training €1 - €30 billion (1 - 10 %)
30,000 – 350,000
Technology forecasting / corporate foresight
€1 - €10 billion (1 - 3 %)
30,000 – 120,000
Acquisition of machinery and equipment
€5 - €70 billion (3 - 20 %)
n.a.
Design to improve / adapt existing products and processes
€2 - €12 billion (1- 4 %)
30,000 – 150,000
Source: Estimation based on interviews and the 2016 EU R&D Scoreboard
3.5.3. Geographical distribution of R&D&I activities
R&D expenditures by country
This section investigates which regions worldwide are the most relevant for the ICT
sector. It looks at R&D statistics on the company level and regional level. European as
well as international clusters in America and Asia are considered.
As can be seen R&D expenses within the core industries of the ICT sector (Manufacture
of computer, electronic and optical products, ISIC 26; Telecommunications, ISIC 61;
Computer programming, consultancy and related activities, ISIC 62) are highest in the
United States. In 2014 they amounted to more than €65 billion (see Table 14). With
more than 330,000 R&D employees (full-time equivalents, the United States has the
second highest number among all countries worldwide.
The largest number of R&D Employees worldwide is found in China with more than
550,000 people. Regarding the R&D expenses China currently ranks second with €49.2
billion. Apart from China and USA three Asian economies dominate R&D in the ICT
sector: Japan, South Korea and Taiwan. R&D expenditures in the ICT sector in Japan
amount to €30.7 billion, in Korea to €26.5 billion and in Taiwan to €18.2 billion. Japan
has almost 180,000 R&D employees in the ICT sectors, followed by Taiwan (over
130,000) and Korea (over 115,000).
Within Europe Germany has the highest R&D expenditures in the ICT sector, they
amount to more than €10 billion with almost 80,000 R&D employees. The second
important country in terms of R&D expenditures in the European ICT industry is France
(€5.5 billion). Here approximately more than 55,000 people work in R&D activities within
the sector. Besides these two European economies significant R&D expenditures in
Europe are still found in the United Kingdom (€3.7 billion) and Italy UK (€2.5 billion).
Israel with over €4 billion R&D expenditures in the ICT sector and Canada (almost €1.5
39
billion) are relevant regions, too.
From the table below it can be seen that the United States dominate R&D in the
“Computer programming, consultancy and related activities” subsector, followed by Israel
and Germany. In contrast, within the “Manufacture of computer, electronic and optical
products” subsector, the USA dominate R&D together with Asian countries (China, Japan,
Korea and Taiwan.”. India is currently not included in the OECD figures. Due to lack of
comparability the country is not included in the tables. In previous years, India’s R&D
figures20 were still significantly lower than in the top ICT countries mentioned above.
However, by 2017 it is very likely that the country has catched up significantly and will
certainly play a role of R&D in the ICT sector in the future.
20 http://is.jrc.ec.europa.eu/pages/ISG/PREDICT2014compnonEU.html
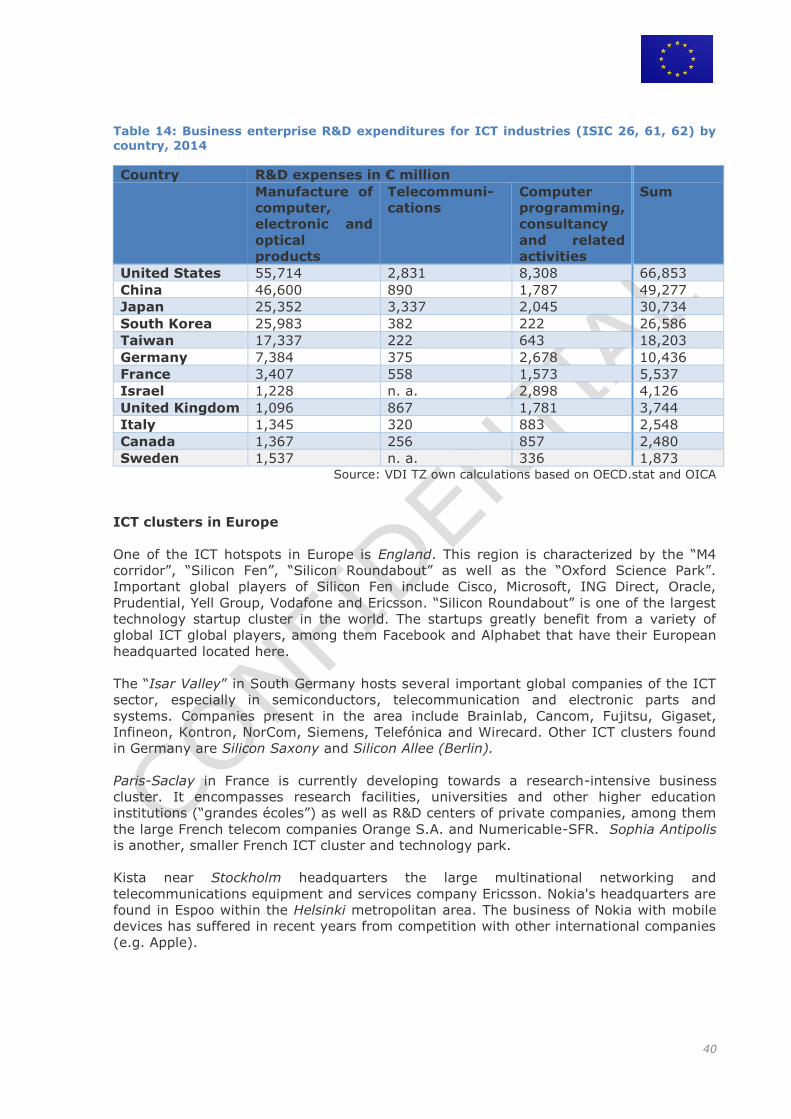
40
Table 14: Business enterprise R&D expenditures for ICT industries (ISIC 26, 61, 62) by country, 2014
Country R&D expenses in € million
Manufacture of
computer,
electronic and
optical
products
Telecommuni-
cations
Computer
programming,
consultancy
and related
activities
Sum
United States 55,714 2,831 8,308 66,853
China 46,600 890 1,787 49,277
Japan 25,352 3,337 2,045 30,734
South Korea 25,983 382 222 26,586
Taiwan 17,337 222 643 18,203
Germany 7,384 375 2,678 10,436
France 3,407 558 1,573 5,537
Israel 1,228 n. a. 2,898 4,126
United Kingdom 1,096 867 1,781 3,744
Italy 1,345 320 883 2,548
Canada 1,367 256 857 2,480
Sweden 1,537 n. a. 336 1,873 Source: VDI TZ own calculations based on OECD.stat and OICA
ICT clusters in Europe
One of the ICT hotspots in Europe is England. This region is characterized by the “M4
corridor”, “Silicon Fen”, “Silicon Roundabout” as well as the “Oxford Science Park”.
Important global players of Silicon Fen include Cisco, Microsoft, ING Direct, Oracle,
Prudential, Yell Group, Vodafone and Ericsson. “Silicon Roundabout” is one of the largest
technology startup cluster in the world. The startups greatly benefit from a variety of
global ICT global players, among them Facebook and Alphabet that have their European
headquarted located here.
The “Isar Valley” in South Germany hosts several important global companies of the ICT
sector, especially in semiconductors, telecommunication and electronic parts and
systems. Companies present in the area include Brainlab, Cancom, Fujitsu, Gigaset,
Infineon, Kontron, NorCom, Siemens, Telefónica and Wirecard. Other ICT clusters found
in Germany are Silicon Saxony and Silicon Allee (Berlin).
Paris-Saclay in France is currently developing towards a research-intensive business
cluster. It encompasses research facilities, universities and other higher education
institutions (“grandes écoles”) as well as R&D centers of private companies, among them
the large French telecom companies Orange S.A. and Numericable-SFR. Sophia Antipolis
is another, smaller French ICT cluster and technology park.
Kista near Stockholm headquarters the large multinational networking and
telecommunications equipment and services company Ericsson. Nokia's headquarters are
found in Espoo within the Helsinki metropolitan area. The business of Nokia with mobile
devices has suffered in recent years from competition with other international companies
(e.g. Apple).
41
Being one of the most wired countries in the world, the Netherlands are another
European hotspot for ICT companies. The Netherlands host sites of Microsoft, Cisco,
Interxion, Infosys, Huawei, Oracle, Intel, IBM, Verizon as well as Alphabet. The region
provides a powerful IT-infrastructure, a competitive tax climate and a tech-savvy,
English-speaking workforce. Besides that several companies of the global gaming
industry are found here: Guerrilla Games, Perfect World, Kixeye and Activision Blizzard.
In addition, a large security cluster and one of the most advanced European markets of
data centers is located in the Netherlands.
Taguspark is a science and technology park located at Oeiras within the Lisbon region,
Portugal. It accommodates several R&D labs, startups and business incubators,
especially in the ICT sector (e.g. Portugal Telecom).
ICT clusters worldwide
By far the largest and most famous ICT cluster in the world is Silicon Valley, located at
the San Jose metropolitan area in California, USA. Nowadays it is closely connected to
the San Francisco ICT cluster. Many thousands high tech companies are headquartered in
this region, several thousand of other companies have sites in the region. The largest
among them are Apple, Intel, Alphabet, Oracle, Facebook, HP Inc. and Qualcomm. The
ICT-ecosystem of Silicon Valley includes offices of EMC, Samsung, Fairchild
Semiconductor/Cypress Semiconductor, Infineon, Mitsubishi Electric, Siemens, SAP.
Samsung, Microsoft, Amazon, Dell and many others. Large research centres can be found
here, among them the IBM Almaden Research Center, Samsung Research America and
the NASA Ames Research Center.
"The Dulles Technology Corridor”, sometimes called “The Silicon Valley of the East” is
another ICT cluster within the United States. It is located at located in Northern Virginia
near Washington Dulles International Airport. Many medium-sized ICT companies are
headquartered here. Among them, CACI International , Carahsoft, DXC Technology, DLT
Solutions, MicroStrategy, Network Solutions, Neustar and XO Communications. The ICT
companies often have close cooperation with companies of the airline, defense and
security industry, among them Northrop Grumman, Orbital ATK, General Dynamics have
their headquarters located in the Dulles Technology Corridor.
Silicon Alley, centered in Manhattan is home to New York metropolitan region's high tech
industries. Relevant industries include the Internet, new media, telecommunications,
digital media, software development, game design and the financial technology (fintech)
industry, which benefits from the close proximity Wall Street.
The ICT cluster at Bangalore, also called the “Silicon Valley of India” is probably the
fastest growing ICT cluster worldwide. If the growth continues, Bangalore could surpass
Silicon Valley as the world’s IT capital in some years, especially regarding the number of
high-skilled employees. In 2015, Bangalore contributed to almost 40 per cent of India’s
total IT exports. Many international ITC companies are found here, among them 3M, HP
and Siemens. Infosys and Wipro. The Whitefield cluster is hosts the International Tech
Park Bangalore. The area provides campus facilities for SAP, Xerox, iGATE, Dell, TCS,
Unisys, Delphi, Huawei, Oracle and Perot Systems.
Tsukuba Science City in the Tokyo metropolitan area benefits from the largest budget of
government-sponsored general R&D for any science park zone of its size worldwide. The
academic landscape is powerful here: universities include the University of Tsukuba,
National University Corporation Tsukuba University of Technology, Tsukuba Gakuin
42
University, Graduate University for Advanced Studies and the Tsukuba Campus. Many
multinational companies perform R&D in this region. These include Intel Japan, Hitachi,
Canon and many others.
Suwon at Korea is home to the largest ICT-company of the world (with respect to R&D
expenditures): Samsung. The area is also called “Samsung Digital City”. It is the
dominant place in the world for chip memory and integrated system on a chip with large
components of microchip memory. LG is also headquartered in the area.
The Guangdong region with the Shenzhen Hi-Tech Industrial Park can be considered
China’s ICT hotspot. Electronics, information technology, biology, optical-electrical-
mechanical integration, pharmaceuticals and other High-tech industries are the major
industries in Shenzhen.
The Hsinchu Science Park at Hsinchu City in Taiwan is the dominant place worldwide for
pure-play semiconductor foundry market. The area is home to the world's top two
semiconductor foundries: Taiwan Semiconductor Manufacturing Company (TSMC) and
United Microelectronics Corporation (UMC), both of which were established at the nearby
Industrial Technology Research Institute. Other Companies include Acer, D-Link, Giga,
Logitech, MediaTek, Microtek, MStar Semiconductor, Nuvoton, Philips, Powerchip
Semiconductor, Realtek, Tecom, TSMC and United Microelectronics Corporation. The
Malaysian Semiconductor cluster hosts a variety of large semiconductor manufacturing
sites as well.
“Silicon Wadi”, in the coastal plain of Israel, has a high concentration of high-tech
industries. The region is particularly strong in Cyber Security and Agritech. The Silicon
Wadi area covers much of the country, although especially high concentrations of hi-tech
industry can be found in the area around Tel Aviv.
3.5.4. Analysis of R&D activities on the company level based on the EU R&D
scoreboard
The overall R&D expenditures of ICT amounted to about €243 billion in 2015/ 2016. This
is about 7.8 percent of the overall sales of the ICT that reached more than €3.1 trillion in
2015/ 2016.
The figure below shows that Samsung Electronics Co., Ltd. had the highest R&D
expenditures with over €12 billion per annum. Samsung Electronics is one of the leading
manufacturer of television, mobile phones, television, semiconductors, OLEDs and other.
At R&D intensity at Samsung Electronics is relatively low with 8 percent (see Figure 4),
the sales amount to €157 billion, and the second largest sales of all ICT manufacturers
worldwide. The headquarters of Samsung Electronics is found at Suwon, South Korea.
The second position in the industry is held by Intel Corporation and Alphabet Inc. with
R&D expenditures of €11.1 billion. Intel is a technology company headquartered in Santa
Clara, California, USA. The company supplies processors for computer system
manufacturers and also manufactures motherboard chipsets, network interface
controllers and integrated circuits, flash memory, graphics chips, embedded processors
and other devices related to communications and computing. The R&D intensity of Intel
is relatively high with 21.9 percent and total sales of €51 billion. Alphabet Inc. is parent
company for a number of smaller companies, including technology company Google and
its former subsidiaries. The R&D intensity of Alphabet is 16 percent and total sales of €69
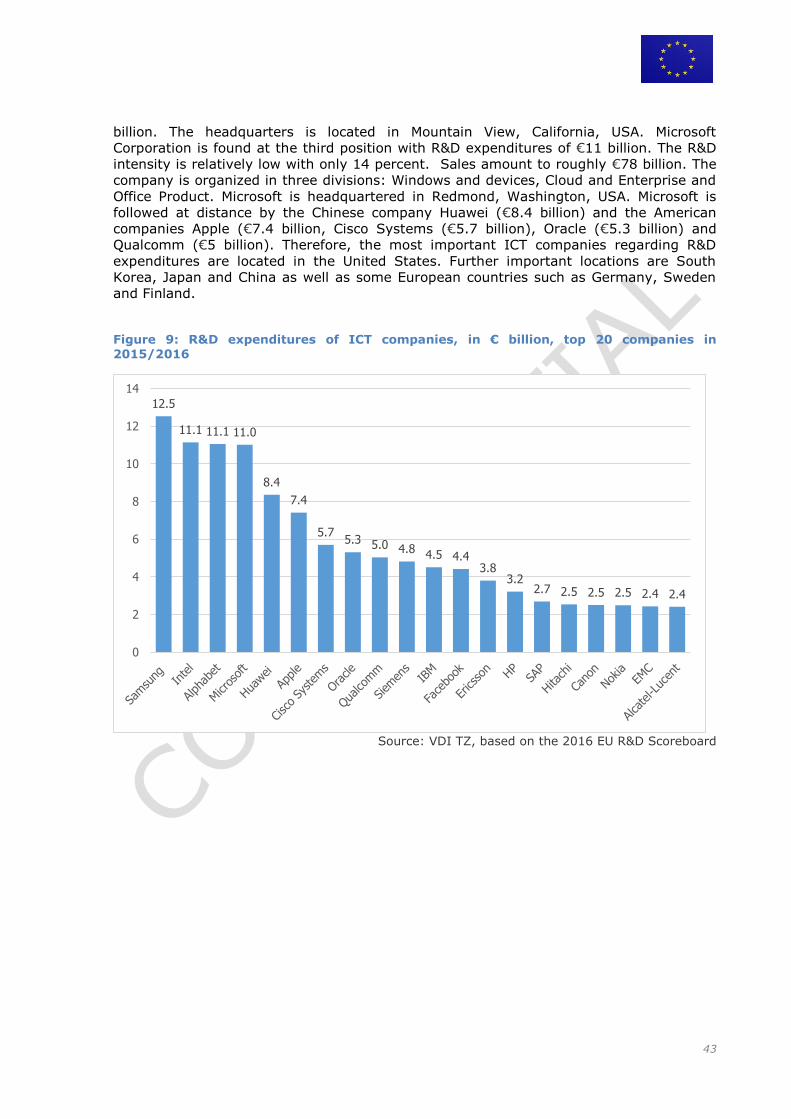
43
billion. The headquarters is located in Mountain View, California, USA. Microsoft
Corporation is found at the third position with R&D expenditures of €11 billion. The R&D
intensity is relatively low with only 14 percent. Sales amount to roughly €78 billion. The
company is organized in three divisions: Windows and devices, Cloud and Enterprise and
Office Product. Microsoft is headquartered in Redmond, Washington, USA. Microsoft is
followed at distance by the Chinese company Huawei (€8.4 billion) and the American
companies Apple (€7.4 billion, Cisco Systems (€5.7 billion), Oracle (€5.3 billion) and
Qualcomm (€5 billion). Therefore, the most important ICT companies regarding R&D
expenditures are located in the United States. Further important locations are South
Korea, Japan and China as well as some European countries such as Germany, Sweden
and Finland.
Figure 9: R&D expenditures of ICT companies, in € billion, top 20 companies in
2015/2016
Source: VDI TZ, based on the 2016 EU R&D Scoreboard
12.5
11.1 11.1 11.0
8.4
7.4
5.7 5.3 5.0 4.8 4.5 4.4
3.8 3.2
2.7 2.5 2.5 2.5 2.4 2.4
0
2
4
6
8
10
12
14
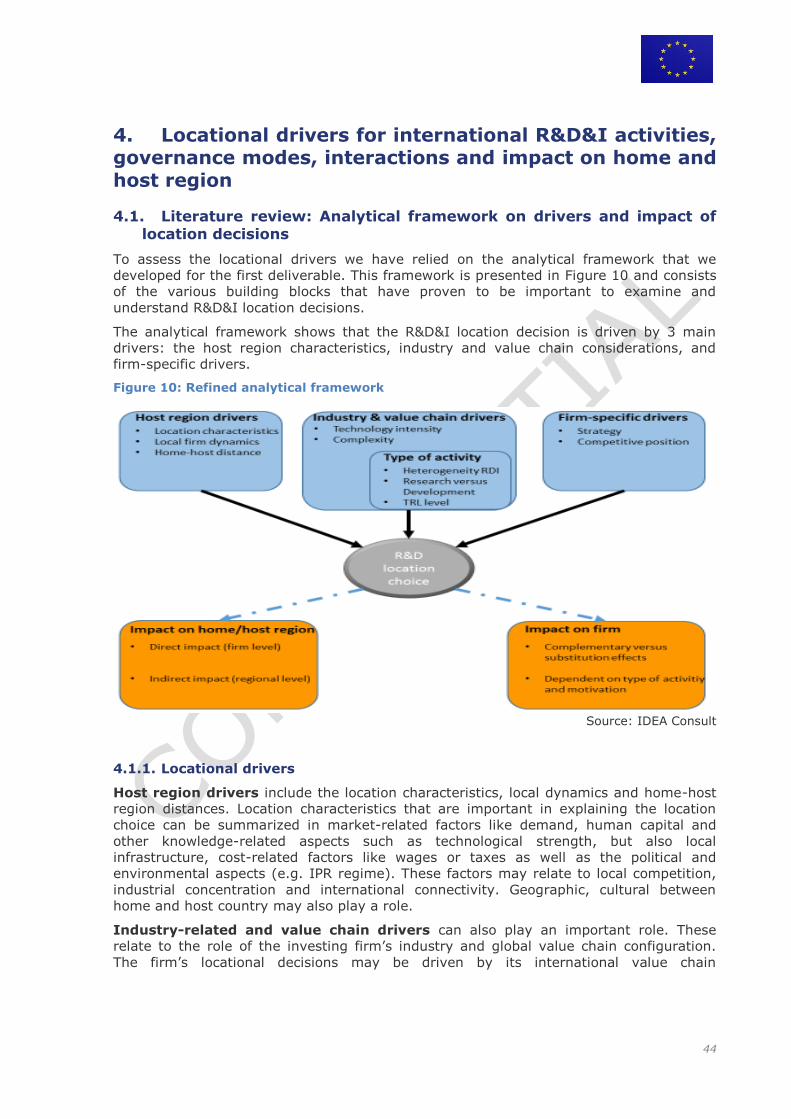
44
4. Locational drivers for international R&D&I activities, governance modes, interactions and impact on home and host region
Literature review: Analytical framework on drivers and impact of 4.1.location decisions
To assess the locational drivers we have relied on the analytical framework that we
developed for the first deliverable. This framework is presented in Figure 10 and consists
of the various building blocks that have proven to be important to examine and
understand R&D&I location decisions.
The analytical framework shows that the R&D&I location decision is driven by 3 main
drivers: the host region characteristics, industry and value chain considerations, and
firm-specific drivers.
Figure 10: Refined analytical framework
Source: IDEA Consult
4.1.1. Locational drivers
Host region drivers include the location characteristics, local dynamics and home-host
region distances. Location characteristics that are important in explaining the location
choice can be summarized in market-related factors like demand, human capital and
other knowledge-related aspects such as technological strength, but also local
infrastructure, cost-related factors like wages or taxes as well as the political and
environmental aspects (e.g. IPR regime). These factors may relate to local competition,
industrial concentration and international connectivity. Geographic, cultural between
home and host country may also play a role.
Industry-related and value chain drivers can also play an important role. These
relate to the role of the investing firm’s industry and global value chain configuration.
The firm’s locational decisions may be driven by its international value chain
45
configuration and the configuration of competitors and partners (e.g. internal co-
location).
Firm-specific drivers may depend on the firm’s strategy and competitive position.
Depending on weather a firm is a leader in its market or a follower can determine the
location of R&D&I.
The propositions we address related to the locational drivers are indicated in the box
below. These propositions also relate to offshoring and outsourcing trends, the
governance modes and the role of the government.
Box 1: Research questions and propositions that relate to the locational drivers
RQ: How do companies organise their R&D&I acctivities across GVCs?
The analytical framework illustrates the key factors in determining the firm’s R&D&I
location decision: the host region characteristics, industry and value chain
considerations and firm-specific drivers. Traditionally, production activities are highly
dispersed across countries, while R&D&I activities only recently started to
internationalize. Furthermore, production facilities are strongly driven towards countries
with large market demand and low factor costs, while the location drivers of R&D&I
activities are more diverse. Within the location decision process of R&D&I activities
there is a strong interplay between host country characteristics, and industry-specific
and value chain considerations, with the latter factors becoming increasingly important.
There is a large heterogeneity within R&D&I activities, with activities at different stages
of the R&D&I process subject to different locational drivers. Corporate strategies,
however remain decisive in determining the location choices.
Proposition 1) Industry-specific and value chain characteristics are key drivers for
R&D&I location decisions and are becoming more important than country
characteristics.
Proposition 2) Location determinants and patterns are highly dependent on the type
of R&D&I activity (TRL).
Proposition 3) Corporate strategies are decisive in determining the location choices.
RQ: What is the relationship between R&D&I locational decisions and the
location of production activities?
The (scarce) literature on the importance of colocation effects between different
activities within companies’ GVCs seem to suggest that prior production activities in a
host location increases the probability that later R&D&I activities follow in the same
host region (e.g. Alcácer and Delgado, 2016; Defever, 2012; Alcácer, 2006). Benefits
can be derived from collocating these activities as important feedback effects exist
between both types of value chain activities (e.g. Defever, 2006; Buciuni and Finotto,
2016). The need for colocation however strongly depends on the type of activity.
Ketokivi and Ali-Yrkkö (2009) for instance documented that this need strongly
correlates with the knowledge intensity of activities. More specifically, an increasing
product and process complexity and a high industry rate of change promotors
colocation.
46
Proposition 4) The extent to which R&D&I activities are collocated with production
activities, strongly depends on the type of R&D&I activity involved.
RQ: Which industrial differences can be observed?
Industry differences are observed as the value chains and R&D&I activities vary
between industries.
Proposition 5) The organization of R&D&I activities across GVCs is industry/sector
specific. Industry differences are observed at the level of the location decision, the
impact, the governance mode applied. Even within industry, differences can occur
depending on the R&D&I activities (TRL scale) of the company.
Further industrial differences will be specified when the international fragmentation of
corporate R&D&I is analysed at the sector level (pharma, ICT production/hardware,
automotive/aerospace).
RQ: How functions/activities are sliced (or not) across different subsidiaries,
external partners and different territories?
The international fragmentation of R&D&I activities is highly dependent on the
complexity, knowledge-intensity and global trends within the industry. Accordingly,
outsourcing and offshoring trends will differ significantly across industries.
Proposition 6) Outsourcing and offshoring trends are highly industry-specific. The
international fragmentation of R&D&I activities is highly dependent on the industry
and R&D&I subfunctions/activities or tasks. Highly capital-intensive industries
concentrate key R&D activities to a larger extent than less capital-intensive
industries.
RQ: Which corporate governance mechanisms and modes sustain corporate
R&D and innovation across GVCs? (alliances, subcontracting, collaborative
contracts, IP licensing, subsidiaries chain, …)
With the increasing internationalization of R&D&I activities (i.e. more complex
activities), there is a trend towards more advanced corporate governance mechanisms
to sustain these international corporate R&D networks. More traditional corporate
governance modes have become obsolete and a trend towards global R&D&I networks
has been observed. However, a firm’s overall strategy and experience with corporate
governance mechanisms will largely determine the governance mode and mechanism
chosen.
Proposition 7) There are a broad range of corporate governance mechanisms and
modes to sustain corporate R&D&I across GVCs. We expect this governance
mechanisms/modes to be highly dependent on the type of R&D&I activity/task
performed. A trend towards global R&D&I networks (originating due to alliances,
collaboration and/ or subcontracting) can be observed, although they are often
difficult to manage. The corporate strategy will however be determinant for the
decision on the governance mechanism.
RQ: Which policy challenges can be derived?
As indicated in the conceptual framework, there are a broad range of drivers which can
influence the location decision of a company: host (home) region, industry & value
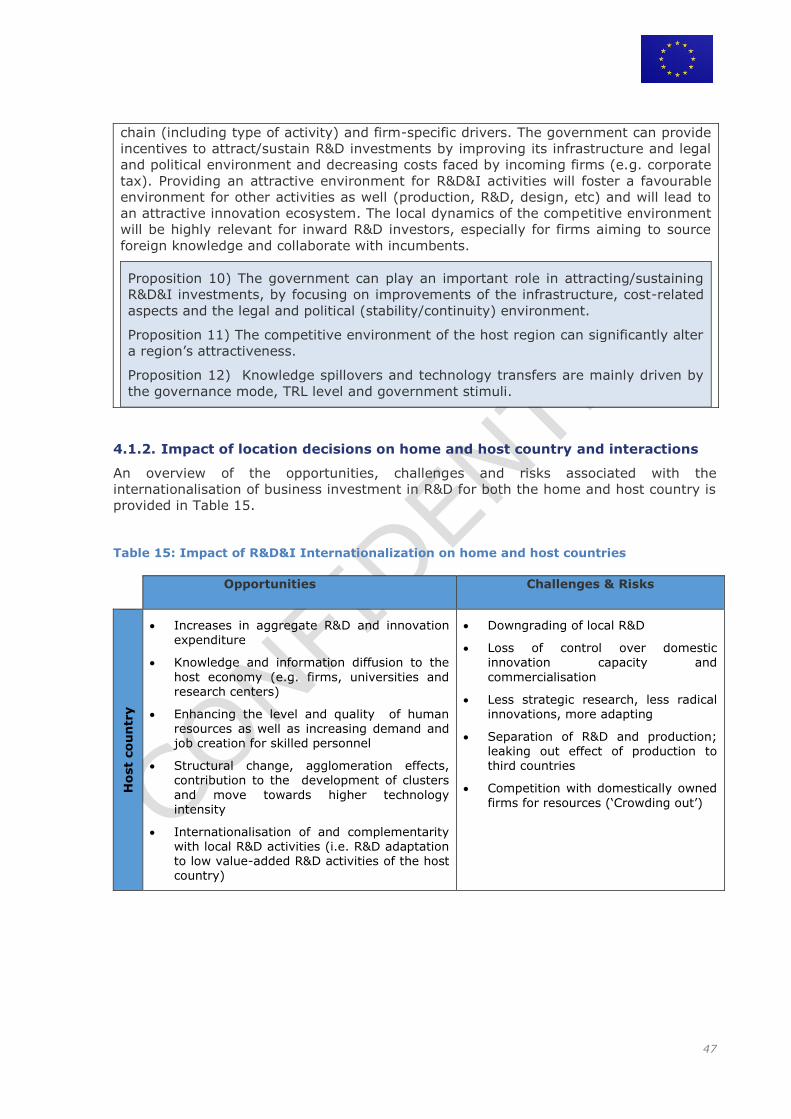
47
chain (including type of activity) and firm-specific drivers. The government can provide
incentives to attract/sustain R&D investments by improving its infrastructure and legal
and political environment and decreasing costs faced by incoming firms (e.g. corporate
tax). Providing an attractive environment for R&D&I activities will foster a favourable
environment for other activities as well (production, R&D, design, etc) and will lead to
an attractive innovation ecosystem. The local dynamics of the competitive environment
will be highly relevant for inward R&D investors, especially for firms aiming to source
foreign knowledge and collaborate with incumbents.
Proposition 10) The government can play an important role in attracting/sustaining
R&D&I investments, by focusing on improvements of the infrastructure, cost-related
aspects and the legal and political (stability/continuity) environment.
Proposition 11) The competitive environment of the host region can significantly alter
a region’s attractiveness.
Proposition 12) Knowledge spillovers and technology transfers are mainly driven by
the governance mode, TRL level and government stimuli.
4.1.2. Impact of location decisions on home and host country and interactions
An overview of the opportunities, challenges and risks associated with the
internationalisation of business investment in R&D for both the home and host country is
provided in Table 15.
Table 15: Impact of R&D&I Internationalization on home and host countries
Opportunities Challenges & Risks
Ho
st
co
un
try
Increases in aggregate R&D and innovation expenditure
Knowledge and information diffusion to the
host economy (e.g. firms, universities and research centers)
Enhancing the level and quality of human resources as well as increasing demand and job creation for skilled personnel
Structural change, agglomeration effects, contribution to the development of clusters
and move towards higher technology intensity
Internationalisation of and complementarity with local R&D activities (i.e. R&D adaptation to low value-added R&D activities of the host country)
Downgrading of local R&D
Loss of control over domestic innovation capacity and
commercialisation
Less strategic research, less radical innovations, more adapting
Separation of R&D and production; leaking out effect of production to third countries
Competition with domestically owned
firms for resources (‘Crowding out’)
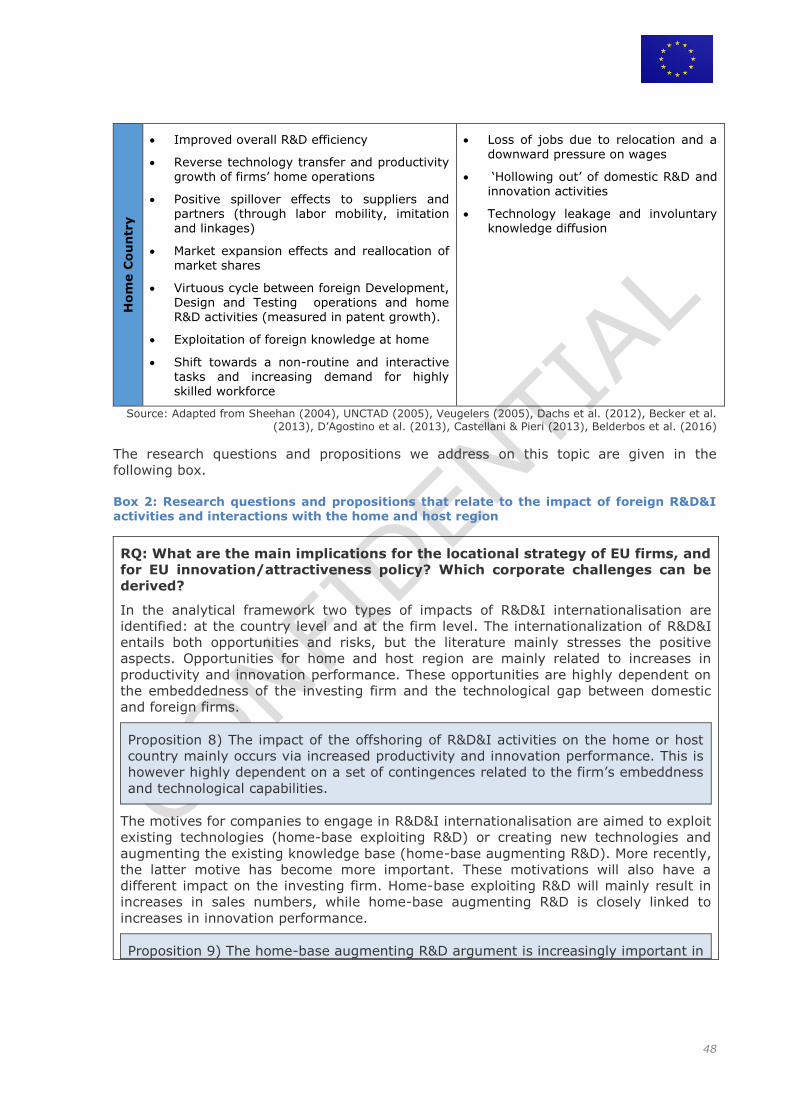
48
Ho
me C
ou
ntr
y
Improved overall R&D efficiency
Reverse technology transfer and productivity growth of firms’ home operations
Positive spillover effects to suppliers and partners (through labor mobility, imitation and linkages)
Market expansion effects and reallocation of market shares
Virtuous cycle between foreign Development, Design and Testing operations and home R&D activities (measured in patent growth).
Exploitation of foreign knowledge at home
Shift towards a non-routine and interactive tasks and increasing demand for highly skilled workforce
Loss of jobs due to relocation and a downward pressure on wages
‘Hollowing out’ of domestic R&D and innovation activities
Technology leakage and involuntary knowledge diffusion
Source: Adapted from Sheehan (2004), UNCTAD (2005), Veugelers (2005), Dachs et al. (2012), Becker et al. (2013), D’Agostino et al. (2013), Castellani & Pieri (2013), Belderbos et al. (2016)
The research questions and propositions we address on this topic are given in the
following box.
Box 2: Research questions and propositions that relate to the impact of foreign R&D&I activities and interactions with the home and host region
RQ: What are the main implications for the locational strategy of EU firms, and
for EU innovation/attractiveness policy? Which corporate challenges can be
derived?
In the analytical framework two types of impacts of R&D&I internationalisation are
identified: at the country level and at the firm level. The internationalization of R&D&I
entails both opportunities and risks, but the literature mainly stresses the positive
aspects. Opportunities for home and host region are mainly related to increases in
productivity and innovation performance. These opportunities are highly dependent on
the embeddedness of the investing firm and the technological gap between domestic
and foreign firms.
Proposition 8) The impact of the offshoring of R&D&I activities on the home or host
country mainly occurs via increased productivity and innovation performance. This is
however highly dependent on a set of contingences related to the firm’s embeddness
and technological capabilities.
The motives for companies to engage in R&D&I internationalisation are aimed to exploit
existing technologies (home-base exploiting R&D) or creating new technologies and
augmenting the existing knowledge base (home-base augmenting R&D). More recently,
the latter motive has become more important. These motivations will also have a
different impact on the investing firm. Home-base exploiting R&D will mainly result in
increases in sales numbers, while home-base augmenting R&D is closely linked to
increases in innovation performance.
Proposition 9) The home-base augmenting R&D argument is increasingly important in
49
the location decision of companies. Home-base augmenting R&D will have a stronger
impact on the innovation performance than home-base exploiting R&D.
RQ: Which policy challenges can be derived?
innovation as a challenge for national innovation system from internationalisation of
R&D&I. This hollowing out effect is however not supported by recent empirical
evidence.
Proposition 13) The common fear that R&D&I internationalisation is hollowing out
domestic innovation is unfounded.
Cross-sector analysis based on case studies and interviews 4.2.
Within the project, we have made a cross-sector analysis (for the different sectors of
analysis: pharmaceuticals, automotive, aerospace and the ICT) and we have used all
propositions formulated above to discuss parallels and differences across the analysed
sectors.
These findings are based on: an extensive literature review, the findings and conclusions
distilled from the 10 case studies and interviews with industry representatives (for each
of the case studies, we conducted around 6 interviews, so a total of around 60 interviews
with business representatives, company managers and industry experts have been
undertaken in the study). Here below, we discuss all propositions separately and discuss
to what extent they are valid across the different sectors. This has also been summarized
in Table 16.
In the annex we also discuss these propositions for each sector individually.
Proposition 1: Industry-specific and value chain characteristics are key drivers
for R&D&I location decisions and are becoming more important than country
characteristics.
This proposition is not valid across all sectors. For the pharmaceutical industry it is shown
that value chain considerations only play a limited role in determining the location
decision and host country characteristics (e.g. market demand and technological
capabilities) are still more decisive in explaining the firm’s location behaviour. Value
chain considerations are also becoming more important given that companies are
increasingly breaking up their value chain (as discussed in 3.1) and are engaging more
and more in alliances and collaborations with companies located down – or upstream.
Furthermore, for activities at the later TRL scales (TRL7-8) it has become highly
beneficial to co-locate R&D&I activities with production activities given that these stages
require an extensive upscaling process of the clinical trials. Especially for phase 3 trials
(TRL8, which equals 25-30% of the total R&D budget for a typical pharmaceutical firm) it
can be important to have a close connection to the manufacturing facility. This makes
that value chain considerations are gaining ground in the pharmaceutical sector.
In the aerospace sector, value chain characteristics do not play an important role in
explaining the location decision, which is due to the fact that the sector is characterized
by strong consolidated supply chains.
In the automotive sector, value chain considerations play a determining role. Companies
50
active in that sector have a strong desire (especially the OEMs) to locate R&D facilities
close to both customers and important suppliers. ICT firms also have a strong desire to
be located close to its customers.
Proposition 2: Location determinants and patterns are highly dependent on the
type of R&D&I activity (TRL).
Across all case studies it has been shown that location determinants and patterns are
highly dependent on the type of R&D&I activity. We have documented that R&D&I
activities at the end of the TRL scale (more applied innovative activities, TRL6-9) are
driven towards regions with large market demand (mostly in South-East Asia), while the
activities at the start of the TRL scale (mainly TRL2-5) are driven towards regions with
advanced technological capabilities and a highly-skilled labour force (e.g. USA and
Germany). The offshoring of activities at the end of the TRL scale will especially have
strong consequences for the pharmaceutical industry as the TRL scales 6-9 constitute of
60-75% of the R&D budget. Within the sector, these activities are increasingly flowing to
emerging markets because of cost considerations. These countries can be especially
important for reducing costs for conducting clinical trials (they account for between 40%
and 60% of total drug development), cost reductions can be the highest for operating
phase 2 and phase 3 studies.
Across case studies, it has also been shown that non-R&D innovation activities show a
slightly different location pattern compared to more traditional R&D activities. The former
activities are more driven by the competitive position in the industry, value chain
considerations and local dynamics. Non-R&D innovation activities are especially
important in the automotive industry (they account for 13-55% of the total R&D&I
budget).
Proposition 3: Corporate strategies are decisive in determining the location
choices.
Across all case studies, it has been shown that corporate strategies are very decisive in
determining the location choice of companies. It has for instance been shown that
location choices are often driven by strategic takeover decisions and the location
behaviour is often driven by specialisation strategies (this is mainly the case for the
pharmaceutical sector).
Proposition 4: The extent to which R&D&I activities are collocated with
production activities, strongly depends on the type of R&D&I activity involved.
In general, weaker co-location forces can be observed in science based industries. The
case studies however also show that the extent to which R&D&I activities are collocated
with production activities strongly depends on the type of R&D&I activity. In the
pharmaceutical sector it can be said that co-location of R&D&I with production is not
necessary, but for R&D&I activities situated at the later stages of the TRL scale this co-
location becomes more important (TRL6 and later). The same holds for the aerospace
sector where higher TRL activities are often collocated with manufacturing facilities or
assembly lines. In the ICT sector, it are also mainly the activities at the end of the TRL
scale that are co-located with production activities.
In the automotive sector there is a long history of co-locating innovative activities with
production activities. Within the sector, it are however mainly the non-R&D innovation
activities that are most often co-located (these activities accounts for 13-55% of the total
R&D&I budget, which is substantial, in the pharmaceutical sector and the aerospace
sector this is for instance only 10%). Especially design activities to improve or adapt
existing products and processes is often co-located (this activity accounts for 5-30% of
the total R&D&I budget).
51
Proposition 5: The organization of R&D&I activities across GVCs is
industry/sector specific. Industry differences are observed at the level of the
location decision, the impact, the governance mode applied. Even within
industry, differences can occur depending on the R&D&I activities (TRL scale) of
the company.
This proposition can also be confirmed. The most R&D intensive industries of our study
are clearly driven towards regions with strong technological capabilities and strategic
assets. Less R&D intensive industries (i.e. the automotive industry, which is considered
as medium-tech industry) are more driven towards regions with large market demand
and favourable factor costs (especially labour costs). Within industries we can also
observe large differences depending on the type of R&D&I activity: also as shown by
examples in the text above.
Proposition 6 Outsourcing and offshoring trends are highly industry-specific.
The international fragmentation of R&D&I activities is highly dependent on the
industry and R&D&I subfunctions/activities or tasks. Highly capital-intensive
industries concentrate key R&D&I activities to a larger extent than less capital-
intensive industries.
The extensive research on this topic has shown that the international fragmentation of
R&D&I activities is highly dependent on the knowledge-intensity, the complexity, and
global trends within the industry. As such, it has been argued outsourcing and offshoring
trends will differ significantly across industries. This has been confirmed by the case
studies as well. The most capital-intensive industries in this study, namely the
pharmaceutical sector and the aerospace sector report a lower degree of offshoring and
relocations compared to other industries (given that relocation costs also could be high).
Within these industries offshoring is not that widespread. There is however a clear trends
across sectors of more outsourcing and offshoring of activities. Especially activities at the
later TRL stages are offshored. Within the pharmaceutical industry, activities at the later
stages of the TRL (starting from the later clinical trials, TRL6-7) are increasingly
outsourced (via CRO’s), while the ICT sector and the automotive sector (OEMs)
increasingly rely on their suppliers for their innovation process. Within this latter sector,
suppliers typically account for around 50% of R&D spending and typically engineer
around 75% of newly developed vehicles. Within the aerospace sector, outsourcing is
less common, this can partly be explained by the strategic character of the industry.
Proposition 7: There are a broad range of corporate governance mechanisms
and modes to sustain corporate R&D&I across GVCs. We expect these
governance mechanisms/modes to be highly dependent on the type of R&D&I
activity/task performed. A trend towards global R&D&I networks (originating
due to alliances, collaboration and/ or subcontracting) can be observed,
although they are often difficult to manage. The corporate strategy will however
be determinant for the decision on the governance mechanism
All case studies show there is a trend towards more external governance modes and
collaborative R&D networks are being formed (this is however less the case for the
aerospace sector where strategic considerations sometimes block more open forms of
partnerships). Across sector, there is a trend towards working more in open innovation
network where firms engage in strategic alliances with key partner firms. Patent
cooperation and patent pools with competitors and suppliers are also becoming more
common. The type of partnership of alliance is however dependent on the type of R&D&I
activities. Collaborative networks are for instance more formed for activities at the lower
levels of the TRL scale (basic research) and often with academic partners and biotech
52
companies. Joint ventures are more popular for production activities and innovative
activities at the end of the TRL scale.
Proposition 8: The impact of the offshoring of R&D&I activities on the home or
host country mainly occurs via increased productivity and innovation
performance. This is however highly dependent on a set of contingences related
to the firm’s embeddness and technological capabilities.
All case studies conducted in the 4 sectors confirmed this proposition and claimed that
international R&D&I operations not only increased the overall innovation performance of
the firm but did also contribute to the innovativeness of the region. Across all sector, the
extent of this impact is highly contingent on the network of the firm in the host market
and the openness of the local foreign ecosystem. Overall firm innovation performance is
also increased when companies try to maintain close links between activities in the home
and host region and try to stimulate regular exchanges about best practices, new
developments, process improvements and new ideas that will lead to cross-fertilization of
ideas coming from different regions. Intellectual property rights can also strongly
influence the amount of mutual knowledge spillovers between firms. This factor
especially plays a role in patent-intensive industries such as the pharmaceutical industry.
Pharmaceutical companies are more inclined to implement measures to safeguard their
knowledge and are less likely to transfer strategic knowledge to the foreign affiliate and
are more likely to limit its responsibilities and independency when the host region is
characterized by weak intellectual property rights.
Proposition 9: The home-base augmenting R&D argument is increasingly
important in the location decision of companies. Home-base augmenting R&D
will have a stronger impact on the innovation performance than home-base
exploiting R&D.
Several studies have shown that across industries, home-base augmenting R&D motives
(to create new technologies and augment the existing knowledge base) have become
more important than home-base exploiting R&D motives (to exploit existing
technologies). Furthermore, it has been contended that home-base augmenting R&D
activities will lead to the highest increases in innovation performance.
Across all case studies it has been contended that home-base augmenting R&D activities
will have the strongest impact on the firm’s overall innovation performance as these
international activities are more instrumental for generating new ideas and concepts
(especially activities situated at the TRL stages 1-4). However, the argument that home-
base augmenting R&D motives are becoming more important is only partially confirmed
by our case studies. It is only in the aerospace sector that the evidence shows that this
motive is gaining important ground. In the other sectors a clear shift of R&D&I activities
towards Asia has been documented. This shift is mainly driven by cheap factor costs and
market demand (R&D&I activities mainly involve activities to adapt existing products or
processes to the market). As such, these activities can be characterized mainly as home
base exploiting R&D activities. It is however important to remark here that the
technological capacities of Asian regions are increasing substantially such that more
recently firms also internationalize their R&D&I activities in Asia to explore and augment
their existing knowledge base (home base augmenting R&D activities).
Proposition 10: The government can play an important role in
attracting/sustaining R&D&I investments, by focusing on improvements of the
infrastructure, cost-related aspects and the legal and political
(stability/continuity) environment.
53
All case studies across all sectors show that the government can play an important role in
attracting/sustaining R&D&I investments. The EU can for instance improve its
attractiveness for the pharmaceutical industry by focusing on cost-related aspect and the
legal and political environment (remark however the cost-related aspect are not the most
decisive factor in explaining the location behaviour of pharmaceutical companies). For
pharmaceutical companies, favourable tax conditions, strong intellectual property rights,
flexible labour laws, funding opportunities, cluster stimuli, less stringent regulation, and
labour costs are among the factors that could increase the attractiveness of a region.
For automotive firms, the EU could increase its attractiveness the most by focusing on its
infrastructure. Infrastructure in this sense refers to several dimensions: mobility
infrastructure (fast roads, railways, efficient airports and efficient public transportation
systems), skill and labour market infrastructure (availability of graduates and
professionals, good education system), technological infrastructure (charging
infrastructure for electric vehicles, technical standards).
Within the aerospace sector, the government can play a decisive role by promoting basic
research (TRL1-TRL6), offering better financing options and by better coordinating the
access to and the development of available infrastructure.
For the ICT sector, the EU can mainly improve its attractiveness by focusing on lowering
the labour costs for highly skilled IT personnel.
Proposition 11: The competitive environment of the host region can significantly
alter a region’s attractiveness.
The recent literature documented that the competitive environment of the host region
can significantly alter a region’s attractiveness. Researchers have for instance
documented that technology leading firms tend to avoid highly agglomerated areas or
cluster for new investments because they fear that outgoing knowledge spillovers might
endanger their own competitive position, while other studies have documented that firms
tend to stay away from regions characterized by regions where incumbent technology
leaders are actively taking measures to avoid outgoing knowledge spillovers.
This proposition is only partly confirmed by all case studies. In the pharmaceutical
industry, the competitive environment of the host region in the pharmaceutical industry
is for instance not a decisive factor in explaining a firm’s location behaviour. Most
established pharmaceutical companies currently are evolving towards a more open
innovation culture and even try to establish collaboration agreements and alliances with
their closest competitors. In the automotive sector, this environment also only has
modest influence and the sector is characterized by a trend that firms are moving
towards the most competitive environment because they need to learn from other firms
(also in other sectors) in order to remain competitive and stay on track.
In the aerospace sector, most firms have a very consolidated supply chain (because of
high economic and technological barriers) and they develop their own ecosystems and do
not take the locations of other competing firms into account. In the ICT sector the
competitive environment does play a role, but not to the extent that larger firms shed
away from the most agglomerated places.
Proposition 12: Knowledge spillovers and technology transfers are mainly
driven by the governance mode, TRL level and government stimuli.
This proposition is confirmed by our case study of the aerospace industry but it is only
partially valid for the three other sectors (pharmaceuticals/automotive/ICT). Across the
case studies there is however a consensus that the governance mode and the TRL level
have a strong influence on the amount of knowledge spillovers. The amount of
knowledge spillovers will be the highest for strong equity-based governance models (i.e.
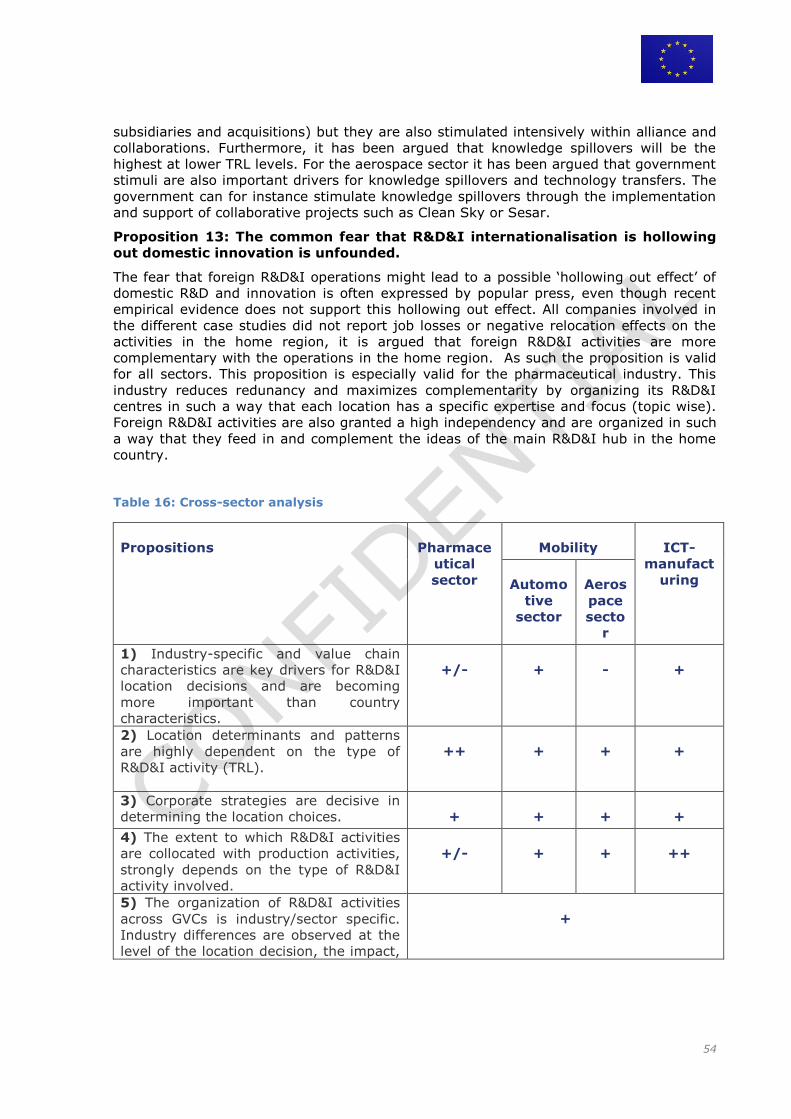
54
subsidiaries and acquisitions) but they are also stimulated intensively within alliance and
collaborations. Furthermore, it has been argued that knowledge spillovers will be the
highest at lower TRL levels. For the aerospace sector it has been argued that government
stimuli are also important drivers for knowledge spillovers and technology transfers. The
government can for instance stimulate knowledge spillovers through the implementation
and support of collaborative projects such as Clean Sky or Sesar.
Proposition 13: The common fear that R&D&I internationalisation is hollowing
out domestic innovation is unfounded.
The fear that foreign R&D&I operations might lead to a possible ‘hollowing out effect’ of
domestic R&D and innovation is often expressed by popular press, even though recent
empirical evidence does not support this hollowing out effect. All companies involved in
the different case studies did not report job losses or negative relocation effects on the
activities in the home region, it is argued that foreign R&D&I activities are more
complementary with the operations in the home region. As such the proposition is valid
for all sectors. This proposition is especially valid for the pharmaceutical industry. This
industry reduces redunancy and maximizes complementarity by organizing its R&D&I
centres in such a way that each location has a specific expertise and focus (topic wise).
Foreign R&D&I activities are also granted a high independency and are organized in such
a way that they feed in and complement the ideas of the main R&D&I hub in the home
country.
Table 16: Cross-sector analysis
Propositions Pharmace
utical
sector
Mobility ICT-
manufact
uring Automo
tive
sector
Aeros
pace
secto
r
1) Industry-specific and value chain
characteristics are key drivers for R&D&I
location decisions and are becoming
more important than country
characteristics.
+/- + - +
2) Location determinants and patterns
are highly dependent on the type of
R&D&I activity (TRL).
++ + + +
3) Corporate strategies are decisive in
determining the location choices. + + + +
4) The extent to which R&D&I activities
are collocated with production activities,
strongly depends on the type of R&D&I
activity involved.
+/- + + ++
5) The organization of R&D&I activities
across GVCs is industry/sector specific.
Industry differences are observed at the
level of the location decision, the impact,
+
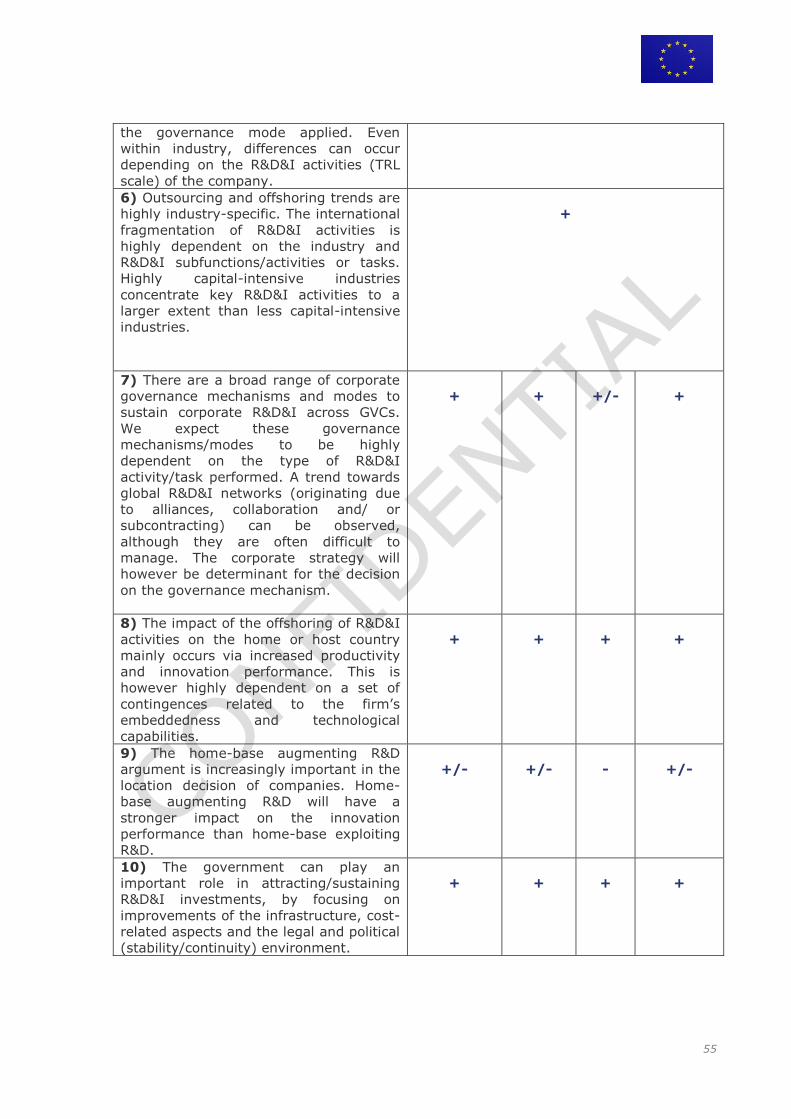
55
the governance mode applied. Even
within industry, differences can occur
depending on the R&D&I activities (TRL
scale) of the company.
6) Outsourcing and offshoring trends are
highly industry-specific. The international
fragmentation of R&D&I activities is
highly dependent on the industry and
R&D&I subfunctions/activities or tasks.
Highly capital-intensive industries
concentrate key R&D&I activities to a
larger extent than less capital-intensive
industries.
+
7) There are a broad range of corporate
governance mechanisms and modes to
sustain corporate R&D&I across GVCs.
We expect these governance
mechanisms/modes to be highly
dependent on the type of R&D&I
activity/task performed. A trend towards
global R&D&I networks (originating due
to alliances, collaboration and/ or
subcontracting) can be observed,
although they are often difficult to
manage. The corporate strategy will
however be determinant for the decision
on the governance mechanism.
+ + +/- +
8) The impact of the offshoring of R&D&I
activities on the home or host country
mainly occurs via increased productivity
and innovation performance. This is
however highly dependent on a set of
contingences related to the firm’s
embeddedness and technological
capabilities.
+ + + +
9) The home-base augmenting R&D
argument is increasingly important in the
location decision of companies. Home-
base augmenting R&D will have a
stronger impact on the innovation
performance than home-base exploiting
R&D.
+/- +/- - +/-
10) The government can play an
important role in attracting/sustaining
R&D&I investments, by focusing on
improvements of the infrastructure, cost-
related aspects and the legal and political
(stability/continuity) environment.
+ + + +
56
11) The competitive environment of the
host region can significantly alter a
region’s attractiveness.
- +/- - +/-
12) Knowledge spillovers and technology
transfers are mainly driven by the
governance mode, TRL level and
government stimuli.
+/- +/- + +/-
13) The common fear that R&D&I
internationalisation is hollowing out
domestic innovation is unfounded.
++ + + +
5. Attractiveness of sites in Europe from a company perspective The tables below list the factors that determine the attractiveness of Europe for
companies based in the different sectors of the analysis. Each of these tables is
constructed based on a cross-case analysis of all case studies and interviews with key
experts active in the industry (with the purpose to better generalize the findings for the
broader industry).
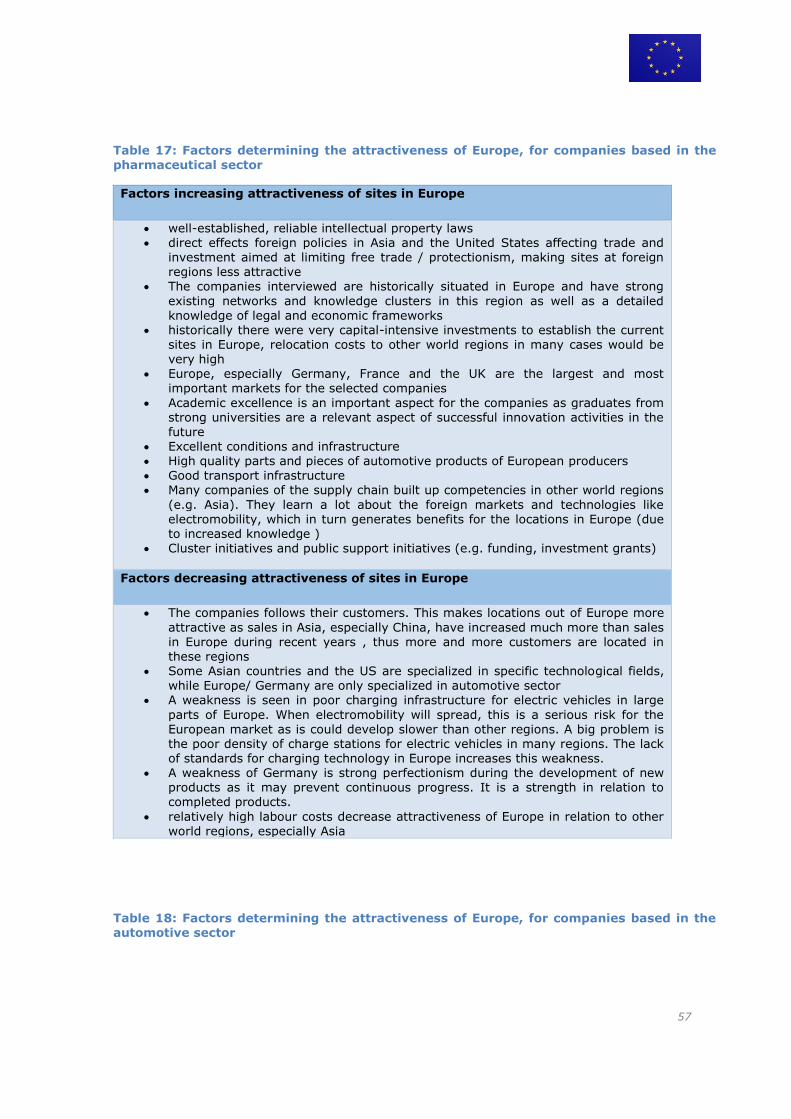
57
Table 17: Factors determining the attractiveness of Europe, for companies based in the pharmaceutical sector
Factors increasing attractiveness of sites in Europe
well-established, reliable intellectual property laws direct effects foreign policies in Asia and the United States affecting trade and
investment aimed at limiting free trade / protectionism, making sites at foreign regions less attractive
The companies interviewed are historically situated in Europe and have strong
existing networks and knowledge clusters in this region as well as a detailed knowledge of legal and economic frameworks
historically there were very capital-intensive investments to establish the current sites in Europe, relocation costs to other world regions in many cases would be
very high Europe, especially Germany, France and the UK are the largest and most
important markets for the selected companies
Academic excellence is an important aspect for the companies as graduates from strong universities are a relevant aspect of successful innovation activities in the future
Excellent conditions and infrastructure High quality parts and pieces of automotive products of European producers Good transport infrastructure Many companies of the supply chain built up competencies in other world regions
(e.g. Asia). They learn a lot about the foreign markets and technologies like electromobility, which in turn generates benefits for the locations in Europe (due to increased knowledge )
Cluster initiatives and public support initiatives (e.g. funding, investment grants)
Factors decreasing attractiveness of sites in Europe
The companies follows their customers. This makes locations out of Europe more
attractive as sales in Asia, especially China, have increased much more than sales in Europe during recent years , thus more and more customers are located in these regions
Some Asian countries and the US are specialized in specific technological fields, while Europe/ Germany are only specialized in automotive sector
A weakness is seen in poor charging infrastructure for electric vehicles in large
parts of Europe. When electromobility will spread, this is a serious risk for the European market as is could develop slower than other regions. A big problem is the poor density of charge stations for electric vehicles in many regions. The lack of standards for charging technology in Europe increases this weakness.
A weakness of Germany is strong perfectionism during the development of new products as it may prevent continuous progress. It is a strength in relation to completed products.
relatively high labour costs decrease attractiveness of Europe in relation to other
world regions, especially Asia
Table 18: Factors determining the attractiveness of Europe, for companies based in the automotive sector
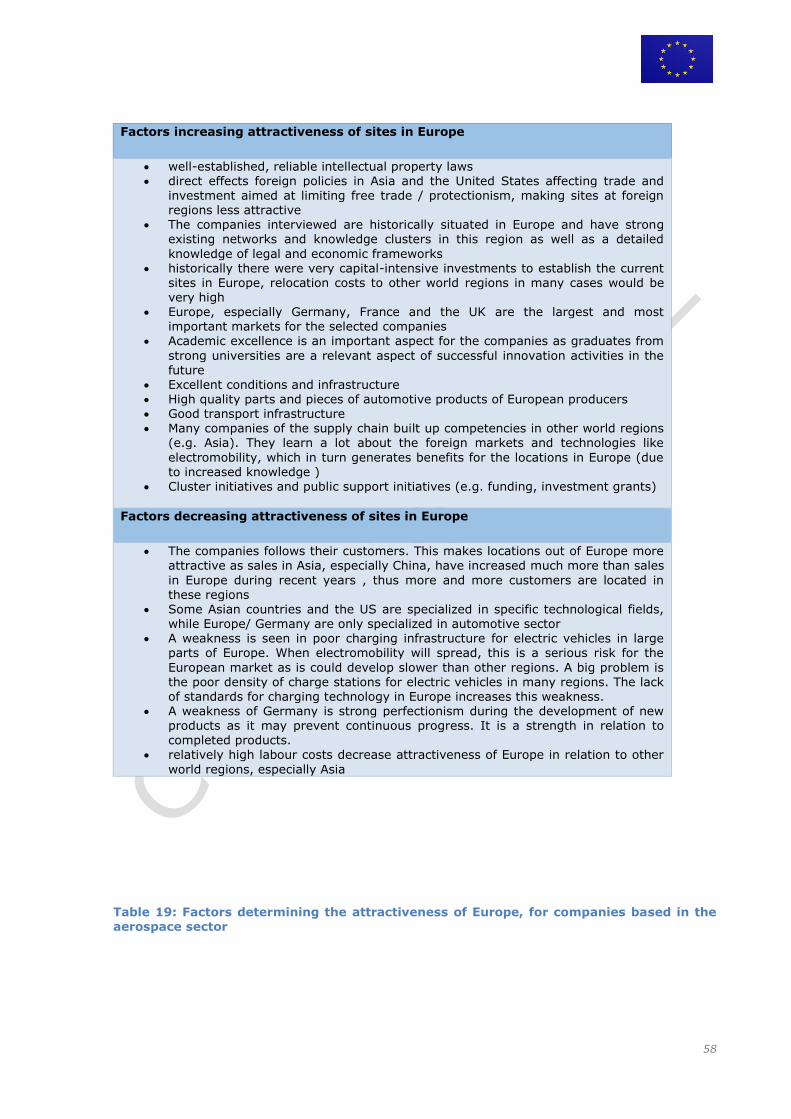
58
Factors increasing attractiveness of sites in Europe
well-established, reliable intellectual property laws direct effects foreign policies in Asia and the United States affecting trade and
investment aimed at limiting free trade / protectionism, making sites at foreign regions less attractive
The companies interviewed are historically situated in Europe and have strong existing networks and knowledge clusters in this region as well as a detailed
knowledge of legal and economic frameworks historically there were very capital-intensive investments to establish the current
sites in Europe, relocation costs to other world regions in many cases would be very high
Europe, especially Germany, France and the UK are the largest and most important markets for the selected companies
Academic excellence is an important aspect for the companies as graduates from
strong universities are a relevant aspect of successful innovation activities in the future
Excellent conditions and infrastructure High quality parts and pieces of automotive products of European producers Good transport infrastructure Many companies of the supply chain built up competencies in other world regions
(e.g. Asia). They learn a lot about the foreign markets and technologies like
electromobility, which in turn generates benefits for the locations in Europe (due to increased knowledge )
Cluster initiatives and public support initiatives (e.g. funding, investment grants)
Factors decreasing attractiveness of sites in Europe
The companies follows their customers. This makes locations out of Europe more attractive as sales in Asia, especially China, have increased much more than sales
in Europe during recent years , thus more and more customers are located in
these regions Some Asian countries and the US are specialized in specific technological fields,
while Europe/ Germany are only specialized in automotive sector A weakness is seen in poor charging infrastructure for electric vehicles in large
parts of Europe. When electromobility will spread, this is a serious risk for the
European market as is could develop slower than other regions. A big problem is the poor density of charge stations for electric vehicles in many regions. The lack of standards for charging technology in Europe increases this weakness.
A weakness of Germany is strong perfectionism during the development of new products as it may prevent continuous progress. It is a strength in relation to completed products.
relatively high labour costs decrease attractiveness of Europe in relation to other
world regions, especially Asia
Table 19: Factors determining the attractiveness of Europe, for companies based in the aerospace sector
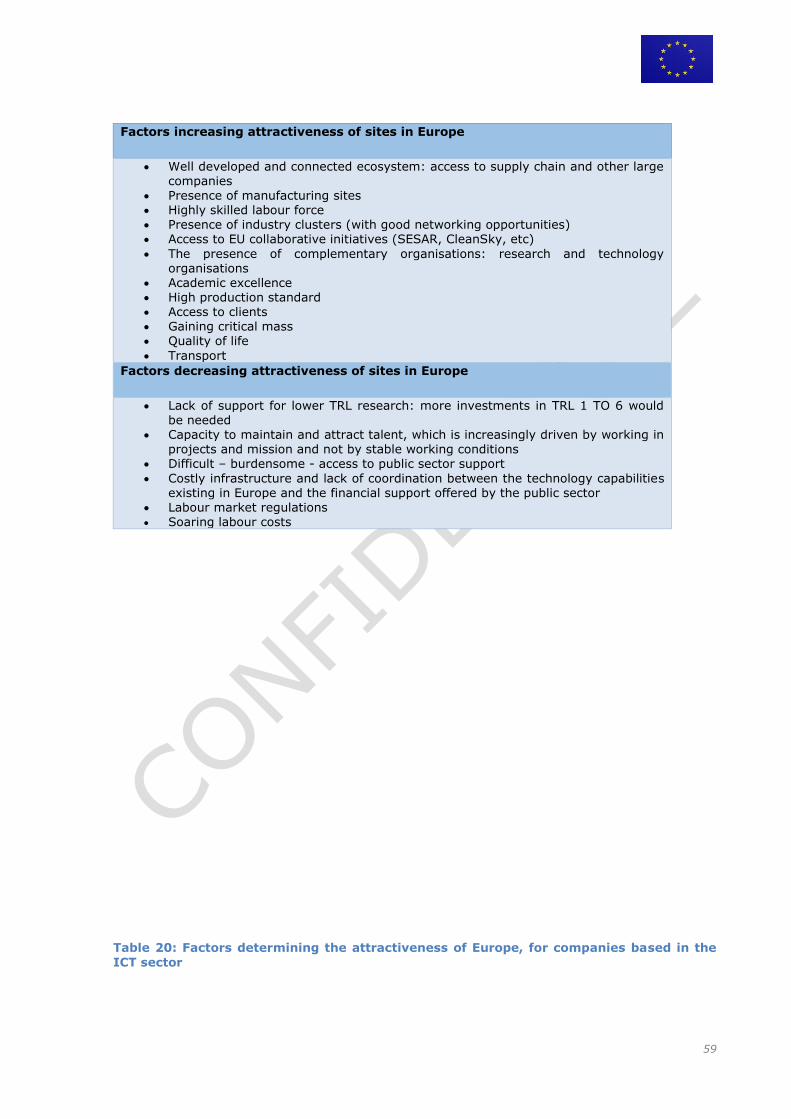
59
Factors increasing attractiveness of sites in Europe
Well developed and connected ecosystem: access to supply chain and other large companies
Presence of manufacturing sites Highly skilled labour force Presence of industry clusters (with good networking opportunities) Access to EU collaborative initiatives (SESAR, CleanSky, etc)
The presence of complementary organisations: research and technology organisations
Academic excellence High production standard Access to clients Gaining critical mass Quality of life
Transport
Factors decreasing attractiveness of sites in Europe
Lack of support for lower TRL research: more investments in TRL 1 TO 6 would be needed
Capacity to maintain and attract talent, which is increasingly driven by working in projects and mission and not by stable working conditions
Difficult – burdensome - access to public sector support
Costly infrastructure and lack of coordination between the technology capabilities existing in Europe and the financial support offered by the public sector
Labour market regulations Soaring labour costs
Table 20: Factors determining the attractiveness of Europe, for companies based in the
ICT sector
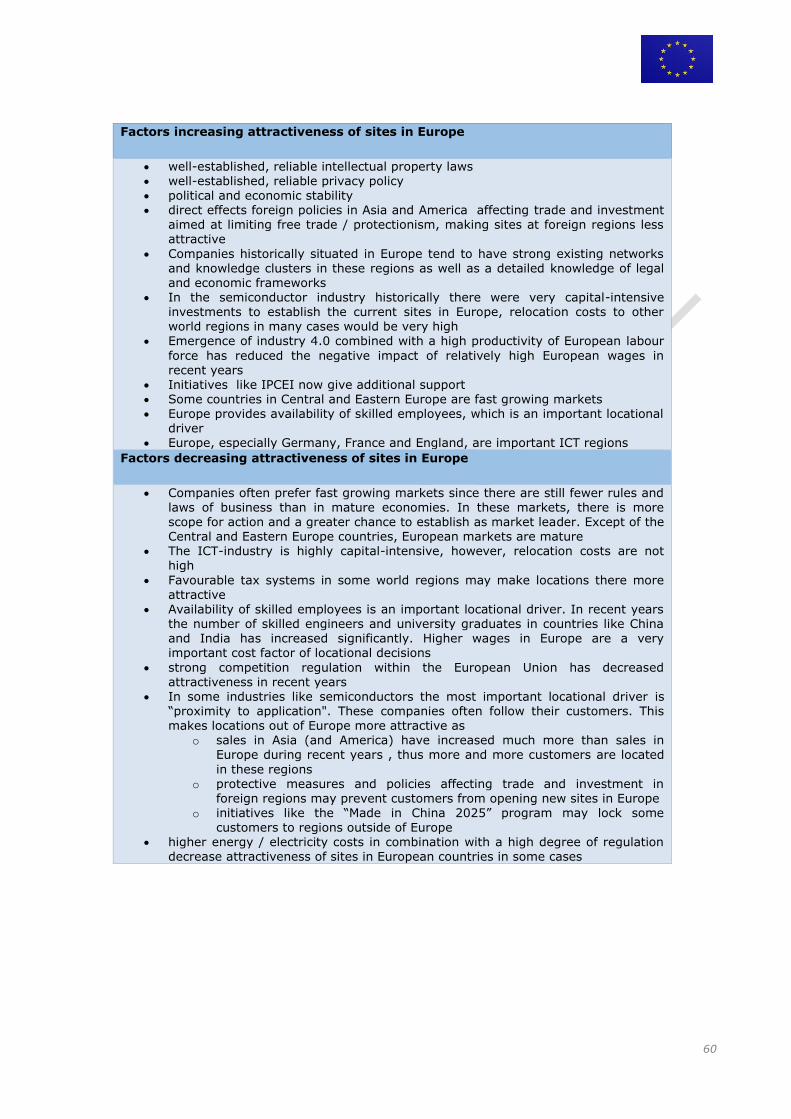
60
Factors increasing attractiveness of sites in Europe
well-established, reliable intellectual property laws well-established, reliable privacy policy political and economic stability direct effects foreign policies in Asia and America affecting trade and investment
aimed at limiting free trade / protectionism, making sites at foreign regions less attractive
Companies historically situated in Europe tend to have strong existing networks and knowledge clusters in these regions as well as a detailed knowledge of legal and economic frameworks
In the semiconductor industry historically there were very capital-intensive investments to establish the current sites in Europe, relocation costs to other world regions in many cases would be very high
Emergence of industry 4.0 combined with a high productivity of European labour
force has reduced the negative impact of relatively high European wages in recent years
Initiatives like IPCEI now give additional support Some countries in Central and Eastern Europe are fast growing markets Europe provides availability of skilled employees, which is an important locational
driver Europe, especially Germany, France and England, are important ICT regions
Factors decreasing attractiveness of sites in Europe
Companies often prefer fast growing markets since there are still fewer rules and laws of business than in mature economies. In these markets, there is more scope for action and a greater chance to establish as market leader. Except of the Central and Eastern Europe countries, European markets are mature
The ICT-industry is highly capital-intensive, however, relocation costs are not high
Favourable tax systems in some world regions may make locations there more
attractive Availability of skilled employees is an important locational driver. In recent years
the number of skilled engineers and university graduates in countries like China and India has increased significantly. Higher wages in Europe are a very important cost factor of locational decisions
strong competition regulation within the European Union has decreased attractiveness in recent years
In some industries like semiconductors the most important locational driver is “proximity to application". These companies often follow their customers. This makes locations out of Europe more attractive as
o sales in Asia (and America) have increased much more than sales in Europe during recent years , thus more and more customers are located
in these regions o protective measures and policies affecting trade and investment in
foreign regions may prevent customers from opening new sites in Europe o initiatives like the “Made in China 2025” program may lock some
customers to regions outside of Europe higher energy / electricity costs in combination with a high degree of regulation
decrease attractiveness of sites in European countries in some cases
61
6. Policy toolbox for the upgrade of the EU industry in GVCs
The European Commission stresses in a Communication of 2017 “a new industrial age”
with economic, societal and environmental transformations and technological
breakthroughs (e.g. robotics, Internet of Things, artificial intelligence). These changes go
along with automation, digitized manufacturing processes and the nature of work.
Furthermore, industry is more and more integrated in global value chains with important
service components. In this Communication it is suggested that the Member States, EU
institutions and industry itself need important efforts “to maintain and reinforce Europe`s
industrial leadership.” This means that it is for instance necessary to fill the missing links
in relevant value chains. One important step is to facilitate the integration of European
companies in global value chains in R&D and innovation which are the essential drivers of
industrial competitiveness. Besides this, missing links in value chains have to be filled
with investment in a strategic way as demonstrated in the field of new batteries for smart
mobility. In this Communication it is also stressed that there has to be a focus on
“strategic value chains” in new technology which has to be well coordinated and financed
by public authorities and industries from several Member States. In another recent
Communication on “Strengthening Innovation in Europe’s Regions” the European
Commission (2017b) stresses the beneficial link between innovation and smart
specialisation in the regions. The Smart Specialisation Strategy (S3) has the aim to
encourage Europe’s regions to identify their specific competitive advantages to better
prioritise public research and innovation. Another import step is therefore to organise
new forms of co-operation on an inter-sectoral level and across regions. This means
global value chains in R&D and innovation are an important additional element of S3 in
Europe.
Upgrading industry in the EU by using policy instruments needs concrete instruments and
mixed instruments. Otherwise there is the risk that the current industrial renaissance is
just a flash in the pan. The following policy tool box shows special instruments and
combinations of policy instruments e.g. for the appropriate development of human
resources, efficient research and innovation infrastructures and absorptive capacities and
the identification of needs of companies R&D and innovation linked with their existing
and new GVCs. Besides this, the outline based on the case studies on companies of the
studied sectors (pharmaceutical, automotive, aerospace and ICT) and interviews done for
this study provide options on how public authorities on different levels can tackle new
challenges for innovation and industry by organizing collaborative opportunities for
innovation und industrial actors.
When the instruments of the policy tool box to upgrade GVC in R&D and innovation in
Europe is described in the following figures a distinction between short term and
medium/long term instruments and options is suggested. The following figure shows a
number of instruments which fall into three categories (regulatory, economic and
financial, soft). Option 1 combines 3 short term instruments which are of low costs.
Option 1 is of low cost since for activities like matchmaking events and studies just very
limited resources are needed. Option 2 (see next figure) combines 5 short term
instruments which are of medium costs. Option 2 is of medium cost because EU actions,
programmes and initiatives discussed here usually have a medium time horizon.
Depending on the resources available Option 1 and 2 could be combined.
Figure 11: Policy instruments for an ambitious short term policy: Option 1
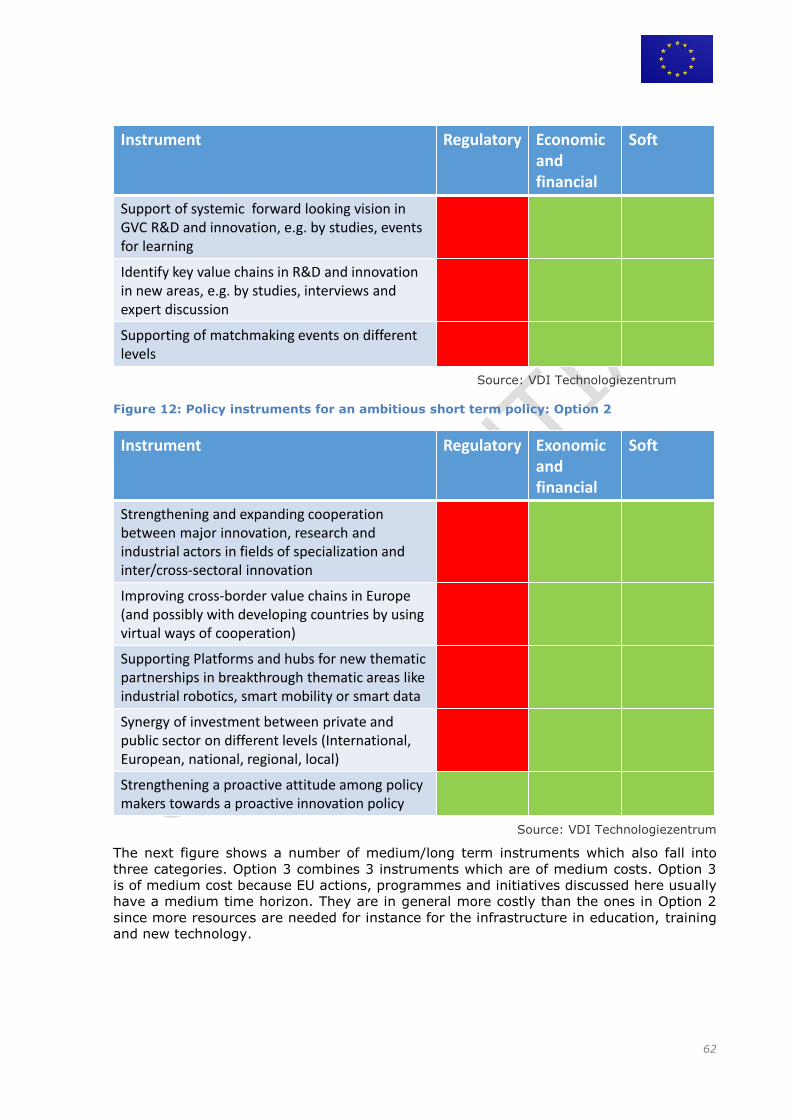
62
Source: VDI Technologiezentrum
Figure 12: Policy instruments for an ambitious short term policy: Option 2
Source: VDI Technologiezentrum
The next figure shows a number of medium/long term instruments which also fall into
three categories. Option 3 combines 3 instruments which are of medium costs. Option 3
is of medium cost because EU actions, programmes and initiatives discussed here usually
have a medium time horizon. They are in general more costly than the ones in Option 2
since more resources are needed for instance for the infrastructure in education, training
and new technology.
Instrument Regulatory Economicandfinancial
Soft
Support of systemic forward looking vision in GVC R&D and innovation, e.g. by studies, events for learning
Identify key value chains in R&D and innovation in new areas, e.g. by studies, interviews and expert discussion
Supporting of matchmaking events on different levels
Instrument Regulatory Exonomicandfinancial
Soft
Strengthening and expanding cooperation between major innovation, research and industrial actors in fields of specialization and inter/cross-sectoral innovation
Improving cross-border value chains in Europe (and possibly with developing countries by using virtual ways of cooperation)
Supporting Platforms and hubs for new thematic partnerships in breakthrough thematic areas like industrial robotics, smart mobility or smart data
Synergy of investment between private and public sector on different levels (International, European, national, regional, local)
Strengthening a proactive attitude among policy makers towards a proactive innovation policy
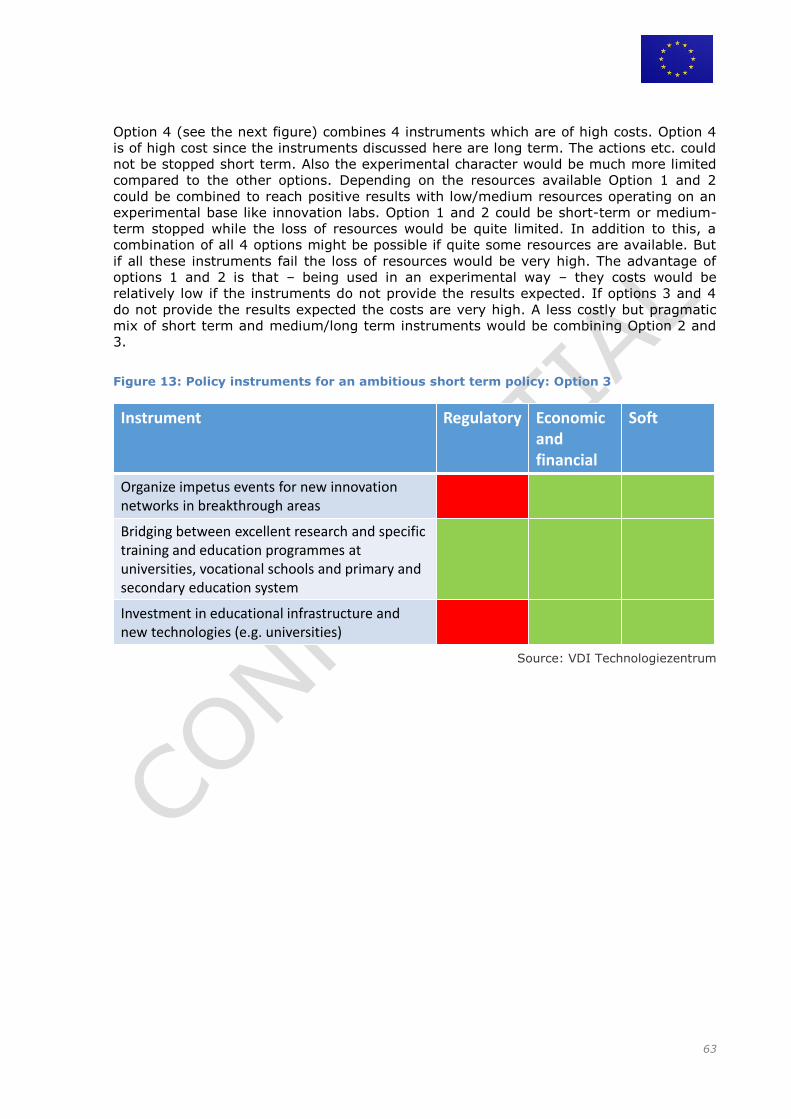
63
Option 4 (see the next figure) combines 4 instruments which are of high costs. Option 4
is of high cost since the instruments discussed here are long term. The actions etc. could
not be stopped short term. Also the experimental character would be much more limited
compared to the other options. Depending on the resources available Option 1 and 2
could be combined to reach positive results with low/medium resources operating on an
experimental base like innovation labs. Option 1 and 2 could be short-term or medium-
term stopped while the loss of resources would be quite limited. In addition to this, a
combination of all 4 options might be possible if quite some resources are available. But
if all these instruments fail the loss of resources would be very high. The advantage of
options 1 and 2 is that – being used in an experimental way – they costs would be
relatively low if the instruments do not provide the results expected. If options 3 and 4
do not provide the results expected the costs are very high. A less costly but pragmatic
mix of short term and medium/long term instruments would be combining Option 2 and
3.
Figure 13: Policy instruments for an ambitious short term policy: Option 3
Source: VDI Technologiezentrum
Instrument Regulatory Economicandfinancial
Soft
Organize impetus events for new innovation networks in breakthrough areas
Bridging between excellent research and specific training and education programmes at universities, vocational schools and primary and secondary education system
Investment in educational infrastructure and new technologies (e.g. universities)
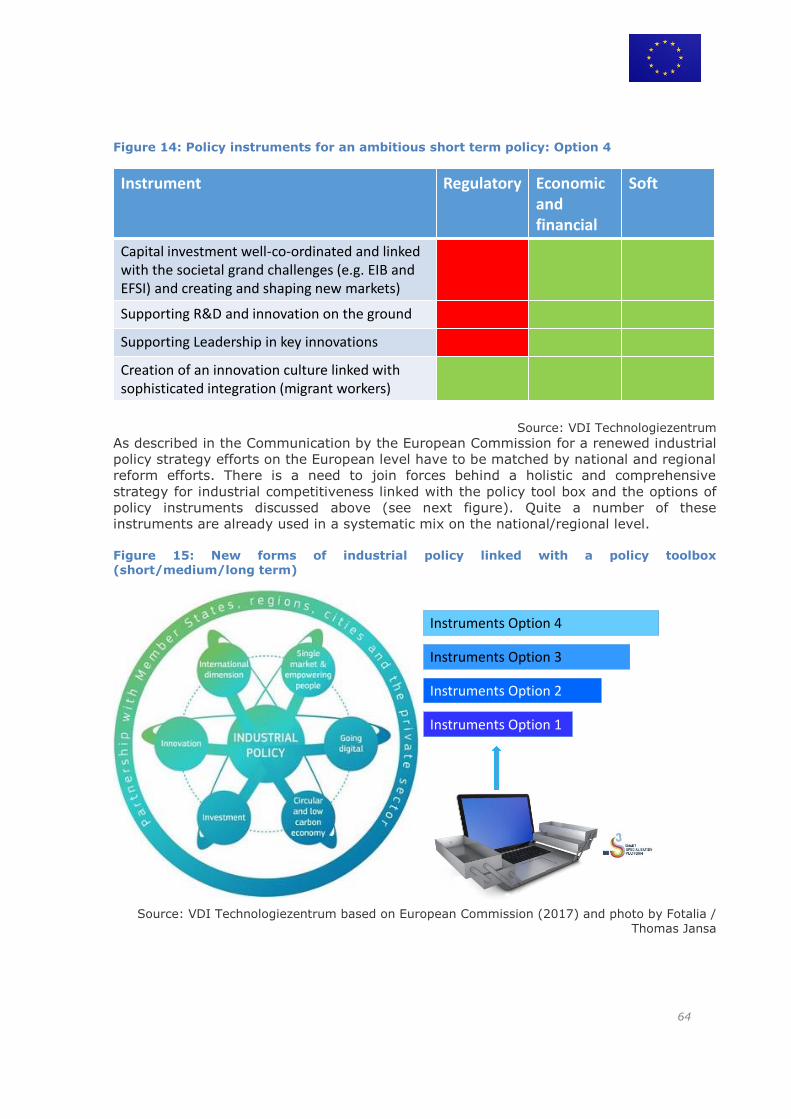
64
Figure 14: Policy instruments for an ambitious short term policy: Option 4
Source: VDI Technologiezentrum
As described in the Communication by the European Commission for a renewed industrial
policy strategy efforts on the European level have to be matched by national and regional
reform efforts. There is a need to join forces behind a holistic and comprehensive
strategy for industrial competitiveness linked with the policy tool box and the options of
policy instruments discussed above (see next figure). Quite a number of these
instruments are already used in a systematic mix on the national/regional level.
Figure 15: New forms of industrial policy linked with a policy toolbox (short/medium/long term)
Source: VDI Technologiezentrum based on European Commission (2017) and photo by Fotalia /
Thomas Jansa
Instrument Regulatory Economicandfinancial
Soft
Capital investment well-co-ordinated and linked with the societal grand challenges (e.g. EIB and EFSI) and creating and shaping new markets)
Supporting R&D and innovation on the ground
Supporting Leadership in key innovations
Creation of an innovation culture linked with sophisticated integration (migrant workers)
Instruments Option 1
Instruments Option 2
Instruments Option 3
Instruments Option 4
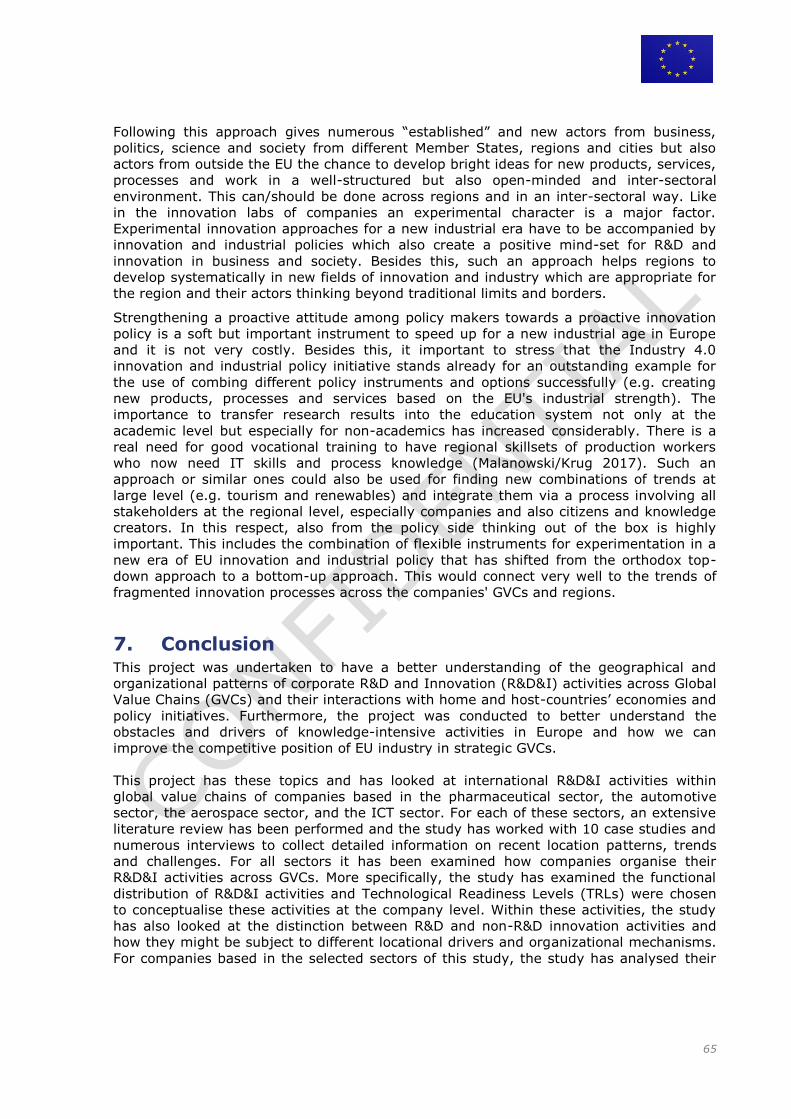
65
Following this approach gives numerous “established” and new actors from business,
politics, science and society from different Member States, regions and cities but also
actors from outside the EU the chance to develop bright ideas for new products, services,
processes and work in a well-structured but also open-minded and inter-sectoral
environment. This can/should be done across regions and in an inter-sectoral way. Like
in the innovation labs of companies an experimental character is a major factor.
Experimental innovation approaches for a new industrial era have to be accompanied by
innovation and industrial policies which also create a positive mind-set for R&D and
innovation in business and society. Besides this, such an approach helps regions to
develop systematically in new fields of innovation and industry which are appropriate for
the region and their actors thinking beyond traditional limits and borders.
Strengthening a proactive attitude among policy makers towards a proactive innovation
policy is a soft but important instrument to speed up for a new industrial age in Europe
and it is not very costly. Besides this, it important to stress that the Industry 4.0
innovation and industrial policy initiative stands already for an outstanding example for
the use of combing different policy instruments and options successfully (e.g. creating
new products, processes and services based on the EU's industrial strength). The
importance to transfer research results into the education system not only at the
academic level but especially for non-academics has increased considerably. There is a
real need for good vocational training to have regional skillsets of production workers
who now need IT skills and process knowledge (Malanowski/Krug 2017). Such an
approach or similar ones could also be used for finding new combinations of trends at
large level (e.g. tourism and renewables) and integrate them via a process involving all
stakeholders at the regional level, especially companies and also citizens and knowledge
creators. In this respect, also from the policy side thinking out of the box is highly
important. This includes the combination of flexible instruments for experimentation in a
new era of EU innovation and industrial policy that has shifted from the orthodox top-
down approach to a bottom-up approach. This would connect very well to the trends of
fragmented innovation processes across the companies' GVCs and regions.
7. Conclusion This project was undertaken to have a better understanding of the geographical and
organizational patterns of corporate R&D and Innovation (R&D&I) activities across Global
Value Chains (GVCs) and their interactions with home and host-countries’ economies and
policy initiatives. Furthermore, the project was conducted to better understand the
obstacles and drivers of knowledge-intensive activities in Europe and how we can
improve the competitive position of EU industry in strategic GVCs.
This project has these topics and has looked at international R&D&I activities within
global value chains of companies based in the pharmaceutical sector, the automotive
sector, the aerospace sector, and the ICT sector. For each of these sectors, an extensive
literature review has been performed and the study has worked with 10 case studies and
numerous interviews to collect detailed information on recent location patterns, trends
and challenges. For all sectors it has been examined how companies organise their
R&D&I activities across GVCs. More specifically, the study has examined the functional
distribution of R&D&I activities and Technological Readiness Levels (TRLs) were chosen
to conceptualise these activities at the company level. Within these activities, the study
has also looked at the distinction between R&D and non-R&D innovation activities and
how they might be subject to different locational drivers and organizational mechanisms.
For companies based in the selected sectors of this study, the study has analysed their
66
locational strategy of R&D&I activities and how these activities have an impact on the
home and host region. Furthermore, the project has looked at corporate governance
modes to undertake these innovative activities and the differences across sectors. As
part of the analysis, the attractiveness of the European Union has also been assessed for
R&D&I activities within these sectors and derived policy challenges and recommendation
on how the EU can improve its attractiveness. All these topics were examined with the
help of an analytical framework and carefully developed propositions with respect to
drivers and impact of location decisions. These propositions were tested for each case
study and the broader sector. In addition, a cross-case analysis has been conducted to
test to what extent these propositions can be validated across sectors
The project has documented that R&D&I activities are still increasingly internationally
dispersed. Yet, R&D&I activities are very heterogeneous and many different types of
innovative activities exist. R&D&I activities for instance exist of R&D and non-R&D
innovation activities which can be both very important in the innovation process. The
latter activities however only receive limited attention in the broader literature. In this
study it is shown that the most important non-R&D innovation activities are: (i) design to
improve and adapt existing products and processes and (ii) the acquisition of machinery
and equipment. This study has also contended that the importance of non-R&D
innovation activities is rising more recently, although the important of these activities
differs significantly across sectors. Non-R&D innovation activities are especially important
in the automotive industry where they account for around 13-55% of the total R&D&I
budget. Throughout the study it however became clear that it remains difficult to find
suitable indicators to monitor these activities by multinationals: they are not always
monitored internally by the firms, are difficult to grasp and are often included in the
traditional R&D activities.
It is also shown that industry-specific and value chain characteristics are important
drivers for R&D&I location decisions but are not more important than country
characteristics. It is however contended that value chain considerations are becoming
more important given that companies are increasingly breaking up their value chain and
are engaging more and more in alliances and collaborations with companies located down
– or upstream. Furthermore, the study has shown that locational determinants and
patterns are highly dependent on the type of R&D&I activity: e.g. innovative activities at
the end of the TRL scale (more applied innovative activities, TRL6-9) are driven towards
regions with large market demand (mostly in South-East Asia), while the activities at the
start of the TRL scale (mainly TRL2-5) are driven towards regions with advanced
technological capabilities and a highly-skilled labour force. On top of that, the study
shows that across sectors, non-R&D innovation activities show a slightly different location
pattern compared to more traditional R&D activities.
The study also shows that corporate strategies are decisive in determining the firm’s
location choice: location choices are for instance often driven by strategic takeover
decisions and specialisation strategies. Based on the case studies, it is shown that the
governance mode to undertake international R&D&I activities is also driven by the
corporate strategy. There is however a clear trend towards collaborative R&D networks
and a trend towards working more in open innovation network where firms engage in
strategic alliances with key partner firms. Patent cooperation and patent pools with
competitors and suppliers are also becoming more common. This governance mode is
however also dependent on the type of R&D&I activities: joint ventures are for instance
more often used for innovative activities closer to the commercialisation phase, while
alliances are more often formed for technological research or even fundamental research.

67
The study also documents that R&D&I activities are still often collocated with production
activities: often, though it largely depends on to what extent the industry is science-
based and one the type of R&D&I activity; innovative activities closer to
commercialisation (situated at the higher TRL’s) are more often collocated with
manufacturing facilities or assembly lines. The study has also shown that non-R&D
innovation activities such as design activities are often collocated.
Another important finding is that locational patterns are highly industry-specific: most
knowledge-intensive industries of our study are clearly driven towards regions with
strong technological capabilities and strategic assets, while less knowledge-intensive
industries are more driven towards regions with large market demand and favourable
factor costs. Highly capital-intensive industries concentrate key R&D&I activities to a
larger extent than less capital-intensive industries.
When looking at the impact of international R&D&I activities, it can be confirmed that
these activities increase not only the overall innovation performance of the firm but did
also contribute to the innovativeness of the region. In the project it is however argued
and confirm by multiple interviewees that the he extent of this impact is highly
contingent on the network of the firm in the host market and the openness of the local
foreign ecosystem. Overall firm innovation performance is also increased when
companies try to maintain close links between activities in the home and host region and
try to stimulate regular exchanges about best practices, new developments, process
improvements and new ideas that will lead to cross-fertilization of ideas coming from
different regions. The impact also strong depends on the type of R&D&I and it is
contended that home-base augmenting R&D activities have a stronger impact on the
innovation performance than home-base exploiting R&D as these international activities
are more instrumental for generating new ideas and concepts (especially activities
situated at the TRL stages 1-4).
Another important conclusion of the project is that knowledge spillovers and technology
transfers are mainly driven by the governance mode, type of R&D&I activity (TRL level)
and government stimulus; the amount of knowledge spillovers will for instance be the
highest for strong equity-based governance models (i.e. subsidiaries and acquisitions)
and activities at lower TRL levels (more basic-oriented research). The government can
also stimulate knowledge spillovers through the implementation and support of
collaborative projects (e.g. Clean Sky and Sesar in the aerospace sector).
Another important finding of the study is that the common fear that R&D&I
internationalisation is hollowing out domestic innovation is unfounded. This is mainly
because firms in knowledge-intensive industries try to reduce redundancy in international
operations and maximize complementarity by organizing its R&D&I centres in such a way
that each location has a specific expertise and focus. Furthermore, foreign R&D&I
activities are increasingly granted a high independency and are organized in such a way
that they feed in and complement the ideas of the main R&D&I hub in the home country.
On top of that, most-strategic knowledge is mostly still kept at the headquarters in the
home region.
When looking at the factors that determine the attractiveness of the European Union, the
study has evidently highlighted differences across sectors in the project, but several
common factors were observed (for the sectors within this study).
68
According to interviewees (industry representatives, company managers and industry
experts) factors that increase the attractiveness of Europe are among others: Reliable IP laws Political and economic stability Strong existing networks and markets Skilled labour force Academic excellence Growing excellence in industry 4.0 and high production standards (ICT, mobility) Growing markets in Eastern Europe Protectionism abroad EU collaborative / cluster initiatives Developed infrastructure (e.g. transportation, infrastructure to conduct clinical trials) Tax conditions to stimulate R&D
Factors that are decreasing Europe’s attractiveness include among others: Skilled employees combined with low wages (mainly in Asia: India, China …) Favourable tax systems abroad Restrictive labour market (e.g. pharmaceutical regulations in Europe) Lack of investments in new infrastructure (e.g. for electromobility) Proximity to customers abroad is becoming increasingly important Protectionism preventing customers moving to Europe Good but very costly infrastructure, energy costs Little support for high TRL investments (e.g. in aerospace and pharma) No central R&D organizations that are steering research in the sector (e.g. in pharma)
These factors already show that government can play an instrumental role in increasing
Europe’s attractiveness. This was clearly confirmed within this study as well. The
government can play an important role in attracting/sustaining R&D&I investments, by
focusing on improvements of the infrastructure, cost-related aspects and the legal and
political (stability/continuity) environment. Within the study, some interviewees have
also claimed that more government funding should flow to R&D&I activities at the later
TRL stages. Currently, by far the most R&D&I funding goes to R&D&I activities at the
lower TRL phases although the large majority of the corporate R&D&I budget flows to
activities at the later TRL phases. Especially in capital-intensive industries the share of
these activities is very high (e.g. in the pharmaceutical sector innovative activities
situated at TRL6-8 account for 45-55% of the total R&D&I budget). Large multinationals
have limited problems with financing these stages, but smaller firms currently face many
difficulties with finding financing for these activities (especially since R&D subsidies
typically focus on the financing of R&D personnel, while activities at the later TRL phases
typically consist more of capital expenditures, e.g. for demonstration infrastructure, pilot
lines, validation and certification tests) and as a consequence often fail to reach the final
commercialisation phase. Additionally, it was also argued that non-R&D innovation
activities are more difficult to finance than traditional R&D innovative activities.
Within the study a policy toolbox has been developed to move beyond the current
European, national, regional and sectoral policy instruments and which provided mixes of
policies based on the insights obtained throughout the study.
As part of the policy toolbox it has been argued that there exist three categories of policy
instruments that are most accepted in the literature on innovation policy instruments:
a) regulatory instruments (IPRs, university statutes), b) economic and financial
instruments (tax exemptions, competitive research funding, …) and c) soft instruments
(voluntary standardisation, codes of conduct, public-private partnerships). The case
studies and interviews with company representatives collected for this study show a high
interest in these new policy instruments to improve the attractiveness of Europe for
innovative activities. A strong interest was especially expressed in the last two
categories. It was also shown that company representatives prefer proactive instruments
for bridging the gap between high-level research and a suitable education plus an
69
adequate infrastructure thus strengthening the training of highly skilled young academics
at universities and skilled workers at vocational schools for instance in the areas of ICT,
Big Data, Robotics, Life Sciences and New Materials to upgrade Global Value Chains in
R&D&I in Europe. It was also argued that for innovations with a highly experimental
character (e.g. innovations labs), a highly flexible innovation and industrial policy is
necessary. A number of interviewees have also made the point that there is a worldwide
trend towards more multidisciplinary/multi-sector collaborations. These interviewees
stress that the EU should stimulate and support these projects more since they are
essential for the further industrial modernisation of European industry. From the
interviewees’ point of view it was also argued the Smart Specialisation Strategy – if
followed more strictly – could be a good strategy to reduce the enormous duplication of
research efforts within the EU and could align research efforts better across borders.
This study has shed more light on the international fragmentation of R&D&I activities
within global value chains of multinational companies, but at the same time also points to
avenues of further research. Within the study has for instance shown that innovation labs
of companies with a highly experimental character are becoming more and more a major
factor in R&D and innovation, yet little research is done on these type of activities and
accordingly, more qualitative and quantitative research on this recent development is
needed.
Another field with a lack of solid information is the role of cultural diversity for innovation
and innovation and industrial policy. Recent research studies on diversity and innovation
show mixed results on this question. Some of the studies come to the general conclusion
that diversity has a positive influence on innovation (e.g. Mir-Babayev 2017; Ozgen et al.
2013). Other recent studies point out that the ethnic background might play an
important role and that an improved innovation level can be empirically observed when
well educated ethnic groups from Asia participate in innovation activities (Gompers/Wang
2017; Brixy et al.). These first results show already that there does not seem to be a fast
answer to this question. Very interesting is that the companies which were interviewed
for this study pointed out that quite often there is a quite high degree of cultural diversity
for instance their teams working in innovation labs with a highly experimental character.
Besides this, more information is needed on how to transfer excellent research into the
education system not only at the academic level but especially for non-academics has
increased considerably.
Recent research on innovation and industrial policy stresses the need of an intelligent
governance of policy instruments and measures. Scholars like Edler/Fagerberg (2017)
make the case for four governance principles. These are anticipation, participation,
deliberation and transparency. From there point of view these principles are necessary to
ensure that societal preferences and concerns are taken into account in R&D and
innovation processes and policies. Kuhlmann/Ordonez-Matamoros (2017) argue that in
addition it is necessary to discuss failures of innovation governance from the past to
better understand opportunities of today. One very important governance problem in the
field of innovation and industrial policy is that there is still a lack of concern of the
international dimension of R&D and innovation. These policies are quite often still
organized on the national and/or regional level and not like for instance newly establishes
innovation labs of companies on an international level. To get around this problem it is
necessary to get more information on how linking the international dimension GVCs with
strategies already existing.

70
71
Annex Box 3: Propositions for the pharmaceutical sector
Proposition 1) Industry-specific and value chain characteristics are key drivers
for R&D&I location decisions and are becoming more important than country
characteristics.
In the broader literature review we argued that within the location decision process of
R&D&I activities there is a strong interplay between host country characteristics, and
industry-specific and value chain considerations, with the latter factors becoming
increasingly important.
It could be argued that given that this industry is highly-R&D intensive it mainly locates
its foreign R&D&I activities in locations with high technological capabilities and in regions
known for the presence of well-developed industry clusters. The desk research results
for the pharmaceutical industry showed that the value chain considerations are not top
priority when contemplating where to locate a new R&D&I facility. For instance, R&D
activities within the pharmaceutical industry can be more easily separated from
production activities (compared to other industries) and traditionally pharmaceutical
companies cover a large part of the innovation value chain (although this latter aspect is
changing more recently and firms are increasingly outsourcing parts of their R&D
pipeline). In Europe we can observe that pharmaceutical companies concentrate their
R&D&I and production activities in a few regions and that both activities are often
located in close vicinity. However, we see that this pattern is historically driven (the
breaking up of the value chain in the pharmaceutical industry is a more recent
phenomenon) and not driven by considerations to benefit from co-location.
In the case studies, it was confirmed that value chain considerations only play a limited
role in determining the location decision of pharmaceutical companies. It is argued that
host country characteristics such as the market demand, the technological capabilities
and the opportunities to network with other partners in the country/region are still more
decisive in explaining the firm’s location behaviour.
Nevertheless, it becomes clear that value chain considerations are becoming more
important and this for several reasons. One of the reasons is the emergence of large
developing markets where many inventive products and instruments are based on cost
innovation processes, and for this innovation process co-location of production and
R&D&I activities is more necessary. Companies that would like to benefit from the rise of
these large markets should consequently co-locate their R&D&I activities more with
production activities in these markets. Furthermore, for activities located at the later
TRL stages, it can highly beneficial to co-locate R&D&I activities with production
activities given that these stages require an extensive upscaling process of the clinical
trials. Especially for phase 3 trials (TRL8) it can be important to have a close connection
to the manufacturing facility. Given that this phase takes a large chunk of the total
R&D&I budget, companies are starting to realize that it is important to co-locate these
activities in this phase of the innovation process. Value chain considerations are also
becoming more important given that companies are increasingly breaking up their value
chain and are engaging more and more in alliances and collaborations with companies
located down – or upstream. As such, it is becoming more important to be located close
to for instance suppliers or biotech companies that could perform part of the needed
72
basic research.
Proposition 2) Location determinants and patterns are highly dependent on the
type of R&D&I activity (TRL).
In the desk research, we have already documented that the location drivers for outward
R&D activities in the pharmaceutical industries are largely dependent on the type of R&D
offshored (i.e. the TRL). Non-clinical studies for example (TRL 1- TRL 4) generally occur
in the more advanced regions which have the technology for undertaking these studies
and which typically also have a tradition of partnerships between research institutions
such as universities. Accordingly, these early stage research activities are mainly located
in advanced regions such as Northern America, the European Union and Japan. Late
preclinical research (TRL 5) and Phase 1 trials (TRL 6) also often entail greater
technological challenges than the following stages, so currently they are also
predominantly located in the triad countries. Recent studies however show that
emerging markets (and not only in Asia) are getting increasingly important as locations
for clinical trials (the later TRL stages). That is partly because cost considerations are
also becoming very important in the location decision process as clinical trials can
account for between 40% and 60% of total drug development and merging countries
can be very important to reduce operational costs. Cost reductions can be the highest
for operating phase 2 and phase 3 studies in emerging market regions as on average,
they account for more than 40% of total R&D investments. The internationalization of
clinical trials to these regions can also shorten the duration as they often have a great
potential for study participants, which can significantly accelerate the recruitment
process. We have also documented that since cost reductions are highest for Phase 2
and Phase 3 clinical trials, most of the trials undertaken in emerging countries can be
found in of these 2 types of R&D activities. It was also indicated in interviews that
clinical trials starting from phase 2 (TRL 7) are increasingly internationalized to non-
developed markets as the market demand from these countries (especially in Asia) is
getting more and more important and that medicines and vaccines need to adjusted to
different genes (across continents)?
In the case studies we have confirmed that location determinants and patterns are
indeed highly dependent on the type of R&D&I activity. These case studies for instance
show a shift of activities at the later stages of the TRL to Asian regions, but not mainly
because of cost considerations, but also to access these large markets. It is argued that
R&D&I activities at the end of the TRL scale (more applied innovative activities) are
driven towards regions with large market demand (e.g. China), while the activities at
the beginning of the TRL scale are driven towards regions with advanced technological
capabilities and a highly-skilled labour force (e.g. USA and Germany). It is also indicated
that for more strategic R&D&I activities (e.g. fundamental research, preclinical
research), strategic considerations also become more important. One of the surveyed
companies for instance indicated that they want to maintain the most strategic activities
close to its HQ in order to better safeguard and nurture this knowledge.
Proposition 3) Corporate strategies are decisive in determining the location
choices.
Corporate strategies haven been proven to be very decisive in determining the location
choice of pharmaceutical companies. This propositions has been confirmed clearly by all
case studies. One of the companies for instance argued that the decision to enter the
Chinese market was largely driven by strategic considerations (to set up R&D
antenna/scouting agency). Another company indicated that most of its foreign R&D&I
73
locations were driven by recent strategic takeover decisions, while another company
pointed out that its foreign R&D&I location pattern is mainly driven by a clear
specialisation (in terms of research expertise and topics) strategy.
Proposition 4) The extent to which R&D&I activities are collocated with
production activities, strongly depends on the type of R&D&I activity involved.
The broader literature showed that benefits can be derived from collocating R&D&I
activities with production activities as important feedback effects exist between both
types of value chain activities. It has also been show that that prior production activities
in a host location increases the probability that later R&D&I activities follow in the same
host region. Nevertheless, weak co-location forces can be observed in science based
industries, such as the pharmaceutical industry, where firms’ R&D&I laboratories can
have a strong focus on scientific discovery and basic research. The extent to which
R&D&I activities are collocated with production activities could however strongly depend
on the type of R&D&I activity involved.
This is clearly confirmed by all the case studies. In general, it is argued that co-location
of R&D&I with production is not necessary, but for R&D&I activities situated at the later
stages of the TRL scale this co-location becomes more important. One of the surveyed
companies also indicated that R&D&I activities in the field of competitive manufacturing
and in the field of the implementing new manufacturing technologies and processes take
place right at their production sites.
Proposition 5: The organization of R&D&I activities across GVCs is
industry/sector specific. Industry differences are observed at the level of the
location decision, the impact, the governance mode applied. Even within
industry, differences can occur depending on the R&D&I activities (TRL scale)
of the company.
See cross-sector analysis
Proposition 6) Outsourcing and offshoring trends are highly industry-specific.
The international fragmentation of R&D&I activities is highly dependent on the
industry and R&D&I subfunctions/activities or tasks. Highly capital-intensive
industries concentrate key R&D&I activities to a larger extent than less capital-
intensive industries.
Literature shows that the international fragmentation of R&D&I activities is highly
dependent on the complexity, knowledge-intensity and global trends within the industry.
Consequently, outsourcing and offshoring trends will differ significantly across industries.
The pharmaceutical industry is an industry with a very particular outsourcing and
offshoring behaviour. Until the late 1990s, most companies performed almost everything
in-house and offshoring was very rare. This has however changed dramatically and
nowadays these companies are increasingly breaking up their value chains and
outsourcing and collaboration agreements occur more and more at all segments of the
innovation value chain. Nevertheless, given that the pharmaceutical industry is a highly
capital-intense industry offshoring and relocation processes are not that widespread as
in other industries (given that relocation costs also could be high). For the companies
involved in the case studies we have also documented that the large majority of their
R&D&I activities is still being conducted at the HQ.
74
Proposition 7) There is a broad range of corporate governance mechanisms and
modes to sustain corporate R&D&I across GVCs. We expect these governance
mechanisms/modes to be highly dependent on the type of R&D&I activity/task
performed. A trend towards global R&D&I networks (originating due to
alliances, collaboration and/ or subcontracting) can be observed, although they
are often difficult to manage. The corporate strategy will however be
determinant for the decision on the governance mechanism.
In the pharmaceutical industry a broad range of governance modes is being used to
manage international R&D&I activities: Subsidiaries, Subcontracting, Collaborations,
Strategic partnerships, etc. Although, the R&D&I operations of one of the case study
companies are still very internally driven (subsidiaries), all companies clearly indicate
there is trend towards more external governance modes. More specifically, there is a
clear trend towards collaborative R&D networks. These networks are especially formed
for activities at the lower levels of the TRL scale (basic research) and often with
academic partners and biotech companies. However it is very important to remark that
the type of network and collaboration is very dependent on the partner. With other
competing pharmaceutical companies collaborations will for instance focus more on
complementary activities/topics while collaborations with academic partners (not
considered as competitors) can also focus on non-complementary and or strategic
activities/topics. Joint ventures are more popular in the area of production activities.
Based on our case studies we can also state there is an interest towards more
collaborations with partners active in complementary industries but with technologies
and applications that could also be useful in the pharmaceutical industry (e.g. robotics,
microelectronics, …)
Proposition 8) The impact of the offshoring of R&D&I activities on the home or
host country mainly occurs via increased productivity and innovation
performance. This is however highly dependent on a set of contingences
related to the firm’s embeddedness and technological capabilities.
In the literature, most studies stress the positive aspects and opportunities that foreign
R&D&I activities have for both the home and host region (mainly related to increases in
productivity and innovation performance). It is however argued that this is highly
dependent on a set of contingences related to the firm’s embeddedness and
technological capabilities.
The case studies confirmed this picture and stress that the international R&D&I
operations clearly increased the overall innovation performance of the firm and
contributed to the innovativeness of the region. The companies involved in the case
studies claimed that the extent of the impact that a foreign R&D&I affiliate has is highly
dependent on its network in the foreign market and the openness of the local
ecosystem.
Companies also try to maintain close links between activities in the home and host
region and try to stimulate regular exchanges about best practices, new developments,
process improvements and new ideas that will lead to cross-fertilization of ideas coming
from different region, which will eventually lead to an increased overall innovation
performance. As such the impact that a foreign R&D&I affiliate has on the home and
host region, and the firm itself depends on the embeddedness of foreign affiliate in the
host region, on the embeddedness of the parent company in its home region, but also
on the embeddedness of the foreign subsidiary in the parent company.
75
It is also stressed that the interaction that the foreign affiliate has with other firms in the
host region and the amount of mutual knowledge spillovers with local firms is highly
dependent on the intellectual property rights regime in the host regime. If the host
region is characterized by a weak IPR regime, pharmaceutical companies are more
inclined to implement measures to safeguard their knowledge and are less likely to
transfer strategic knowledge to the foreign affiliate and are more likely to limit its
responsibilities and independency.
Proposition 9) The home-base augmenting R&D argument is increasingly
important in the location decision of companies. Home-base augmenting R&D
will have a stronger impact on the innovation performance than home-base
exploiting R&D.
Literature indicates that the motives for companies to engage in R&D&I
internationalisation are either aimed to exploit existing technologies (home-base
exploiting R&D) or creating new technologies and augmenting the existing knowledge
base (home-base augmenting R&D). Furthermore, it has shown that across industries,
this latter motive has become more important and has also been argued that home-base
augmenting R&D will lead to the highest increases in innovation performance.
Results from the case study analysis indicates that for the pharmaceutical industry,
home-base augmenting motives are also gaining ground (although one of the
interviewed companies claimed that these motives are in balance). Additionally, it is
confirmed that home-base augmenting R&D activities will have the strongest impact on
the firm’s overall innovation performance as these international activities are
instrumental for generating new ideas and concepts (more than home-base exploiting
R&D activities).
Proposition 10) The government can play an important role in
attracting/sustaining R&D&I investments, by focusing on improvements of the
infrastructure, cost-related aspects and the legal and political
(stability/continuity) environment.
The results indicated in Error! Reference source not found. Table 17 which
summarizes the factors that determine the attractiveness of Europe for pharmaceutical
companies immediately makes clear that the government can play a substantial role in
attracting R&D&I investments. Favourable tax conditions, strong intellectual property
rights, flexible labour laws, funding opportunities, cluster stimuli, less stringent
regulation, and labour costs are among the factors that could increase the attractiveness
of the region. These are all factors that could be heavily influenced by government policy
measures. The results of the case studies however showed that the infrastructure and
the cost-related aspects are not factors that are decisive in explaining the location
behaviour of all pharmaceutical companies.
Proposition 11) The competitive environment of the host region can
significantly alter a region’s attractiveness.
Some recent studies showed that the competitive environment of the host region can
significantly alter a region’s attractiveness. It has for instance been shown that
technology leading firms tend to avoid highly agglomerated areas or cluster for new
investments because they fear that outgoing knowledge spillovers might endanger their
76
own competitive position. Other studies have documented that firms tend to stay away
from regions characterized by regions where incumbent technology leaders are actively
taking measures to avoid outgoing knowledge spillovers.
In our case studies (where we focus on leading pharmaceutical companies), we actually
find that the competitive environment of the host region in the pharmaceutical industry
is not a decisive factor in explaining a firm’s location decision. It is highlighted that most
established pharmaceutical companies currently are evolving towards a more open
innovation culture and even try to establish collaboration agreements and alliances with
their closest competitors.
Proposition 12) Knowledge spillovers and technology transfers are mainly
driven by the governance mode, TRL level and government stimuli.
This proposition is only partially confirmed by our case studies.
Pharmaceutical companies for instance indicate that the amount of spillovers will
evidently be the highest among internal branches of the company (subsidiaries) and are
also stimulated the most within alliances and collaborations. One of the interviewed
companies also regularly organises training and education programmes to stimulate
regular knowledge spillovers and technology transfers. It is also argued that companies
especially try to seek for knowledge spillovers within collaborations at the lower levels of
the TRL scale (i.e. more basis research).
Companies indicate that government stimuli are only partially relevant for stimulating
knowledge spillovers. Governments can however indirectly stimulate knowledge
spillovers between companies by setting up funding programmes that stimulate the
formation of consortia consisting of different (types of) organisations working on a
specific project. Establishing Public-Private-Partnerships (PPP) can also be highly
relevant.
Proposition 13) The common fear that R&D&I internationalisation is hollowing
out domestic innovation is unfounded.
Some studies indicate that foreign R&D&I operations might lead to a possible ‘hollowing
out effect’ of domestic R&D and innovation, which will of course pose a challenge for the
national innovation system of the home country. This is also often feared by popular
press, even though recent empirical evidence does not support this hollowing out effect.
The case study analysis confirm this proposition and claim this fear is unfounded. The
companies involved in our case studies did not report any job losses or negative
relocation effects on the activities in the home region. It is argued that foreign R&D&I
activities of pharmaceutical companies are more complementary with the operations in
the home region because they mainly organize their R&D&I centres in such a way that
each location has a specific expertise and focus (topic wise). This way, redundancy is
also reduced. It is also claimed that foreign R&D&I activities are often given a high
independency but are organized in such a way that they should feed in and complement
the ideas of the main R&D&I hub in the home region such that the knowledge base and
the R&D&I activities of the home regions will further increase.
Box 4: Propositions for the automotive sector
77
Proposition 1) Industry-specific and value chain characteristics are key drivers
for R&D&I location decisions and are becoming more important than country
characteristics.
Overall value chain considerations play a determining role for the companies. The
presence in technologically advanced countries, which are specialized in specific fields, is
highly relevant. Furthermore, the companies desire to locate R&D facilities close to
customers in order to better understand their particular market requirements. Thus, it is
important for automotive companies not to be located only in Europe and USA, but also
in Asia to get a better understanding of Asian customer’s needs. These customer groups
often demand more sophisticated technical features inside of their cars and often prefer
city vehicles, while customers in Germany on average tend to care more about the
efficiency of the engine and safety issues. In addition, OEMs will often be strongly co-
located with their suppliers.
Generally proximity to customers and markets is an important aspect for the
attractiveness of locations. These are often determined by industry-specific
characteristics and technology such as electromobility and autonomous driving.
Locational decisions are also made in order to learn about new and emerging
technologies in the field where those technologies are applied first. If regions lag behind
in the application of those technologies, they become less attractive. This goes hand in
hand with understanding the demands and needs of customers. Suppliers, on the other
hand, often come from all world region. With respect to the acquisition of machinery and
equipment geographical proximity is highly relevant.
In the automotive industry many companies have grown by Mergers and Acquisitions in
a historical process. If a firm is attractive enough for the business model of another
company and acquisition is an attractive option, the location is only one of several
relevant aspects. Thus, it can be regarded a key driver of locational decisions.
Country characteristics on the other hand still remain relevant. Important factors driving
the attractiveness of countries is the supply of skilled employees on the labor market
(e.g. good universities), labor costs, public support and funding programs as well as
mobility and technology infrastructure.
Labour costs are a key locational driver within the industry. We can observe a gradual
investment shift towards regions with lower operating costs. Attractive regions in that
respect are Southern America, Mexico, Eastern Europe and South-East Asia.
Proposition 2) Location determinants and patterns are highly dependent on the
type of R&D&I activity (TRL).
R&D locations decisions are mainly driven by strategic considerations, technology
intensity of the industry as well as heterogeneity among R&D&I activities.
In contrast, non-R&D innovation activities and production activities are rather driven by
the competitive position in the industry, value chain considerations, location
characteristics and local dynamics.
There is a desire to locate R&D facilities close to customers in order to better understand
their particular market requirements. It ensures that development is closely aligned with
the needs of the market, which maximizes the likelihood of financial returns on R&D
expenditures. As a consequence, new international R&D investments are expected to
take place in the regions displaying the strongest growth numbers, such as South
America, India and China. These emerging markets are expected to account for more
78
than 80% of future growth. It is however important to note that new R&D activities in
these markets mainly refer to modifications to existing production vehicles to suit local
market tastes (i.e. more development oriented activities).
A final important location driver of R&D activities is the availability of technological
capabilities and skills. This is especially important for the more research-oriented
activities. These activities will be mainly driven towards developed economies. It is
important for firms to be present in relevant industry clusters to learn from customers
and competitors about new markets and the application of new technologies in these
markets.
Proposition 3) Corporate strategies are decisive in determining the location
choices.
The corporate strategy is highly relevant for the location choice. As was illustrated above
locational choices are often driven by mergers and acquisition decisions and not by
country specific characteristics. Depending on the type of business strategy and if it
focuses rather on quality or costs the locational decision is influenced by labor costs,
availability of skilled personnel and quality standards of the industry cluster.
Proposition 4) The extent to which R&D&I activities are collocated with
production activities, strongly depends on the type of R&D&I activity involved.
As discussed above R&D locations decisions are mainly driven by strategic
considerations, technology intensity of the industry as well as heterogeneity among
R&D&I activities. These are often not co-located with production activities which are
rather driven by the competitive position in the industry, value chain considerations,
location characteristics and local dynamics. Non-R&D innovation activities are often co-
located with production activities.
Proposition 5) The organization of R&D&I activities across GVCs is
industry/sector specific. Industry differences are observed at the level of the
location decision, the impact, the governance mode applied. Even within
industry, differences can occur depending on the R&D&I activities (TRL scale)
of the company.
Product characteristics certainly influence the organization of R&D&I activities. For large
machinery and equipment it is usually too expensive to ship them over long distances.
Small fragile semiconductors within cars usually require a co-location of development
and production sites. Other types of pieces and parts come from all world regions and
geographic distance is less relevant. As products greater differ among different
industries, the organization of R&D&I activities is heterogeneous, too.
See also cross-sector analysis
Proposition 6) Outsourcing and offshoring trends are highly industry-specific.
The international fragmentation of R&D&I activities is highly dependent on the
industry and R&D&I subfunctions/activities or tasks. Highly capital-intensive
industries concentrate key R&D&I activities to a larger extent than less capital-
intensive industries.
79
Outsourcing and offshoring trends are industry-specific. A major reason preventing
relocation to other countries for many capital-intensive companies are relocation costs.
Other reasons are that the knowledge about the home region (from social, juridical and
economic aspects) is usually much better than the knowledge about foreign region.
Employees with a great amount of firm-specific human capital a personally often
strongly linked to their home region. This finding is confirmed by the two case studies.
From the desk research it was shown for the automotive industry that the increasing
complexity and the reliance on a growing number of underlying technologies with roots
in different industries causes firms more and more outsource their activities. For that
purpose, automotive OEM increasingly rely on their suppliers for a large portion of the
innovations in new vehicles (e.g. AEA, 2012). These suppliers have become important
drivers for innovations and more and more they undertake the initial development of
innovative new technologies (with OEMs often providing joint funding). This also makes
that suppliers take on more risk. They account for around 50% of R&D spending and
typically engineer around 75% of newly developed vehicles. Typically, OEMs currently
only undertake the powertrain and body shell engineering entirely in-house. This intense
collaboration between automotive OEMs and suppliers is particularly observable in
Europe.
As suppliers have taken on a larger role in design and innovation, they have typically
established their design centres close to OEMs to facilitate collaboration (Sturgeon et al.,
2008). The customary just-in-time and lean management principles also make that the
geographical location of the outsourcing partner is highly dependent on the firm’s own
geographical configuration. However, the increasing reliance on electronics and related
industries within the automotive industries, makes that outsourcing more and more
flows to regions particularly strong in these areas (e.g. South Korea and Japan).
The offshoring patterns of R&D activities in the automotive industry are mainly explained
by 4 locational drivers. Firstly, there is a desire to locate R&D facilities close to
customers in order to better understand their particular market requirements. It ensures
that development is closely aligned with the needs of the market, which maximizes the
likelihood of financial returns on R&D expenditures. As a consequence, new international
R&D investments are expected to take place in the regions displaying the strongest
growth numbers, such as South America, India and China. These emerging markets are
expected to account for more than 80% of future growth. It is however important to
note that new R&D activities in these markets mainly refer to modifications to existing
production vehicles to suit local market tastes (i.e. more development oriented
activities).
Secondly, value chain considerations are extremely important in the automotive
industry, and OEMs will be strongly co-located with their suppliers.
Labour costs are a third key locational driver within the industry. We can observe a
gradual investment shift towards regions with lower operating costs (Sturgeon et al.,
2008). Attractive regions in that respect are Southern America, Mexico, Eastern Europe
and South-East Asia.
A final important location driver of R&D activities is the availability of technological
capabilities and skills. This is especially important for the more research-oriented
activities. These activities will be mainly driven towards developed economies. Research
on key components will most likely take place in Europe. This region is currently well-
positioned in the automotive sector. It dominates the premium brand sector and this is
where new technology and innovation first comes to market. Additionally, Europe has
particular strength in the design and development of fuel efficient and high performance
80
internal combustion engines for all market segments. On top of that, Europe is strong in
the electronics industry of which applications are increasingly used in the automotive
industry. Other regions are however pulling ahead in key areas of electro-mobility such
as hybrid technology and battery development (e.g. Japan, Korea, and China more
recently). Japan for instance leads the world in the development of hybrid vehicles. It
also has a dominant market position in battery and cell manufacturing for electric
vehicles. China also boasts a strong electronics and battery manufacturing base and this
is coupled with an increasing strength in the important area of telematics.
Proposition 7) There are a broad range of corporate governance mechanisms
and modes to sustain corporate R&D&I across GVCs. We expect these
governance mechanisms/modes to be highly dependent on the type of R&D&I
activity/task performed. A trend towards global R&D&I networks (originating
due to alliances, collaboration and/ or subcontracting) can be observed,
although they are often difficult to manage. The corporate strategy will
however be determinant for the decision on the governance mechanism.
The companies of the cases studies source strategic knowledge through its open
innovation network wherein they engage in strategic alliances with key partner firms.
Within these alliances, knowledge diffusion is highly stimulated as firms work closely
together. Depending on the world region different corporate governance mechanism and
modes to sustain corporate R&D&I across GVCs exist. In China Joint Ventures with local
Chinese companies are particularly relevant, whereas in most other world regions
subsidiaries are more common.
Proposition 8) The impact of the offshoring of R&D&I activities on the home or
host country mainly occurs via increased productivity and innovation
performance. This is however highly dependent on a set of contingences
related to the firm’s embeddedness and technological capabilities.
Foreign innovation activities significantly increase the companies’ knowledge of the
regions. This knowledge refers to all kind of host region drivers like regional economic
and geopolitical developments, technological strengths and weaknesses, recruitment of
skilled employees in these regions, competitors, knowledge about partners.
This way several companies of the automotive supply chain can built up competencies in
other world regions (e.g. Asia). They learn a lot about the foreign markets and
technologies like electromobility, autonomous driving, and foreign consumer demands
which in turn generates benefits for all locations of the supply chain in Europe (due to
increased knowledge )
Overall a Win-win situation can be established, where both the host region and the sites
in Europe benefit.
Proposition 9) The home-base augmenting R&D argument is increasingly
important in the location decision of companies. Home-base augmenting R&D
will have a stronger impact on the innovation performance than home-base
exploiting R&D.
Literature indicates that the motives for companies to engage in R&D&I
internationalization are either aimed to exploit existing technologies (home-base
exploiting R&D) or creating new technologies and augmenting the existing knowledge
base (home-base augmenting R&D). Furthermore, it has shown that across industries,
81
this latter motive has become more important and has also been argued that home-base
augmenting R&D will lead to the highest increases in innovation performance.
Results from the case study analysis indicate that this proposition holds for the
automotive industry. As proximity to customers and markets is relevant and more and
more customers are located in Asia, a lot of relevant knowledge for the R&D activities in
Germany can be generated by experiences at the sites in foreign countries. Market
knowledge, customer knowledge and technology knowledge are all incentives for
automotive companies to participate in these markets.
Thus, it can be confirmed that home-base augmenting R&D activities will have the
strongest impact on the firm’s overall innovation performance as these international
activities are instrumental for generating new ideas and concepts (more than home-base
exploiting R&D activities).
Proposition 10) The government can play an important role in
attracting/sustaining R&D&I investments, by focusing on improvements of the
infrastructure, cost-related aspects and the legal and political
(stability/continuity) environment.
From the interviewed companies point of view the most relevant policy for governments
to attract and sustaining R&D&I investments is infrastructure. Infrastructure in this
sense refers to several dimensions:
mobility infrastructure: Fast roads, railways, efficient airports and efficient public
transportation systems)
skill and labor market infrastructure: Availability of graduates and professionals
supported by a powerful education system in the country
Technological infrastructure: With respect to the automotive industry and the
trend towards electromobility, there is an urgent need for a good charging
infrastructure for electric vehicles in Europe. In this respect, a high density of
charge stations for electric vehicles is required and standards of charging
technology need to be determined.
Legal infrastructure: The legal framework plays a key role for the diffusion of
specific new technologies like autonomous driving. E.g. when accidents with
autonomous vehicles occur, the liability needs to be clear. At the same time laws
should not be too restrictive so that they do not prevent the diffusion of new
technology. Also ITC security and ITC laws play an important role as these
technology have developed rapidly during the past decades, but the legal
framework is adjusted only slowly. On the other hand, the automotive industry
innovative activities are hardly driven by the host region’s intellectual property
laws according to the interviewed companies.
Besides that, political stability and continuity is a relevant aspect for most companies
and usually regarded as one of the strength in Europe, although there is a wish to invest
more in infrastructure (e.g. charging stations for electronic vehicles).
Proposition 11) The competitive environment of the host region can
significantly alter a region’s attractiveness.
The competitive environment of the host region has currently a modest influence in the
studied cases as the interviewed companies has achieved the position of market
82
leadership in most of its core segments.
On the other hand, new competitors are entering the automotive industry who come
from other sectors. In particular electronics, home appliances, and electrical/mechanical
machines are quickly entering the market as modern vehicles receive more and more
electronic components. Even Google and Apple may turn into car producers in the near
future. The competitiveness within the automotive industry is thus significantly
increasing. Connected and intelligent cars, autonomous driving and electromobility are
main technological trends companies need to adapt.
This can lead to a dichotomy, especially for SME and automotive parts suppliers. Some
firms who participated very early in regions with very competitive environments will be
prepared for the future. Other SME who avoided competitive markets and focused on
traditional segments are at risk to be replaced by firms of other industry if the diffusion
of new technologies persists. Hence competitive regions are deterring and attractive for
automotive companies at the same time. Strategically companies need to form new
alliances to manage these challenges.
Proposition 12) Knowledge spillovers and technology transfers are mainly
driven by the governance mode, TRL level and government stimuli.
The TRL level and government stimuli are only partially relevant for knowledge spillovers
in the case of automotive industry. The emergence of clusters is highly technology and
market driven. Infrastructure and the overall competitive environment of the host
regions, however, plays an important role (see above).
Proposition 13) The common fear that R&D&I internationalisation is hollowing
out domestic innovation is unfounded.
The case study analysis confirm this proposition and claim this fear is unfounded. The
companies involved in our case studies did not report any job losses or negative
relocation effects on the activities in the home region.
Sites in Asian countries (and other world regions with emerging economies) are usually
considered a win-win situation for domestic locations of the European companies as new
knowledge and access to new markets can be acquired, which in turn helps domestic
sites. The costs to relocate a site are very high and most sites have developed
historically though a process of mergers and acquisitions.
From a company point of view the conflict is less between regions, but rather between
different industries: In the automotive sector new competitors from other industries
(electronics, home appliances, and electrical/mechanical machines) are quickly entering
the market as modern vehicles receive more and more electronic components. From a
company-perspective this is a much bigger threat to their business than
internationalization. Electronic vehicles require fewer components than vehicles with
combustion engines. A complete restructuring of the automotive industry and its supply
chains could put several traditional firms under severe pressure. Only innovative firms of
the automotive parts suppliers will be able to adapt the new technologies quickly enough
without being replaced by firm from other industries. To most relevant emerging
technologies are electromobility, ICT and autonomous driving.
Box 5: Propositions for the aerospace sector

83
Proposition 1) Industry-specific and value chain characteristics are key drivers
for R&D&I location decisions and are becoming more important than country
characteristics.
The literature review showed that in the location decision process of R&D&I activities,
the most relevant factors were related to host country characteristics and industry-
specific and value chain considerations, being the latter increasingly important.
However, it also showed that the aerospace industry has a rather consolidated supply
chain due to its complexity and the high technological and economic barriers it faces.
The evidence gathered on this sector clearly indicates that, as a highly-R&D intensive
industry, this sector tends to locate its foreign R&D&I activities in locations with high
technological capabilities and in regions known for the presence of well-developed
industry clusters. This is especially relevant for EU locations. Interviews and desk
research have pointed out that the R&D activities carried out outside Europe by EU large
aircraft manufacturers of the aerospace sector remain limited in relative terms: most of
the R&D activities are still performed in Europe. However, there is an increasing trend
for the outsourcing of R&D, especially in low TRLs, to other countries in order to access
new technologies, capabilities or skills that are not available in Europe.
Proposition 2) Location determinants and patterns are highly dependent on the
type of R&D&I activity (TRL).
The evidence gathered in interviews and desk research highlights that location
determinants in the aerospace sector are heavily contingent upon the type of R&D&I
activity. Research at lower TRLs is usually carried out though collaboration with
universities, research and technology centres or start-ups, it is easier, cheaper and less
risky to promote. As such, large EU aircraft manufacturers seem to be prone to develop
this type of collaboration with highly specialized centres around the world: the key factor
being access to technology or talent.
Projects developed at higher TRLs are more costly and riskier. This type of research
tends to be developed in-house, is more likely to be carried out in the same centres as –
or close to - manufacturing plants. Collaborations with external partners on this type of
research tend to be developed with stable industrial partners (e.g. suppliers or
competitors participating in joint ventures or collaborative EU projects, like the Clean
Sky initiative).
Proposition 3) Corporate strategies are decisive in determining the location
choices.
Corporate strategies are decisive in determining the location “approach”: in general in-
house R&D is carried out in the home countries. The location of R&D activities is often
the result of past mergers and acquisitions which were decided according to the
corporate strategy of the time. With respect to collaboration with external partners, all
evidence suggests that companies are increasingly adopting open innovation practices
although the ways though which this is done varies across companies. Some companies
tend to give a large liberty to their engineering units to select the best-in-class partners
to collaborate with. Other companies also promote these external collaboration, but do
so in a more centralized way.
Proposition 4) The extent to which R&D&I activities are collocated with
production activities, strongly depends on the type of R&D&I activity involved.

84
Previous research has pointed out the benefits that are associated to the collocation of
R&D&I activities with production activities. The important feedback effects between both
types of activities are evident in the aerospace industry, where higher TRL activities are
often collocated with manufacturing facilities or assembly lines. The evidence gathered
for this sector also confirms the previous studies that have shown that prior production
activities in a host location increases the probability that later R&D&I activities follow in
the same host region. Closer-to-market R&D activities are usually located in sites where
a manufactruring site is already operating. These activities enable a more cost-efficient
way to test and demonstrate technologies in a real environment.
Proposition 5: The organization of R&D&I activities across GVCs is
industry/sector specific. Industry differences are observed at the level of the
location decision, the impact, the governance mode applied. Even within
industry, differences can occur depending on the R&D&I activities (TRL scale)
of the company.
See cross-sector analysis
Proposition 6) Outsourcing and offshoring trends are highly industry-specific.
The international fragmentation of R&D&I activities is highly dependent on the
industry and R&D&I subfunctions/activities or tasks. Highly capital-intensive
industries concentrate key R&D&I activities to a larger extent than less capital-
intensive industries.
Outsourcing and offshoring is less coming in this sector due to its strategic nature.
Proposition 7) There are a broad range of corporate governance mechanisms
and modes to sustain corporate R&D&I across GVCs. We expect these
governance mechanisms/modes to be highly dependent on the type of R&D&I
activity/task performed. A trend towards global R&D&I networks (originating
due to alliances, collaboration and/ or subcontracting) can be observed,
although they are often difficult to manage. The corporate strategy will
however be determinant for the decision on the governance mechanism.
The evidence gathered through interviews and desk research indicates that there is a
strong trend towards more external governance modes in the aerospace sector.
However, given the specificities of the sector (high economic and technological barriers)
in general this greater openness does not entail a reduction of the internal R&D
activities, but rather a search for additional capabilities and technologies that are not
available in Europe – or that are difficult to develop.
Proposition 8) The impact of the offshoring of R&D&I activities on the home or
host country mainly occurs via increased productivity and innovation
performance. This is however highly dependent on a set of contingences
related to the firm’s embeddedness and technological capabilities.
The companies analysed have grown over the years through a process of mergers and
85
acquisitions and in some cases a significant part of their shares are state-owned.
Nonetheless, the case studies analysed show that foreign R&D&I activities have a
positive impact on the company´s innovation performance and on the innovativeness of
the region.
Proposition 9) The home-base augmenting R&D argument is increasingly
important in the location decision of companies. Home-base augmenting R&D
will have a stronger impact on the innovation performance than home-base
exploiting R&D.
Previous studies on the field indicate that companies can follow two main strategies
when engaging in R&D&I internationalisation: they can aim at exploiting existing
technologies (home-base exploiting R&D) or at creating new technologies and
augmenting the existing knowledge base (home-base augmenting R&D). The literature
indicates that the latter is increasingly common. The evidence gathered in the case
studies indicates that the aerospace industry is increasingly driven by home-base
augmenting R&D motivations when it comes to setting up collaborations with centres of
expertise and research outside Europe. This is seen as having a stronger impact on the
innovation performance of the companies by gaining access to new skills and expertise.
Proposition 10) The government can play an important role in
attracting/sustaining R&D&I investments, by focusing on improvements of the
infrastructure, cost-related aspects and the legal and political
(stability/continuity) environment.
Interviews from companies and other types of stakeholders have stressed the increasing
competition that the aerospace sector is experiencing from other world regions. In order
to address this and maintain competitiveness levels, the interviews have shown some
consensus on a series of issues, most notably the need to:
- To promote public sector support for research carried out at TRLs 1 to TRL6.
- To offer better financing options to be able to compete with what other countries
in the world are offering
- To better coordinate the access to and the development of infrastructures
available in Europe
- To invest in the development of skills, attraction and retention of talent in key
technologies for the sector.
Proposition 11) The competitive environment of the host region can
significantly alter a region’s attractiveness.
Most of the major locations of the aerospace industry in Europe have emerged around
the existence of a manufacturing plant of one of the large aircraft manufacturers. These
companies tend to be the incumbent technology leaders or, at least, be at the centre of
their ecosystem (principals). As such, and due to the high economic and technological
barriers, this sector has a rather consolidated supply chain. In this sense, the large
manufacturing companies do not tend to locate their facilities in the same locations as
their competitors, they already develop their own ecosystems around their
manufacturing facilities.
Proposition 12) Knowledge spillovers and technology transfers are mainly
driven by the governance mode, TRL level and government stimuli.
86
The most important drivers for knowledge spillovers and technology transfers according
to the cases analysed in this study are related to government stimuli, to the governance
mode and, partially related to this, to the TRL. The former are important drivers of
knowledge spillovers through the implementation and support of collaborative projects
such as Clean Sky or Sesar. Governance modes are important on two different levels:
First, through mergers and acquisitions: most of the large companies in the aerospace
sector have had in the past a policy of mergers and acquisitions with the aim to acquire
new technology and/or manufacturing capabilities. Second, through the establishment of
collaboration agreements with research institutes and universities. This type of
collaboration mainly focuses on the lower TRLs.
Proposition 13) The common fear that R&D&I internationalisation is hollowing
out domestic innovation is unfounded.
The empirical evidence analysed for this research indicates that this proposition is
confirmed. The trend towards a greater R&D&I internationalisation is not hollowing out
domestic innovation in the aerospace sector. The main reasons for this is that R&D&I
internationalisation tends to be more visible in research at lower TRLs but the core
R&D&I activities for large aerospace companies are found on closer-to-market
development stages.
Box 6: Propositions for the ICT sector
Proposition 1) Industry-specific and value chain characteristics are key drivers
for R&D&I location decisions and are becoming more important than country
characteristics.
Overall value chain considerations play a determining role for the company. Especially
the presence near customers is highly relevant for most ICT companies. However, the
major driver of locational decisions is to find talented young employees, which are cost
efficient. Therefore, India and China are one of the largest R&D locations. Although in
recent years wages in these regions have increased significantly, slightly relocational
drivers to these regions. According to the companies, attractive regions are also found in
other emerging economies like South America where skilled personal is located. In
addition, the companies prefer fast growing markets since there are still fewer rules and
laws of business than in mature economies. In these markets, there is more scope for
action and a greater chance to establish as the market leader. In some subsectors, like
semiconductors, a close geographical proximity to the customers’ applications is very
beneficial in this context.
Proposition 2) Location determinants and patterns are highly dependent on the
type of R&D&I activity (TRL).
Generally fundamental research is more often located in Europe and the USA, while in
the later technological readiness stages R&D&I activities are more equally distributed
between Europe, USA and the Asia-Pacific region. In the Electronics & Parts and Systems
subsector frontend manufacturing is more often located in Europe and America, while
87
backend manufacturing is mostly located in emerging economies of Asia. R&D
traditionally was mostly located in Europe. In recent years several R&D sites emerge in
Asian technology clusters, but the ones in Europe still remain important.
A final important location driver of R&D activities is the availability of technological
capabilities and skills. This is especially important for the more research-oriented
activities. These activities will be mainly driven towards developed economies. It is
important for firms to be present in relevant industry clusters to learn from customers
and competitors about new markets and the application of new technologies in these
markets.
Proposition 3) Corporate strategies are decisive in determining the location
choices.
The corporate strategy is highly relevant for the location choice. Major drivers for the
corporate strategy are the presence in highly innovative ecosystems and technology
clusters. Besides that, the presence in fast growing markets is an important locational
driver (see proposition 1).
Proposition 4) The extent to which R&D&I activities are collocated with
production activities, strongly depends on the type of R&D&I activity involved.
In the case of the company R&D&I activities are not restricted to Technological Research
and Product demonstration but extend to manufacturing processes.
In the software market the main reason for this is that specific software usually does not
match the product the customers eventually consume. Hence, foreign innovation
activities are often collocated with the companies’ production activities.
In the Electronics Parts and Systems subsector R&D&I activities are not restricted to
Technological Research and Product demonstration but extend to manufacturing
processes. The main reason for this is that under laboratory conditions some
components like semiconductors usually do not match the product the customers
eventually receive due to their sensitive nature. Hence foreign innovation activities in
the ICT sectors are often collocated with production activities. Locational decisions
depend on the type of R&D&I activity, while much of product Design, technological
Research and R&D happens along frontend manufacturing which is mainly in Europe and
the USA, the majority of backend manufacturing is located in Asia.
Proposition 5) The organization of R&D&I activities across GVCs is
industry/sector specific. Industry differences are observed at the level of the
location decision, the impact, the governance mode applied. Even within
industry, differences can occur depending on the R&D&I activities (TRL scale)
of the company.
In the ICT sector product characteristics hardly influence the organization of R&D&I
activities. Transporting costs usually play a minor role. Small fragile semiconductors and
electronic equipment usually require a co-location of development and production sites.
Software products can come from all world regions and geographic distance is not very
relevant, although the presence within technology clusters and proximity to universities
and talented employees is relevant for innovation.
See also cross-sector analysis
88
Proposition 6) Outsourcing and offshoring trends are highly industry-specific.
The international fragmentation of R&D&I activities is highly dependent on the
industry and R&D&I subfunctions/activities or tasks. Highly capital-intensive
industries concentrate key R&D&I activities to a larger extent than less capital-
intensive industries.
Depending on the subsector, parts of the ICT-industry are highly capital-intensive
intensive and relocation costs are high. In the software industry, however, relocation
costs are lower. Therefore, an international fragmentation of R&D&I activities around the
globe is possible.
Through outsourcing of ICT internationalization of non-ICT sectors is stimulated, too. To
the extent the ICT-internationalization effect contributes to income growth, the ICT
growth will be reinforced by the demand in ICT-intensive sectors. On the other hand,
there exist limiting factors to outsourcing as managerial efforts required in a more
complex GVC will rise with the degree of internationalization. International outsourcing
and offshoring do relate to ICT goods as well as ICT services.
In the case of international outsourcing there can be both positive and negative income
and employment effects on the current account of the home country. Due to high wages
in developed countries, firms take advantage of offshoring or outsourcing to reduce
costs. The shares of Japan and the United States in world exports of ICT goods halved
from 2001 to 2013, due in part to offshoring of production. On the other hand, emerging
economies are strongly competing. Decreasing the total contract value and increasing
competition from other offshore locations such as Brazil, China and the Philippines have
put the revenue growth of Indian IT services providers under pressure.
The ICT sector is special in this regard as it has very high innovation dynamics. Foreign
direct investment (FDI) plays an important role so that part the overall ICT sector will be
affected by FDI dynamics. Another specificity of the ICT sector respect to outsourcing is
the fact that ICT potentially allows a very flexible and fast fragmentation. This implies
the risk that individual EU countries could lose value-added at some point in some
specific activities of the ICT sector.
On the other hand, EU trading partner firms may outsource to firms in the EU as well
and the international competitiveness of EU-firms may significantly be improved through
efficient outsourcing, which may have positive economic effects in the long run.
Proposition 7) There are a broad range of corporate governance mechanisms
and modes to sustain corporate R&D&I across GVCs. We expect these
governance mechanisms/modes to be highly dependent on the type of R&D&I
activity/task performed. A trend towards global R&D&I networks (originating
due to alliances, collaboration and/ or subcontracting) can be observed,
although they are often difficult to manage. The corporate strategy will
however be determinant for the decision on the governance mechanism.
The interviewed companies source strategic knowledge through its open innovation
network wherein they engage in strategic alliances with key partner firms. Within these
alliances, knowledge diffusion is highly stimulated as firms work closely together.
Patent cooperation and patent pools with competitors and suppliers are common. Within
these alliances, knowledge diffusion is highly stimulated as firms work closely together.
89
Proposition 8) The impact of the offshoring of R&D&I activities on the home or
host country mainly occurs via increased productivity and innovation
performance. This is however highly dependent on a set of contingences
related to the firm’s embeddedness and technological capabilities.
Foreign innovation activities significantly increase the knowledge of ICT companies in
these regions. This knowledge refers to all kind of host region drivers like intellectual
property laws, practices of the regulatory, tax, judicial and administrative bodies,
regional economic and geopolitical developments, technological strengths and
weaknesses, recruitment of skilled employees in these regions.
Overall a Win-win situation can be established in many cases, where both the host and
home region benefit.
Proposition 9) The home-base augmenting R&D argument is increasingly
important in the location decision of companies. Home-base augmenting R&D
will have a stronger impact on the innovation performance than home-base
exploiting R&D.
This proposition holds for the interviewed companies. Fundamental research still occurs
in traditional IT markets like Europe and the United States.
In the Electronic Systems & Parts subsector “proximity to application” highly relevant.
Thus, more and more customers are located in Asia. A lot of relevant knowledge for the
R&D activities in Europe can be generated by experiences at the sites in foreign
countries.
Proposition 10) The government can play an important role in
attracting/sustaining R&D&I investments, by focusing on improvements of the
infrastructure, cost-related aspects and the legal and political
(stability/continuity) environment.
Governments can play a role in determining locational choices. Varying practices of the
regulatory, tax, judicial and administrative bodies, intellectual property rights and
policies affecting trade and investment aimed at limiting free trade play a role for
locational decisions outside of Europe. Foreign programs like "Made in China 2025" are
expected to have effects customers and global value chains. European programs
supporting companies, e.g. in the segment of microelectronics like facilitated support in
the funding of IPCEI are welcomed.
A major locational decisions driver in the software industry today are labor costs. In
some instances high labor costs in Europe could reduce its competitiveness, although
wages of high skilled IT-personal In emerging markets have recently grown significantly,
alleviating this effect.
In most cases, there is less concern about intra-EU outsourcing than about extra-EU
outsourcing.
Proposition 11) The competitive environment of the host region can
90
significantly alter a region’s attractiveness.
The competitive environment of the host region may have a positive effect on a regions
attractiveness. In the studied cases, the companies benefit through closeness of other IT
firms (e.g. in Bangalore and Silicon Valley). This allows collaborations and provide
resource pool, for example team building is more efficient.
On the other hand, for ICT-companies that have achieved the position of market
leadership in most of their core segments, competitive environment of the host region
may only have a limited influence.
Proposition 12) Knowledge spillovers and technology transfers are mainly
driven by the governance mode, TRL level and government stimuli.
The TRL level and government stimuli are only partially relevant for knowledge
spillovers. R&D is relatively independent from TRL as borders between TRL are highly
blurred due to high degree of R&D integration within the manufacturing process. The
emergence of clusters is highly technology and market driven. Infrastructure and the
overall competitive environment of the host regions, however, plays an important role
(see above).
Proposition 13) The common fear that R&D&I internationalisation is hollowing
out domestic innovation is unfounded.
In the case of the selected companies, R&D&I activities are partially offshored due to
high labor costs in the home region. Hence, foreign R&D&I operations might strengthen
foreign innovation. In addition, the relocation from Europe to other world regions could
result from rapidly growing markets in other world regions and the fact that “proximity
to application” is crucial for the firm’s businesses. The speed of market growth in the ICT
sectors is closely related to demographics and the age of potential customers.
On the other hand, political and economic stability play an important role, preventing
relocation to certain foreign markets. In addition, R&D&I operations of IT companies are
complementary with domestic innovative activities. New technological trends like
“industry 4.0” further increase productivity of European workers and enhance the
attractiveness of locations in Europe. One possible cause for relocation from Europe to
other world regions, however, could result from rapidly growing markets in other world
regions.
91
References
Abramovsky, L., Harrison, R., & Simpson, H. (2007). University Research and the
Location of Business R&D. The Economic Journal, 117(519), C114-C141.
ACEA (2014) - Auto industry contributes to Council discussions on EU’s future climate
and energy policy.
ACEA (2015) - Research and Innovation. http://www.acea.be/industry-
topics/tag/category/research-and-innovation.
ADS (2017). UK Aerospace Outlook Report 2017.
AIAC (2016) State of Canada´s Aerospace Industry. 2016 Report. Innovation, Science
and Economic Development Canada. Available at: http://aiac.ca/wp-
content/uploads/2016/06/State-of-Canadas-Aerospace-Industry-2016-Report.pdf
AEA (2012). Assessing the R&D and economic performance of key industries: the
automotive sector. Report for European Commission, Joint Research Centre,
Institute for Prospective Technological Studies.
Aiginger, K. (2014). Industrial policy for a sustainable growth path, Policy Paper.
Brussels.
Alcácer, J. (2006). Location choices across the value chain: How activity and capability
influence co-location. Management Science, 52(10), 1457-1471.
Alcácer, J., & Chung, W. (2007). Location strategies and knowledge spillovers.
Management Science, 53(5), 760.
Alcácer, J., & Zhao, M. (2012). Local R&D Strategies and Multi-location Firms: The Role
of Internal Linkages. Management Science, 58(4), 734-753.
Alcácer, J. & M. Delgado (2016). Spatial organization of firms and location choices
through the value chain. Management Science.
Allen, T. J., Tushman, M. L., & Lee, D. M. (1979). Technology transfer as a function of
position in the spectrum from research through development to technical services.
Academy of Management Journal, 22(4), 694-708.
Amador and Cabral (2016). Global Value Chains: A survey of drivers and measures.
Journal of Economic Surveys, 30(2), 78-301.
Amara, N., R. Landry,N. Becheikh, and M. Ouimet. (2008). Learning and novelty of
innovation in established manufacturing SMEs. Technovation 28, 450–63.
Arundel, A., Bordoy, C., & Kanerva, M. (2008). Neglected Innovators: How Do Innovative
Firms that Do Not Perform R&D Innovate? Results of an Analysis of the
Innobarometer 2007 Survey.
Arvanitis, S., & Hollenstein, H. (2011). How do different drivers of R&D investment in
foreign locations affect domestic firm performance? An analysis based on Swiss
panel micro data. Industrial and Corporate Change, 20(2), 605-640.
ASD (2003). Facts & Figures 2003.AeroSpace and Defence Industries Association of
Europe, Brussels.
ASD (2014). Facts & Figures 2014.AeroSpace and Defence Industries Association of
Europe, Brussels.
ASD (2015) - About us. http://www.asd-europe.org/home/
Bales, R. R., Maull, R. S., and Radnor, Z. (2004). The development of supply chain
management within the aerospace manufacturing sector. Supply Chain
Management, 9(3), 250–255.
Barge-Gil, A., Jesus Nieto, M., & Santamaria, L. (2011). Hidden innovators: The role of
non-R&D activities. Technology analysis & Strategic management, 23(4), 415-
432.
92
Barrell, R., & Pain, N. (1996). An econometric analysis of US foreign direct investment.
The Review of Economics and Statistics, 78(2), 200-207.
Becker, S. O., Ekholm, K., & Muendler, M.-A. (2013). Offshoring and the onshore
composition of tasks and skills. Journal of International Economics, 90(1), 91-106.
Belderbos, R., Fukao, K., & Iwasa, T. (2009). Foreign and domestic R&D investment.
Economics of Innovation and New Technology, 18(4), 369-380.
Belderbos, R., Leten, B., & Suzuki, S. (2013). How global is R&D? Firm-level
determinants of home-country bias in R&D. Journal of international business
studies, 44(8), 765-786.
Belderbos, R., Lokshin, B., & Sadowski, B. (2015). The returns to foreign R&D. Journal of
International Business Studies, 46, 491-504.
Belderbos, R., & Sleuwaegen, L. (2005). Competitive drivers and international plant
configuration strategies: a product level test. Strategic Management Journal,
26(6), 577-593.
Belderbos, R., & Somers, D. (2015). Do technology leaders deter inward R&D
investments? Evidence from regional R&D location decisions in europe. Regional
Studies, 49(11), 1805-1821.
Belderbos, R., Van Roy, V., Leten, B., & Thijs, B. (2014). Academic research strengths
and multinational firms’ foreign R&D location decisions: evidence from R&D
investments in European regions. Environment and Planning A, 46(4), 920-942.
Belderbos, R., Sleuwaegen, L., Somers, D., De Backer, K. (2016), “Where to Locate
Innovative Activities in Global Value Chains: Does Co-location Matter?”, OECD
Science, Technology and Industry Policy Papers, No. 30, OECD Publishing, Paris.
http://dx.doi.org/10.1787/5jlv8zmp86jg-en.
Bertelsmann Foundation (2017). Ausschreibung: Faktor Vielfalt – Die Rolle kultureller
Vielfalt für Innovation in Deutschland, Gütersloh.
Bertrand, O., & Mol, M. J. (2013). The antecedents and innovation effects of domestic
and offshore R&D outsourcing: The contingent impact of cognitive distance and
absorptive capacity. Strategic Management Journal, 34(6), 751-760.
Beugelsdijk, S. (2008). Strategic human resource practices and product innovation.
Organization Studies, 29, (6), 821–47.
Bitzenis, A.P. (2006). “Foreign direct Investment and cross border transactions”, In
Globalization: Encyclopedia of Trade, Labour and Politics, Volume 1, edited by
A.K. Vaidya.
Blanchette, St., Albert, C. and Garcia-Miller, S. (2010). Beyond Technology Readiness
Levels for Software: U.S. Army Workshop Report.
Borras, S. & Edquist, C. (2013). The choice of policy instruments. Technological
Forecasting & Social Change, 80, 1513-1522.
Brachos, D., Kostopoulos, K., Sonderquist, K.E. & Prastacos, G. (2007). Knowledge
effectiveness, social context and innovation. Journal of Knowledge Management,
11(5), 31‐44.
Branstetter, L. (2006). Is foreign direct investment a channel of knowledge spillovers?
Evidence from Japan's FDI in the United States. Journal of International
Economics, 68(2), 325-344.
Brennan, L. & Rakhmatulin, R. (2015). Global Value Chains and smart specialization
strategy, Joint Research Center, Seville.
Brixy, U. & Brunow, S. & D’ Ambrosio, A. (2017). Ethnic diversity in start-ups and its
impact on innovation, IAB Discussion Paper 25/17. Nürnberg.
Buciuni, G. & Finotto, V. (2016). Innovation in Global Value Chains: Colocation of
Production and Development in Italian Low-Tech Industries. Regional Studies.
Buhr, D. (2015). Industry 4.0 – new tasks for innovation policy. Friedrich-Ebert-Stiftung,
Berlin.
93
Business France (2017). French Excellence in Aerospace. Key Info in 10 Points.
Cano-Kollmann, M., Cantwell, J., Hannigan, T. J., Mudambi, R., & Song, J. (2016).
Knowledge connectivity: An agenda for innovation research in international
business. Journal of International Business Studies, 47(3), 255-262.
Cantner, U., & Pyka, A. (1998). Absorbing technological spillovers: simulations in an
evolutionary framework. Industrial and Corporate Change, 7(2), 369-397.
Cantwell, J. (1995). The globalisation of technology: what remains of the product cycle
model? Cambridge journal of economics, 19, 155-155.
Capgemini (2012). The Changing Face of the Aerospace & Defense Industry: A review of
key segments and emerging trends.
Castellani, D., Palmero, A. J., & Zanfei, A. (2011). The gravity of R&D FDIs.
Castellani, D., & Pieri, F. (2013). R&D offshoring and the productivity growth of European
regions. Research Policy, 42(9), 1581-1594.
Chung, W., & Alcácer, J. (2002). Knowledge seeking and location choice of foreign direct
investment in the United States. Management Science, 48(12), 1534-1554.
Chung, W., & Yeaple, S. (2008). International knowledge sourcing: Evidence from US
firms expanding abroad. Strategic Management Journal, 29(11), 1207-1224.
Cohen, W. M., & Levinthal, D. A. (1990). Absorptive capacity: a new perspective on
learning and innovation. Administrative Science Quarterly, 128-152.
Comanor, W. S., & Scherer, F. M. (2011). Mergers and innovation in the pharmaceutical
market.
Criscuolo, P. (2009). Inter-firm reverse technology transfer: the home country effect of
R&D internationalization. Industrial and Corporate Change, 18(5), 869-899.
Currie and Kerrin (2003). Human resource management and knowledge management:
enhancing knowledge sharing in a pharmaceutical company. The International
Journal of Human Resource Management, 14(6), 1027-1045.
Department of Defense (2009). Technology Readiness Assessment (TRA) Deskbook.
De Prato, G., Nepelski, D. and Stancik, J. (2011). Internationalisation of ICT R&D. JRC
Scientific and Technical Reports.
da Silva, R. E., Amato, A. A., Guilhem, D. B., & Novaes, M. R. C. G. (2016). Globalization
of clinical trials: ethical and regulatory implications. International Journal of
Clinical Trials, 3(1), 1-8.
De Marchi, V. & Di Maria, E. & Gereffi, G. (2018). New frontiers for competivenesss an
dinnovation in clusters and value-chains research. Di Marchi et al (eds., 2018).
Local clusters in global value chains, Routledge London and New York (in print).
Dachs, B., Kampik, F., Scherngell, T., Zahradnik, G., Hanzl-Weiss, D., Hunya, G., Foster,
N., Leitner, S., Stehrer, R., Urban, W., (2012). Internationalisation of business
investments in R&D and analysis of their impact. . European Commission,
Directorate-General for Research and Innovation, Brussels
Dachs, B. and B. Ebersberger (2013). The effects of production offshoring on R&D and
innovation in the home country, FIW-research reports 2013/14
Danzon, P. M. (2006). Economics of the pharmaceutical industry. NBER Reporter, 14-16.
Davenport, T.H. and Prusak, L. (1998). Working Knowledge. How Organizations Manage
What they Know, Harvard Business School, Boston, MA.
De Backer, K., S. Miroudot and A. Ragoussis (2013), Manufacturing in global value
chains, In Manufacturing in Europe’s future, edited by R. Veugelers. (Breugel).
De Backer, K., & Miroudot, S. (2014). Mapping global value chains.
De Prato G. and D. Nepelski (2013). The global R&D network: A network analysis of
international R&D centres. IPTS working paper.
Defever, F. (2006), “Functional fragmentation and the location of multinational firms in
the enlarged Europe”, Regional Science and Urban Economics, 36(5), 658-677.
94
Defever, F. (2012), “The spatial organization of multinational firms”, Canadian Journal of
Economics/Revue canadienne d'économique, 45(2), 672-697.
Deloitte, (2017). Global aerospace and defence sector outlook, 2017.
Dernis H., Dosso M., Hervás F., Millot V., Squicciarini M. and Vezzani A. (2015). World
Corporate Top R&D Investors: Innovation and IP bundles. A JRC and OECD
common report. Luxembourg: Publications Office of the European Union.
Editorial (2016). Innovation Policy: How can it make a difference? In: Industry and
Innovation, 23 (2), 136-139.
Edler, J. & Fagerberg, J. (2017). Innovation Policy: what, why, and how. Oxford Review
of Economic Policy, 33 (1), 2-23.
OECD (2015). Frascati Manual 2015: Guidelines for Collecting and Reporting Data on
Research and Experimental Development: OECD.
Dierks, A., Kuklinski, C. P. J. W., & Moser, R. (2013). How Institutional Change
Reconfigures Successful Value Chains: The Case of Western Pharma Corporations
in China. Thunderbird International Business Review, 55(2), 153-171.
D’Agostino, L. M., Laursen, K., & Santangelo, G. D. (2013). The impact of R&D offshoring
on the home knowledge production of OECD investing regions. Journal of
Economic Geography, 13(1), 145-175.
EC (2011). High-Level Expert Group on Key Enabling Technologies. Final report.
EC (2014). Study on the relationship between the localisation of production, R&D and
innovation activities. Final report 2014. EC DG Enterprise and Industry.
EC (2014). Study on the relationship between the localisation of production, R&D and
innovation activities. Inception report 2014. EC DG Enterprise and Industry (not
published).
EC (2014). Digital Agenda Scoreboard: The EU ICT Sector and its R&D Performance.
EC (2016). The 2015 EU Industrial R&D Investment Scoreboard. DG Joint Research
Cenrtre, Institute for Prospective Technological Studies. Available at:
http://iri.jrc.ec.europa.eu/scoreboard16.html
EC (2015). THE 2015 Predict Report: An Analysis of ICT R&D in the EU and Beyond. DG
Joint Research Centre.
EC (2015)J. ICT-Enabled Social Innovation in support of the Implementation of the Social
Investment Package (IESI). DG Joint Research Centre
EC (2016). Aeronautics Industries. http://ec.europa.eu/growth/sectors/aeronautics_en
EC (2017a). Communiation 479, Investing in a smart, innovative and sustainable
Industry – A renewed EU Industrial Policy Strategy, Brussels.
EC (2017b). Communication 376, Strengthening Innovation in Europe’s Regions,
Brussels.
EC (2014). Communication, For a European Industrial Renaissance, Brussels.
EC (2013). Lessons from a decade of innovation policy, Brussels.
EC (2012). Communication 582, A Stronger European Industry for Growth and Economic
Recovery, Brussels.
EC (2010). Communication 614, An Integrated Industrial Policy for the Globalisation Era,
Brussels.
Earto (2014). The TRL scale as a research and innovation policy tool, EARTO
recommendations.
EFPIA (European Federation of Pharmaceutical Industries and Associations) – official
figures, 2015.
Ehret, O., Cooke, P. (2007). Conceptualising Aerospace Outsourcing: Airbus UK and the
Lean Supply Approach. Paper two submitted to the IKINET coordinator as a CASS
contribution to the joint IKINET book ‘International Knowledge and Innovation
Networks.
95
Ekholm, K., R. Forslid and J. Markusen (2003). Export-platform foreign direct investment.
London: Centre for Ecnomic Policy Research, International Trade, pp 36.
Esposito, E. (2004). Strategic alliances and internationalisation in the aircraft
manufacturing industry. Technological Forecasting and Social Change 71(5), 443-
468.
Esposito, E., and Raffa, L. (2006). Evolution of the Supply Chain in the Aircraft Industry.
Proceedings of the Ipsera Conference April 6 - 8, 2006, San Diego, CA.
Europe Innova. (2012). Sectoral Innovation Watch 2008–2011.Space and Aeronautics
Sectors. European Commission: Brussels.
EU (2005). The EU Economy 2005 Review: Rising International Economic Integration,
Brussels.
EU-OECD (2013). Global value chains, global innovation networks and economic
performance. i4g and OECD Workshop, Paris 9-10 September 2013.
Fernandes, et al (2011). Brazil- Aeronautics Cluster. Harvard Business School. Available
at: http://pakaero.com.pk/index.php/brazil-aerospace-cluster/
Flanagan, K. & Uyarra, E. (2016). Four dangers in innovation plicy studies – and how to
avoid them, Industry and Innovation, 23 (2), 177-188.
Florida, R. (1997). The globalization of R&D: Results of a survey of foreign-affiliated R&D
laboratories in the USA. Research Policy, 26(1), 85-103.
Forchielli, E. J. (2013) Will the Chinese Pharmaceutical Sector Ever Become First
Freeman, C., & Hagedoorn, J. (1994). Catching up or falling behind: patterns in
international interfirm technology partnering. World Development, 22(5), 771-
780.
Furman, J. L., Kyle, M. K., Cockburn, I. M., & Henderson, R. (2006). Public & private
spillovers, location and the productivity of pharmaceutical research.
Firat, K.F., Woon, W.L., Madnick, S. Technology Forecasting – A review (2008). Working
Paper CISL #2008-15.
Gassmann, O., G. Reepmeyer, and M. von Zedtwitz (2008), Leading Pharmaceutical
Innovation. Trends and Drivers for Growth in the Pharmaceutical Industry. 2nd
edition, Springer-Verlag, Berlin, Heidelberg.
Germany Trade and Invest (2017). Medical Technology Clusters in Germany, Issue
2017/2018
Germany Trade and Invest (GTAI). Fact Sheet: The Aerospace Industry in Germany.
Issue 2017/2018
Global Business Reports (2016) Italy Aerospace. Available at: http://gbreports.com/wp-
content/uploads/2016/12/Italy-Aerospace-2016-Web-Preview-Second-Edition-2.pdf
Gompers, P. & Wang, S. (2017). Diversity in Innovation, Working Paper 17-067, Harvard
Business School.
Griffith, R., Huergo, E., Mairesse, J., & Peters, B. (2006). Innovation and productivity
across four European countries. Oxford Review of Economic Policy, 22(4), 483.
Griffith, R., Miller, H., & Connell, M. (2011). Corporate taxes and the location of IP.
Grimes, S., & Miozzo, M. (2015). Big Pharma's Internationalization of R&D to China.
European Planning Studies, 23(9), 1873-1894.
Guellec, D., & de la Potterie, B. v. P. (2001). The internationalisation of technology
analysed with patent data. Research Policy, 30(8), 1253-1266.
Hakanson, l. (2015). Internationalization of Research and Development, in: Dodgson, M.
& Gann, D. & Philipps, N. (2015). The Oxford Handbook of Innovation
Management, Oxford University Press.
Helpman, E. (2006). Trade, FDI, and the Organization of Firms.
Hirsch-Kreinsen, H., Jacobson, D., Laestadius, S., & Smith, K. (2005). Low and medium
technology industries in the knowledge economy: the analytical issues.
96
Hofmann, C., & Orr, S. (2005). Advanced manufacturing technology adoption—the
German experience. Technovation, 25(7), 711-724.
http://bruegel.org/2017/05/pharmaceutical-industry-at-risk-from-brexit/
https://ec.europa.eu/growth/tools-databases/kets-tools/sites/default/files/policy/italy.pdf
https://ec.europa.eu/programmes/horizon2020/en/area/ict-research-innovation.
http://ec.europa.eu/growth/tools-databases/newsroom/cf/itemdetail.cfm?item_id=7945
http://europa.eu/rapid/press-release_CJE-08-65_en.htm?locale=en
http://iri.jrc.ec.europa.eu/scoreboard16.html#modal-two
http://is.jrc.ec.europa.eu/pages/ISG/PREDICT2014compnonEU.html
http://people.defensenews.com/top-100/
http://s3platform.jrc.ec.europa.eu/documents/20182/91499/Ris+Southern+NL.pdf/eb5a
7447-17f1-417a-8538-9b93cbba9fd4
http://www.aerospace-valley.com/en
Http://www.bcsemi.nl/
http://www.cggc.duke.edu/pdfs/2013_08_20_Ch4_Aerospace.pdf
http://www.eacp-aero.eu/index.php?id=22
https://www.flandersinvestmentandtrade.com/invest/en/news/pharmaceutical-industry-
in-belgium-continues-grow
Http://www.gartner.com/newsroom/id/2701117
http://www.genengnews.com/the-lists/top-10-us-biopharma-clusters/77900061
http://www.hamburg-aviation.de/en/cluster/location.html
Http://www.hermes-microvision.com/
http://www.imalab.net/news/italian-pharmaceutical-industry-number-two-europe
http://www2.imec.be/be_en/press/imec-news/imecasml.html
http://www.imi.europa.eu/
http://www.interpharma.ch/fr/faits-et-statistiques/5145-pharmaceutical-hub-
switzerland-basel-region
http://www.liftstream.com/boston-biotech-cluster.html
http://www.liftstream.com/san-francisco-biotech-.html
http://www.luzern-business.ch/frontend/handler/document.php?id=1324&type=42
http://www.mediconvalley.com/
Http://www.mooreslaw.org/
http://www.ons.gov.uk/economy/governmentpublicsectorandtaxes/researchanddevelop
mentexpenditure /bulletins/businessenterpriseresearchanddevelopment/2014
http://www.pharmavoice.com/article/2015-09-italy/
http://www.tci-network.org/initiatives/initiative/4352
http://www.toscanalifesciences.org/en/
http://www.vaccineseurope.eu/
http://www.worldatlas.com/articles/countries-with-the-biggest-global-pharmaceutical-
markets-in-the-world.html
https://ec.europa.eu/digital-single-market/en/news/communication-european-strategy-
micro-and-nanoelectronic-components-and-systems
https://ec.europa.eu/growth/tools-databases/kets-tools/kets-deployment
https://www.efpia.eu/media/219735/efpia-pharmafigures2017_statisticbroch_v04-
final.pdf
https://www.fda.gov/
https://www.nih.gov/
https://www.statista.com/topics/1719/pharmaceutical-industry
Hughes, B. (2010). Evolving R&D for emerging markets. Nature Publishing Group,
MacMillan. London.
97
ICEX (2016). SPAIN: Business opportunities in aerospace. Available at:
www.investinspain.org/invest/wcm/idc/groups/public/documents/documento/mde
1/mzy3/~edisp/doc20153671
IHS Markit. (2016). Competitive Landscaping Tool.
Iwasa, T., & Odagiri, H. (2004). Overseas R&D, knowledge sourcing, and patenting: an
empirical study of Japanese R&D investment in the US. Research Policy, 33(5),
807-828.
Jaffe, A. B., Trajtenberg, M., & Henderson, R. (1993). Geographic localization of
knowledge spillovers as evidenced by patent citations. The Quarterly Journal of
Economics, 108(3), 577.
Joint Statement of European business organizations on the occasion of the 21st EU-Japan
summit, 12. November 2013 (http://pr.euractiv.com/pr/joint-statement-
european-business-organisations-occasion-21steu-japan-summit-101452)
Johnson, J., Baldwin, J. R., & Diverty, B. (1996). The implications of innovation for
human resource strategies. Futures, 28(2), 103-119.
Kafouros, M. I., Buckley, P. J., & Clegg, J. (2012). The effects of global knowledge
reservoirs on the productivity of multinational enterprises: The role of
international depth and breadth. Research Policy, 41(5), 848-861.
Karlsson, M., Trygg, L., & Elfström, B.-O. (2004). Measuring R&D productivity:
complementing the picture by focusing on research activities. Technovation,
24(3), 179-186.
Ketokivi, M. & Ali-Yrkkö, J. (2009). Unbundling R&D and Manufacturing: Postindustrial
Myth or Economic Reality? Review of Policy Research, 26(1-2), 35-54.
Kinda, T. (2010). Investment Climate and FDI in Developing Countries: Firm-level
evidence. World Development, 38(4), 498-513.
Kuemmerle, W. (1997). Building effective R&D capabilities abroad. Harvard Business
Review, 75, 61-72.
Kuhlmann, S. & Ordonez-Matamoros, G. (2017). Introduction: governance of innovation
in merging countries: understanding failures and exploring options, in: Kuhlmann,
S. & Ordonez-Matamoros, G. (ed.). Research handbook on innovation governance
for emergering economies, Edward Elgar Publishing, Cheltenham UK.
Lahiri, N. (2010). Geographic distribution of R&D activity: how does it affect innovation
quality? Academy of Management Journal, 53(5), 1194-1209.
Leenders, M.A.A.M. & Wierenga, B. (2002). The effectiveness of different mechanisms for
integrating marketing and R&D. The Journal of Product Innovation Management,
19, 305‐17.
Leifer, R., & Triscari, T. (1987). Research versus development: differences and
similarities. Engineering Management, IEEE Transactions on(2), 71-78.
Lewin, A. Y., Massini, S., & Peeters, C. (2009). Why are companies offshoring
innovation? The emerging global race for talent. Journal of International
Business Studies, 40(6), 901-925.
Li, Y. & Zhang, Y. (2009). 36 Billion CRO market, the rise of Chinese CROs,
ChinaVenture, 9 Apr.
London Economics (2016). Development of the Scottish Space Industry. Available at:
http://www.sacatapultcoe.org/wp-content/uploads/2016/12/Development-of-the-
Scottish-Space-Industry-ExecSumm.pdf
Love, J. H., & Roper, S. (1999). The determinants of innovation: R & D, technology
transfer and networking effects. Review of Industrial Organization, 15(1), 43-64.
McKinsey China (2013). Editor’s Choice: In search for new growth models for big pharma
in China.
McKinsey (2016). Disruptive trends that will transform the auto-industry.
98
Mariani, M. (2002). Next to production or to technological clusters? The economics and
management of R&D location. Journal of Management and Governance, 6(2), 131-
152.
Malanowski, N. & Krug, C. (2017): Digitalisierung in der Industrie im Spiegel der
prospektiven Technikgestaltung, in: Vassiliadis, M. (ed.): Digitalisierung und
Industrie 4.0 – Technik allein reicht nicht, IG BCE, Hannover, 67-93.
Mai, Manfred (2014). Innovationspolitik – Politik für Innovationen, in: Mai (ed.):
Handbuch Innovationen, Springer VS, Wiesbaden.
Martin, B. (2016). R&D policy instruments – a critical review of what we do and don`t
know, Industry and Innovation, 23 (2), 157-176.
Mazzucato, M. & Semienuk, G. (2017). Public financing of innovation: new questions.
Oxford Review of Economic Policy, 33 (1), 24-48.
Mazzucato, M. (2015). Which industrial policy does Europe need? Intereconomics, 120-
125.
Meijers, H., Dachs, B. and Welfens, P. J.J. (2008). Internationalisation of European ICT
Activities. Springer-Verlag Berlin Heidelberg.
Mihalache, O. R., Jansen, J. J., Van Den Bosch, F. A., & Volberda, H. W. (2012).
Offshoring and firm innovation: The moderating role of top management team
attributes. Strategic Management Journal, 33(13), 1480-1498.
Mir-Babayev, R. (2017). The Impact of Cultural Diversity on Innovation Performance,
Economics and Sociology, 10 (1), 78-93.
Mishra, S., Deshmukh, S., & Vrat, P. (2005). Some issues on technological forecasting
and technology transfer in India. International journal of technology transfer and
commercialisation, 4(2), 231-246.
Moncada-Paternò-Castello, P., Vivarelli, M., & Voigt, P. (2011). Drivers and impacts in
the globalization of corporate R&D: an introduction based on the European
experience. Industrial and Corporate Change, 20(2), 585-603.
Naik, B., & Chakravarty, A. K. (1992). Strategic acquisition of new manufacturing
technology: a review and research framework. The International Journal Of
Production Research, 30(7), 1575-1601.
National Center for Science and Engineering Statistics (2016),
https://www.nsf.gov/statistics/2017/nsf17302/nsf17302.pdf
Nepelski & De Prato (2012). Internationalisation of ICT R&D. A comparative analysis of
Asia, the European Union, Japan, United States and the rest of the world. Asian
Journal of Technology Innovation, 20(2), 219-238.
Nieto, M. J., & Rodríguez, A. (2011). Offshoring of R&D: Looking abroad to improve
innovation performance. Journal of International Business Studies, 42(3), 345-
361.
Nonaka, I. & Takeuchi, H. (1995). The Knowledge Creating Company, Oxford University
Press, New York, NY.
OECD (2005). Oslo Manual – Guidelings for collecting and interpreting innovation data.
Third edition.
OECD (2006). “Productivity Impacts of Offshoring and Outsourcing: A Review”, by
Karsten Bjerring Olsen, STI Working Paper.
OECD. (2007). Intellectual Assets and International Investment: A stocktaking of the
evidence. Paris (OECD).
OECD (2010). OECD Information Technology Outlook 2010.
OECD. (2011). OECD Science, Technology and Industry Outlook 2010.
OECD (2013). Innovation-driven Growth in regions: The role of Smart specialization.
OECD (2015). OECD Digital Economy Outlook 2015.
OECD (2015b). Data-Driven Innovation. Big Data for Growth and Well-Being.
OECD (2017a). Investing in Innovation and Skills, Paris.
99
OECD (2017b). Enabling the next production revolution. A summary of main messages
and policy lessons. Paris.
OECD (2017c). The Future of Global Value Chains, Paris.
OECD (2015): The Innovation Imperative: Contributing to Productivity, Growth and Well-
Being, Paris.
OECD (2012). STI Policy Profiles: Building Comeptencies and Capacaties to Innnovate,
Paris.
Owen, G. (2017). Lessons from the US: innovation policy, London School of Economics
and Political Science.
Ozgen, C. & Nijkamp, P. & Poot, J. (2013). Measuring cultural diversity and its impact on
innovation, Working Paper, Institute for the Study on Labour (IZA), Bonn.
Peng, M.W. (2011). “Global Business”. 2nd Edition, Mason, South Western, pp 635.
Penner-Hahn, J., & Shaver, J. M. (2005). Does international research and development
increase patent output? An analysis of Japanese pharmaceutical firms. Strategic
Management Journal, 26(2), 121-140.
Porter, M. (1985). Competitive advantage: creating and sustaining superior performance.
PhRMA (2009). Pharmaceutical research industry profile.
PhRMA (2014). Pharmaceutical research industry profile.
PWC (2015). How to be No. 1: Facing future challenges in the automotive industry.
Rafols, I., Hopkins, M. M., Hoekman, J., Siepel, J., O'Hare, A., Perianes-Rodríguez, A., &
Nightingale, P. (2014). Big pharma, little science?: A bibliometric perspective on
Big Pharma's R&D decline. Technological Forecasting and Social Change, 81, 22-
38.
Ramirez, P., (2014), “Outsourcing and Offshoring of R&D in the Pharmaceutical Industry:
Evidence and Policy Implications from a Global Value Chain Analysis“, Paper
presented at the 3rd IRIMA Workshop on the Internationalisation of Corporate
R&D and Innovation, Brussels, June 5, 2014.
Reddy, P. (2011). Global innovation in emerging economies (Vol. 17): Routledge.
Reger, G. (2001). Technology foresight in companies: from an indicator to a network and
process perspective. Technology Analysis & Strategic Management, 13(4), 533-
553.
Reuters (2011). Big Pharma's global guinea pigs.
Rhodes, C. et al (2015). The aerospace industry: statistics and policy". Parliament. HM
Government.
Rugman, A., Verbeke, A., & Yuan, W. (2011). Re‐conceptualizing Bartlett and Ghoshal's
Classification of National Subsidiary Roles in the Multinational Enterprise. Journal
of Management studies, 48(2), 253-277.
Schmiele, A., & Mangelsdorf, A. (2009). Drivers of International R&D to Asian
Economies-a Perspective from German Companies. Paper presented at the 6th
Asialics International Conference on Linkages in Innovation Systems: Global and
Local Perspectives.
Semiconductor Industry Association (2016). Beyond Border: The global semiconductor
value chain. How an interconnected industry promotes innovation and growth.
Shaver, J., & Flyer, F. (2000). Agglomeration economies, firm heterogeneity, and foreign
direct investment in the United States. Strategic Management Journal, 21(12),
1175-1193.
Simon, S., Näher, U. and M.D. Lauritzen (2008), “R&D: Aligning the interface with
production” in Global Production edited by Prof. Dr.-Ing. Eberhard Abele, Richard
Sykes.
Singh, J. (2008). Distributed R&D, cross-regional knowledge integration and quality of
innovative output. Research Policy, 37(1), 77-96.
100
Sohal, A., Sarros, J., Schroder, R., & O'neill, P. (2006). Adoption framework for advanced
manufacturing technologies. International Journal of Production Research, 44(24),
5225-5246.
Somers, D. (2016). Essays on the location of FDI of multinational firms. Doctoral thesis.
Strategy Analytics, 2016, Automotive Semiconductor Vendor Market Shares.
Styhre, A., Ollila, S., Roth, J., Williamson, D. & Berg, L. (2008). Heedful interrelating,
knowledge sharing, and new drug development. Journal of Knowledge
Management, 12(3), 127‐40.
Sturgeon, T., Van Biesebroeck, J., Gereffi, G. (2008). Value chains, networks and
clusters: reframing the global automotive industry. Journal of Economic
Geography, 8, 297-321.
The technological profile and specialization pattern of countries (2013), EC, DG Research
and Innovation.
Thursby, J., & Thursby, M. (2009). Here or There? A Survey of Factors in Multinational
R&D Location: Report to the Government/University/Industry Research
Roundtable. A Survey of Factors in Multinational R&D Location: Report to the
Government/University/Industry Research Roundtable (December 1, 2006).
Kauffman Foundation Large Research Projects Research.
Tijssen, R. J. (2009). Internationalisation of pharmaceutical R&D: how globalised are
Europe's largest multinational companies? Technology analysis & Strategic
management, 21(7), 859-879.
Todd, A. and Anderson, R.J. & Groundwater, P.W. (2009). Rational drug design -
identifying and characterising a target. The pharmaceutical journal, 283(7559),
19-20.
Tomasello M.V., M. Napoletano, A. Garas and F. Schweitzer (2016). The rise and fall of
R&D Networks. ISIGrowth working paper.
Tönurist, P. & Kattel, R. & Lember, V. (2015). Discovering Innovation Labs in the Public
Sector. Working Papers in Technology Governance and Economic Dyanmics,
Talinnn.
Tushman, M. L. (1978). Technical communication in R & D laboratories: The impact of
project work characteristics. Academy of Management Journal, 21(4), 624-645.
United Nations Industrial Development Organization (2011). Diagnostics for Industrial
Value Chain Development – An Integrated Tool.
Van Goolen, R. & Evers, H. & Lammens, S. (2014). International Innovation Labs: An
innovation meeting ground between SMEs and business schools, Procedia
Economics and Finance, 12, 184-190.
Van Wyk, R. J. (1997). Strategic technology scanning. Technological Forecasting and
Social Change, 55(1), 21-38.
Veugelers, R. (2013), Trends, challenges and prospects for manufacturing in Europe, In
Manufacturing in Europe’s future, edited by R. Veugelers. (Breugel).
Vissak, T., & Roolaht, T. (2005). The negative impact of foreign direct investment on the
Estonian economy. Problems of Economic Transition, 48(2), 43-66.
Von Zedtwitz, M., & Gassmann, O. (2002). Market versus technology drive in R&D
internationalization: four different patterns of managing research and
development. Research policy, 31(4), 569-588.
Wadhwa, V., Rissing, B. A., Gereffi, G., Trumpbour, J., & Engardio, P. (2008). The
Globalization of Innovation: Pharmaceuticals: Can India and China Cure the Global
Pharmaceutical Market. Available at SSRN 1143472.
Walsh, V. (1996). Design, innovation and the boundaries of the firm. Research policy,
25(4), 509-529.
Wheelwright, S. C., & Clark, K. B. (1992). Revolutionizing product development: Free
Press.
101
Wolfe, D. (2017). Why global innovation supply chains are going local. Centre for
International Governance Innovation, University of Toronto.
Wolfe, D. (2016). A Policy Agenda for the Digital Economy, Policy Paper, University of
Toronto.
www.adsgroup.org.uk/membership/special-interest-groups
www.aeriades.org
www.aero-centre.fr
www.aerospace-cluster.fr
www.aerospace-valley.com
www.cleansky.eu
www.clustercollaboration.eu
www.ctna.it
www.flightglobal.com/news/articles/a-tale-of-two-regions-germanys-aerospace-industry-
206526/
www.gtai.de
www.eacp-aero.eu
www.hegan.com
www.helicecluster.com
www.nae.fr
www.niedersachsen-aviation.com/en/network/associations-and-clusters.html
www.pole-astech.org
www.prestwickaerospace.com
www.safecluster.com
www.sdi.co.uk
www.spie.org/al16 (advanced litography: 2016 technical summaries)
Yu, L.X., Amidon, G., Khan, M.A., Hoag, S.W., Polli, J., Raju, G.K., Woodcock, J. (2014).
Understanding Pharmaceutical Quality by Design. The AAPS Journal, 16(4), 771-
783.