Embed Size (px)
Citation preview
MIG BANK / Forex Broker 14, rte des Gouttes d’Or CH-2008 Neuchâtel Switzerland
Tel +41 32 722 81 00 Fax +41 32 722 81 01 [email protected] www.migbank.com
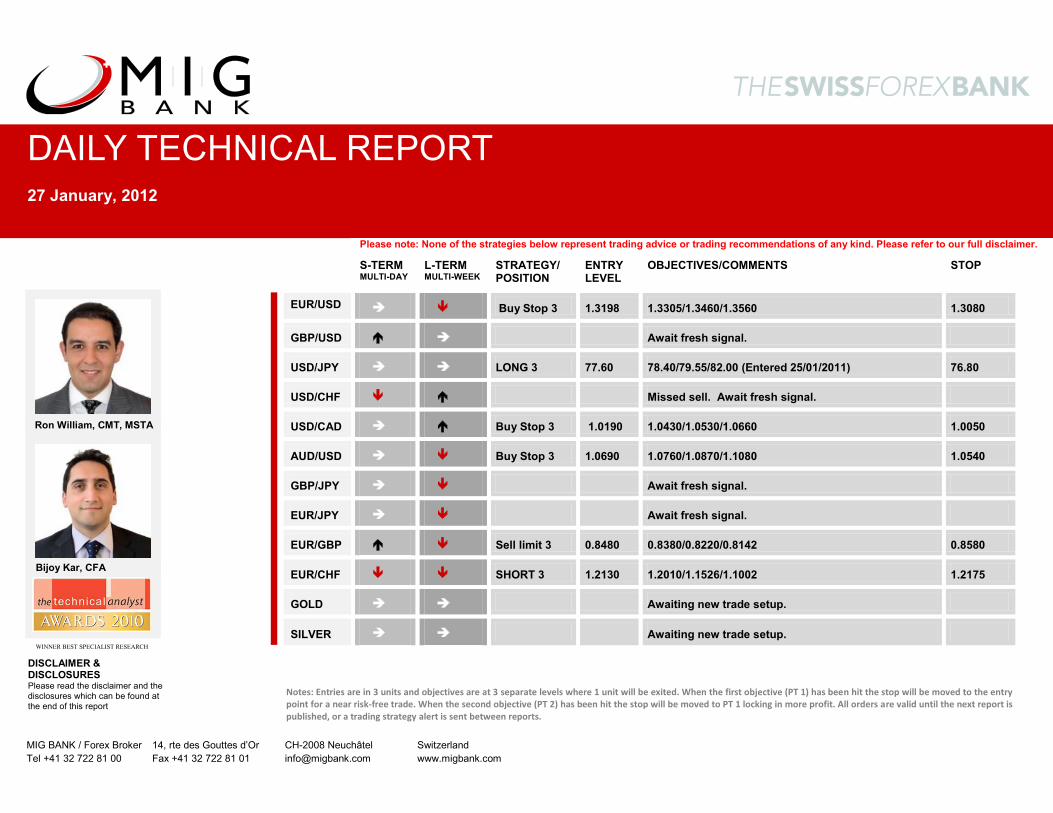
Please note: None of the strategies below represent trading advice or trading recommendations of any kind. Please refer to our full disclaimer.
WINNER BEST SPECIALIST RESEARCH
MAS-TERM MULTI-DAY
L-TERM MULTI-WEEK
STRATEGY/ POSITION
ENTRY LEVEL
OBJECTIVES/COMMENTS STOP
EUR/USD è ê Buy Stop 3 1.3198 1.3305/1.3460/1.3560 1.3080
GBP/USD é è Await fresh signal.
USD/JPY è è LONG 3 77.60 78.40/79.55/82.00 (Entered 25/01/2011) 76.80
USD/CHF ê é Missed sell. Await fresh signal.
USD/CAD è é Buy Stop 3 1.0190 1.0430/1.0530/1.0660 1.0050
AUD/USD è ê Buy Stop 3 1.0690 1.0760/1.0870/1.1080 1.0540
GBP/JPY è ê Await fresh signal.
EUR/JPY è ê Await fresh signal.
EUR/GBP é ê Sell limit 3 0.8480 0.8380/0.8220/0.8142 0.8580
EUR/CHF ê ê SHORT 3 1.2130 1.2010/1.1526/1.1002 1.2175
GOLD è è Awaiting new trade setup.
SILVER è è Awaiting new trade setup.
DISCLAIMER & DISCLOSURES Please read the disclaimer and the disclosures which can be found at the end of this report
DAILY TECHNICAL REPORT 27 January, 2012
Ron William, CMT, MSTA
Bijoy Kar, CFA
Notes: Entries are in 3 units and objectives are at 3 separate levels where 1 unit will be exited. When the first objective (PT 1) has been hit the stop will be moved to the entry
point for a near risk-free trade. When the second objective (PT 2) has been hit the stop will be moved to PT 1 locking in more profit. All orders are valid until the next report is
published, or a trading strategy alert is sent between reports.
2
DAILY TECHNICAL REPORT
27 January, 2012
www.migbank.com
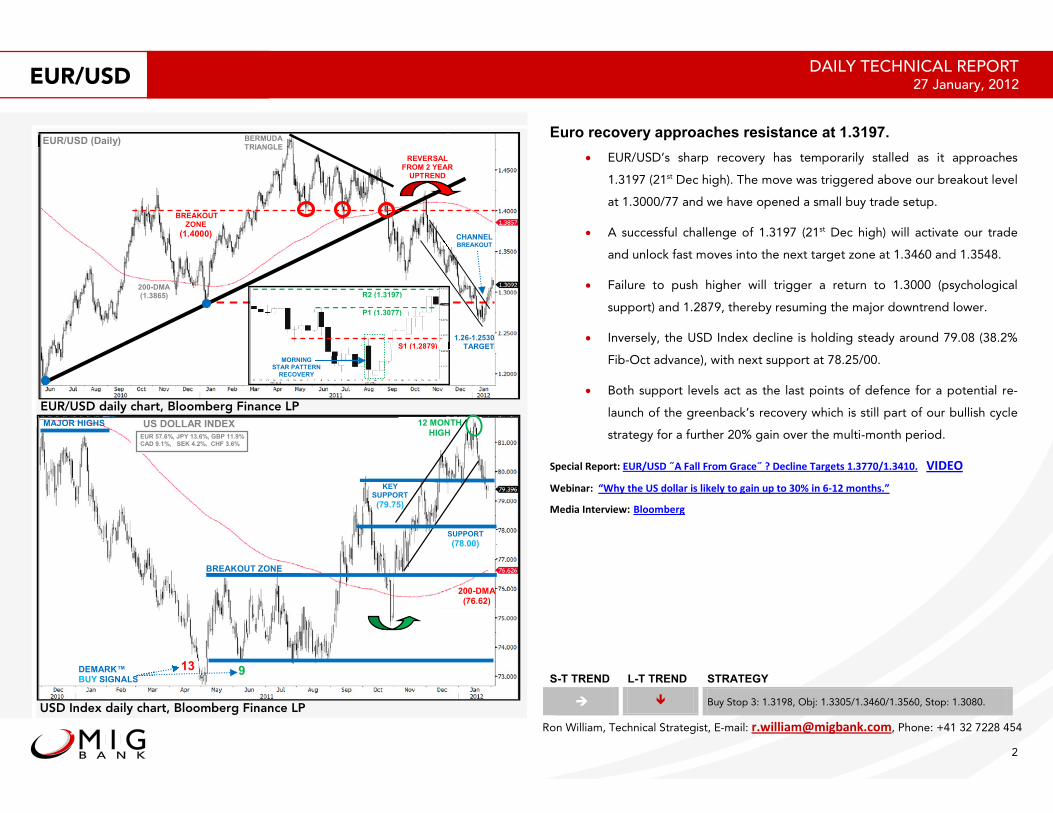
Euro recovery approaches resistance at 1.3197.
EUR/USD’s sharp recovery has temporarily stalled as it approaches
1.3197 (21st Dec high). The move was triggered above our breakout level
at 1.3000/77 and we have opened a small buy trade setup.
A successful challenge of 1.3197 (21st Dec high) will activate our trade
and unlock fast moves into the next target zone at 1.3460 and 1.3548.
Failure to push higher will trigger a return to 1.3000 (psychological
support) and 1.2879, thereby resuming the major downtrend lower.
Inversely, the USD Index decline is holding steady around 79.08 (38.2%
Fib-Oct advance), with next support at 78.25/00.
Both support levels act as the last points of defence for a potential re-
launch of the greenback’s recovery which is still part of our bullish cycle
strategy for a further 20% gain over the multi-month period.
Special Report: EUR/USD !"#$%%"#&'(")&$*+ ? Decline Targets 1.3770/1.3410. VIDEO
Webinar: “Why the US dollar is likely to gain up to 30% in 6-12 (',-./01
Media Interview: 2%''(3+&4
S-T TREND L-T TREND STRATEGY
! Buy Stop 3: 1.3198, Obj: 1.3305/1.3460/1.3560, Stop: 1.3080.
EUR/USD
Ron William, Technical Strategist, E-mail: &056%%6$(7(643$,80*'(, Phone: +41 32 7228 454
EUR/USDEUR/USD
EUR/USD daily chart, Bloomberg Finance LP
Ro
USD Index daily chart, Bloomberg Finance LP
REVERSALFROM 2 YEAR
UPTREND
200-DMA(1.3865)
BERMUDA TRIANGLE
EUR/USD (Daily)
BREAKOUT ZONE
(1.4000) CHANNELBREAKOUT
1.26-1.2530TARGET
R2 (1.3197)
MORNINGSTAR PATTERN
RECOVERY
P1 (1.3077)
S1 (1.2879)
913
US DOLLAR INDEX
200-DMA(76.62)
DEMARK™BUY SIGNALS
BREAKOUT ZONE
EUR 57.6%, JPY 13.6%, GBP 11.9% CAD 9.1%, SEK 4.2%, CHF 3.6%
12 MONTHHIGH
KEY SUPPORT
(79.75)
MAJOR HIGHS
SUPPORT
(78.00)
3
DAILY TECHNICAL REPORT 27 January, 2012
www.migbank.com
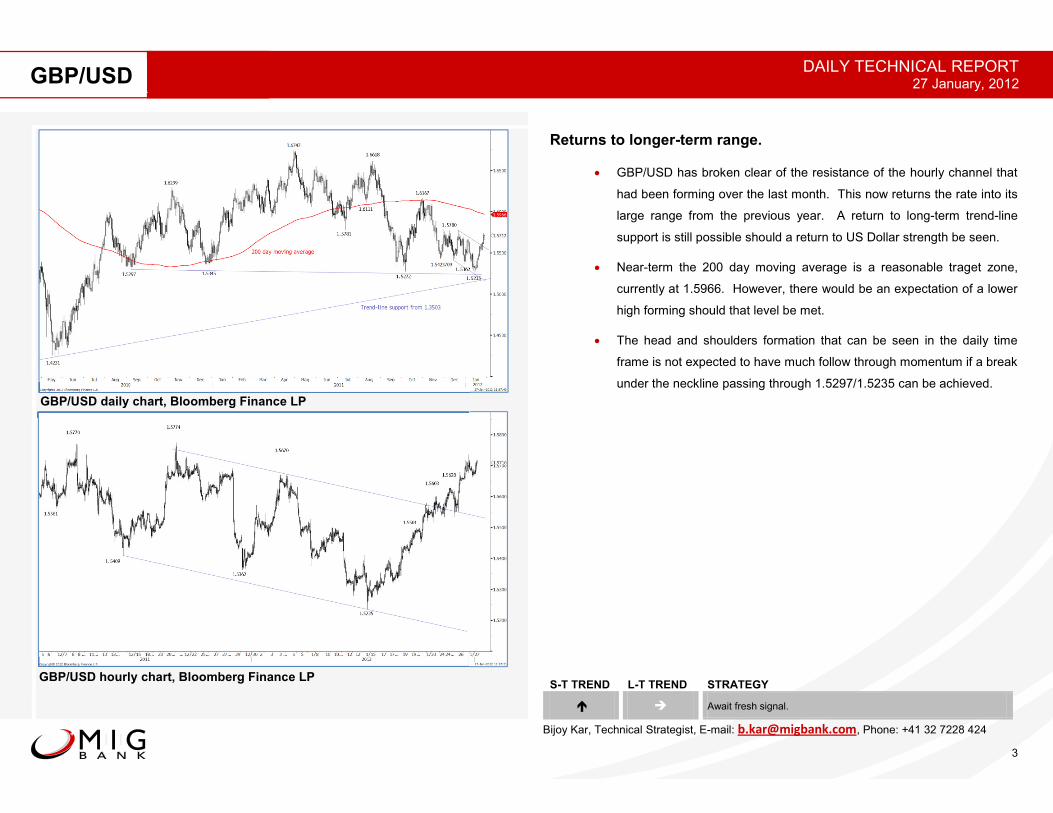
Returns to longer-term range.
· GBP/USD has broken clear of the resistance of the hourly channel that
had been forming over the last month. This now returns the rate into its
large range from the previous year. A return to long-term trend-line
support is still possible should a return to US Dollar strength be seen.
· Near-term the 200 day moving average is a reasonable traget zone,
currently at 1.5966. However, there would be an expectation of a lower
high forming should that level be met.
· The head and shoulders formation that can be seen in the daily time
frame is not expected to have much follow through momentum if a break
under the neckline passing through 1.5297/1.5235 can be achieved.
S-T TREND L-T TREND STRATEGY
é è Await fresh signal.
GBP/USD
Bijoy Kar, Technical Strategist, E-mail: [email protected], Phone: +41 32 7228 424
GBP/USD hourly chart, Bloomberg Finance LP
GBP/USD daily chart, Bloomberg Finance LP
4
DAILY TECHNICAL REPORT 27 January, 2012
www.migbank.com
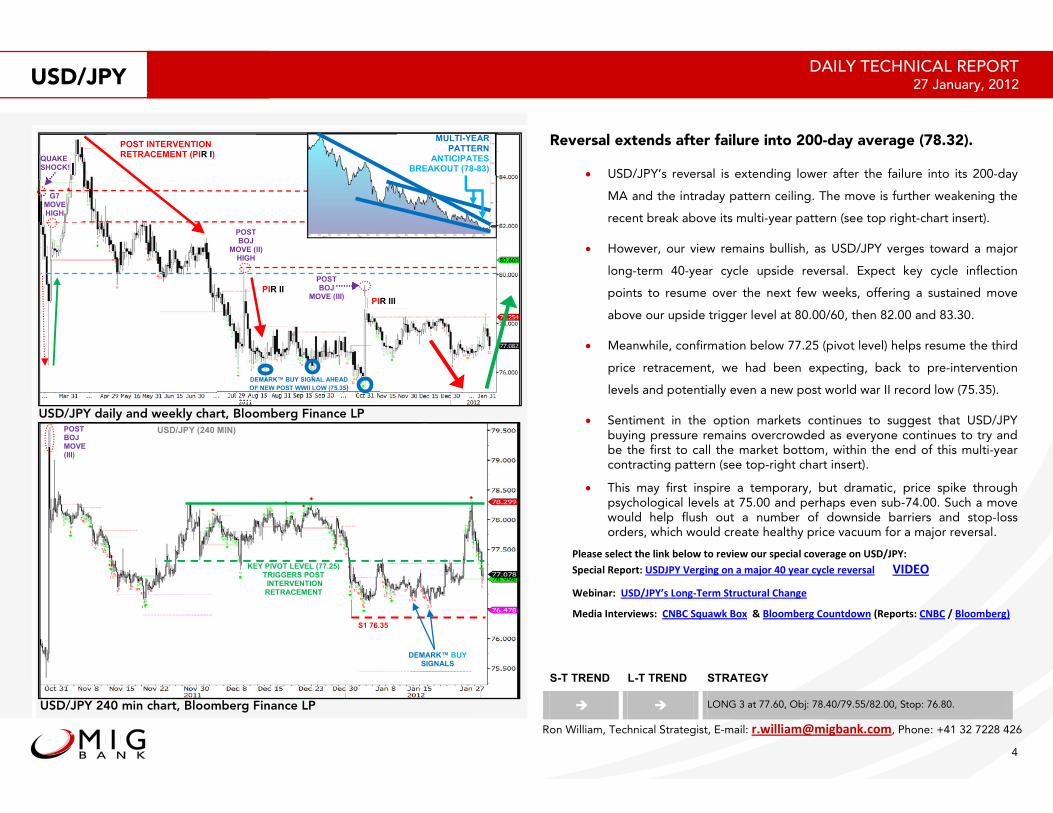
Reversal extends after failure into 200-day average (78.32).
USD/JPY’s reversal is extending lower after the failure into its 200-day
MA and the intraday pattern ceiling. The move is further weakening the
recent break above its multi-year pattern (see top right-chart insert).
However, our view remains bullish, as USD/JPY verges toward a major
long-term 40-year cycle upside reversal. Expect key cycle inflection
points to resume over the next few weeks, offering a sustained move
above our upside trigger level at 80.00/60, then 82.00 and 83.30.
Meanwhile, confirmation below 77.25 (pivot level) helps resume the third
price retracement, we had been expecting, back to pre-intervention
levels and potentially even a new post world war II record low (75.35).
Sentiment in the option markets continues to suggest that USD/JPY buying pressure remains overcrowded as everyone continues to try and be the first to call the market bottom, within the end of this multi-year contracting pattern (see top-right chart insert).
This may first inspire a temporary, but dramatic, price spike through psychological levels at 75.00 and perhaps even sub-74.00. Such a move would help flush out a number of downside barriers and stop-loss orders, which would create healthy price vacuum for a major reversal.
Please select the link below to review our special coverage on USD/JPY:
Special Report: !"#$%&'()*+,*&-,&.&/.0-)&12&3(.)&4345(&)(6()7.5 VIDEO
Webinar: USD/JPY’s Long-T()/&!8)9489).5&:;.,*(&
Media Interviews: :<=:&Squawk Box & =5--/>()*&:-9,8down (Reports: :<=: / =5--/>()*)
S-T TREND L-T TREND STRATEGY
LONG 3 at 77.60, Obj: 78.40/79.55/82.00, Stop: 76.80.
Ron William, Technical Strategist, E-mail: )?@+55+./A/+*>.,B?4-/, Phone: +41 32 7228 426
USD/JPY
USD/JPY 240 min chart, Bloomberg Finance LP
USD/JPY daily and weekly chart, Bloomberg Finance LP
PIR II
POST BOJ
MOVE (II)HIGH
QUAKESHOCK!
POST INTERVENTION RETRACEMENT (PIR I)
G7MOVEHIGH
DEMARK™ BUY SIGNAL AHEAD
OF NEW POST WWII LOW (75.35)
POST BOJ
MOVE (III)PIR III
MULTI-YEAR PATTERN
ANTICIPATESBREAKOUT (78-83)
USD/JPY (240 MIN)POSTBOJMOVE (III)
KEY PIVOT LEVEL (77.25) TRIGGERS POSTINTERVENTION RETRACEMENT
DEMARK™ BUYSIGNALS
S1 76.35
6
DAILY TECHNICAL REPORT 27 January, 2012
www.migbank.com
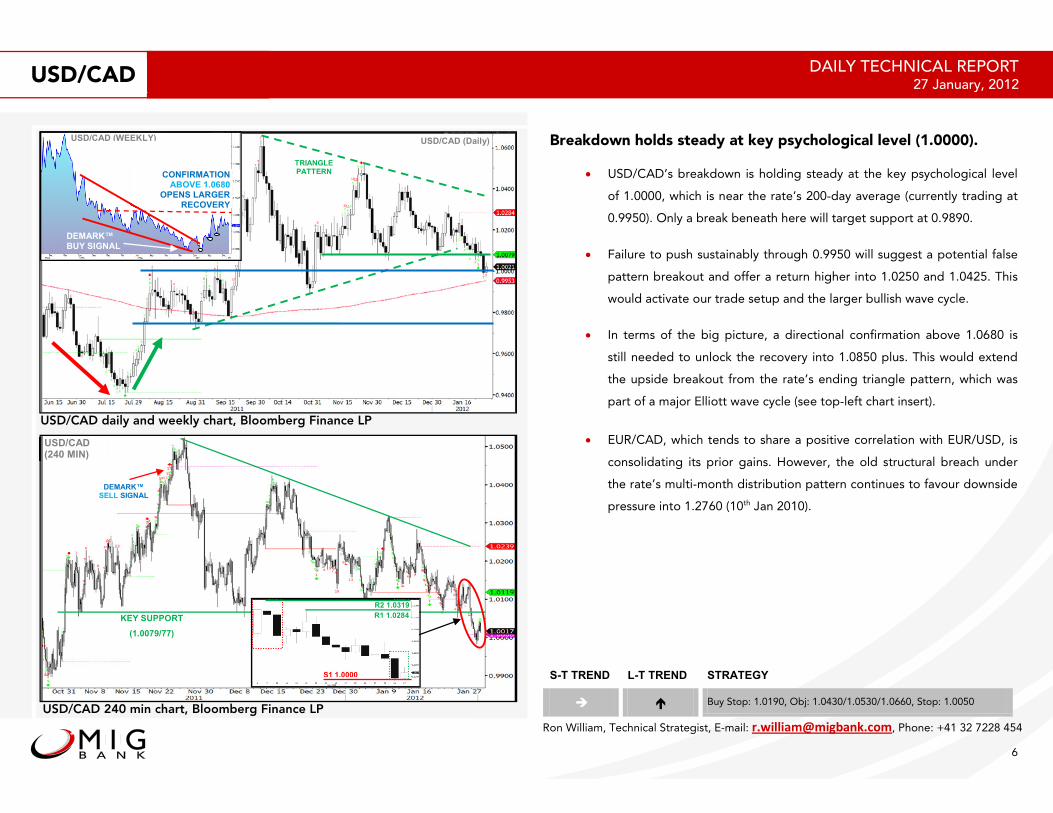
Breakdown holds steady at key psychological level (1.0000).
USD/CAD’s breakdown is holding steady at the key psychological level
of 1.0000, which is near the rate’s 200-day average (currently trading at
0.9950). Only a break beneath here will target support at 0.9890.
Failure to push sustainably through 0.9950 will suggest a potential false
pattern breakout and offer a return higher into 1.0250 and 1.0425. This
would activate our trade setup and the larger bullish wave cycle.
In terms of the big picture, a directional confirmation above 1.0680 is
still needed to unlock the recovery into 1.0850 plus. This would extend
the upside breakout from the rate’s ending triangle pattern, which was
part of a major Elliott wave cycle (see top-left chart insert).
EUR/CAD, which tends to share a positive correlation with EUR/USD, is
consolidating its prior gains. However, the old structural breach under
the rate’s multi-month distribution pattern continues to favour downside
pressure into 1.2760 (10th Jan 2010).
S-T TREND L-T TREND STRATEGY
! Buy Stop: 1.0190, Obj: 1.0430/1.0530/1.0660, Stop: 1.0050
Ron William, Technical Strategist, E-mail: !"#$$#%&'&#()%*+!,-&, Phone: +41 32 7228 454
USD/CAD
USD/CAD daily and weekly chart, Bloomberg Finance LP
USD/CAD 240 min chart, Bloomberg Finance LP
200-DMA(0.9953)
TRIANGLEPATTERN
USD/CAD (Daily)
DEMARK™BUY SIGNAL
CONFIRMATION ABOVE 1.0680
OPENS LARGERRECOVERY
USD/CAD (WEEKLY)
KEY SUPPORT
(1.0079/77)
USD/CAD(240 MIN)
DEMARK™SELL SIGNAL
R2 1.0319
R1 1.0284
S1 1.0000
7
DAILY TECHNICAL REPORT 27 January, 2012
www.migbank.com
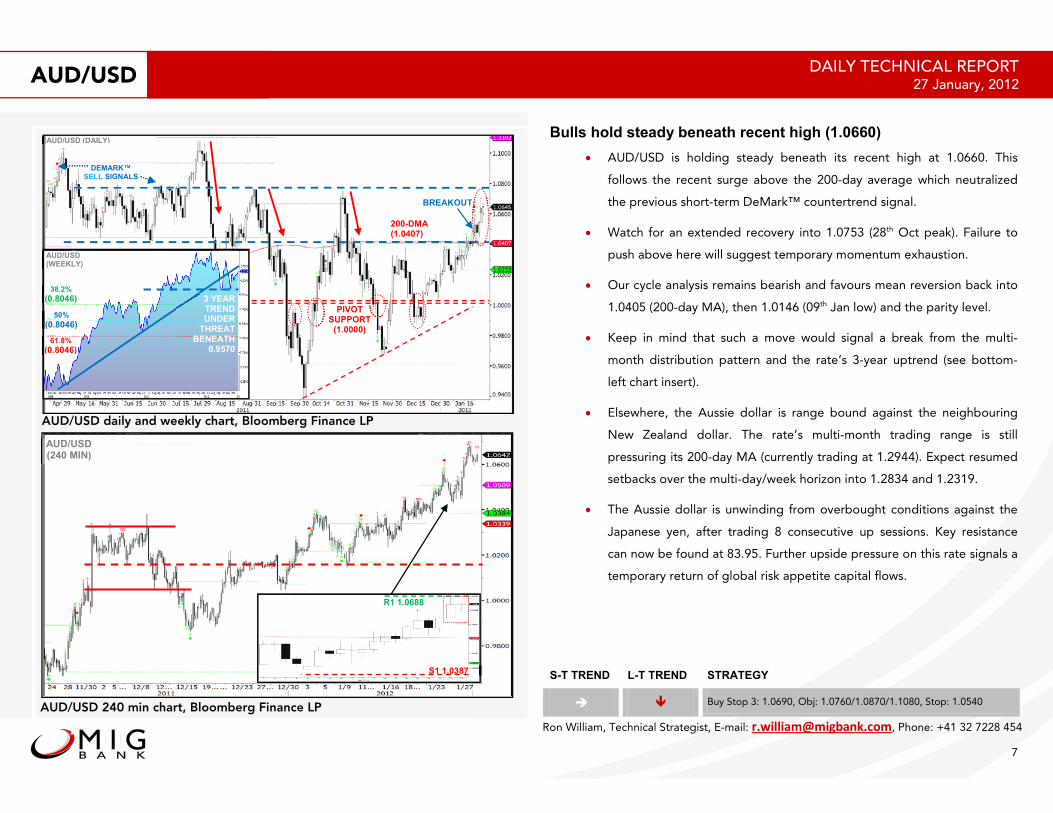
Bulls hold steady beneath recent high (1.0660)
AUD/USD is holding steady beneath its recent high at 1.0660. This
follows the recent surge above the 200-day average which neutralized
the previous short-term DeMark™ countertrend signal.
Watch for an extended recovery into 1.0753 (28th Oct peak). Failure to
push above here will suggest temporary momentum exhaustion.
Our cycle analysis remains bearish and favours mean reversion back into
1.0405 (200-day MA), then 1.0146 (09th Jan low) and the parity level.
Keep in mind that such a move would signal a break from the multi-
month distribution pattern and the rate’s 3-year uptrend (see bottom-
left chart insert).
Elsewhere, the Aussie dollar is range bound against the neighbouring
New Zealand dollar. The rate’s multi-month trading range is still
pressuring its 200-day MA (currently trading at 1.2944). Expect resumed
setbacks over the multi-day/week horizon into 1.2834 and 1.2319.
The Aussie dollar is unwinding from overbought conditions against the
Japanese yen, after trading 8 consecutive up sessions. Key resistance
can now be found at 83.95. Further upside pressure on this rate signals a
temporary return of global risk appetite capital flows.
S-T TREND L-T TREND STRATEGY
! Buy Stop 3: 1.0690, Obj: 1.0760/1.0870/1.1080, Stop: 1.0540
AUD/USD
Ron William, Technical Strategist, E-mail: !"#$$#%&'&#()%*+!,-&, Phone: +41 32 7228 454
AUD/USD daily and weekly chart, Bloomberg Finance LP
AUD/USD 240 min chart, Bloomberg Finance LP
200-DMA(1.0407)
BREAKOUT
AUD/USD (DAILY)
DEMARK™ SELL SIGNALS
PIVOT SUPPORT
(1.0000)
61.8%
(0.8046)
50%
(0.8046)
38.2%
(0.8046) 3 YEAR TRENDUNDER
THREATBENEATH
0.9570
AUD/USD(WEEKLY)
AUD/USD(240 MIN)
R1 1.0688
S1 1.0387
5
DAILY TECHNICAL REPORT 27 January, 2012
www.migbank.com
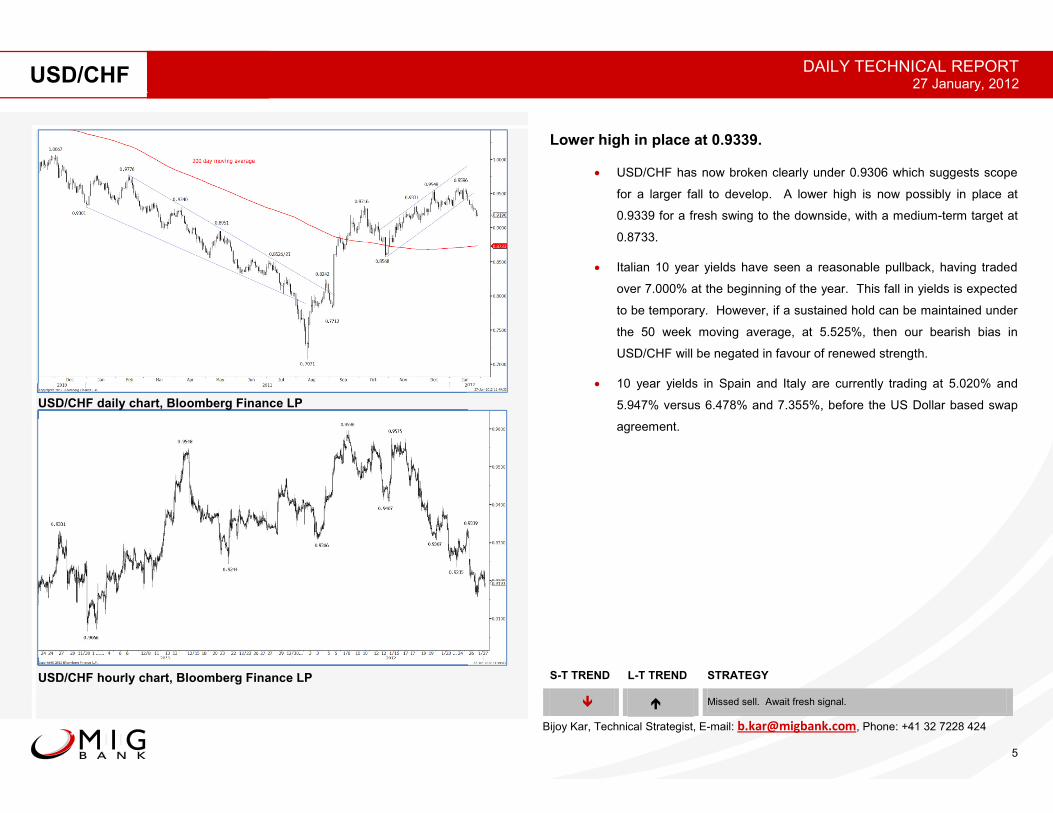
Lower high in place at 0.9339.
· USD/CHF has now broken clearly under 0.9306 which suggests scope
for a larger fall to develop. A lower high is now possibly in place at
0.9339 for a fresh swing to the downside, with a medium-term target at
0.8733.
· Italian 10 year yields have seen a reasonable pullback, having traded
over 7.000% at the beginning of the year. This fall in yields is expected
to be temporary. However, if a sustained hold can be maintained under
the 50 week moving average, at 5.525%, then our bearish bias in
USD/CHF will be negated in favour of renewed strength.
· 10 year yields in Spain and Italy are currently trading at 5.020% and
5.947% versus 6.478% and 7.355%, before the US Dollar based swap
agreement.
S-T TREND L-T TREND STRATEGY
ê é Missed sell. Await fresh signal.
USD/CHF hourly chart, Bloomberg Finance LP
Bijoy Kar, Technical Strategist, E-mail: [email protected], Phone: +41 32 7228 424
USD/CHF
USD/CHF daily chart, Bloomberg Finance LP