Embed Size (px)
Citation preview

Yang et al. Environmental Health 2012, 11:63http://www.ehjournal.net/content/11/1/63
RESEARCH Open Access
Daily temperature and mortality: a study ofdistributed lag non-linear effect and effectmodification in GuangzhouJun Yang1, Chun-Quan Ou1*, Yan Ding2, Ying-Xue Zhou1 and Ping-Yan Chen1
Abstract
Background: Although many studies have documented health effects of ambient temperature, little evidence isavailable in subtropical or tropical regions, and effect modifiers remain uncertain. We examined the effects of dailymean temperature on mortality and effect modification in the subtropical city of Guangzhou, China.
Methods: A Poisson regression model combined with distributed lag non-linear model was applied to assess thenon-linear and lag patterns of the association between daily mean temperature and mortality from 2003 to 2007 inGuangzhou. The case-only approach was used to determine whether the effect of temperature was modified byindividual characteristics, including sex, age, educational attainment and occupation class.
Results: Hot effect was immediate and limited to the first 5 days, with an overall increase of 15.46% (95%confidence interval: 10.05% to 20.87%) in mortality risk comparing the 99th and the 90th percentile temperature.Cold effect persisted for approximately 12 days, with a 20.39% (11.78% to 29.01%) increase in risk comparing thefirst and the 10th percentile temperature. The effects were especially remarkable for cardiovascular and respiratorymortality. The effects of both hot and cold temperatures were greater among the elderly. Females suffered morefrom hot-associated mortality than males. We also found significant effect modification by educational attainmentand occupation class.
Conclusions: There are significant mortality effects of hot and cold temperatures in Guangzhou. The elderly,females and subjects with low socioeconomic status have been identified as especially vulnerable to the effect ofambient temperatures.
Keywords: Mortality, Temperature, China, Distributed lag non-linear model
BackgroundThe impact of weather on mortality has become publichealth significance, especially in light of climate changeand rising frequency of adverse weather events (e.g., heatwaves and floods). The relationship between temperatureand mortality are extensively documented, with excessmorality during days with extremely low or high ambienttemperatures [1-6]. Substantive evidence has shown adelay between changes in daily temperature and changesin mortality, while the lag period considered are not con-sistent in different studies. Previous studies usually
* Correspondence: [email protected] of Biostatistics, School of Public Health and Tropical Medicine,Southern Medical University, Guangzhou 510515, ChinaFull list of author information is available at the end of the article
© 2012 Yang et al.; licensee BioMed Central LtCommons Attribution License (http://creativecreproduction in any medium, provided the or
examined the effects for a single lag [4,7], and some stud-ies chose a priori a lag period and assessed a cumulativeeffect [3,5]. To date, there is lack of a criterion for select-ing the optimal lag. Exploring lag distribution of effectsmay provide some information for selecting an appropri-ate time frame when assessing temperature effects.It has been shown that the association between
temperature and mortality varied greatly by climate, geo-graphic regions and populations [6,8,9], which indicatesthat it is necessary to assess the impacts of temperature invarious regions. The relationship of temperature and mor-tality had been extensively studied in Europe [1,10,11] andthe United States [3,4,6,12]. Only a limited number ofstudies were conducted in developing countries or trop-ical/subtropical regions [7,13-16]. More studies on health
d. This is an Open Access article distributed under the terms of the Creativeommons.org/licenses/by/2.0), which permits unrestricted use, distribution, andiginal work is properly cited.

Yang et al. Environmental Health 2012, 11:63 Page 2 of 9http://www.ehjournal.net/content/11/1/63
effects of weather in these regions are required to fully as-sess global impact of climate change and guide local pub-lic health policy.To develop public health policies that protect those
persons most vulnerable to extreme temperatures,researchers have identified factors that confer suscepti-bility. Previous studies indicated that black, the elderlyand females were especially susceptible populations[8,17,18], while vulnerability by socioeconomic factorsremains unclear. A few studies suggested that those withless education were at higher risk of temperature-relatedmortality [7,19,20], but some other studies showed littleor no evidence for effect modification by area-based[21,22] or individual-based measures of education level[23,24]. Researchers have called for further research onthe role of education level and other socio-economicmeasures to understand inequalities in health impact ofambient temperatures.Guangzhou is the largest metropolis in Southern
China with the latitude of 23° 70 N. It is in a typical sub-tropical climate with mild winter and hot summer. Inthe present study, we sought to examine the associationbetween daily ambient temperature and mortality inGuangzhou and identify the effect modification oftemperature by individual characteristics, including age,sex, educational attainment and occupation class.
MethodsHealth and environmental dataThe Guangzhou Bureau of Health provided individual in-formation for 112,280 deaths from 1 January 2003 to 31December 2007, including date of birth, date of death,cause of death, sex, educational attainment and occupa-tion. The underlying cause of death was classified by theTenth Revision of the International Classification of Dis-eases (ICD-10). We considered non-accidental mortality(ICD-10: A00-R99), mortality due to cardiovascular dis-eases (I00-I99) and respiratory diseases (J00-J99), andthree subcategories, including chronic obstructive pul-monary diseases (J40-J47), stroke (I60-I69) and ischemicheart diseases (I20-I25). Daily number of deaths wassummarized by the underlying cause of death, sex, agegroup (0–64, 65–74, 75–84, 85 years old or above), edu-cational attainment and occupation class, respectively.Educational attainment was defined as the highest degreeof schooling completed before death. In the presentstudy, it was classified into three groups: none (i.e.illiterate or semiliterate), primary education and second-ary or higher education. Occupation was classified intounemployed (including housewife), blue-collar workersand white-collar workers.We obtained the following meteorological data from
China Meteorological Data Sharing Service System [25]:daily values of minimum, mean and maximum
temperature, relative humidity and barometric pressurein Guangzhou. Weather data were collected from theonly basic weather station in Guangzhou, Wushan Sta-tion. The Guangzhou Bureau of Environmental Protec-tion provided air pollution data for 24-hour averageconcentrations of particulate matter with diameters lessthan 10 μm (PM10), nitrogen dioxide (NO2) and sulphurdioxide (SO2). These criteria pollutants have been asso-ciated with cardio-respiratory mortality [26]. The EthicsCommittee of Southern Medical University where thisstudy was conducted has approved the study proposal.
Statistical methodsWe fitted a distributed lag non-linear model (DLNM) toassess the association between daily number of deathsand ambient temperature. DLNM, proposed recently byGasparrini et al. [27] is a flexible model to describe sim-ultaneously a non-linear exposure-response relationshipand delayed effect. It is appropriate to evaluate the char-acteristic of temperature-associated mortality in thattemperature and mortality has shown a J-, W-, V- or U-shaped association [27-29]. A Poisson regression withquasi-Poisson function for daily counts of deaths wasconstructed, which was specified as
Log[E(Yt)]= α+NS(Time,5*7)+NS(Humt,3)+NS(Presst,3)+NS(PM10t,3)+NS(SO2t,3)+NS(NO2t,3)+γDowt + νHolidayt + βTempt,l
where Yt is the observed daily deaths at day t(t=1,2,3. . .1826); α is the intercept; NS(.) means a naturalcubic spline; 7 degrees of freedom (df) per year for timeand 3 df for relative humidity (Hum), barometric pressure(Press), PM10, NO2 and SO2 at the current day wererecommended by several previous studies [13,16,27]. Di-chotomous variables indicating day of the week (Dow) andpublic holidays (Holiday) are also included in the model.Tempt,l is a matrix produced by DLNM to model non-linear and distributed lag effects of ambient temperatureover the current day (lag 0) to lag ldays, and β is vector ofcoefficients for Tempt,l; The maximum lag l was set to25 days to explore the lag structure of temperature effect[17]. The median value of temperature was used as thereference value to calculate the relative risks. Akaike’s In-formation Criterion for quasi-Poisson (Q-AIC) was usedto choose the df for temperature and lag [13,30]. The finalcomposition of the function was a natural cubic spline oftemperature with 5 df and a natural cubic spline with 5 dffor lag days.We fitted a model for each combination of ambient
temperature measures (daily minimum, mean and max-imum temperature) and mortality types using the abovesteps. The Q-AIC was used to choose the temperaturemeasure that best predicted mortality. Mean temperaturegenerally gave the lowest Q-AIC values based on our

Yang et al. Environmental Health 2012, 11:63 Page 3 of 9http://www.ehjournal.net/content/11/1/63
data (see Additional file 1), and mean temperature pro-vides more easily interpreted results in a policy contextand is more familiar to the public. Therefore, we chosemean temperature for subsequent analyses. We calcu-lated percentage change in mortality risk comparing thefirst to the 10th percentile (cold effect) and the 99th tothe 90th percentile (hot effect) of daily mean tempera-tures [17].In order to identify subpopulations that are more sus-
ceptible to the effects of cold and hot temperatures, weconducted stratified analyses by sex, age group, educa-tional attainment and occupation class. Furthermore, weused the case-only approach to determine the statisticalsignificance of effect modification by testing the inter-action between temperature and individual characteristicsof interest. The case-only approach only examines cases.A logistic regression model was constructed with binaryvariable of individual characteristic of deaths as thedependent variable and mean temperature as the inde-pendent variable. The case-only approach has some ap-parent advantages over conventional time-series methodsin assessing the interaction between a time-dependentvariable and a time-fixed factor, such as practical simplifi-cation of modeling and reduction of potential time-invariant confounders related to death (e.g., smoking)[31,32]. In previous case-only studies, a dummy variable(e.g., an indicator of extreme temperature) or a linear termof temperature was included in the model [32,33]. How-ever, the interaction between temperature and individualcharacteristics may be non-linear since the main effectof temperature on mortality is typically non-linear[4,8,27,34]. In the present study, we applied the distrib-uted lag non-linear model to the case-only approach,which can be more flexible to determine whether
Table 1 Descriptive statistics of daily weather conditions and
Variables Minimum Maximum 25th percenti
Daily meteorological measures
Maximum temperature(°C) 7.2 39.1 23.4
Mean temperature(°C) 6.3 34.2 18.6
Minimum temperature(°C) 2.1 30.4 15.3
Relative humidity (%) 20.0 97.0 64.0
Atmospheric pressure(hPa) 988.7 1027.2 1003.4
Daily concentrations of pollutants
PM10(μg/m3) 7.0 370.1 52.1
NO2(μg/m3) 24.7 281.3 48.0
SO2(μg/m3) 6.1 237.3 29.3
Daily number of deaths
Non-accidental mortality 32 233 52
Cardiovascular mortality 6 102 19
Respiratory mortality 2 46 8
All other mortality 8 85 22
individual characteristics modify the non-linear effect oftemperature. The seasonal pattern of mortality wascaptured by including a sin and cosine term with a365.24-day period in the model [32,33].All statistical analyses and modeling were completed
in R version 2.13.1 [35].
ResultsDuring the study period from January 1, 2003 to Decem-ber 31, 2007, average daily maximum temperature was27.6°C, mean temperature 23.0°C, minimum temperature19.8°C in Guangzhou. The 1st, 10th, 90th and 99th per-centile of daily mean temperatures was 8.2°C, 13.8°C, 29.9°C and 32.0°C, respectively. The mean concentrations ofPM10, NO2 and SO2 were 88.2 μg/m3, 73.2 μg/m3 and59.3 μg/m3, respectively. Among the total of 112,280 non-accidental deaths, 43,393 persons (38.7%) died from car-diovascular diseases and 21,071 (18.8%) from respiratorydiseases. The descriptive statistics of daily number ofdeaths can be found in Table 1.The distributed non-linear lag surface revealed a non-
linear relationship between temperature and mortality,with higher mortality risk at hot and cold temperatures(Figure 1). Figure 2 shows lag structures of temperatureeffect over the same day to 25 days previous. Weobserved immediate effects of cold and hot temperatureson mortality with the strongest and statistically signifi-cant effects on the current day (lag 0). Hot effects usu-ally disappeared after approximately 4–5 days. Coldeffects could persist for 10–12 days. The initial increasein mortality risk related to hot temperatures was fol-lowed by a decrease, consistent with short-term mortal-ity displacement (i.e., harvesting), while no apparentharvesting was found for cold effects (Figure 2).
mortality from 2003 to 2007 in Guangzhou, China
le Median 75th percentile Mean Standard Deviation
28.8 32.6 27.6 6.2
24.4 28.0 23.0 6.1
21.1 25.0 19.8 6.2
72.0 80.0 80.0 12.9
1008.5 1014.0 1008.7 6.8
80.0 114.6 88.2 48.5
65.8 89.9 73.2 34.0
49.7 80.3 59.3 39.6
59 69 62 13.6
23 28 24 7.4
11 14 12 4.5
26 30 26 6.1

Figure 1 Relative risks of mortality categories by daily mean temperature(°C) and days of lag. The reference value was mediantemperature (24.4°C).
Yang et al. Environmental Health 2012, 11:63 Page 4 of 9http://www.ehjournal.net/content/11/1/63
Based on the lag structures of hot and cold effects, wepresented cumulative effects of hot temperatures at lag0–5 days and cumulative cold effects at lag 0–12 days.The dose–response curve showed that both cold andhot effects seemed to be non-linear for some mortalitycategories (Figure 3). Therefore, we estimated relativeeffects of temperatures based on specific portions of thecurve. Hot temperatures were associated with a 15.46%(95% confidence interval: 10.05% to 20.87%) increase innon-accidental mortality risk comparing the 99th to the90th percentile of daily mean temperatures. Cold tem-peratures were associated with a 20.39% (11.78% to29.01%) increase in non-accidental mortality comparingthe first to the 10th percentile of temperatures. Strongerassociation was found with mortality due to cardiovascu-lar and respiratory diseases, particularly with mortalitydue to ischemic heart diseases. Positive but non-significant effects of cold and hot temperatures werefound for all other mortality (Table 2).To explore the potential confounding of air pollution,
we performed a sensitivity analysis with adding one airpollution variable at a time or excluding all pollution
variables from the model. There was only slight changein the estimate of temperature effect compared to themodel controlling for three air pollution variables to-gether (see Additional file 2), indicating that the con-founding by air pollution was very small if there is any.We evaluated the effects of temperatures on non-
accidental mortality for subpopulations (Table 3) andfurther examined the statistical significance of effectmodification by individual characteristics (Table 4). Hoteffects were significantly larger for females than males.By contrary, males were at higher risk of cold effectscompared to females but the difference was non-signifi-cant. The point estimates of temperature effects gener-ally increased with age. There was statistically significantdifference between the oldest age group (≥85 years old)and the youngest age group (<65 years old). A trend ofdecreased temperature-related mortality risk withincreased education level was observed. No educationconferred significant susceptibility. As to occupationclass, blue-collar workers suffered more from hot andcold effects compared to white-collar worker, and thedifference were statistically significant.

Figure 2 The effect of mean temperature(°C) on mortality categories along days of lag. The black lines are relative risks of mortalitycomparing the first to the 10th percentile (cold effect) and the 99th to the 90th percentile (hot effect) of temperatures, and grey regions are 95%confidence intervals.
Yang et al. Environmental Health 2012, 11:63 Page 5 of 9http://www.ehjournal.net/content/11/1/63
DiscussionTo quantify mortality effects of ambient temperature, lin-ear threshold regression models were often used previ-ously, which assumed linear or log-linear increase belowand above the threshold. In fact, the dose–response curveof temperature and mortality is hardly linear below orabove the threshold, so it is inappropriate to use linearthreshold models to estimate the effects directly. RecentlyGasparrini and Armstrong first rigorously developedDLNMs [27,28]. With unifying many of the previousmethods in one unique framework, DLNMs are flexibleenough to describe non-linear dependencies and delayedeffects of exposure at the same time. Gasparrini et al. [27]speculated in their article that the DLNMs could be easilytranslated in other study design and regression models. Inthe present study, we fitted DLMNs to fully understandthe dose–response function and lag effects of temperature.Furthermore, we applied DLNMs to the case-only ap-proach. This allows sophisticated non-linear and delayedeffect modification to be estimated and tested statistically.
We found significant impacts of hot and cold tempera-tures on mortality in Guangzhou, China. Hot tempera-tures had an acute but short-term effect, whereas theeffect of cold temperatures lasted 10–12 days. Similarlag structures with characteristics of short term for hoteffects and long duration for cold effects were observedin England [28], US [17,27] and Canada [29]. This find-ing suggests that a longer timeframe are required to cap-ture the cold impact, and that it may be inappropriate tospecify a priori identical timeframe for cold and hot ex-posure. Guo et al. [13] stated that use of short lags mayunderestimate cold effects, but it may overestimate hoteffects. In the present study, we estimated the effects ofhot and cold temperatures for two different lag periods.Some evidence in the literature shows that the magnitude
of temperature effects varied by climate and population.Notably, we found a significant cold effect with a 20.39%increase in mortality risk comparing 8.2°C to 13.8°C. Ananalysis in the subtropical region of Chiang Mai, Thailandreported a similar cold effect with a 19% increase of

Figure 3 The dose–response curve of daily mortality and mean temperature (°C) over lag 0–5 and lag 0–12 days. The reference valuewas median temperature (24.4°C).
Yang et al. Environmental Health 2012, 11:63 Page 6 of 9http://www.ehjournal.net/content/11/1/63
mortality risk over lag 0–13 days comparing 19.35°C to24.7°C [14]. Multi-city studies reported a higher risk ofmortality associated with cold exposure in regions havingmilder winter climates [4,34]. Thus, the public perceptionthat hot regions do not suffer from cold weather is com-pletely mistaken. Our findings highlight a need tostrengthen the awareness of combating cold exposure inthe public.
Table 2 Percentage increase (%) in mortality risk associated w
Cause Ho
(95
Non-accidental 15
Cardiovascular diseases 20
Ischemic heart disease 30
Stroke 15
Respiratory diseases 29
Chronic obstructive pulmonary diseases 21
All other causes 5
* The effects were presented by percentage increase (%) in mortality risk comparinpercentile (cold effect) of temperatures.
By analyzing in subgroups, many studies have found thatthe elderly were at higher risk of mortality associated withcold [4,10] or hot temperatures [4,10,19]. It may be due totheir poorer physiological adaptation to changes in ambi-ent temperatures. Our findings confirmed vulnerability ofthe elderly. An interesting finding is that females weremore susceptible to hot but not cold temperatures com-pared to males, which is in agreement with the results in
ith hot and cold temperatures by causes
t effect* Cold effect*
%CI) (95%CI)
.46(10.05 to 20.87) 20.39(11.78 to 29.01)
.89(12.24 to 29.54) 23.59(11.33 to 35.85)
.01(12.98 to 47.04) 20.95(0.53 to 41.39)
.21(1.39 to 29.03) 11.77(−8.29 to 31.83)
.82(17.01 to 42.64) 34.82(16.89 to 52.75)
.38(5.56 to 37.20) 25.06(5.07 to 45.04)
.57(−1.43 to 12.57) 10.41(−5.02 to 25.82)
g the 99th to the 90th percentile (hot effect) and the first to the 10th

Table 3 Hot and cold effect by sex, age, educationalattainment and occupation class
Variable Hot effect* Cold effect*
(95%CI) (95%CI)
Sex
Male 8.05(1.82 to 14.28) 31.21(20.19 to 42.23)
Female 24.92(16.61 to 33.23) 16.53(4.79 to 28.27)
Age (years)
0-64 2.04(−6.02 to 10.11) 8.49(−5.78 to 22.75)
65-74 10.40(0.68 to 20.12) 26.52(12.70 to 40.33)
75-84 13.75(4.83 to 22.67) 23.61(8.27 to 38.95)
85+ 17.33(6.05 to 29.82) 28.62(10.71 to 46.53)
Educational attainment
No education 25.03(11.81 to 38.25) 30.16(8.65 to 51.67)
Primary school 16.94(9.51 to 24.87) 15.91(2.11 to 29.71)
High school or above 5.40(−2.44 to 13.24) 13.80(5.55 to 22.21)
Occupation class
White-Collar 11.59(−1.56 to 24.74) 16.27(−6.02 to 38.57)
Blue-Collar 18.34(6.65 to 31.31) 35.65(21.81 to 49.48)
Unemployed 17.25(9.31 to 25.78) 8.37(−9.61 to 26.32)
* The effects were presented by percentage increase (%) in mortality riskcomparing the 99th to the 90th percentile (hot effect) and the first to the 10thpercentile (cold effect) of temperatures.
Yang et al. Environmental Health 2012, 11:63 Page 7 of 9http://www.ehjournal.net/content/11/1/63
US [33], Europe [18,36] and Korea [37]. Gender differencemay be dependent on location and population. For ex-ample, the impact of hot temperature on mortality washigher for women in Mexico, but higher for men in SaoPaulo [7].Greater effects of ambient temperatures were observed
for those with less education in the United States [19],Latin American [7], Korea [20,37] as well as in Shanghai,China [38]. However, no effect of education level on
Table 4 Modification by individual characteristics of tempera
Factors
Sex Male(Reference group)
Female
Age 0-64 years(Reference group)
65-74 years
75-84 years
85 years or above
Education None (reference group)
Primary education
Secondary or higher education
Occupation White collar (reference group)
Blue collar workers
Unemployed
Odds ratio (OR) larger than 1 indicates positive effect modification, that is, the increpersons who had this characteristic compared to the reference group.
temperature-related mortality risk was found in California[23] and Australia [24]. Moreover, all previous findingswere based on stratified analysis and it remains uncertainwhether effect modification by education was statisticallysignificant or not. In the present study, educational attain-ment was classified into three groups. Subjects with noeducation were significantly more susceptible to theeffects of both hot and cold temperatures compared toother education groups. Additionally, to our knowledge,this is the first study to examine the potential effect modi-fication by occupation class. We found that blue-collarworkers were at significantly higher risk of temperature-related mortality than white-collar workers.When analyzing by cause of death, effect estimates
were markedly higher for cardiovascular and respiratorydeaths compared to all non-accidental deaths, consistentwith previous studies [5,13,17]. From a public healthpoint of views, this finding is important since cardio-respiratory diseases are the leading cause of death inGuangzhou, accounting for 58% of all registered deathsduring the study period. This increase in mortality islikely related to the failure in thermoregulation and thephysiological changes in circulatory system [39].Some limitations should be mentioned. Firstly, the
data are only from one city, so it should be cautious togeneralize the findings to other geographic areas andother climates. Secondly, we considered several majormortality categories but not very fine categories. Not-ably, as in all time-series studies on temperature effects,we assigned each individual the same exposure levelmeasured by ambient daily mean temperature, whichwould bring about measurement errors because indoortemperature may be not closely correlated with outdoortemperature due to the use of air condition. Lastly,
ture effects using the case-only approach
Hot effect modification Cold effect modification
OR(95%CI) OR(95%CI)
_ _
1.192(1.134 to 1.253) 0.951(0.838 to 1.064))
_ _
1.083(1.006 to 1.161) 1.075(0.891 to 1.259)
1.103(1.008 to 1.198) 1.069(0.857 to 1.319)
1.195(1.099 to 1.298) 1.187(1.068 to 1.306)
_ _
0.933(0.867 to 1.005) 0.903(0.757 to 1.049)
0.862(0.797 to 0.931) 0.849(0.702 to 0.996)
_ _
1.095(1.027 to 1.163) 1.104(1.043 to1.166)
1.080 (0.912 to 1.246) 0.953(0.748 to 1.158)
ased risk of mortality associated with hot or cold temperatures was larger for
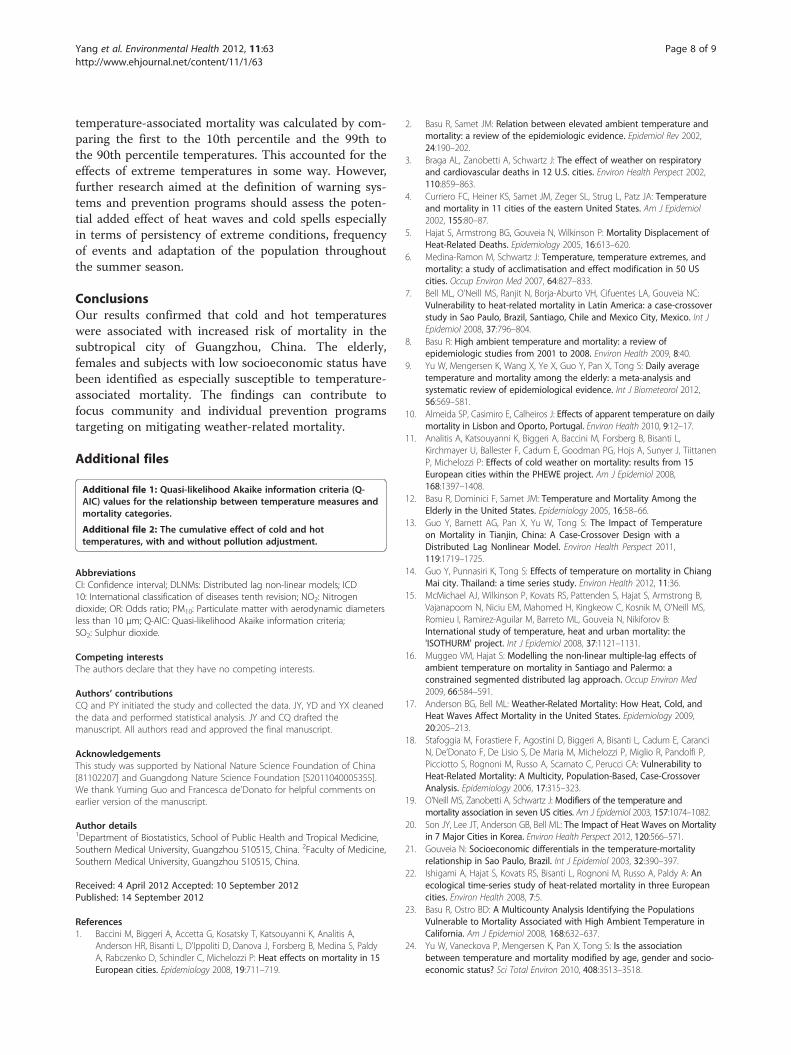
Yang et al. Environmental Health 2012, 11:63 Page 8 of 9http://www.ehjournal.net/content/11/1/63
temperature-associated mortality was calculated by com-paring the first to the 10th percentile and the 99th tothe 90th percentile temperatures. This accounted for theeffects of extreme temperatures in some way. However,further research aimed at the definition of warning sys-tems and prevention programs should assess the poten-tial added effect of heat waves and cold spells especiallyin terms of persistency of extreme conditions, frequencyof events and adaptation of the population throughoutthe summer season.
ConclusionsOur results confirmed that cold and hot temperatureswere associated with increased risk of mortality in thesubtropical city of Guangzhou, China. The elderly,females and subjects with low socioeconomic status havebeen identified as especially susceptible to temperature-associated mortality. The findings can contribute tofocus community and individual prevention programstargeting on mitigating weather-related mortality.
Additional files
Additional file 1: Quasi-likelihood Akaike information criteria (Q-AIC) values for the relationship between temperature measures andmortality categories.
Additional file 2: The cumulative effect of cold and hottemperatures, with and without pollution adjustment.
AbbreviationsCI: Confidence interval; DLNMs: Distributed lag non-linear models; ICD10: International classification of diseases tenth revision; NO2: Nitrogendioxide; OR: Odds ratio; PM10: Particulate matter with aerodynamic diametersless than 10 μm; Q-AIC: Quasi-likelihood Akaike information criteria;SO2: Sulphur dioxide.
Competing interestsThe authors declare that they have no competing interests.
Authors’ contributionsCQ and PY initiated the study and collected the data. JY, YD and YX cleanedthe data and performed statistical analysis. JY and CQ drafted themanuscript. All authors read and approved the final manuscript.
AcknowledgementsThis study was supported by National Nature Science Foundation of China[81102207] and Guangdong Nature Science Foundation [S2011040005355].We thank Yuming Guo and Francesca de’Donato for helpful comments onearlier version of the manuscript.
Author details1Department of Biostatistics, School of Public Health and Tropical Medicine,Southern Medical University, Guangzhou 510515, China. 2Faculty of Medicine,Southern Medical University, Guangzhou 510515, China.
Received: 4 April 2012 Accepted: 10 September 2012Published: 14 September 2012
References1. Baccini M, Biggeri A, Accetta G, Kosatsky T, Katsouyanni K, Analitis A,
Anderson HR, Bisanti L, D'Ippoliti D, Danova J, Forsberg B, Medina S, PaldyA, Rabczenko D, Schindler C, Michelozzi P: Heat effects on mortality in 15European cities. Epidemiology 2008, 19:711–719.
2. Basu R, Samet JM: Relation between elevated ambient temperature andmortality: a review of the epidemiologic evidence. Epidemiol Rev 2002,24:190–202.
3. Braga AL, Zanobetti A, Schwartz J: The effect of weather on respiratoryand cardiovascular deaths in 12 U.S. cities. Environ Health Perspect 2002,110:859–863.
4. Curriero FC, Heiner KS, Samet JM, Zeger SL, Strug L, Patz JA: Temperatureand mortality in 11 cities of the eastern United States. Am J Epidemiol2002, 155:80–87.
5. Hajat S, Armstrong BG, Gouveia N, Wilkinson P: Mortality Displacement ofHeat-Related Deaths. Epidemiology 2005, 16:613–620.
6. Medina-Ramon M, Schwartz J: Temperature, temperature extremes, andmortality: a study of acclimatisation and effect modification in 50 UScities. Occup Environ Med 2007, 64:827–833.
7. Bell ML, O'Neill MS, Ranjit N, Borja-Aburto VH, Cifuentes LA, Gouveia NC:Vulnerability to heat-related mortality in Latin America: a case-crossoverstudy in Sao Paulo, Brazil, Santiago, Chile and Mexico City, Mexico. Int JEpidemiol 2008, 37:796–804.
8. Basu R: High ambient temperature and mortality: a review ofepidemiologic studies from 2001 to 2008. Environ Health 2009, 8:40.
9. Yu W, Mengersen K, Wang X, Ye X, Guo Y, Pan X, Tong S: Daily averagetemperature and mortality among the elderly: a meta-analysis andsystematic review of epidemiological evidence. Int J Biometeorol 2012,56:569–581.
10. Almeida SP, Casimiro E, Calheiros J: Effects of apparent temperature on dailymortality in Lisbon and Oporto, Portugal. Environ Health 2010, 9:12–17.
11. Analitis A, Katsouyanni K, Biggeri A, Baccini M, Forsberg B, Bisanti L,Kirchmayer U, Ballester F, Cadum E, Goodman PG, Hojs A, Sunyer J, TiittanenP, Michelozzi P: Effects of cold weather on mortality: results from 15European cities within the PHEWE project. Am J Epidemiol 2008,168:1397–1408.
12. Basu R, Dominici F, Samet JM: Temperature and Mortality Among theElderly in the United States. Epidemiology 2005, 16:58–66.
13. Guo Y, Barnett AG, Pan X, Yu W, Tong S: The Impact of Temperatureon Mortality in Tianjin, China: A Case-Crossover Design with aDistributed Lag Nonlinear Model. Environ Health Perspect 2011,119:1719–1725.
14. Guo Y, Punnasiri K, Tong S: Effects of temperature on mortality in ChiangMai city. Thailand: a time series study. Environ Health 2012, 11:36.
15. McMichael AJ, Wilkinson P, Kovats RS, Pattenden S, Hajat S, Armstrong B,Vajanapoom N, Niciu EM, Mahomed H, Kingkeow C, Kosnik M, O’Neill MS,Romieu I, Ramirez-Aguilar M, Barreto ML, Gouveia N, Nikiforov B:International study of temperature, heat and urban mortality: the'ISOTHURM' project. Int J Epidemiol 2008, 37:1121–1131.
16. Muggeo VM, Hajat S: Modelling the non-linear multiple-lag effects ofambient temperature on mortality in Santiago and Palermo: aconstrained segmented distributed lag approach. Occup Environ Med2009, 66:584–591.
17. Anderson BG, Bell ML: Weather-Related Mortality: How Heat, Cold, andHeat Waves Affect Mortality in the United States. Epidemiology 2009,20:205–213.
18. Stafoggia M, Forastiere F, Agostini D, Biggeri A, Bisanti L, Cadum E, CaranciN, De’Donato F, De Lisio S, De Maria M, Michelozzi P, Miglio R, Pandolfi P,Picciotto S, Rognoni M, Russo A, Scarnato C, Perucci CA: Vulnerability toHeat-Related Mortality: A Multicity, Population-Based, Case-CrossoverAnalysis. Epidemiology 2006, 17:315–323.
19. O'Neill MS, Zanobetti A, Schwartz J: Modifiers of the temperature andmortality association in seven US cities. Am J Epidemiol 2003, 157:1074–1082.
20. Son JY, Lee JT, Anderson GB, Bell ML: The Impact of Heat Waves on Mortalityin 7 Major Cities in Korea. Environ Health Perspect 2012, 120:566–571.
21. Gouveia N: Socioeconomic differentials in the temperature-mortalityrelationship in Sao Paulo, Brazil. Int J Epidemiol 2003, 32:390–397.
22. Ishigami A, Hajat S, Kovats RS, Bisanti L, Rognoni M, Russo A, Paldy A: Anecological time-series study of heat-related mortality in three Europeancities. Environ Health 2008, 7:5.
23. Basu R, Ostro BD: A Multicounty Analysis Identifying the PopulationsVulnerable to Mortality Associated with High Ambient Temperature inCalifornia. Am J Epidemiol 2008, 168:632–637.
24. Yu W, Vaneckova P, Mengersen K, Pan X, Tong S: Is the associationbetween temperature and mortality modified by age, gender and socio-economic status? Sci Total Environ 2010, 408:3513–3518.

Yang et al. Environmental Health 2012, 11:63 Page 9 of 9http://www.ehjournal.net/content/11/1/63
25. China Metrorological Adminstration: China Meteorological Data Sharing ServiceSystem. Available at: http://cdc.cma.gov.cn/ (accessed on 12 July 2012).
26. Wong CM, Vichit-Vadakan N, Kan H, Qian Z: Public Health and Air Pollutionin Asia (PAPA): a multicity study of short-term effects of air pollution onmortality. Environ Health Perspect 2008, 116:1195–1202.
27. Gasparrini A, Armstrong B, Kenward MG: Distributed lag non-linearmodels. Stat Med 2010, 29:2224–2234.
28. Armstrong B: Models for the relationship between ambient temperatureand daily mortality. Epidemiology 2006, 17:624–631.
29. Martin SL, Cakmak S, Hebbern CA, Avramescu M-L, Tremblay N: Climatechange and future temperature-related mortality in 15 Canadian cities.Int J Biometeorol 2012, 56:605–619.
30. Peng RD, Dominici F, Louis TA: Model choice in time series studies of airpollution and mortality. J R Stat Soc [Ser A] 2006, 169:179–203.
31. Armstrong BG: Fixed factors that modify the effects of time-varyingfactors: applying the case-only approach. Epidemiology 2003, 14:467–472.
32. Schwartz J: Who is sensitive to extremes of temperature? A case-onlyanalysis. Epidemiology 2005, 16:67–72.
33. Medina-Ramón M, Zanobetti A, Cavanagh DP, Schwartz J: Extremetemperatures and mortality: assessing effect modification by personalcharacteristics and specific cause of death in a multi-city case-onlyanalysis. Environ Health Perspect 2006, 114:1331–1336.
34. Group TE: Cold exposure and winter mortality from ischaemic heartdisease, cerebrovascular disease, respiratory disease, and all causes inwarm and cold regions of Europe. Lancet 1997, 349:1341–1346.
35. R Development Core Team R: A Language and Environment for StatisticalComputing. Version 2.13.1. http://www.r-project.
36. Hajat S, Kovats RS, Lachowycz K: Heat-related and cold-related deaths inEngland and Wales: who is at risk? Occup Environ Med 2006, 64:93–100.
37. Son JY, Lee JT, Anderson GB, Bell ML: vulnerability to temperature-relatedmortality in Seoul. Korea: Environ Res; in press.
38. Ma W, Yang C, Tan J, Song W, Chen B, Kan H: Modifiers of thetemperature–mortality association in Shanghai, China. Int J Biometeorol2011, 56:205–207.
39. Nixdorf-Miller A, Hunsaker DM, Hunsaker JC: Hypothermia andhyperthermia medicolegal investigation of morbidity and mortality fromexposure to environmental temperature extremes. Arch Pathol Lab Med2006, 130:1297–1304.
doi:10.1186/1476-069X-11-63Cite this article as: Yang et al.: Daily temperature and mortality: a studyof distributed lag non-linear effect and effect modification inGuangzhou. Environmental Health 2012 11:63.
Submit your next manuscript to BioMed Centraland take full advantage of:
• Convenient online submission
• Thorough peer review
• No space constraints or color figure charges
• Immediate publication on acceptance
• Inclusion in PubMed, CAS, Scopus and Google Scholar
• Research which is freely available for redistribution
Submit your manuscript at www.biomedcentral.com/submit