Embed Size (px)
DESCRIPTION
forex
Citation preview
5/11/2014 DailyFX - How the BoJ Action Can Bring Clarity to Gold’s Future
http://www.dailyfx.com/print-article.html?filename=/forex/education/trading_tips/post_of_the_day/2014/11/04/Gold-Inverse-Correlation-to-USDJPY.html 1/3
Tuesday, 04 November 2014 19:00 GMT by Tyler Yell, CMT, Forex Trading Instructor
This copy is for your personal, noncommercial use only. Please click here to print the article.
How the BoJ Action Can Bring Clarity to Gold’s Future
The inverse correlation of USDJPY & XAUUSD provides clarity that traders can benefit from acknowledging.
Talking Points:
What The Bank of Japan’s Move Means for USDJPY
Correlation Analysis – XAUUSD & USDJPY
XAUUSD Outlook
“The tipping point is that magic moment when an idea, trend, or social behavior crosses a threshold,
tips, and spreads like wildfire.”
― Malcolm Gladwell, The Tipping Point: How Little Things Can Make a Big Difference
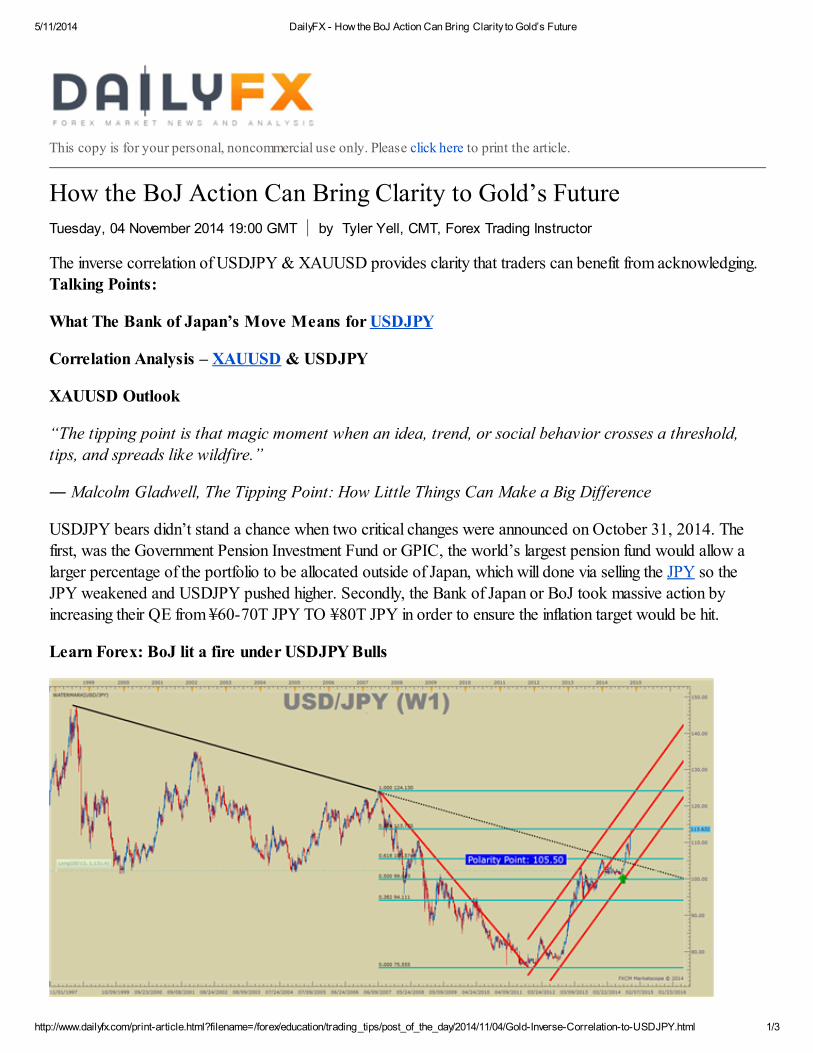
USDJPY bears didn’t stand a chance when two critical changes were announced on October 31, 2014. The
first, was the Government Pension Investment Fund or GPIC, the world’s largest pension fund would allow a
larger percentage of the portfolio to be allocated outside of Japan, which will done via selling the JPY so theJPY weakened and USDJPY pushed higher. Secondly, the Bank of Japan or BoJ took massive action by
increasing their QE from ¥60-70T JPY TO ¥80T JPY in order to ensure the inflation target would be hit.
Learn Forex: BoJ lit a fire under USDJPY Bulls
5/11/2014 DailyFX - How the BoJ Action Can Bring Clarity to Gold’s Future
http://www.dailyfx.com/print-article.html?filename=/forex/education/trading_tips/post_of_the_day/2014/11/04/Gold-Inverse-Correlation-to-USDJPY.html 2/3
Presented by FXCM’s Marketscope Charts
In effect, the BoJ was looking to enact a tipping point so that JPY would weaken in such a way to encourage
inflation. You can see above that the technical of higher USDJPY align with the wishes of the Bank of Japan.
Now that the two forms of analysis align to favor a weaker JPY we notice another pattern of weaker
XAUUSD. Let’s take a deeper look to see what this could mean moving forward.
Correlation Analysis – XAUUSD & USDJPY
The purpose of looking into correlations is to get a clean view on what direction an asset you’re looking to trade
could possibly move. Correlations can be easily applied to all markets but are very clean in the Forex market
because FX underlies all other asset markets as a pricing mechanism. An important note is that correlation does
not equal causation, which means that because things happen together does not mean that one action specifically
causes another action. This mindset is important so that you do not over rely on correlations just like you
shouldn’t over rely on RSI or moving averages.
You can register for a free online course on Moving Averages here.
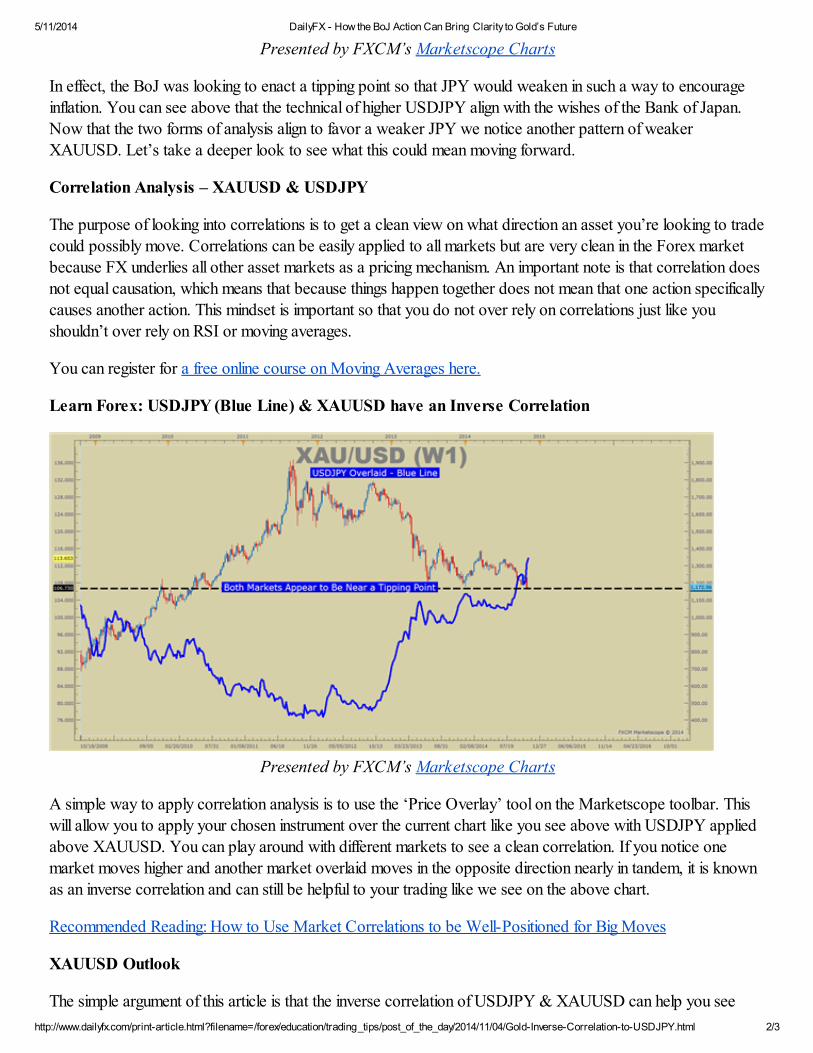
Learn Forex: USDJPY (Blue Line) & XAUUSD have an Inverse Correlation
Presented by FXCM’s Marketscope Charts
A simple way to apply correlation analysis is to use the ‘Price Overlay’ tool on the Marketscope toolbar. This
will allow you to apply your chosen instrument over the current chart like you see above with USDJPY appliedabove XAUUSD. You can play around with different markets to see a clean correlation. If you notice onemarket moves higher and another market overlaid moves in the opposite direction nearly in tandem, it is known
as an inverse correlation and can still be helpful to your trading like we see on the above chart.
Recommended Reading: How to Use Market Correlations to be Well-Positioned for Big Moves
XAUUSD Outlook
The simple argument of this article is that the inverse correlation of USDJPY & XAUUSD can help you see
5/11/2014 DailyFX - How the BoJ Action Can Bring Clarity to Gold’s Future
http://www.dailyfx.com/print-article.html?filename=/forex/education/trading_tips/post_of_the_day/2014/11/04/Gold-Inverse-Correlation-to-USDJPY.html 3/3
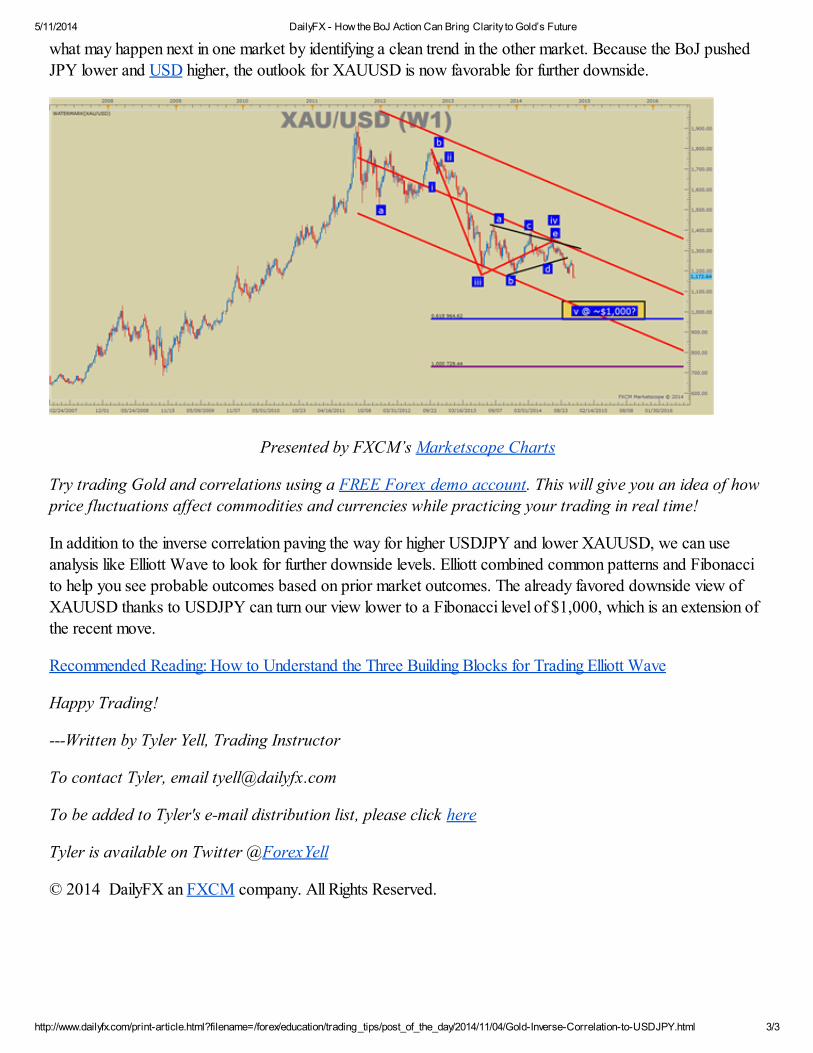
what may happen next in one market by identifying a clean trend in the other market. Because the BoJ pushed
JPY lower and USD higher, the outlook for XAUUSD is now favorable for further downside.
Presented by FXCM’s Marketscope Charts
Try trading Gold and correlations using a FREE Forex demo account. This will give you an idea of how
price fluctuations affect commodities and currencies while practicing your trading in real time!
In addition to the inverse correlation paving the way for higher USDJPY and lower XAUUSD, we can useanalysis like Elliott Wave to look for further downside levels. Elliott combined common patterns and Fibonacci
to help you see probable outcomes based on prior market outcomes. The already favored downside view ofXAUUSD thanks to USDJPY can turn our view lower to a Fibonacci level of $1,000, which is an extension of
the recent move.
Recommended Reading: How to Understand the Three Building Blocks for Trading Elliott Wave
Happy Trading!
---Written by Tyler Yell, Trading Instructor
To contact Tyler, email [email protected]
To be added to Tyler's e-mail distribution list, please click here
Tyler is available on Twitter @ForexYell
© 2014 DailyFX an FXCM company. All Rights Reserved.