Embed Size (px)
Citation preview

Fact Sheet for Q4 and Full Year 2013
February 21, 2014

Contents
Daimler Group
l Stock Market Information 3
l Earnings and Financial Situation 4 - 13
Information for Divisions
l Mercedes-Benz Cars 14 - 17
l Daimler Trucks 18 - 22
l Mercedes-Benz Vans 23 - 25
l Daimler Buses 26 - 27
l Daimler Financial Services 28
2

Stock Market Information
1st Quarter 2nd Quarter 3rd Quarter 4th Quarter Financial Year
2013 2012 2013 2012 2013 2012 2013 2012 Change 2013 2012 Change
Earnings per share (in EUR)*
basic 0.50 1.26 2.65 1.39 1.72 1.06 1.53 2.31 -34% 6.40 6.02 +6%
diluted 0.50 1.26 2.65 1.39 1.72 1.06 1.53 2.31 -34% 6.40 6.02 +6%
Average number of
shares outstanding (in millions)
(adjusted for treasury stocks)
basic 1,067.7 1,066.4 1,068.4 1,066.4 1,069.4 1,067.0 1,069.7 1,067.4 +0% 1,068.8 1,066.8 +0%
diluted 1,068.1 1,067.3 1,068.7 1,066.8 1,069.6 1,067.3 1,069.8 1,067.5 +0% 1,069.1 1,067.1 +0%
. .
Number of shares outstanding 1,067.9 1,066.4 1,069.0 1,066.5 1,069.6 1,067.3 1,069.8 1,067.6 +0%
(at period end, in millions)
Share price Frankfurt 42.45 45.21 46.49 35.35 57.62 37.67 62.90 41.32 +52%
(at period end, in EUR)
Market capitalization Frankfurt 45.33 48.21 49.70 37.70 61.63 40.20 67.29 44.11 +53%
(at period end, in billions of EUR)
* The 2012 figures have been adjusted, primarily for effects arising from application of the amended version of IAS 19.
3
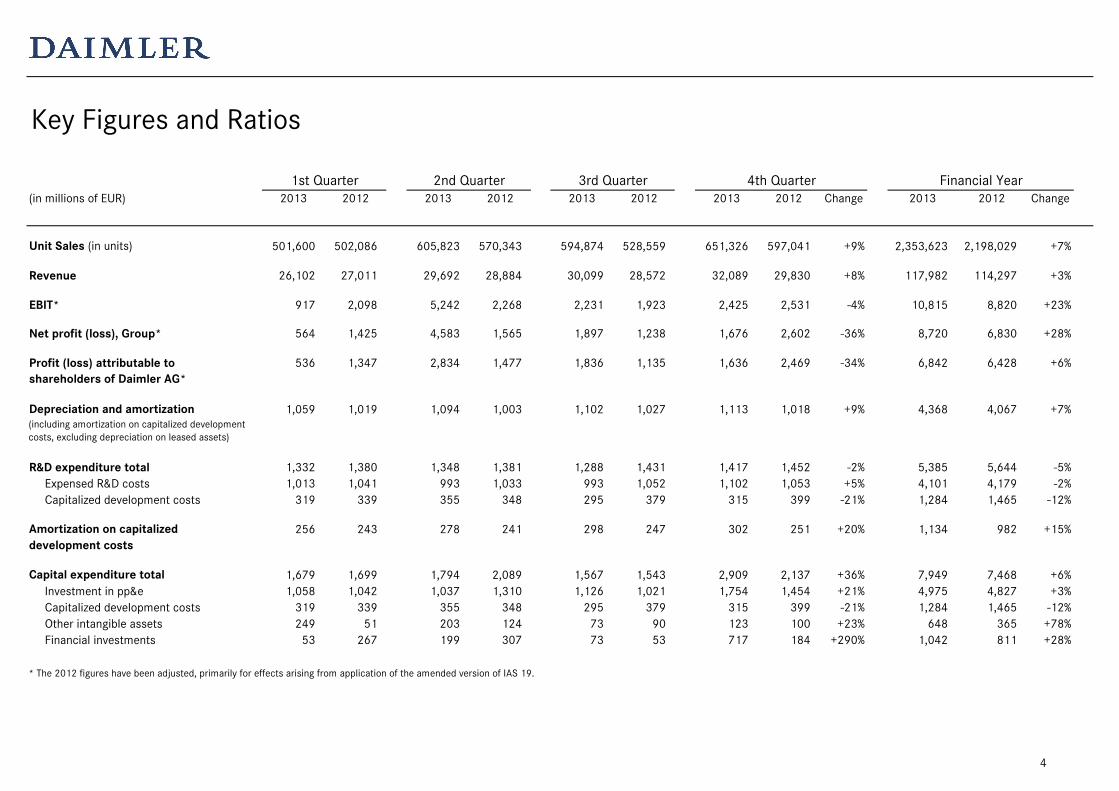
Key Figures and Ratios
1st Quarter 2nd Quarter 3rd Quarter 4th Quarter Financial Year
(in millions of EUR) 2013 2012 2013 2012 2013 2012 2013 2012 Change 2013 2012 Change
Unit Sales (in units) 501,600 502,086 605,823 570,343 594,874 528,559 651,326 597,041 +9% 2,353,623 2,198,029 +7%
Revenue 26,102 27,011 29,692 28,884 30,099 28,572 32,089 29,830 +8% 117,982 114,297 +3%
EBIT* 917 2,098 5,242 2,268 2,231 1,923 2,425 2,531 -4% 10,815 8,820 +23%
Net profit (loss), Group* 564 1,425 4,583 1,565 1,897 1,238 1,676 2,602 -36% 8,720 6,830 +28%
Profit (loss) attributable to 536 1,347 2,834 1,477 1,836 1,135 1,636 2,469 -34% 6,842 6,428 +6%
shareholders of Daimler AG*
Depreciation and amortization 1,059 1,019 1,094 1,003 1,102 1,027 1,113 1,018 +9% 4,368 4,067 +7%
R&D expenditure total 1,332 1,380 1,348 1,381 1,288 1,431 1,417 1,452 -2% 5,385 5,644 -5%
Expensed R&D costs 1,013 1,041 993 1,033 993 1,052 1,102 1,053 +5% 4,101 4,179 -2%
Capitalized development costs 319 339 355 348 295 379 315 399 -21% 1,284 1,465 -12%
Amortization on capitalized 256 243 278 241 298 247 302 251 +20% 1,134 982 +15%
development costs
Capital expenditure total 1,679 1,699 1,794 2,089 1,567 1,543 2,909 2,137 +36% 7,949 7,468 +6%
Investment in pp&e 1,058 1,042 1,037 1,310 1,126 1,021 1,754 1,454 +21% 4,975 4,827 +3%
Capitalized development costs 319 339 355 348 295 379 315 399 -21% 1,284 1,465 -12%
Other intangible assets 249 51 203 124 73 90 123 100 +23% 648 365 +78%
Financial investments 53 267 199 307 73 53 717 184 +290% 1,042 811 +28%
* The 2012 figures have been adjusted, primarily for effects arising from application of the amended version of IAS 19.
(including amortization on capitalized development
costs, excluding depreciation on leased assets)
4

Free Cash Flow and Net Liquidity of the Industrial Business
1st Quarter 2nd Quarter 3rd Quarter 4th Quarter Financial Year
(in millions of EUR) 2013 2012 2013 2012 2013 2012 2013 2012 Change 2013 2012 Change
Net liquidity
at the beginning of the period 11,508 11,981 10,019 10,093 11,326 8,438 12,577 8,207 +53% 11,508 11,981 -4%
Free cash flow -1,152 -1,977 3,454 1,005 1,577 -209 963 2,633 -63% 4,842 1,452 +233%
thereof: working capital* -447 -1,998 -177 758 -42 -786 36 1,252 -97% -630 -774 .
Other -337 89 -2,147 -2,660 -326 -22 294 668 -56% -2,516 -1,925 .
thereof: dividends Daimler AG 0 0 -2,349 -2,346 0 0 0 0 . -2,349 -2,346 .
Net liquidity
at the end of the period 10,019 10,093 11,326 8,438 12,577 8,207 13,834 11,508 +20% 13,834 11,508 +20%
* Inventories, trade receivables and trade payables
1) 1)
5

Liquidity
1st Quarter 2nd Quarter 3rd Quarter 4th Quarter End of
(in millions of EUR) 2013 2012 2013 2012 2013 2012 2013 2012 Change 2013 2012 Change
Group liquidity
Cash and cash equivalents 11,355 11,837 11,607 12,094 10,615 12,279 11,053 10,996 +1% 11,053 10,996 +1%
Marketable securities and term deposits 6,331 1,723 7,263 2,504 7,219 4,023 7,066 5,598 +26% 7,066 5,598 +26%
Gross liquidity 17,686 13,560 18,870 14,598 17,834 16,302 18,119 16,594 +9% 18,119 16,594 +9%
Financing liabilities (nominal) -78,512 -65,507 -78,262 -72,367 -76,239 -75,591 -77,741 -75,586 . -77,741 -75,586 .
Net debt -60,826 -51,947 -59,392 -57,769 -58,405 -59,289 -59,622 -58,992 . -59,622 -58,992 .
Liquidity of the industrial business
Cash and cash equivalents 10,348 10,862 10,691 11,081 9,862 11,057 9,845 9,887 -0% 9,845 9,887 -0%
Marketable securities and term deposits 4,284 559 5,452 811 5,523 2,305 5,303 3,841 +38% 5,303 3,841 +38%
Gross liquidity 14,632 11,421 16,143 11,892 15,385 13,362 15,148 13,728 +10% 15,148 13,728 +10%
Financing liabilities (nominal) -4,613 -1,328 -4,817 -3,454 -2,808 -5,155 -1,314 -2,220 . -1,314 -2,220 .
Net liquidity 10,019 10,093 11,326 8,438 12,577 8,207 13,834 11,508 +20% 13,834 11,508 +20%
6

Pension and Health-Care Benefits*
1st Quarter 2nd Quarter 3rd Quarter 4th Quarter End of
(in billions of EUR) 2013 2012 2013 2012 2013 2012 2013 2012 Change 2013 2012 Change
Pension benefits
Benefit obligations -24.0 -19.8 -23.5 -20.2 -23.6 -22.2 -23.2 -23.9 . -23.2 -23.9 .
Plan assets 14.3 12.9 13.9 12.9 14.1 13.3 14.6 14.2 +3% 14.6 14.2 +3%
Funded status -9.7 -6.9 -9.6 -7.3 -9.5 -8.9 -8.6 -9.7 . -8.6 -9.7 .
Health-care benefits
Benefit obligations -1.5 -1.3 -1.4 -1.4 -1.3 -1.4 -1.2 -1.5 . -1.2 -1.5 .
Plan assets 0.0 0.0 0.0 0.0 0.0 0.0 0.0 0.0 . 0.0 0.0 .
Reimbursement Medicare Act 0.2 0.1 0.1 0.1 0.1 0.1 0.1 0.2 -50% 0.1 0.2 -50%
Funded status -1.3 -1.2 -1.3 -1.3 -1.2 -1.3 -1.1 -1.3 . -1.1 -1.3 .
* The 2012 figures have been adjusted, primarily for effects arising from application of the amended version of IAS 19.
7

Unit Sales
1st Quarter 2nd Quarter 3rd Quarter 4th Quarter Financial Year
(in units) 2013 2012 2013 2012 2013 2012 2013 2012 Change 2013 2012 Change
Mercedes-Benz Cars 341,511 338,303 404,711 370,384 395,446 345,418 423,895 397,464 +7% 1,565,563 1,451,569 +8%
Daimler Trucks 101,433 107,664 123,763 122,217 124,465 119,142 134,550 112,931 +19% 484,211 461,954 +5%
Mercedes-Benz Vans 52,623 51,223 69,436 69,324 65,314 55,742 82,771 76,129 +9% 270,144 252,418 +7%
Daimler Buses 6,033 4,896 7,913 8,418 9,649 8,257 10,110 10,517 -4% 33,705 32,088 +5%
Daimler Group 501,600 502,086 605,823 570,343 594,874 528,559 651,326 597,041 +9% 2,353,623 2,198,029 +7%
8

Production Volume
1st Quarter 2nd Quarter 3rd Quarter 4th Quarter Financial Year
(in units) 2013 2012 2013 2012 2013 2012 2013 2012 Change 2013 2012 Change
Mercedes-Benz Cars 374,041 364,009 412,009 355,578 391,934 367,199 410,674 368,864 +11% 1,588,658 1,455,650 +9%
Daimler Trucks 111,150 114,563 127,401 120,914 128,289 118,892 123,440 96,253 +28% 490,280 450,622 +9%
Mercedes-Benz Vans 63,169 62,974 72,811 67,795 62,843 55,159 71,852 71,568 +0% 270,675 257,496 +5%
Daimler Buses 7,358 6,370 9,269 7,872 9,488 9,207 8,352 7,935 +5% 34,467 31,384 +10%
Daimler Group 555,718 547,916 621,490 552,159 592,554 550,457 614,318 544,620 +13% 2,384,080 2,195,152 +9%
9

Revenue
1st Quarter 2nd Quarter 3rd Quarter 4th Quarter Financial Year
(in millions of EUR) 2013 2012 2013 2012 2013 2012 2013 2012 Change 2013 2012 Change
Mercedes-Benz Cars 14,110 14,937 16,324 15,364 16,521 15,238 17,352 16,121 +8% 64,307 61,660 +4%
Daimler Trucks 7,024 7,383 7,965 8,129 7,982 8,095 8,502 7,782 +9% 31,473 31,389 +0%
Mercedes-Benz Vans 1,986 2,088 2,434 2,420 2,253 2,084 2,696 2,478 +9% 9,369 9,070 +3%
Daimler Buses 751 730 934 1,016 1,127 951 1,293 1,232 +5% 4,105 3,929 +4%
Daimler Financial Services 3,577 3,140 3,548 3,260 3,657 3,524 3,740 3,626 +3% 14,522 13,550 +7%
Reconciliation -1,346 -1,267 -1,513 -1,305 -1,441 -1,320 -1,494 -1,409 . -5,794 -5,301 .
Daimler Group 26,102 27,011 29,692 28,884 30,099 28,572 32,089 29,830 +8% 117,982 114,297 +3%
10

Earnings Before Interest and Taxes (EBIT) and Return on Sales (RoS)*
1st Quarter 2nd Quarter 3rd Quarter 4th Quarter Financial Year
(EBIT in millions of EUR, RoS in %) 2013 2012 2013 2012 2013 2012 2013 2012 Change 2013 2012 Change
Mercedes-Benz Cars
EBIT 460 1,230 1,041 1,337 1,200 973 1,305 851 +53% 4,006 4,391 -9%
RoS 3.3% 8.2% 6.4% 8.7% 7.3% 6.4% 7.5% 5.3% . 6.2% 7.1% .
Daimler Trucks
EBIT 116 376 434 524 522 501 565 294 +92% 1,637 1,695 -3%
RoS 1.7% 5.1% 5.4% 6.4% 6.5% 6.2% 6.6% 3.8% . 5.2% 5.4% .
Mercedes-Benz Vans
EBIT 81 167 204 200 152 75 194 101 +92% 631 543 +16%
RoS 4.1% 8.0% 8.4% 8.3% 6.7% 3.6% 7.2% 4.1% . 6.7% 6.0% .
Daimler Buses
EBIT -31 -105 27 -59 59 -36 69 -21 . 124 -221 .
RoS -4.1% -14.4% 2.9% -5.8% 5.2% -3.8% 5.3% -1.7% . 3.0% -5.6% .
Daimler Financial Services
EBIT 314 344 319 338 322 322 313 289 +8% 1,268 1,293 -2%
Return on equity (RoE) 19.6% 25.2% 19.1% 23.5% 19.3% 21.2% 18.8% 18.7% . 19.2% 22.0% .
Reconciliation -23 86 3,217 -72 -24 88 -21 1,017 . 3,149 1,119 +181%
thereof: share of result of EADS 34 133 3,209 17 13 105 1 969 -100% 3,257 1,224 +166%
Daimler Group 917 2,098 5,242 2,268 2,231 1,923 2,425 2,531 -4% 10,815 8,820 +23%
* The 2012 figures have been adjusted, primarily for effects arising from application of the amended version of IAS 19.
** thereof gain on the sale of EADS shares: 913 million EUR.
**
11

EBIT and RoS from Ongoing Business*
1st Quarter 2nd Quarter 3rd Quarter 4th Quarter Financial Year
(EBIT in millions of EUR, RoS in %) 2013 2012 2013 2012 2013 2012 2013 2012 Change 2013 2012 Change
Mercedes-Benz Cars
EBIT 460 1,255 1,084 1,337 1,251 999 1,385 851 +63% 4,180 4,442 -6%
RoS 3.3% 8.4% 6.6% 8.7% 7.6% 6.6% 8.0% 5.3% . 6.5% 7.2% .
Daimler Trucks
EBIT 129 376 516 524 530 501 578 294 +97% 1,753 1,695 +3%
RoS 1.8% 5.1% 6.5% 6.4% 6.6% 6.2% 6.8% 3.8% . 5.6% 5.4% .
Mercedes-Benz Vans
EBIT 81 167 204 200 152 75 194 165 +18% 631 607 +4%
RoS 4.1% 8.0% 8.4% 8.3% 6.7% 3.6% 7.2% 6.7% . 6.7% 6.7% .
Daimler Buses
EBIT -27 -69 47 -13 61 -20 82 36 +128% 163 -66 .
RoS -3.6% -9.5% 5.0% -1.3% 5.4% -2.1% 6.3% 2.9% . 4.0% -1.7% .
Daimler Financial Services
EBIT 314 344 319 338 322 322 313 289 +8% 1,268 1,293 -2%
Return on equity (RoE) 19.6% 25.2% 19.1% 23.5% 19.3% 21.2% 18.8% 18.7% . 19.2% 22.0% .
Reconciliation -23 86 8 -72 -37 88 -22 104 . -74 206 .
thereof: share of result of EADS 34 133 0 17 0 105 0 56 -100% 34 311 -89%
Daimler Group 934 2,159 2,178 2,314 2,279 1,965 2,530 1,739 +45% 7,921 8,177 -3%
* The 2012 figures have been adjusted, primarily for effects arising from application of the amended version of IAS 19.
12

Special Items affecting EBIT
1st Quarter 2nd Quarter 3rd Quarter 4th Quarter Financial Year
(in millions of EUR) 2013 2012 2013 2012 2013 2012 2013 2012 2013 2012
Impairment of investments in the area of alternative drive systems - -25 -43 - -51 -26 -80 - -174 -51
Workforce adjustments* -13 - -82 - -8 - -13 - -116 -
Impairment of investment in Fujian Benz Automotive Corporation - - - - - - - -64 - -64
Business repositioning -4 -36 -20 -46 -2 -16 -13 -57 -39 -155
Divestiture of EADS shares - - 3,209 - 13 - 1 913 3,223 913
* Daimler Trucks expects further expenses from workforce adjustments of up to €150 million, the majority of which will be recognized in 2014.
Da
imle
r
Tru
ck
s
Re
co
ncil
-
iati
on
Da
imle
r
Bu
se
s
Me
rce
de
s-
Be
nz
Va
ns
Me
rce
de
s-
Be
nz
Ca
rs
13

Mercedes-Benz Cars
Overview
1st Quarter 2nd Quarter 3rd Quarter 4th Quarter Financial Year
2013 2012 2013 2012 2013 2012 2013 2012 Change 2013 2012 Change
Unit sales (units) 341,511 338,303 404,711 370,384 395,446 345,418 423,895 397,464 +7% 1,565,563 1,451,569 +8%
Retail sales (units) 350,530 340,877 395,774 367,640 390,116 335,393 426,088 379,899 +12% 1,562,508 1,423,809 +10%
Production (units) 374,041 364,009 412,009 355,578 391,934 367,199 410,674 368,864 +11% 1,588,658 1,455,650 +9%
Revenue (millions of EUR) 14,110 14,937 16,324 15,364 16,521 15,238 17,352 16,121 +8% 64,307 61,660 +4%
EBIT (millions of EUR) 460 1,230 1,041 1,337 1,200 973 1,305 851 +53% 4,006 4,391 -9%
Return on sales (%) 3.3% 8.2% 6.4% 8.7% 7.3% 6.4% 7.5% 5.3% . 6.2% 7.1% .
14

Mercedes-Benz Cars
Unit Sales
1st Quarter 2nd Quarter 3rd Quarter 4th Quarter Financial Year
(in units) 2013 2012 2013 2012 2013 2012 2013 2012 Change 2013 2012 Change
Mercedes-Benz Cars 341,511 338,303 404,711 370,384 395,446 345,418 423,895 397,464 +7% 1,565,563 1,451,569 +8%
Western Europe 149,691 156,274 178,247 169,347 151,438 143,183 160,786 162,619 -1% 640,162 631,423 +1%
of which Germany 61,130 64,668 79,774 80,911 69,908 68,479 69,082 75,865 -9% 279,894 289,923 -3%
NAFTA 77,775 78,471 88,546 76,851 91,758 83,984 104,978 102,814 +2% 363,057 342,120 +6%
of which USA 67,998 68,603 76,476 65,453 80,106 74,247 93,927 91,438 +3% 318,507 299,741 +6%
Asia 78,745 73,492 93,100 88,910 107,445 82,497 109,775 93,387 +18% 389,065 338,286 +15%
of which China 46,412 42,518 60,043 59,686 64,808 47,127 67,464 59,163 +14% 238,727 208,494 +15%
Rest of World 35,300 30,066 44,818 35,276 44,805 35,754 48,356 38,644 +25% 173,279 139,740 +24%
15

Mercedes-Benz Cars
Retail Sales
1st Quarter 2nd Quarter 3rd Quarter 4th Quarter Financial Year
(in units) 2013 2012 2013 2012 2013 2012 2013 2012 Change 2013 2012 Change
Mercedes-Benz Cars 350,530 340,877 395,774 367,640 390,116 335,393 426,088 379,899 +12% 1,562,508 1,423,809 +10%
Western Europe 151,833 153,121 173,633 169,412 158,372 145,099 158,154 156,818 +1% 641,992 624,450 +3%
of which Germany 60,394 63,680 78,686 80,136 71,297 68,543 71,743 76,602 -6% 282,120 288,961 -2%
NAFTA 81,002 73,133 86,509 81,300 86,891 75,273 111,554 95,816 +16% 365,956 325,522 +12%
of which USA 71,473 63,809 75,038 69,550 75,549 65,612 99,756 85,043 +17% 321,816 284,014 +13%
Asia 83,135 85,798 92,568 81,485 101,332 79,982 108,622 88,354 +23% 385,657 335,619 +15%
of which China 50,049 56,123 57,468 52,016 61,402 48,716 66,725 55,205 +21% 235,644 212,060 +11%
Rest of World 34,560 28,825 43,064 35,443 43,521 35,039 47,758 38,911 +23% 168,903 138,218 +22%
16

Mercedes-Benz Cars
Market Shares*
1st Quarter 2nd Quarter 3rd Quarter 4th Quarter Financial Year
(in %) 2013 2012 2013 2012 2013 2012 2013 2012 Change 2013 2012 Change
in % pts. in % pts.
Western Europe 5.4 4.9 5.6 5.3 5.7 5.5 5.6 5.5 +0.1 5.6 5.3 +0.3
of which Germany 10.4 9.4 10.5 10.4 10.5 10.0 9.7 10.5 -0.8 10.3 10.1 +0.2
USA 1.9 1.8 1.8 1.8 1.9 1.8 2.6 2.4 +0.2 2.1 2.0 +0.1
China 1.3 1.4 1.5 1.4 1.3 1.4 1.5 1.4 +0.1 1.3 1.4 -0.1
Japan 0.9 0.8 1.2 0.9 1.3 1.0 1.4 1.3 +0.1 1.2 0.9 +0.3
* Based on estimates in certain markets.
17

Daimler Trucks
Overview
1st Quarter 2nd Quarter 3rd Quarter 4th Quarter Financial Year
2013 2012 2013 2012 2013 2012 2013 2012 Change 2013 2012 Change
Incoming orders (units) 126,877 106,610 125,791 106,054 125,901 95,432 119,564 108,964 +10% 498,133 417,060 +19%
Unit sales (units) 101,433 107,664 123,763 122,217 124,465 119,142 134,550 112,931 +19% 484,211 461,954 +5%
Retail sales (units) 100,748 104,765 124,065 116,976 118,448 116,689 141,996 116,903 +21% 485,257 455,333 +7%
Production (units) 111,150 114,563 127,401 120,914 128,289 118,892 123,440 96,253 +28% 490,280 450,622 +9%
Revenue (millions of EUR) 7,024 7,383 7,965 8,129 7,982 8,095 8,502 7,782 +9% 31,473 31,389 +0%
EBIT (millions of EUR) 116 376 434 524 522 501 565 294 +92% 1,637 1,695 -3%
Return on sales (%) 1.7% 5.1% 5.4% 6.4% 6.5% 6.2% 6.6% 3.8% . 5.2% 5.4% .
18

Daimler Trucks
Unit Sales
1st Quarter 2nd Quarter 3rd Quarter 4th Quarter Financial Year
(in units) 2013 2012 2013 2012 2013 2012 2013 2012 Change 2013 2012 Change
Daimler Trucks 101,433 107,664 123,763 122,217 124,465 119,142 134,550 112,931 +19% 484,211 461,954 +5%
Western Europe 11,968 13,066 14,270 15,041 16,662 14,193 22,968 15,722 +46% 65,868 58,022 +14%
of which Germany 6,212 6,401 7,623 8,189 7,861 7,954 11,796 8,542 +38% 33,492 31,086 +8%
NAFTA 30,642 32,639 34,924 34,573 35,125 35,177 34,508 32,639 +6% 135,199 135,028 +0%
of which USA 26,641 27,432 30,011 28,415 30,665 29,863 30,467 28,116 +8% 117,784 113,826 +3%
Latin America (excl. Mexico) 12,987 9,931 16,051 10,209 16,204 12,541 14,080 13,516 +4% 59,322 46,197 +28%
Asia 35,221 40,047 41,955 46,193 41,115 42,698 44,366 34,796 +28% 162,657 163,734 -1%
of which Japan 8,862 9,778 8,758 8,812 10,081 8,167 10,634 8,218 +29% 38,335 34,975 +10%
Rest of World 10,615 11,981 16,563 16,201 15,359 14,533 18,628 16,258 +15% 61,165 58,973 +4%
BFDA - Beijing Foton Daimler
Automotive Co. Ltd. (Auman Trucks) 23,001 - 28,229 - 24,129 13,942 27,939 17,430 +60% 103,298 31,372 .
Daimler Trucks including BFDA 124,434 107,664 151,992 122,217 148,594 133,084 162,489 130,361 +25% 587,509 493,326 +19%
* Comparison with prior-year numbers not reasonable, as production started in July 2012.
*
19

Daimler Trucks
Retail Sales
1st Quarter 2nd Quarter 3rd Quarter 4th Quarter Financial Year
(in units) 2013 2012 2013 2012 2013 2012 2013 2012 Change 2013 2012 Change
Daimler Trucks 100,748 104,765 124,065 116,976 118,448 116,689 141,996 116,903 +21% 485,257 455,333 +7%
Western Europe 12,020 12,878 14,286 15,630 14,760 14,373 24,770 16,088 +54% 65,836 58,969 +12%
of which Germany 6,212 6,401 7,623 8,189 7,861 7,954 11,796 8,542 +38% 33,492 31,086 +8%
NAFTA 31,896 30,395 35,910 29,642 33,901 33,704 36,627 33,846 +8% 138,334 127,587 +8%
of which USA 27,981 26,110 30,673 24,808 29,459 28,793 31,974 28,607 +12% 120,087 108,318 +11%
Latin America (excl. Mexico) 12,070 10,024 16,206 10,096 14,870 12,027 15,108 15,222 -1% 58,254 47,369 +23%
Asia 35,188 39,938 41,383 45,888 39,491 42,698 46,733 34,815 +34% 162,795 163,339 -0%
of which Japan 8,849 9,778 8,618 8,812 10,034 8,339 10,500 8,228 +28% 38,001 35,157 +8%
Rest of World 9,574 11,530 16,280 15,720 15,426 13,887 18,758 16,932 +11% 60,038 58,069 +3%
20

Daimler Trucks
Incoming Orders
1st Quarter 2nd Quarter 3rd Quarter 4th Quarter Financial Year
(in units) 2013 2012 2013 2012 2013 2012 2013 2012 Change 2013 2012 Change
Daimler Trucks 126,877 106,610 125,791 106,054 125,901 95,432 119,564 108,964 +10% 498,133 417,060 +19%
Western Europe 15,256 14,897 17,263 13,760 22,348 11,984 9,863 13,950 -29% 64,730 54,591 +19%
of which Germany 7,617 8,803 8,046 7,151 12,523 6,384 5,165 6,470 -20% 33,351 28,808 +16%
NAFTA 35,933 27,946 31,730 22,417 33,002 23,663 42,069 35,194 +20% 142,734 109,220 +31%
of which USA 31,193 23,663 26,968 19,151 30,251 20,665 37,521 31,880 +18% 125,933 95,359 +32%
Latin America* (excl. Mexico) 13,806 9,863 15,239 8,921 14,764 11,643 9,812 12,138 -19% 53,621 42,565 +26%
Asia 45,422 39,544 43,512 44,624 37,714 32,219 43,358 34,729 +25% 170,006 151,116 +13%
of which Japan 9,890 8,913 11,808 9,215 10,681 8,368 11,690 8,548 +37% 44,069 35,044 +26%
Rest of World 16,460 14,360 18,047 16,332 18,073 15,923 14,462 12,953 +12% 67,042 59,568 +13%
* Built-to-stock system in Brazil until June 2013; starting July 2013, order intake corresponds to orders from the dealers.
21

Daimler Trucks
Market Shares*
1st Quarter 2nd Quarter 3rd Quarter 4th Quarter Financial Year
(in %) 2013 2012 2013 2012 2013 2012 2013 2012 Change 2013 2012 Change
in % pts. in % pts.
Trucks Europe / Latin America(Mercedes-Benz)
Western Europe MDT/HDT 22.5 22.5 24.0 23.3 24.3 24.0 24.6 22.0 +2.6 24.1 22.9 +1.2
Germany MDT/HDT 41.2 39.4 39.5 38.0 40.3 39.9 39.0 39.6 -0.6 39.7 39.2 +0.5
Brazil MDT/HDT 22.9 27.1 24.9 26.3 24.5 25.3 25.5 24.2 +1.3 24.7 25.5 -0.8
Trucks NAFTA(Freightliner/Western Star)
NAFTA Class 8 42.1 35.4 35.9 29.9 35.4 32.6 34.3 34.4 -0.1 36.0 32.9 +3.1
NAFTA Class 6-7 46.7 41.1 43.7 35.7 44.6 35.4 39.6 37.2 +2.4 43.1 36.9 +6.2
Trucks Asia(Fuso)
Japan Trucks Total 19.2 20.2 19.9 20.8 21.1 21.5 20.3 19.4 +0.9 20.2 20.4 -0.2
* Based on estimates in certain markets.
22

Mercedes-Benz Vans
Overview
1st Quarter 2nd Quarter 3rd Quarter 4th Quarter Financial Year
2013 2012 2013 2012 2013 2012 2013 2012 Change 2013 2012 Change
Unit sales (units) 52,623 51,223 69,436 69,324 65,314 55,742 82,771 76,129 +9% 270,144 252,418 +7%
Retail sales (units) 52,752 52,131 68,631 68,184 66,984 58,874 80,163 71,089 +13% 268,530 250,278 +7%
Production (units) 63,169 62,974 72,811 67,795 62,843 55,159 71,852 71,568 +0% 270,675 257,496 +5%
Revenue (millions of EUR) 1,986 2,088 2,434 2,420 2,253 2,084 2,696 2,478 +9% 9,369 9,070 +3%
EBIT (millions of EUR) 81 167 204 200 152 75 194 101 +92% 631 543 +16%
Return on sales (%) 4.1% 8.0% 8.4% 8.3% 6.7% 3.6% 7.2% 4.1% . 6.7% 6.0% .
23

Mercedes-Benz Vans
Unit Sales
1st Quarter 2nd Quarter 3rd Quarter 4th Quarter Financial Year
2013 2012 2013 2012 2013 2012 2013 2012 Change 2013 2012 Change
Wholesales (in units) 52,623 51,223 69,436 69,324 65,314 55,742 82,771 76,129 +9% 270,144 252,418 +7%
Western Europe 32,646 34,394 42,480 46,519 39,528 33,085 54,521 50,909 +7% 169,175 164,907 +3%
of which Germany 12,595 13,445 18,573 20,832 17,323 14,409 23,029 22,358 +3% 71,520 71,044 +1%
Eastern Europe 5,213 4,597 7,243 6,497 7,180 5,821 7,240 7,111 +2% 26,876 24,026 +12%
NAFTA 5,120 4,802 7,585 7,601 6,773 6,884 8,590 7,096 +21% 28,068 26,383 +6%
of which USA 3,976 3,557 6,108 6,310 5,546 5,836 7,172 5,771 +24% 22,802 21,474 +6%
Latin America (excl. Mexico) 4,109 2,946 5,162 2,346 5,176 4,307 5,133 4,355 +18% 19,580 13,954 +40%
Asia 3,035 2,243 4,692 3,407 4,347 3,241 4,696 4,234 +11% 16,770 13,125 +28%
of which China 2,371 1,061 3,310 2,358 3,466 2,270 3,558 3,147 +13% 12,705 8,836 +44%
Rest of World 2,500 2,241 2,274 2,954 2,310 2,404 2,591 2,424 +7% 9,675 10,023 -3%
24

Mercedes-Benz Vans
Retail Sales and Market Shares
1st Quarter 2nd Quarter 3rd Quarter 4th Quarter Financial Year
2013 2012 2013 2012 2013 2012 2013 2012 Change 2013 2012 Change
Retail sales (in units) 52,752 52,131 68,631 68,184 66,984 58,874 80,163 71,089 +13% 268,530 250,278 +7%
Western Europe 33,100 35,174 43,391 46,056 40,879 35,891 52,335 46,468 +13% 169,705 163,589 +4%
of which Germany 12,595 13,445 18,573 20,832 17,323 14,409 23,029 22,358 +3% 71,520 71,044 +1%
Eastern Europe 4,856 4,440 6,690 5,940 7,139 5,911 7,604 7,329 +4% 26,289 23,620 +11%
NAFTA 4,896 4,293 6,978 7,238 6,959 7,224 8,121 7,056 +15% 26,954 25,811 +4%
of which USA 3,834 3,129 5,649 6,147 5,457 6,126 6,876 5,527 +24% 21,816 20,929 +4%
Latin America (excl. Mexico) 4,296 2,817 4,672 2,928 5,312 3,833 4,891 4,003 +22% 19,171 13,581 +41%
Asia 3,177 3,092 4,411 3,247 4,330 3,636 4,764 3,878 +23% 16,682 13,853 +20%
of which China 2,504 2,066 3,199 2,249 3,532 2,463 3,578 2,792 +28% 12,813 9,570 +34%
Rest of World 2,427 2,315 2,489 2,775 2,365 2,379 2,448 2,355 +4% 9,729 9,824 -1%
Market shares* (in percent)
Western Europe** small 3.3 - 3.3 - 3.2 - 3.0 - - pts. 3.2 - - pts.
Western Europe** midsize/large 16.1 17.2 16.1 18.0 18.7 20.1 19.8 18.9 +0.9 pts. 17.8 18.1 -0.3 pts.
Germany midsize/large 24.7 25.8 23.5 24.7 26.6 25.3 29.5 29.6 -0.1 pts. 26.2 26.7 -0.5 pts.
* Based on estimates in certain markets.
** Excluding United Kingdom.
25

Daimler Buses
Overview
1st Quarter 2nd Quarter 3rd Quarter 4th Quarter Financial Year
2013 2012 2013 2012 2013 2012 2013 2012 Change 2013 2012 Change
Unit sales* (units) 6,033 4,896 7,913 8,418 9,649 8,257 10,110 10,517 -4% 33,705 32,088 +5%
Production (units) 7,358 6,370 9,269 7,872 9,488 9,207 8,352 7,935 +5% 34,467 31,384 +10%
Revenue (millions of EUR) 751 730 934 1,016 1,127 951 1,293 1,232 +5% 4,105 3,929 +4%
EBIT (millions of EUR) -31 -105 27 -59 59 -36 69 -21 . 124 -221 .
Return on sales (%) -4.1% -14.4% 2.9% -5.8% 5.2% -3.8% 5.3% -1.7% . 3.0% -5.6% .
* Due to the sales structure, retail sales correspond with wholesales.
26

Daimler Buses
Unit Sales and Market Shares
1st Quarter 2nd Quarter 3rd Quarter 4th Quarter Financial Year
2013 2012 2013 2012 2013 2012 2013 2012 Change 2013 2012 Change
Wholesales* (in units) 6,033 4,896 7,913 8,418 9,649 8,257 10,110 10,517 -4% 33,705 32,088 +5%
Western Europe 538 632 1,488 1,377 1,696 1,625 2,992 2,217 +35% 6,714 5,851 +15%
of which Germany 231 209 503 460 573 382 1,133 988 +15% 2,440 2,039 +20%
Eastern Europe 447 286 632 531 405 322 457 552 -17% 1,941 1,691 +15%
NAFTA 366 552 712 1,112 944 1,026 1,014 1,253 -19% 3,036 3,943 -23%
of which Mexico 349 450 704 946 923 931 983 1,150 -15% 2,959 3,477 -15%
Latin America (excl. Mexico) 4,141 2,790 4,529 4,689 5,750 4,807 4,698 5,514 -15% 19,118 17,800 +7%
of which Brazil 2,646 1,696 2,956 2,942 3,798 2,900 3,480 3,577 -3% 12,880 11,115 +16%
Asia 404 269 349 553 435 390 516 674 -23% 1,704 1,886 -10%
Rest of World 137 367 203 156 419 87 433 307 +41% 1,192 917 +30%
Market shares** (in percent)
Western Europe heavy 30.8 27.0 29.1 29.6 33.5 33.9 28.1 30.1 -2.0 pts. 30.9 28.3 +2.6 pts.
Germany heavy 56.3 48.1 52.0 56.0 56.1 44.2 47.7 50.2 -2.5 pts. 51.2 48.9 +2.3 pts.
Brazil heavy 36.2 53.3 43.5 51.8 45.4 45.5 50.2 41.1 +9.1 pts. 44.1 47.2 -3.1 pts.
* Due to the sales structure, retail sales correspond with wholesales.
** Based on estimates in certain markets.
27

Daimler Financial Services
Overview
1st Quarter 2nd Quarter 3rd Quarter 4th Quarter Financial Year
(in millions of EUR) 2013 2012 2013 2012 2013 2012 2013 2012 Change 2013 2012 Change
New business 8,619 8,257 10,292 9,380 10,379 9,968 11,243 10,471 +7% 40,533 38,076 +6%
Contract volume (end of period) 81,656 71,587 81,404 76,096 81,962 77,464 83,539 79,986 +4% 83,539 79,986 +4%
Revenue 3,577 3,140 3,548 3,260 3,657 3,524 3,740 3,626 +3% 14,522 13,550 +7%
EBIT 314 344 319 338 322 322 313 289 +8% 1,268 1,293 -2%
Return on equity (%) 19.6% 25.2% 19.1% 23.5% 19.3% 21.2% 18.8% 18.7% . 19.2% 22.0% .
28