Embed Size (px)
Citation preview

29/01/200729/01/2007 11
Export orientation towards the regional and international markets: A case of seafood industryin Sri Lanka and the Japanese seafood market
D.A.M. De SilvaD.A.M. De SilvaGraduate School of Biosphere SciencesGraduate School of Biosphere Sciences
29292929 / 01010101/ 2007200720072007
29/01/200729/01/2007 22
Contents of the presentationContents of the presentation
IntroductionIntroduction
Research questionsResearch questions
JustificationsJustifications
Studies Studies –– methods and findingsmethods and findings
i. Case study of the export oriented seafood i. Case study of the export oriented seafood
industry in Sri Lanka industry in Sri Lanka
ii. Case study of the Japanese seafood market ii. Case study of the Japanese seafood market
and the consumption behaviorand the consumption behavior
ConclusionsConclusions
Suggestions for policy implicationsSuggestions for policy implications

29/01/200729/01/2007 33
Research questions ?Research questions ?Export oriented seafood industry of Sri LankaExport oriented seafood industry of Sri Lanka
What is the strategic situation of a country?What is the strategic situation of a country?
What is the present market situation of the main products? What is the present market situation of the main products?
Are the South Asian exporters geared towards Are the South Asian exporters geared towards diversification?diversification?
What are factors that affect employee commitment? What are factors that affect employee commitment?
What is the level of compliance on food safety?What is the level of compliance on food safety?
What are the impacts of tsunami on seafood industry?What are the impacts of tsunami on seafood industry?
Japanese seafood marketJapanese seafood market
Do Japanese consumers evaluate seafood based Do Japanese consumers evaluate seafood based
on quality or ethnocentricity?on quality or ethnocentricity?
Who consume the sushi most?Who consume the sushi most?

29/01/200729/01/2007 44
Justification of the studyJustification of the study
Economic importance to both Sri Lanka and Economic importance to both Sri Lanka and JapanJapan
Vast potentials exist in Sri LankaVast potentials exist in Sri Lanka
Identify the ways to create successful Identify the ways to create successful seafood export industryseafood export industry
Less research focus in Sri LankaLess research focus in Sri Lanka
Share the experience with international Share the experience with international readershipreadership
Consumer behavior of worldConsumer behavior of world’’s biggest fish s biggest fish market & ideas for exportersmarket & ideas for exporters
Suggestions for policy makingSuggestions for policy making

29/01/200729/01/2007 55
Organization of the research studies on export oriented seafood industry of Sri Lanka
SituationAnalysis
Analysisof firm and products
RegionalAnalysis
Strategic situationof the country
� Prawn exports to Japanese market
�Tuna processors and Export performance
� EmployeeCommitment
� Compliance on HACCP
� Impact of tsunami
� Product diversification and Seafood exports of
South Asia
Explore the path ways to be the pioneering seafood exporter in South Asia

29/01/200729/01/2007 66
International businessInternational business –– operations and influencesoperations and influencesExternal influences
Competitive environment
•Major advantage in price,
marketing, innovation or
other factors
•Number and relative
capabilities of competitors
•Competitive differences
by country
Physical and Societal
Factors
•Political policies and
legal practices
•Values, attitudes
and beliefs
•Economic forces
•Geographical
influences
Operations
Objectives
•Sales expansion
•Resource
acquisition
•Diversification
•Competitive risk
minimization
STRATEGY
1 Means
1 Modes
•Importing and exporting
•Tourism and transportation
•Licensing and franchising
•Turnkey operations
•Management contracts
•Direct and portfolio investment
2 Functions
•Marketing
•Production
•Accounting
•Finance
•Human resources
3 Overlaying tactical alternatives
•Choice of countries
•Organization and control mechanisms
•Degree of integration among countries’
operations
Daniels and Radebaugh, 1998

29/01/200729/01/2007 77
1.A case study of export oriented seafood industry in Sri Lanka
Colombo

29/01/200729/01/2007 88
i. i. Evolution of the strategies for betterment of future: A Evolution of the strategies for betterment of future: A case study of export oriented seafood industry in case study of export oriented seafood industry in
Sri LankaSri Lanka
Objectives of the studyObjectives of the study
To trace the strategic situation of export To trace the strategic situation of export
oriented seafood industry in Sri Lanka, focusing oriented seafood industry in Sri Lanka, focusing
on how the international market dynamics have on how the international market dynamics have
influenced the emergence and development of influenced the emergence and development of
the sectorthe sector
To identify the strengths, weaknesses, To identify the strengths, weaknesses,
opportunities and threats of the seafood opportunities and threats of the seafood
industryindustry
29/01/200729/01/2007 99
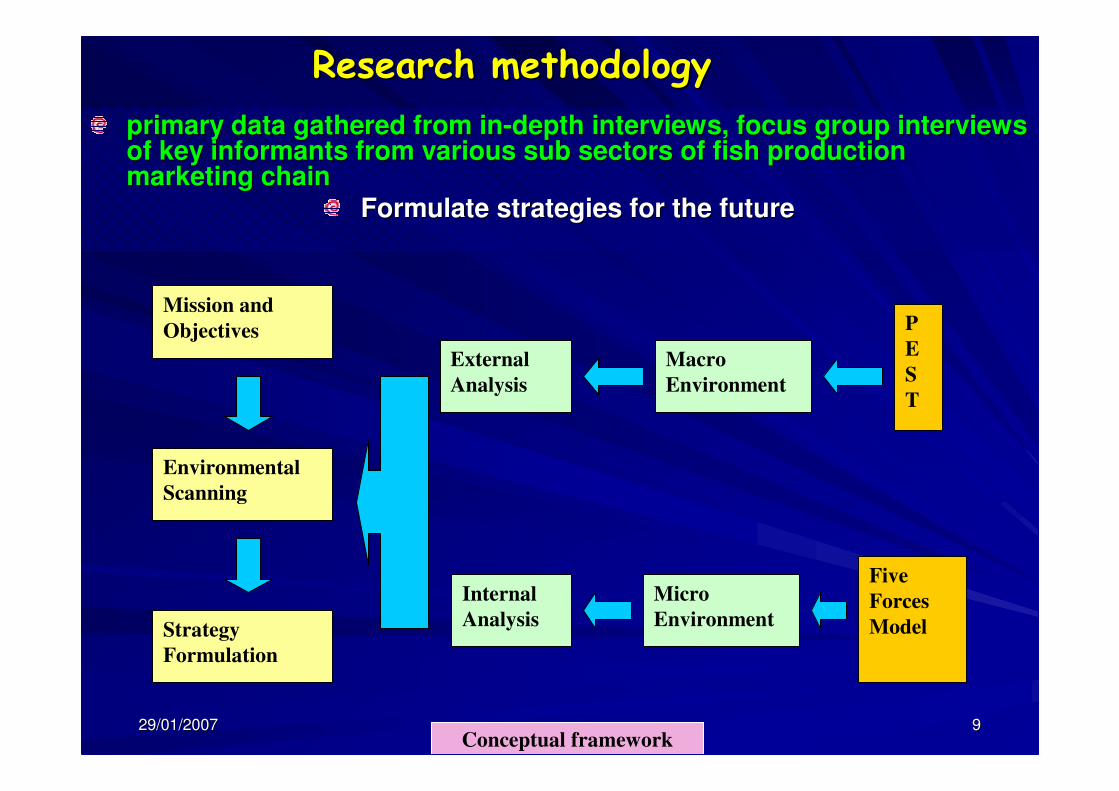
Research methodologyResearch methodology
primary data gathered from inprimary data gathered from in--depth interviews, focus group interviews depth interviews, focus group interviews of key informants from various sub sectors of fish production of key informants from various sub sectors of fish production marketing chainmarketing chain
Formulate strategies for the futureFormulate strategies for the future
Mission and
Objectives
Environmental
Scanning
Strategy
Formulation
External
Analysis
Macro
Environment
P
E
S
T
Internal
Analysis
Micro
Environment
Five
Forces
Model
Conceptual framework

29/01/200729/01/2007 1010
Results and DiscussionResults and Discussion
SWOT analysis: SWOT analysis: 1. 1. StrengthsStrengths –– Strategic geographical situation, Strategic geographical situation,
significant biophysical resource base, good image, significant biophysical resource base, good image,
experienced fishers with flexible fishing fleetexperienced fishers with flexible fishing fleet , ,
relatively large home market, high yields of semirelatively large home market, high yields of semi--
intensive and extensive production systems intensive and extensive production systems
2.Weaknesses2.Weaknesses –– High dependency on prawn and High dependency on prawn and
tuna, poor efficiency in catch sectors, limited tuna, poor efficiency in catch sectors, limited
availability of quality infrastructure, unstable availability of quality infrastructure, unstable
catches, irregular supply, large gap between catches, irregular supply, large gap between
research and industry, limited working capital, research and industry, limited working capital,
poor market knowledgepoor market knowledge and sales promotionand sales promotion

29/01/200729/01/2007 1111
3. Opportunities3. Opportunities –– Exploiting nonExploiting non--traditional traditional
species for niche markets, value addition species for niche markets, value addition
and diversification towards convenience and diversification towards convenience
meals, tap the ethnic market, get advantage meals, tap the ethnic market, get advantage
of SAFTA, reof SAFTA, re--export, reexport, re--processing of processing of
Maldivian tunaMaldivian tuna
4.Threats4.Threats –– Falling resource base due to IUU Falling resource base due to IUU
fishing, voice of environmental groups on fishing, voice of environmental groups on
expansion, neighboring competitors, low expansion, neighboring competitors, low
interest on HACCP, interest on HACCP, SAFTAsSAFTAs’’ threat to local threat to local
producersproducers

29/01/200729/01/2007 1212
PEST ModelPolitical•Political instability; civil war
•Tax policy; income tax-15% for 5 years; 10% tax
dividends; unlimited rupee exchange; 15% VAT
•Employment law
•Environmental law;
•Tariff and trade restrictions;
•Economic
•Annual GDP growth; Low interest rates-
•Exchange rate and devaluation of
currency
•Moderate inflation
•Social•Favorable labor law; Population growth-1.5%; High literacy rate (89%); educated, trained, hard working & motivated labor force•Emphasis on safety and loyalty•Labor productivity & real value added man hour is 4.9%
•Technological•Research & development; value addition is increasing by 11%•Automation•Technology incentives; tax free on imports of agric. equipments, computers, construction machinery & low tax on materials for development •Rate of technological change is 5.9% (2004)
Five Forces’ Model
1.Threat of substitutes – Economical alternatives of established meat markets2. Buyer’s power – Adverse economic conditions in main markets, dynamic consumer demand and environmental barriers3. Competitor rivalry – Many players, slow market growth, high fixed costs, low value addition and differentiation, high exit costs and industry shake out 4. Supplier power – Supplier monopoly, market image, intensity of promotion and steady supply5. Barriers to entry – High entry costs, legislative barriers, proprietary knowledge and asset specificity

29/01/200729/01/2007 1313
ii. Sri Lankan prawn in Japanese Market: Vehicle for a secure future for
Sri Lankan export oriented fisheries industry?

29/01/200729/01/2007 1414
Objectives Objectives
To identify the past and future trends of the Sri To identify the past and future trends of the Sri Lankan shrimp exports in the Japanese market Lankan shrimp exports in the Japanese market
To identify the consumption trends and affecting To identify the consumption trends and affecting factors for the consumption of shrimp in Japanese factors for the consumption of shrimp in Japanese marketmarket
Materials and methodsMaterials and methods
Data sources: Export data 1990Data sources: Export data 1990--2003 2003
Analysis: Time series forecasting (Moving Analysis: Time series forecasting (Moving averages with Linear Trend) averages with Linear Trend)
F(t+hF(t+h) = ) = F(tF(t) + ) + FF’’(t(t) [(m) [(m--1)/2+h]1)/2+h]where F (where F (t+ht+h) = Forecast time , F (t), F) = Forecast time , F (t), F’’ (t) = (t) = exponential smoothing, m = length of moving exponential smoothing, m = length of moving average, t = actual data, h = future periodsaverage, t = actual data, h = future periods
To analyze the future trendsTo analyze the future trends

29/01/200729/01/2007 1515
Expenditure on consumption of ShrimpExpenditure on consumption of Shrimp == b0+ b1 * (Total b0+ b1 * (Total
expenditure on food) + b2 * (Total expenditure on fish) + b3 * (expenditure on food) + b2 * (Total expenditure on fish) + b3 * (no. of no. of
personspersons//household) + b4 * (Expenditure on pork) + b5 * (Expenditure on household) + b4 * (Expenditure on pork) + b5 * (Expenditure on
beef) + b6 * (Expenditure on chicken) + b7 * (Expenditure on habeef) + b6 * (Expenditure on chicken) + b7 * (Expenditure on ham and m and
sausages) + b8 * (Expenditure on eggsausages) + b8 * (Expenditure on egg andand milk) + b9 * (Expenditure on milk) + b9 * (Expenditure on
eateat--outout))
FindingsFindings
96
98
0
2
0
2000
4000
6000
8000
10000
12000
Volum
e & Value
Years
Volume(MT) Value(M\)
0
2
4
6
8
10
12
14
16
18
1
9
8
7
1
9
8
9
1
9
9
1
1
9
9
3
1
9
9
5
1
9
9
7
1
9
9
9
Years
Value(US$/Kg:)
INDIA PAKISTAN
SRI LANKA BANGALADESH
Time series analysis of the Sri Lankan shrimp exports to Japanese market & unit price

29/01/200729/01/2007 1616
FindingsFindingsJapan Japan –– main market for Sri Lankan prawn and shrimpmain market for Sri Lankan prawn and shrimp
Heavy export competition from neighboring nationsHeavy export competition from neighboring nations
Analysis showed positive trend in quantity demanded and Analysis showed positive trend in quantity demanded and receiving high prices for Sri Lankan shrimp exports in receiving high prices for Sri Lankan shrimp exports in futurefuture
Low cost of production (US$ 4.56/ Kg) comparing with Low cost of production (US$ 4.56/ Kg) comparing with other Asian competitors except China and has medium other Asian competitors except China and has medium overhead cost for production (38.6%)overhead cost for production (38.6%)
Increased diversification and value addition effortsIncreased diversification and value addition efforts of of processorsprocessors
Preference on prawns: Food service use Preference on prawns: Food service use –– large to large to medium; families often buy small sized frozen and food medium; families often buy small sized frozen and food processors processors –– small sizesmall size
Consumption rises during major national holidaysConsumption rises during major national holidays
Consumers preference is due to freshness, uniformity in Consumers preference is due to freshness, uniformity in size, appearance, pricesize, appearance, price
Entry barriers and competition from established suppliersEntry barriers and competition from established suppliers

29/01/200729/01/2007 1717
0
200000
400000
600000
800000
1000000
1200000
1
9
8
9
1
9
9
1
1
9
9
3
1
9
9
5
1
9
9
7
1
9
9
9
Value(\)
Shrimp Food Fish0
10000
20000
30000
40000
50000
60000
Value(\)
1993 1995 1997 1999
Years
Sapporo Tokyo Nagoya Osaka Fukoka
Expenditure on shrimp consumption by whole market and by cities
Fluctuation of consumptionJapanese shrimp consumption also differs region to region in thecountry and it shows the direct influence of local culture on their food habitsExpenditure on fish, chicken and eat outs had positive impact on shrimp consumptionExpenditure on beef and no. of household persons had negative impact on shrimp consumption

29/01/200729/01/2007 1818
Forecast on shrimp exports to Japan Forecast on offering prices

29/01/200729/01/2007 1919
iii. iii. Export performance of small and medium scale Tuna Export performance of small and medium scale Tuna processingprocessing industry inindustry in Sri Lanka: Can they survive?Sri Lanka: Can they survive?

29/01/200729/01/2007 2020
ObjectivesObjectives
To investigate the present status of tuna processing To investigate the present status of tuna processing
industry in Sri Lanka industry in Sri Lanka
To analyzes the impact of technological innovation, effort To analyzes the impact of technological innovation, effort
in international business, managerin international business, manager’’s perception on s perception on
obstacles to export and utilization of public instruments on obstacles to export and utilization of public instruments on
export performance of tuna exportersexport performance of tuna exporters
ConceptsConcepts
Technological innovation (Product, Process and Innovation in Technological innovation (Product, Process and Innovation in
management)management)
International business management International business management
ManagerManager’’s perceptions about obstacles to exports perceptions about obstacles to export
Utilization of public instrumentsUtilization of public instruments

29/01/200729/01/2007 2121
Empirical approachEmpirical approachsurvey survey -- spring 2004 spring 2004
Study locations: Southern, Western provincesStudy locations: Southern, Western provinces
Primary data: 10 permanent tuna exporters and 10 Primary data: 10 permanent tuna exporters and 10 sporadic tuna exporters sporadic tuna exporters
Characteristics of the companies were considered: 1999Characteristics of the companies were considered: 1999--2003 2003
Companies that export through out this period Companies that export through out this period -- permanent permanent exporters while companies not export regularly exporters while companies not export regularly -- sporadic sporadic exportersexporters
Data collection tools: Structured questionnaire, inData collection tools: Structured questionnaire, in--depth depth interviews with key informantsinterviews with key informants
The model: The model: IntiInti = = αααααααα + + ββββββββ expiexpi + + εεεεεεεεii
Where Where IntInt measures the intensity of Technological measures the intensity of Technological innovation, International business management, Managerinnovation, International business management, Manager’’s s perceptions on obstacles to export and Utilization of public perceptions on obstacles to export and Utilization of public instruments instruments
Measure the export intensityMeasure the export intensity

29/01/200729/01/2007 2222
The scale of intensity was measured as follows; The scale of intensity was measured as follows;
0 0 –– null intensity; 1 null intensity; 1 –– low intensity; 2 low intensity; 2 ––
slightly low intensity; 3 slightly low intensity; 3 –– slightly high slightly high
intensity and 4 intensity and 4 –– high intensityhigh intensity
Exp is a categorical variable that defines the Exp is a categorical variable that defines the
exporting status of the company exporting status of the company
11-- if the firm is a permanent exporter, if the firm is a permanent exporter,
00 –– sporadic exportersporadic exporter
Econometric estimation: Econometric estimation:
Pr (Yi = 1) = Pr (Yi = 1) = ΦΦΦΦΦΦΦΦ ((ββββββββ’’ Xi) + Xi) + εεεεεεεεii
t test t test –– to compare the means of two to compare the means of two
samples: permanent and sporadic exporterssamples: permanent and sporadic exporters

29/01/200729/01/2007 2323
0
10
20
30
40
50
60
70
80
Qu
an
tity
('o
oo
MT
)
1979 1982 1985 1988 1991 1994 1997 2000 2003
Quantity
Permanent exporters Permanent exporters -- more active in product and process innovation, more active in product and process innovation, strategic alliances with foreign firms, training of workers in estrategic alliances with foreign firms, training of workers in export xport operations, export promotion in abroad and obtaining loans for operations, export promotion in abroad and obtaining loans for financing working capital financing working capital
Sporadic exporters Sporadic exporters -- more active in strategic alliances with domestic more active in strategic alliances with domestic firms and hiring of staff qualified for international businessfirms and hiring of staff qualified for international business
Both facing greater difficulties in international operationBoth facing greater difficulties in international operation
Utilization of public instrument was not playing significant rolUtilization of public instrument was not playing significant rolee
Permanent exporters engaged in export promotion and technologicaPermanent exporters engaged in export promotion and technological l capability enhancing in quality management than the sporadic capability enhancing in quality management than the sporadic exportersexporters
0 500 1000 1500
1998
1999
2000
2001
2002
2003
Va
lue
(R
s.m
illi
on
)
Tuna frozen Tuna not frozen Fillets Fillets frozen Smoked

29/01/200729/01/2007 2424
Summary of ScoresSummary of Scores
3.893.895.755.750303--01011111--0505
4. Utilization of public 4. Utilization of public
instrumentsinstruments (0(0--12)12)
5.135.13
3.533.53
5.795.79
20.220.2
26.426.4
45.545.5
2626--2323
3535--2424
4848--3636
1818--1313
2929--2020
4949--3030
3. Manger3. Manger’’s perception on s perception on
obstacles to exportobstacles to export
Internal to the firm (0Internal to the firm (0--36)36)
Internal to the country (0Internal to the country (0--36)36)
External to the country (0External to the country (0--52)52)
11.0711.0721.4521.451414--09093636--23232. Effort in international business2. Effort in international business
(0(0--48)48)
5.375.37
5.185.18
4.674.67
7.77.7
8.68.6
6.96.9
77--11
88--22
44--11
1616--88
1515--1010
1313--0909
1. Technological Innovation1. Technological Innovation
Product innovation (0Product innovation (0--16)16)
Process innovation (0Process innovation (0--16)16)
Innovation in management (0Innovation in management (0--16)16)
Standard Standard
DeviationDeviationMeanMeanSporadic Sporadic
exportersexporters
Max.Max.-- Min.Min.
Permanent Permanent
exportersexporters
Max.Max.-- Min.Min.
Particulars of scoresParticulars of scores
29/01/200729/01/2007 2525
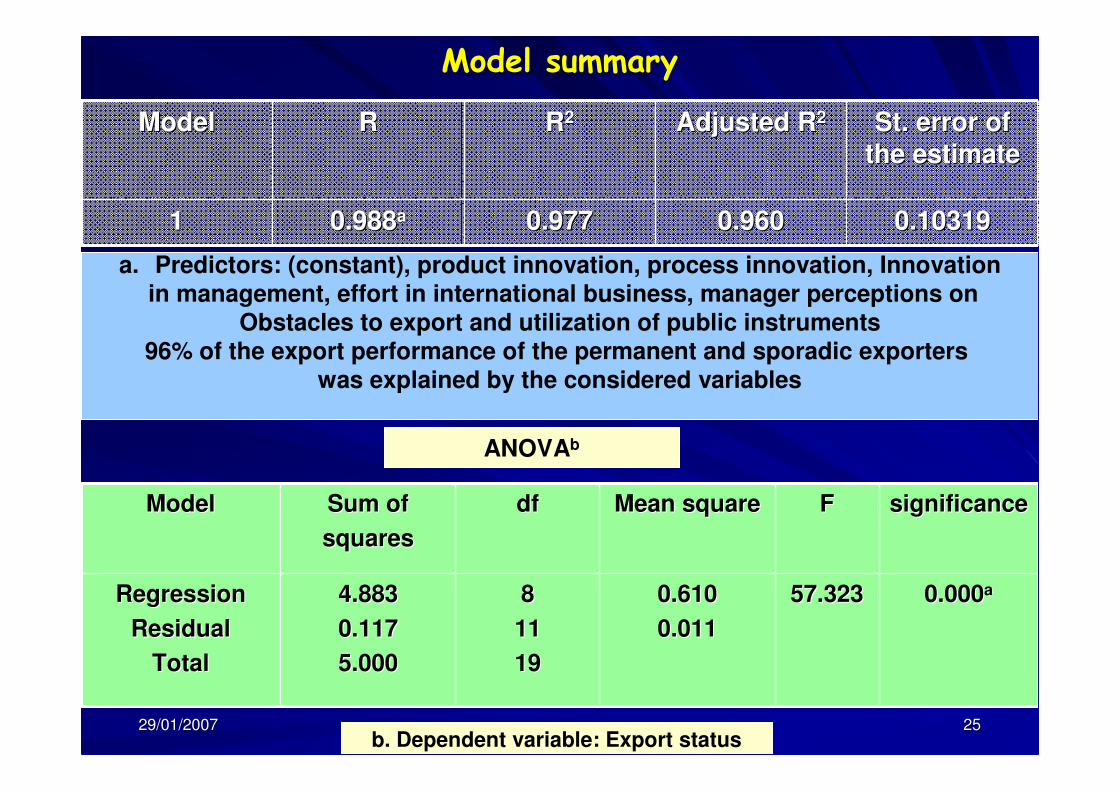
Model summaryModel summary
0.103190.103190.9600.9600.9770.9770.9880.988aa11
St. error of St. error of
the estimatethe estimateAdjusted RAdjusted R22RR22RRModelModel
a. Predictors: (constant), product innovation, process innovation, Innovationin management, effort in international business, manager perceptions on
Obstacles to export and utilization of public instruments96% of the export performance of the permanent and sporadic exporters
was explained by the considered variables
ANOVAb
0.0000.000aa57.32357.3230.6100.610
0.0110.011
88
1111
1919
4.8834.883
0.1170.117
5.0005.000
RegressionRegression
ResidualResidual
TotalTotal
significancesignificanceFFMean squareMean squaredfdfSum ofSum of
squaressquares
ModelModel
b. Dependent variable: Export status

29/01/200729/01/2007 2626
Summary of coefficientsSummary of coefficients
0.4560.4562.2572.2570.4570.457Public instrumentsPublic instruments
0.0760.076-- 1.9581.958-- 0.1270.127Obstacles external to countryObstacles external to country
0.9000.900-- 0.1290.129-- 0.0110.011Obstacles internal to countryObstacles internal to country
0.6050.605-- 0.5330.533-- 0.0810.081Obstacles internal to firmObstacles internal to firm
0.7870.787-- 0.2760.276-- 0.0690.069Effort in international businessEffort in international business
0.0530.0532.1662.1660.5390.539**Innovation in managementInnovation in management
0.8990.8990.1300.1300.0320.032Process innovationProcess innovation
0.6430.6430.4770.4770.0850.085Product innovationProduct innovation
0.2860.2861.1221.1220.5270.527(constant)(constant)
SignificanceSignificancettStandardized coefficientsStandardized coefficients
BetaBetaModelModel

29/01/200729/01/2007 2727
iv. Product diversification, will it assure future market forSouth Asian seafood industry? A case study of the South Asia

29/01/200729/01/2007 2828
ObjectivesObjectives
To estimate the degree of product diversification in south To estimate the degree of product diversification in south Asian seafood industry and comprises with regional, Asian seafood industry and comprises with regional, country wise and plant wise estimation of country wise and plant wise estimation of HerfindhalHerfindhalDiversity Index (HDI)Diversity Index (HDI)
To Identify the past, present and future trends of South To Identify the past, present and future trends of South Asian seafood marketAsian seafood market
Concepts: Concepts: Product diversityProduct diversity
Product diversity refers to the degree of relatedness Product diversity refers to the degree of relatedness among various product segments among various product segments ((JacqueminJacquemin and Berry, 1979) and Berry, 1979)
Measures: Measures: industry relatednessindustry relatedness
Locale of study : India, Pakistan, Bangladesh, Maldives and Locale of study : India, Pakistan, Bangladesh, Maldives and Sri LankaSri Lanka
Data: Customs records (2000 Data: Customs records (2000 –– 2003)2003)

29/01/200729/01/2007 2929
Method and findingsMethod and findings
HerfindhalHerfindhal Diversity IndexDiversity Index
Data: seafood export figures in 4 year (2000Data: seafood export figures in 4 year (2000--2003) period 2003) period
ii
H = H = ΣΣΣΣΣΣΣΣ PP22 ii
nn--1 1
Where Where Pi Pi is the proportion of theis the proportion of the i i thth product relative to the total exportsproduct relative to the total exports
ii
H = H = ΣΣΣΣΣΣΣΣ PP22I +PI +P22 B + PB + P22P +PP +P22S +PS +P22M M
nn--1 5 1 5
HerfindhalHerfindhal diversity index (HDI) for the region; where diversity index (HDI) for the region; where PIPI is HDI of is HDI of India,India, PBPBis HDI of is HDI of Bangladesh, PPBangladesh, PP is HDI of is HDI of Pakistan, PSPakistan, PS is HDI of is HDI of Sri LankaSri Lanka and and
PMPM is HDI of is HDI of MaldivesMaldives
The index: The index: 00 = complete diversification and = complete diversification and 11 = complete specialization= complete specialization
Measure the level of diversificationMeasure the level of diversification

29/01/200729/01/2007 3030
Country wise seafood exports (MT) and Diversity
0%
50%
100%
2000 2001 2002 2003
Years
MT
India Bangalad Sri Lanka Maldives Pakistan
0.402 0.38 0.31
6
0.286
0.41
0.38
0.37
0.48
0.37
0.39
0.38
0.31
0.45
0.35
0.34
0.35
0.22
0.41
0.26
0.23
0.32
0.22
0.41
0.25
0 0.5 1 1.5 2
India
Bangalad
Sri Lanka
Maldives
Pakistan
Herfindhal Div ersity Index
2000 2001 2002 2003

29/01/200729/01/2007 3131
0
0.1
0.2
0.3
0.4
0.5
HDI
2000 2001 2002 2003
Region w ise Herfindhal Diversity
Index for South Asia, 2000-2003
Regional scale major seafood exports (%) and
Diversity for South Asia, 2000-2003
0%
10%
20%
30%
40%
50%
60%
70%
80%
90%
100%
2000 2001 2002 2003
Years
Persentage
Shrimp Fish Cuttlefish Crab Dryfish Beachde sharkfin Other
0.451 0.411 0.364 0.313
Regional diversity index improvedFrom 0.402 in 2000 to 0.286 in 2003;
Most significant in India;Worst case is Maldives;
All exporting nations move towardspositively to the diversification
Degree of product diversity among individual plants was changed
slightly
�Small and medium sizeplants were less diverse
�In contrast largeplants were more diverse�Plants processing for
EU and USA wereless diverse than the Asian markets
including Japan

29/01/200729/01/2007 3232
v. The involvement of female labor in seafood processing in Sri Lanka: Impact of organizational fairness,
organizational commitment and supervisor evaluation on employee commitment

29/01/200729/01/2007 3333
ObjectivesObjectivesTo identify the socio economic background of the female laborersTo identify the socio economic background of the female laborers in in processing industryprocessing industry
To explore the impact of organizational fairness, organizationalTo explore the impact of organizational fairness, organizationalcommitment and supervisor evaluation on the female employee commitment and supervisor evaluation on the female employee commitment in seafood processing industrycommitment in seafood processing industry
ConceptsConcepts
Evaluation of supervisor Evaluation of supervisor -- The degree to which one supports or endorses a The degree to which one supports or endorses a leader leader ((SchappeSchappe, 1996; , 1996; AlecanderAlecander and and RudermanRuderman, 1987), 1987)
Organizational CommitmentOrganizational Commitment -- Measure of affective commitment an opposed to Measure of affective commitment an opposed to normative or continuance commitmentnormative or continuance commitment
Organizational Fairness/ Justice Organizational Fairness/ Justice ––
i. Distributive Justicei. Distributive Justice (Moorman, 1991; (Moorman, 1991; NiehoffNiehoff and and MorrmanMorrman 1983):1983): discriminantdiscriminant validity in validity in relation to job satisfactionrelation to job satisfaction
ii.Proceduralii.Procedural JusticeJustice (Moorman 1991):(Moorman 1991): Degree to which job decisions included Degree to which job decisions included mechanisms; employee voice and appeals processmechanisms; employee voice and appeals process
iii. Interactional Justiceiii. Interactional Justice ((LeventhalLeventhal, , KaruzanKaruzan and Fry (cf. Moorman, 1991) :and Fry (cf. Moorman, 1991) : Fairness of the Fairness of the interactions between manager and employee that enacted the formainteractions between manager and employee that enacted the formal l proceduresprocedures

29/01/200729/01/2007 3434
Materials and methodsMaterials and methods
Study location and sample: 50 randomly selected female employeesStudy location and sample: 50 randomly selected female employees of of
the 10 seafood processing firmsthe 10 seafood processing firms
Primary data Primary data -- Structured Questionnaire based on Structured Questionnaire based on LikertLikert typetype, seven, seven--
point response format, ranging from 1point response format, ranging from 1--Strongly disagree to 7Strongly disagree to 7--strongly strongly
agreeagree
Hypothesis TestingHypothesis Testing
H1 H1 -- Organizational Justice has positive impact on the organizationaOrganizational Justice has positive impact on the organizational l
commitment commitment
H2 H2 -- Supervisor evaluation has positive impact on the organizationalSupervisor evaluation has positive impact on the organizational
commitment (the degree of fairness of supervisor perceptcommitment (the degree of fairness of supervisor perception will ion will
affect the commitment measures)affect the commitment measures)
Measure the level of impactMeasure the level of impact

29/01/200729/01/2007 3535
FindingsFindingsSocio Economic characters of the sample:Socio Economic characters of the sample:
Majority of the employed women: age range 25Majority of the employed women: age range 25--29, un married and having 29, un married and having completed their secondary educationcompleted their secondary education
Female domination in lower grade jobs are high (Male: Female=2:1Female domination in lower grade jobs are high (Male: Female=2:10 in 0 in Prawn & 4: 10 in Tuna processing plants)Prawn & 4: 10 in Tuna processing plants)
Quality control and administrative gradeQuality control and administrative grade’’s ratio is 2:1 and CEO positions s ratio is 2:1 and CEO positions are overwhelmingly held by malesare overwhelmingly held by males
30.0019.002.7324.04Supervisor evaluation Scale
63.0041.006.7350.02Commitment scale
63.0041.006.7313.34Interactional Justice
23.009.004.1816.06Procedural Justice
33.0018.003.3725.02Distributive justice
Maximum scoreMinimum scoreSDMean score

29/01/200729/01/2007 3636
------0.670**0.626**0.509**0.608**Supervisor evaluation scale
------------0.407*0.607**Commitment scale
------0.655**------Interactional
Justice
------------Procedural Justice
------Distributive justice
Supervisor evaluation scale
Commitment scale
Interactional justice
Procedural Justice
Distributive justice
Bivariate Correlation between organizational fairness scales, supervisor evaluation scale
and commitment scores {**Correlation is significant at the 0.01 level (2-tailed)}
0.531*0.0920.399Organizational justice
BetaSEBB
•Multiple Regression Analysis for the affect of organizational fairness on commitment (p= 0.001)

29/01/200729/01/2007 3737
vi. Compliance on HACCP and export penetration: An empirical analysis of the seafood processing firms
in Sri Lanka

29/01/200729/01/2007 3838
ObjectivesObjectivesTo find out the impact of HACCP, level of sanitation, labor, capTo find out the impact of HACCP, level of sanitation, labor, capital and ital and traceability on export penetration of the seafood export businestraceability on export penetration of the seafood export businesss
To draw implications about the impact of food safety regulationsTo draw implications about the impact of food safety regulations(HACCP) on corporate success of seafood processors(HACCP) on corporate success of seafood processors
MethodologyMethodology
Study location Study location -- 50 seafood processing firms in South, West and North50 seafood processing firms in South, West and North--west west coast of Sri Lankacoast of Sri Lanka (26 EU approved establishments)(26 EU approved establishments)
Data collection tools Data collection tools –– Structured questionnaire, interviews, observationsStructured questionnaire, interviews, observations
Measures:Measures:
Status of HACCP: scale (0Status of HACCP: scale (0--3) and calculated by adding binary variables3) and calculated by adding binary variables
1 1 –– if the company responded positively or 0 otherwiseif the company responded positively or 0 otherwise
2 2 –– Company has participated HACCP trainingCompany has participated HACCP training
3 3 –– Company has implemented HACCP and documentationCompany has implemented HACCP and documentation
Level of sanitation was define by using Dummy variablesLevel of sanitation was define by using Dummy variables
SANI 1 SANI 1 –– Plant requires minor modificationPlant requires minor modification
SANI 2 SANI 2 –– Plant requires major modification Plant requires major modification
Construct the export penetration indexConstruct the export penetration index

29/01/200729/01/2007 3939
Theoretical frameworkTheoretical framework
Prices are function of the quality attributes, p = f (q). the fiPrices are function of the quality attributes, p = f (q). the firms supply rms supply
for Yi as function of quality attributes, inputs prices w, and ffor Yi as function of quality attributes, inputs prices w, and fixed inputs ixed inputs
k, k,
Yi = f (q, Yi = f (q, wiwi, k), k)
Dependent variable Yi is the quantity of the product sold in Dependent variable Yi is the quantity of the product sold in
international market i,international market i,
An export penetration index (EPI) defined by Featherstone and An export penetration index (EPI) defined by Featherstone and UhmUhm
(1993) is as follows;(1993) is as follows;
EPI = X/YEPI = X/Y
Where, X is the total export and Y is the total production Where, X is the total export and Y is the total production
The empirical model to be estimated is as follows (modified fromThe empirical model to be estimated is as follows (modified from
Zaibet,(2001);Zaibet,(2001);
EPI = f (HACCP, Sanitation, Labor, Capital, Traceability)EPI = f (HACCP, Sanitation, Labor, Capital, Traceability)

29/01/200729/01/2007 4040
Results of the OLS modelResults of the OLS model
0.0540.0541.9821.9820.4880.488TraceabilityTraceability
0.9900.990--0.0120.012--0.0010.001SANI 2SANI 2
0.1160.1161.6051.6050.2010.201SANI 1SANI 1
0.3280.3280.9900.9900.2130.213CapitalCapital
0.7710.7710.2930.2930.0540.054LaborLabor
0.2120.2121.2681.2680.2880.288HACCPHACCP
0.0000.0005.5045.5040.3770.377InterceptIntercept
SignificanceSignificance““tt”” statisticstatisticParameterParameterVariableVariable
0.1150.1150.7160.7160.7520.752bb0.8670.867aa11
StandardStandard
Error ofError of
EstimateEstimate
AdjustedAdjusted
RR22
RR22RRModelModel
a a –– Predictors: (constant), Traceability, Labor, SANI 1, SANI 2, CPredictors: (constant), Traceability, Labor, SANI 1, SANI 2, Capital, HACCP b apital, HACCP b –– Dependent VariableDependent Variable

29/01/200729/01/2007 4141
Correlations among variablesCorrelations among variables (Pearson correlation)(Pearson correlation)
0.5470.5470.2210.2210.867 0.867 ****0.785 0.785 ****TraceabilityTraceability
--0.3050.305--0.1300.130--0.707 0.707 ****--0.5870.587SANI 2SANI 2
--0.3200.320--0.2070.207--0.0430.043--0.0890.089SANI 1SANI 1
0.856 0.856 ****0.510 0.510 ****0.609 0.609 ****CapitalCapital
0.2280.2280.3680.368**LaborLabor
0.8240.824****HACCPHACCP
EPIEPI
CapitalCapitalLaborLaborHACCPHACCPEPIEPI
** Significance at 0.001 level (1- tailed) * Significance at 0.005 level (1-tailed)
� HACCP, Capital and traceability have high positive impact� Labor has little impact on export performance (EP)� SANI 1 and 2 has negative impact on export performance� All EU approved plants have their own HACCP plan for each product type� Exporters to Asian market have low interest on HACCP plan

29/01/200729/01/2007 4242
vii. Forefront of recovery: A sub sector analysis of the post tsunami seafood export industry in Sri Lanka

29/01/200729/01/2007 4343
ObjectivesObjectivesTo identify the impact of tsunami on seafood industry of Sri LanTo identify the impact of tsunami on seafood industry of Sri Lankaka
To formulate subTo formulate sub--sector analysis for the sustainable livelihood of the sector analysis for the sustainable livelihood of the stakeholders of the seafood industry of south of Sri Lankastakeholders of the seafood industry of south of Sri Lanka
ConceptsConcepts
Sustainable Livelihood Approach (SLA)Sustainable Livelihood Approach (SLA) andand SubSub--sector Analysis (SA)sector Analysis (SA)
Aim of the SA is examine more closely at the changes that have tAim of the SA is examine more closely at the changes that have taken aken place after the disaster place after the disaster
Livelihood assets pentagon is used as a visual tool to present Livelihood assets pentagon is used as a visual tool to present information about peopleinformation about people’’s access to assets and the interrelationshipss access to assets and the interrelationships
capital assets: human, social, physical, natural and financialcapital assets: human, social, physical, natural and financial
Evaluate the level of capital assets of fishers, traders and exEvaluate the level of capital assets of fishers, traders and exportport--processorsprocessors

29/01/200729/01/2007 4444
Methodology Methodology
Study locations Study locations -- 9 villages9 villages of three districts (Galle, of three districts (Galle, MataraMatara and and HambantotaHambantota ) of southern coastal province in summer 2005) of southern coastal province in summer 2005
stratified random sampling: 3 main strata (producers, traders, stratified random sampling: 3 main strata (producers, traders, exporters)exporters)
30 respondents from each stratum and 10 respondents for each 30 respondents from each stratum and 10 respondents for each stratum from each districtstratum from each district
Main data collection tool Main data collection tool -- the the structured questionnairestructured questionnaire
four point rating scalefour point rating scale was used to evaluate the statements under the was used to evaluate the statements under the each subeach sub--section of the questionnairesection of the questionnaire
Rating scales for positive statements were 3 Rating scales for positive statements were 3 -- high, 2 high, 2 -- medium, 1medium, 1-- low low and 0 and 0 -- not at all and vise versa for negative statementsnot at all and vise versa for negative statements
Fish producersFish producers –– 100% is male, 67% is married, 67% 100% is male, 67% is married, 67% -- G.C.E.O/L, 26% G.C.E.O/L, 26% --G.C.E. A/L, 90% permanent employeesG.C.E. A/L, 90% permanent employees
TradersTraders –– 94% is male, 76% is married, 40% 94% is male, 76% is married, 40% -- G.C.E.O/L, 27% G.C.E.O/L, 27% -- G.C.E. G.C.E. A/L, 63% permanent employeesA/L, 63% permanent employees
ExportersExporters –– 97% is male, 67% married, 20% 97% is male, 67% married, 20% -- G.C.E.O/L, 43% G.C.E.O/L, 43% -- G.C.E. G.C.E. A/L, 37% A/L, 37% -- graduate and diploma, 63% permanent employeesgraduate and diploma, 63% permanent employees
Findings

29/01/200729/01/2007 4545
An analysis of the subAn analysis of the sub--sector participants (mean scores)sector participants (mean scores)
1.831.831.831.831.231.23Livelihood strategies (Livelihood strategies (0 0 -- 33))
2.372.372.372.372.572.57Processes (Processes (0 0 -- 33))
2.372.372.372.372.032.03Institutions (Institutions (0 0 -- 33))
2.472.472.472.472.872.87Policies (Policies (0 0 -- 33))
1.831.831.841.841.371.37Seasonality (Seasonality (0 0 -- 33))
2.622.622.632.632.142.14Trends (Trends (0 0 -- 33))
2.672.672.672.672.722.72Shocks (Shocks (0 0 -- 33))
5.275.275.275.279.829.82Physical capital (Physical capital (0 0 -- 2424))
5.635.635.635.633.973.97Financial capital (Financial capital (0 0 --1818))
5.875.875.875.8711.4711.47Natural capital (Natural capital (0 0 --1212))
17.8417.8417.8117.8116.8316.83Social capital (Social capital (0 0 --2727))
6.436.436.436.436.176.17Human capital (Human capital (0 0 -- 1818))
ExportExport--
processorsprocessorsTradersTradersProducers/ Producers/
FishersFishersVariableVariable
(Possible Score)(Possible Score)

29/01/200729/01/2007 4646
Social relationships were severely damagedSocial relationships were severely damaged
Human capital: fishers, traders and exportHuman capital: fishers, traders and export--processors processors equalequal
Social capital: traders and exportSocial capital: traders and export--processors high but processors high but fishers lowfishers low
Physical capital: fishers very high compared to traders and Physical capital: fishers very high compared to traders and processorsprocessors
Financial capital: fishers very low compared to traders and Financial capital: fishers very low compared to traders and exportexport--processorsprocessors
Natural capital: Fishers high compared to traders and Natural capital: Fishers high compared to traders and exportexport--processorsprocessors
Establishment of 100m buffer zone made big burden to all Establishment of 100m buffer zone made big burden to all subsub--sector participantssector participants
Tsunami and itsTsunami and its’’ destruction were the biggest shockdestruction were the biggest shock
Unlimited and unmanaged distribution of fishing fleets and Unlimited and unmanaged distribution of fishing fleets and gear may cause extra pressure on fish stocks and can be gear may cause extra pressure on fish stocks and can be negative shock in long termnegative shock in long term
Policies and institutional changes made significant impact Policies and institutional changes made significant impact on fisheron fisher’’s livelihoods livelihood

29/01/200729/01/2007 4747
Japanese fish consumption,
production and trade trends, 1960-
2000
0
5
10
15
1960 1970 1980 1990 2000
Year
Volu
me o
f fish
(million T
ons)
Export Import Production Consumption
2. A case study of the seafood consumption trends in Japanese market

29/01/200729/01/2007 4848
Presentation chronology: Case study of the seafood Presentation chronology: Case study of the seafood consumption trends and consumer behavior in consumption trends and consumer behavior in
Japanese marketJapanese market
Consumer behavior on Imported vs domestic
seafood
Sushi consumptionTrends in Japanese
market

29/01/200729/01/2007 4949
Age
Gender
Level of
education
Occupation
Resident
environment
Foreign
Exposure
Attitudes,
values,
norms
Ethnocentricity
Consumer
characteristics
Characteristics of the ConsumerCharacteristics of the Consumer
Daniels and Radebaugh, 1998

29/01/200729/01/2007 5050
IIntention to purchasentention to purchase
Consumer
Characteristics
Features
Of
Imported
Seafood
Perceived
quality
Price
Country of
Origin
Other product
attributes (labeling,
packing,
promotion)
P
E
R
C
E
I
V
E
D
V
A
L
U
E
P
U
R
C
H
A
S
E
I
N
T
E
N
T
I
O
N
A
C
T
U
A
L
P
U
R
C
H
A
S
E
Proposed model

29/01/200729/01/2007 5151
i. Regional preferences in the Japanese seafood i. Regional preferences in the Japanese seafood consumption: An empirical analysis of consumer purchasing consumption: An empirical analysis of consumer purchasing
behavior on domestic behavior on domestic vsvs imported seafoodimported seafood

29/01/200729/01/2007 5252
ObjectivesObjectives
To compare the consumer evaluations of various attributes of seaTo compare the consumer evaluations of various attributes of seafood food products of imported products of imported vzvz domestic origindomestic origin
To analyze the regional variations in evaluation of domestic To analyze the regional variations in evaluation of domestic vzvzimported seafoodimported seafood
To explore the phenomenon of economic ethnocentrism and its effeTo explore the phenomenon of economic ethnocentrism and its effects cts on domestic purchasing behavioron domestic purchasing behavior
ConceptsConceptsCountry of originCountry of origin -- Country image is the overall perception of Country image is the overall perception of consumers form of products from a particular country consumers form of products from a particular country ((NagashimaNagashima (1970); (1970); Roth and Romeo (1992); Roth and Romeo (1992); ParameswaranParameswaran and and PisharodiPisharodi (1994)(1994)
EthnocentrismEthnocentrism -- The beliefs held by consumers about the The beliefs held by consumers about the appropriateness, indeed morality of purchasing foreign made prodappropriateness, indeed morality of purchasing foreign made products ucts ((AA’’dornodorno et al., (1950); et al., (1950); ShimpShimp and Sharma (1987)and Sharma (1987)
HypothesisHypothesis
H1 H1 -- Positive relationship between consumer ethnocentrism Positive relationship between consumer ethnocentrism and intention to buy domestically produced seafoodand intention to buy domestically produced seafood
H2 H2 -- Negative relationship between consumer ethnocentrism Negative relationship between consumer ethnocentrism and imported seafood product judgmentand imported seafood product judgment

29/01/200729/01/2007 5353
Study locations Study locations –– Hiroshima (126), Osaka(108) and Hiroshima (126), Osaka(108) and Tokyo (122)Tokyo (122)
SelfSelf--administered structured questionnaire & inadministered structured questionnaire & in--depth interviewsdepth interviews
Structure of the questionnaire: Part i = socioStructure of the questionnaire: Part i = socio--economic information, preferences of seafood economic information, preferences of seafood buying behaviorbuying behavior
Part ii: 10 item Part ii: 10 item Country of Origin ScaleCountry of Origin Scale(evaluations of various product attributes with (evaluations of various product attributes with respect to a seafood origin respect to a seafood origin ((ParameswaranParameswaran and and PasioliPasioli (1994)(1994)))
10 items of spread over 3 dimensions (general 10 items of spread over 3 dimensions (general country attributes, general product attributes and country attributes, general product attributes and specific product attributes) specific product attributes)
Country of Origin ScaleCountry of Origin Scale consisted of a 5 point consisted of a 5 point LikertLikert--scale where 1= not at all to 5 = most scale where 1= not at all to 5 = most appropriateappropriate

29/01/200729/01/2007 5454
Part iii Part iii –– 10 item CETSCALE (10 item CETSCALE (ShimpShimp and Sharma and Sharma
(1987)) and psychometrically validated a scale, (1987)) and psychometrically validated a scale,
which measures perceptions of the which measures perceptions of the
appropriateness of buying domestic appropriateness of buying domestic vzvz imported imported
seafood productsseafood products
Based on the composite scores (possible scores Based on the composite scores (possible scores
1010--50); respondents were categorized 50); respondents were categorized -- >10 >10 -- <29 <29
= low levels of consumer ethnocentrism, 30 = mid = low levels of consumer ethnocentrism, 30 = mid
level and >31 level and >31 -- <50 high level of consumer <50 high level of consumer
ethnocentrismethnocentrism
Measure consumer evaluation of product Measure consumer evaluation of product attributes and ethnocentricityattributes and ethnocentricity

29/01/200729/01/2007 5555
Frequently utilized product attributes and % of appearanceFrequently utilized product attributes and % of appearance
OriginOrigin
(58)(58)
PackagingPackaging
(32)(32)
ContentsContents
(63)(63)
PackagingPackaging
(61)(61)
OriginOrigin
(54)(54)
OriginOrigin
(42)(42)
TraceabilityTraceability
(68) (68)
Date of Date of
Expiry (52)Expiry (52)TraceabilityTraceability
(68)(68)
TraceabilityTraceability
(63)(63)
TraceabilityTraceability
(61)(61)
TraceabilityTraceability
(57)(57)
QualityQuality
(75)(75)
OriginOrigin
(57)(57)
Date of Date of
Expiry (76)Expiry (76)OriginOrigin
(74)(74)
Quality Quality
(color of (color of
flesh) flesh)
(69)(69)
Quality (color Quality (color
of eyes & of eyes &
gills) gills)
(74)(74)
Price (81)Price (81)Price (86)Price (86)OriginOrigin
(79)(79)
Date of Date of
Expiry (76)Expiry (76)Price (78)Price (78)Price (87)Price (87)
Date of Date of
Expiry (93)Expiry (93)QualityQuality
(92)(92)
Price (86)Price (86)Price (82)Price (82)Date of Date of
Expiry (100)Expiry (100)Date of Expiry Date of Expiry
(100)(100)
SmokedSmokedDried fishDried fishCannedCannedFrozenFrozenFreshFresh
(sliced)(sliced)
FreshFresh
(Whole fish)(Whole fish)

29/01/200729/01/2007 5656
Comparative analysis of COO effectsComparative analysis of COO effects
Hiroshima
0 0.5 1 1.5 2 2.5 3 3.5 4
Good reputation
HACCP certif ied
Traceability
Quality of packing
Sold in many countries
Imported Domestic
Osaka
0 1 2 3 4 5
Good reputation
HACCP certif ied
Traceability
Quality of packing
Sold inmany countries
Imported Domestic
Tokyo
0 1 2 3 4 5
Good reputation
HACCP certif ied
Traceability
Quality of packing
Sold inmany countries
Imported Domestic
Cumulative sample
0 1 2 3 4 5
Good reputation
HACCP certif ied
Traceability
Quality of packing
Sold inmany countries
Imported Domestic

29/01/200729/01/2007 5757
Ethnocentrism and Domestic purchasing behaviorEthnocentrism and Domestic purchasing behavior
5.395.393838191927.0527.05OsakaOsaka
5.595.594848171726.8726.87CumulativeCumulative
6.196.194848171727.7027.70TokyoTokyo
5.25.23737181825.8525.85HiroshimaHiroshima
StandardStandard
DeviationDeviation
MaximumMaximumMinimumMinimumTotal Total
ethnocentricethnocentric
Score on the Score on the
CETSCALE CETSCALE
(mean)(mean)
LocationLocation

29/01/200729/01/2007 5858
ii. An analysis of demographic and behavioral patternsrelated to sushi consumption: A case study of the
Hiroshima Prefecture

29/01/200729/01/2007 5959
ObjectivesObjectives
To analyze Japanese consumersTo analyze Japanese consumers’’ sushi consumption sushi consumption
habitshabits
To find out the impact of demographic characteristics on To find out the impact of demographic characteristics on
sushi purchase decisions and attitudes towards sushisushi purchase decisions and attitudes towards sushi
To explore the strategic behavior of the sushi businesses To explore the strategic behavior of the sushi businesses
in Japanin Japan
MethodMethodLocation Location –– Hiroshima prefecture Hiroshima prefecture
Sample Sample –– 108 randomly selected consumers108 randomly selected consumers
Data collection tool Data collection tool –– structured questionnairestructured questionnaire
Sample profile Sample profile –– 57% female; 43% male; 85% married, 57% female; 43% male; 85% married,
age: 41age: 41--50 50 –– 26% and >51 26% and >51 –– 45%; education level 45%; education level -- 47% 47%
high school and 39% graduates; employment high school and 39% graduates; employment –– 43% 43%
fulltime and 39% part timefulltime and 39% part time
29/01/200729/01/2007 6060
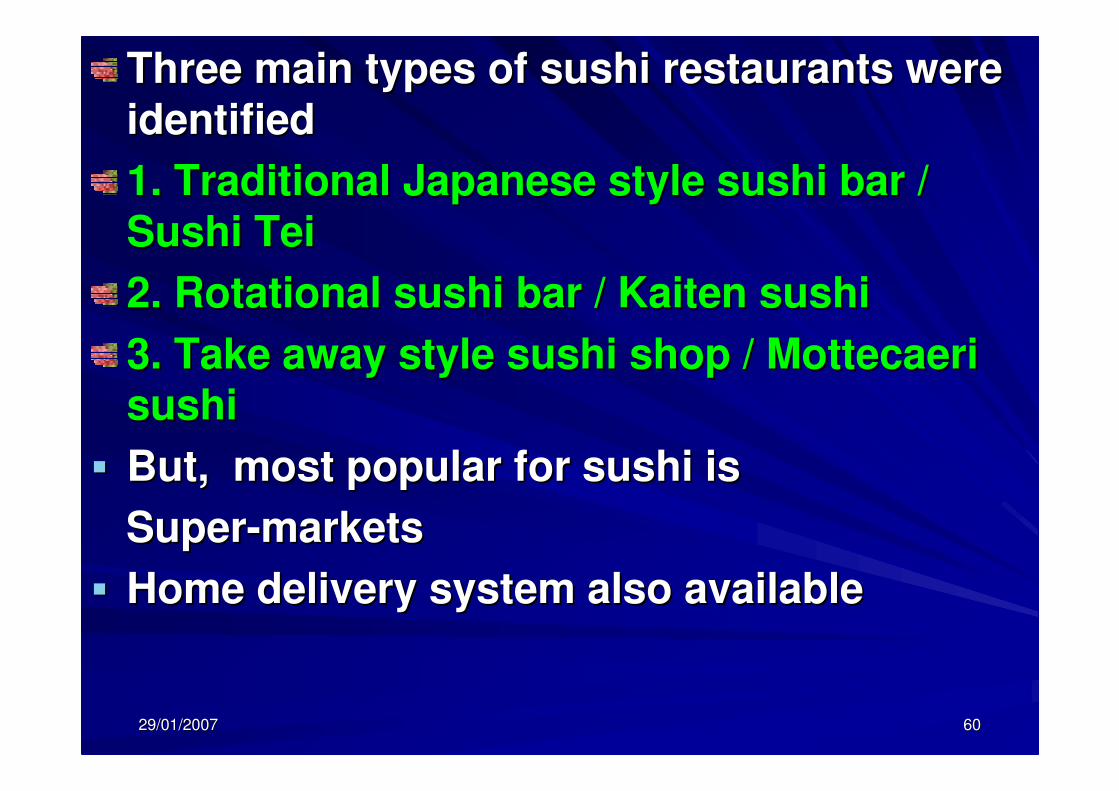
Three main types of sushi restaurants were Three main types of sushi restaurants were
identified identified
1. Traditional Japanese style sushi bar / 1. Traditional Japanese style sushi bar /
Sushi Sushi TeiTei
2. Rotational sushi bar / 2. Rotational sushi bar / KaitenKaiten sushisushi
3. Take away style sushi shop / 3. Take away style sushi shop / MottecaeriMottecaeri
sushi sushi
�� But, most popular for sushi is But, most popular for sushi is
SuperSuper--markets markets
�� Home delivery system also available Home delivery system also available

29/01/200729/01/2007 6161
0%10%20%30%40%50%60%70%80%90%
100%
Fem
ale
Mal
e
>51
41-5
0
31-4
0
21-3
0
<20
>8 times/Month 4-8 times/Month
once/Month No response
Frequency of sushi consumption by gender, education and civil status
0
10
20
30
40
50
60
70
Married Single Junior
High
School
High
School
University
Graduate
Post
Graduate
%
0
5
10
15
20
25
30
%
once/Month 4-8 times/Month

29/01/200729/01/2007 6262
0 10 20 30 40 50
Kaiten sushi
Tachi sushi
Mochicaeri sushi
Supermarket
Local shop
Other
%
Consumer preferencesWhen purchasing sushi
0
2
4
6
8
10
12
14
16
18
Birth Day New Year Holidays Weekends Weekdays
%
0
5
10
15
20
25
%
Male Female
Consumer preferencesOf sushi for differentOccasions by gender

29/01/200729/01/2007 6363
0
10
20
30
40
50
60
70
80
Tuna
Flatfi
sh Eel
Oct
opus
Sal
mon
Shr
imp
Squ
id
Cra
b
%
0
10
20
30
40
50
60
70
%
Most preferred Frequent purchase
0 20 40 60 80 100
Freshness
Price
Attractiveness
Different taste
No opinion
Domestic f ish
Special use
Nutrition
Personal expertise
Prestige
Value for money
Advertising
%
Most preferred and Frequently purchasing sushi
Factors affecting for the sushi purchase

29/01/200729/01/2007 6464
Technology and chain restaurants have changed the sushi Technology and chain restaurants have changed the sushi businessbusiness
Traditional sushi bars need strategies for dynamic marketTraditional sushi bars need strategies for dynamic market
Expansion of Rotational sushi bars; through chain Expansion of Rotational sushi bars; through chain operations, competitive pricing, applying original Japanese operations, competitive pricing, applying original Japanese menu concepts to a fast food format menu concepts to a fast food format
youth (between 21youth (between 21--30 years) prefer modern sushi 30 years) prefer modern sushi restaurants with special offerings restaurants with special offerings
Older age groups (>51 years) prefer traditional sushi Older age groups (>51 years) prefer traditional sushi restaurantsrestaurants
sushi is less prominent than other meals of ordinary sushi is less prominent than other meals of ordinary Japanese peopleJapanese people
The evolution of sushi restaurants is two pronged;The evolution of sushi restaurants is two pronged;
i. Fashionable clubi. Fashionable club--like restaurants like restaurants
ii.ii. Brightly lit family restaurantsBrightly lit family restaurants
Culinary crossCulinary cross--fertilization between east and west cuisine fertilization between east and west cuisine has created new combinations of sushihas created new combinations of sushi

29/01/200729/01/2007 6565
Conclusions: Case study of Sri LankaConclusions: Case study of Sri Lanka
Seafood industrySeafood industry’’s disproportionate importances disproportionate importance
Structural problems hurdle in the wayStructural problems hurdle in the way
Sri Lankan shrimp producers have greater comparative Sri Lankan shrimp producers have greater comparative advantage advantage
Critical problems for shrimp exports are international price Critical problems for shrimp exports are international price fluctuations, capital scarcity, poor distribution network, fluctuations, capital scarcity, poor distribution network, natural calamities, low value addition, poor infrastructure, natural calamities, low value addition, poor infrastructure, international regulationsinternational regulations
Future possibilities towards prepared and cooked mealsFuture possibilities towards prepared and cooked meals
Process and product innovation have positive impact on Process and product innovation have positive impact on export performance export performance
Public instruments have non significant impact on export Public instruments have non significant impact on export performance performance
Permanent and sporadic exporters suffer from the Permanent and sporadic exporters suffer from the obstacles outside the countryobstacles outside the country

29/01/200729/01/2007 6666
Conclusions (Conclusions (ctdctd.,).,)To overcome barriers To overcome barriers -- South Asian producers have to South Asian producers have to diversify both markets and product mix diversify both markets and product mix
Joint venture between India, Sri Lanka and Maldives to Joint venture between India, Sri Lanka and Maldives to mobilize common resourcesmobilize common resources
Supervisor evaluation has positive impact on Supervisor evaluation has positive impact on organizational commitmentorganizational commitment
Organizational fairness is influencing trust in management, Organizational fairness is influencing trust in management, intention to stay or leave, evaluations of supervisors, intention to stay or leave, evaluations of supervisors, conflict/harmony and job satisfactionconflict/harmony and job satisfaction
Commitment improves the motivation, creativity, and Commitment improves the motivation, creativity, and satisfaction of workerssatisfaction of workers
The level of HACCP compliance, no. of employees, capital, The level of HACCP compliance, no. of employees, capital, and traceability positively correlated to the export and traceability positively correlated to the export penetration indexpenetration index
sanitation (SANI 1 and 2) negatively correlated to the EPIsanitation (SANI 1 and 2) negatively correlated to the EPI

29/01/200729/01/2007 6767
India, Pakistan and Sri Lanka have a strong India, Pakistan and Sri Lanka have a strong
position in implementing HACCP and others position in implementing HACCP and others
are progressingare progressing
SubSub--sector analysis: overall capital building sector analysis: overall capital building
capacity of traders and export processors capacity of traders and export processors
were better than the fisherswere better than the fishers
Policy changes and institutions have Policy changes and institutions have
negative impact on fishernegative impact on fisher’’s social capital s social capital
buildingbuilding
Better livelihood strategies of exportBetter livelihood strategies of export--
processors help to rehabilitate faster processors help to rehabilitate faster
compared with producers and traderscompared with producers and traders
Conclusions (Conclusions (ctdctd.,).,)

29/01/200729/01/2007 6868
Cultural sensitivity and ethnocentrism havenCultural sensitivity and ethnocentrism haven’’t direct t direct impact on consumer evaluations and evaluation based on impact on consumer evaluations and evaluation based on product attributes product attributes
Importers have to pay much attention on product attributes Importers have to pay much attention on product attributes rather than cultural barriers and domestic producers have rather than cultural barriers and domestic producers have to improve the level of product attributesto improve the level of product attributes
consumer ethnocentrism and intention to buy domestic consumer ethnocentrism and intention to buy domestic seafood has positive relationshipseafood has positive relationship
Sushi consumption patterns in Japan seem to closely Sushi consumption patterns in Japan seem to closely reflect the evolution of the householdreflect the evolution of the household’’s life cycles life cycle
sushi is consumed once a month as an sushi is consumed once a month as an ‘‘expensive treatexpensive treat’’for special occasions for special occasions
Older age females prefer sushi meals mostOlder age females prefer sushi meals most
Ready to eat sushi packs of supermarkets are convenient, Ready to eat sushi packs of supermarkets are convenient, and economical and price conscious consumers prefer and economical and price conscious consumers prefer supermarkets mostsupermarkets most
Conclusions: Case study of consumer behavior of Conclusions: Case study of consumer behavior of Japanese marketJapanese market

29/01/200729/01/2007 6969
Suggestions: Case study of the seafood industry of Sri Suggestions: Case study of the seafood industry of Sri LankaLanka
Diversification of markets and productsDiversification of markets and products
value addition and value creation effortsvalue addition and value creation efforts
Market oriented product mix for JustMarket oriented product mix for Just--in in ––time time purchasepurchase
Strengthen the market infrastructure and Strengthen the market infrastructure and supportive services (public instruments)supportive services (public instruments)
Tap the regional market through SAFTATap the regional market through SAFTA
Fair treatment for employees and rewards should Fair treatment for employees and rewards should based on employee commitmentbased on employee commitment
Rehabilitation should based on Rehabilitation should based on ““need analysisneed analysis””
Vertical cooperation and integration among the Vertical cooperation and integration among the stake holders in seafood production marketing stake holders in seafood production marketing chainchain
Strengthen the local entrepreneurs in fisheriesStrengthen the local entrepreneurs in fisheries

29/01/200729/01/2007 7070
Suggestions: Case study of consumer behavior in Suggestions: Case study of consumer behavior in the Japanese seafood marketthe Japanese seafood market
Low ethnocentric Japanese market Low ethnocentric Japanese market
demanding quality, regular supplies, Valued, demanding quality, regular supplies, Valued,
unique convenience seafood mealsunique convenience seafood meals
Domestic seafood suppliers have to be Domestic seafood suppliers have to be
competitive with international suppliescompetitive with international supplies
Sushi bars have to cater the demand of both Sushi bars have to cater the demand of both
young and Aging populationyoung and Aging population
Campaigning to improve consumer knowCampaigning to improve consumer know--
how on food safety and labeling is essentialhow on food safety and labeling is essential

29/01/200729/01/2007 7171
Thank you very much for being here to share Thank you very much for being here to share Thank you very much for being here to share Thank you very much for being here to share my research experiencesmy research experiencesmy research experiencesmy research experiences


![D.A.M. Catalogo 2012 (Part.1) [HK-En]](https://img.pdfslide.net/doc/110x75/568c49941a28ab491694b50d/dam-catalogo-2012-part1-hk-en.jpg)