Embed Size (px)
DESCRIPTION
Statistical Methods, part 1 Module 2: Latent Class Analysis of Survey Error Models for measurement errors. Dan Hedlin Stockholm University November 2012 Acknowledgement: Paul Biemer. The most interesting error. Ŷ – Y - PowerPoint PPT Presentation
Citation preview
Statistical Methods, part 1Module 2: Latent Class Analysis of
Survey ErrorModels for measurement errors
Dan HedlinStockholm University
November 2012Acknowledgement: Paul Biemer

Stockholm University, autumn semester 2012
2
The most interesting error
• Ŷ – Y• That is, the difference between estimate and
what you desire (truth, value obtained with the ideal method, population parameter, or however the desired aim is envisaged)
• Is this difference regularly published?• What is the established term for this
difference?

Stockholm University, autumn semester 2012
3
Why variance?
• Why do we base our statistical theories on concepts like variance, bias etc, which are advanced constructs?
Stockholm University, autumn semester 2012
4
Why in this course?
• Measurement errors can rarely be observed• You have to draw conclusions (make
inference) about something unobservable• Models play a crucial role in this inference
process • Quantitative research usually faces
measurement errors• Rather neglected in practical work

Stockholm University, autumn semester 2012
5
Scenarios
1. True values/gold standard values of a random subsample of sample
2. Dependent or independent measurements of a random subsample of sample
3. One sample with several variables measured once, although with measurement error (most common and least favourable situation)
Stockholm University, autumn semester 2012
6
Gold standard
• Gold standard (error-free) measurements– In-depth reinterviews with probing– Assumption: error in second measurement is
negligible or relatively inconsequential– Record check studies– Direct observation (or close to it)– However, gold standard has sometimes been
shown to be ‘silver standard’ at best. See references in Biemer’s book, page 67
Stockholm University, autumn semester 2012
7
• Direct estimation of measurement bias requires true values or gold standard measurements
• If you have a sample of values with measurement errors, yi, and true scores for each, τi, then the difference yi -τi is like a new variable. The variance of the difference is the same as the variance of yi (why?)
Stockholm University, autumn semester 2012
8
Classical Test Theory
• The following pages describe the ‘classical test theory model’
• From psychometrics• No gold standard required• Used in surveys• In other applied areas of statistics other
models are more popular (ANOVA type of models)
Stockholm University, autumn semester 2012
9
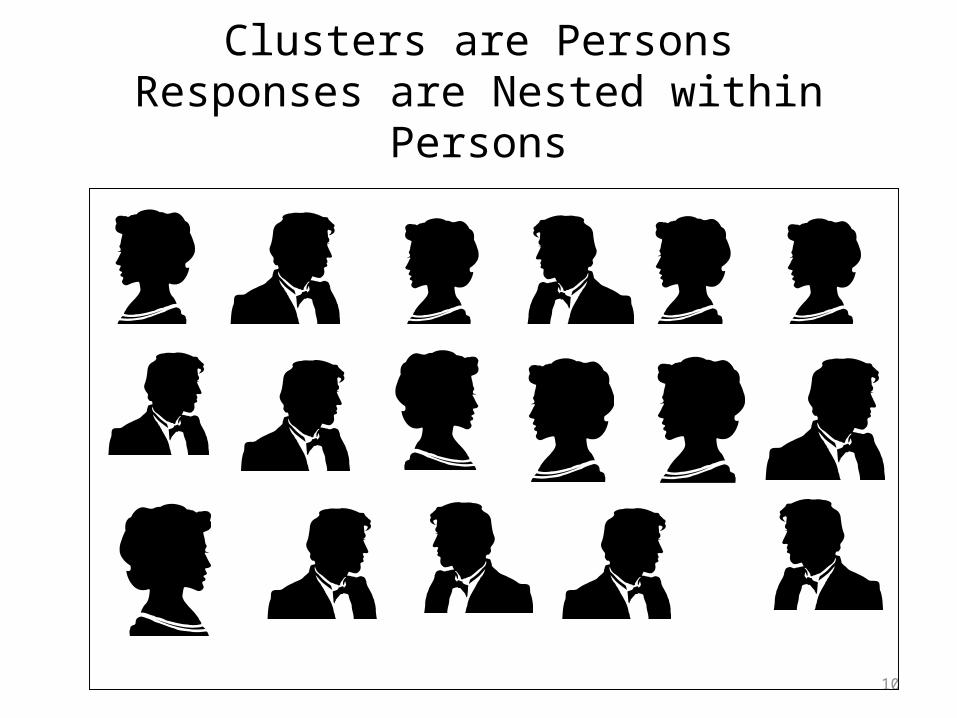
Conceptual Development
• Hypothetical distribution of responses for each individual in the population
• Individuals represent “clusters” of “potential” responses– Analogous to 2-stage sampling
• The response process is analogous to two-stage cluster sampling using SRS at each stage
• The first-stage design can be more complex than SRS, classical test theory will still be useful
10
Clusters are PersonsResponses are Nested within Persons
11
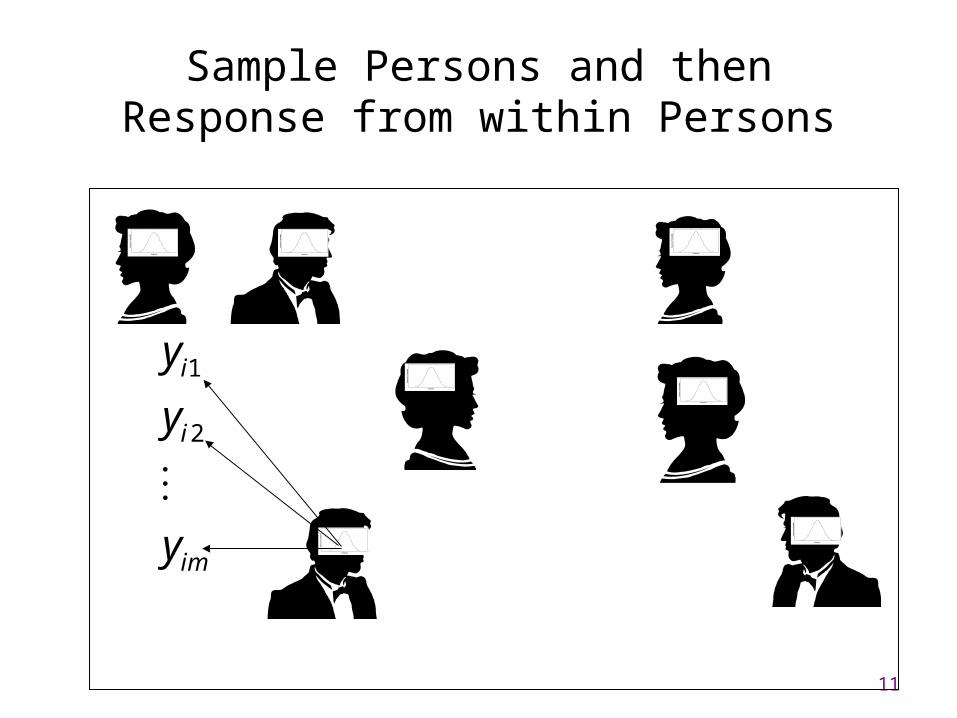
Sample Persons and then Response from within Persons
Response
Res
po
nse
Pro
bab
ilit
y
Response
Res
po
nse
Pro
bab
ilit
y
Response
Res
po
nse
Pro
bab
ilit
y
Response
Res
po
nse
Pro
bab
ilit
y
Response
Res
po
nse
Pro
bab
ilit
y
Response
Res
po
nse
Pro
bab
ilit
y
Response
Res
po
nse
Pro
bab
ilit
y
1
2
i
i
im
y
y
y
Stockholm University, autumn semester 2012
12
‘True score’
• Not the same true value• True score is average of responses from
individual i• Can be influenced by for example change of
mode of interview or by pictures on the questionnaire

Stockholm University, autumn semester 2012
13
• Individuals may be viewed as equal size clusters of potential responses to a question; i.e., Primary Sampling Units (PSUs)
• n = number of persons in the sample• m = number of observations made on each
person • A response to an interview question essentially
selects a response from an individual randomly and independently (m = 1 response)
• For an interview-reinterview survey, cluster sample size is m = 2
Stockholm University, autumn semester 2012
14
A Measurement Model Based Upon Two-Stage Cluster Sampling: “Census Bureau” Model
• First stage = individual in the population, i = 1, ..., N
• Second stage, infinite number of possible measurements (or trials) on the individual
• SRS at both stages (can be relaxed)• Negligible sampling fraction at second stage
(i.e., m/M <<1 or essentially unlimited number of hypothetical responses within person)
Stockholm University, autumn semester 2012
15
‘Parallel measures’
• All measurements (ie what people may say as an answer to a question) are indicators of the same construct (ie same variable)
• They are taken from the same distribution
• Then they are independent and identically distributed (iid). Tall order.

16
A Measurement Model Based Upon Two-Stage Cluster Sampling: “Census Bureau” Model (cont’d)
• Want to estimate
• where τi is average of the infinite number of responses from individual i
• (Well, we would have wanted the true value…)
N
iiY
1
17
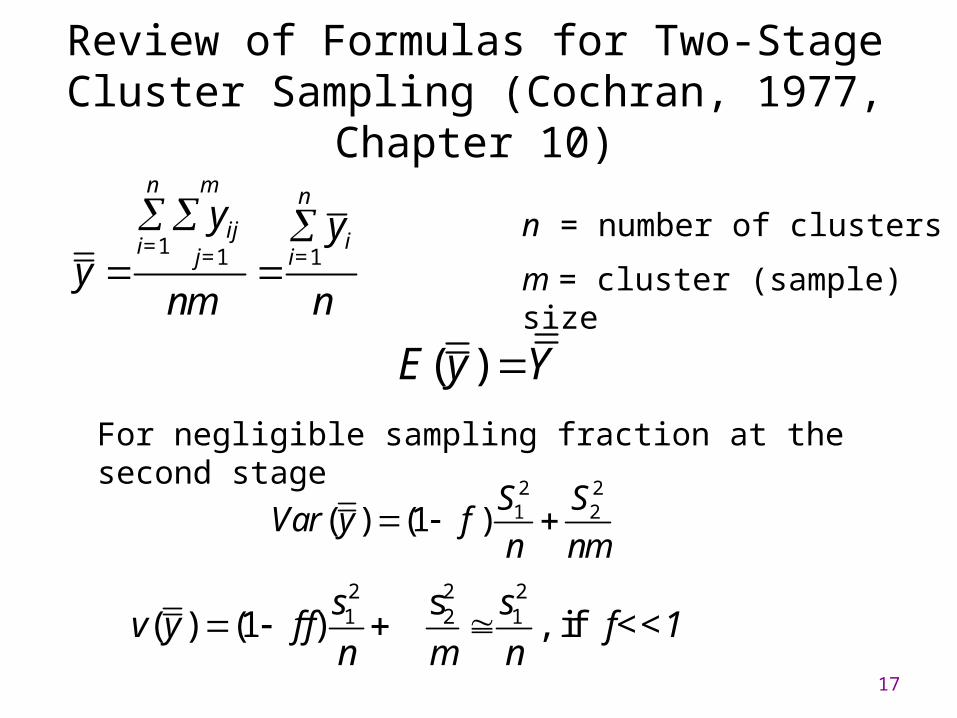
Review of Formulas for Two-StageCluster Sampling (Cochran, 1977, Chapter 10)
2 21 2( ) (1 )
S SVar y f
n nm
1 1 1
n m n
ij ii= j= i=
y yy
nm n
2 2 21 2 1s
( ) (1 ) , ifs s
v y f f f<<1n m n
For negligible sampling fraction at the second stage
n = number of clusters
m = cluster (sample) size
( )E y Y
18
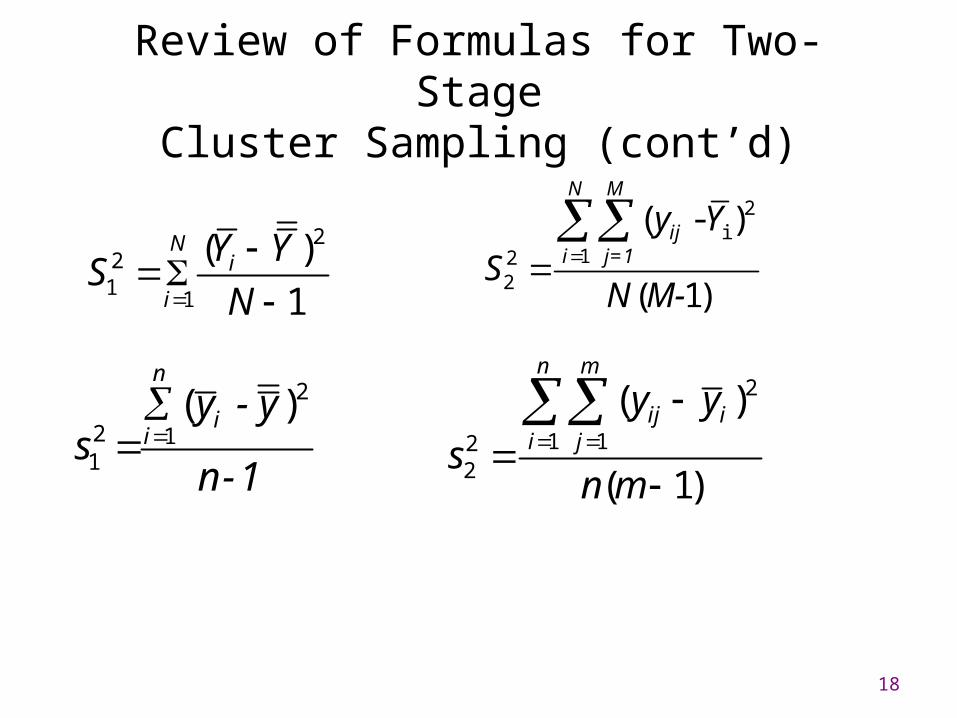
Review of Formulas for Two-StageCluster Sampling (cont’d)
2i
122
( - )
( 1)
N M
iji j=1
y Y
SN M-
2
21
1
( )
1
Ni
i
Y YS
N
2
2 11
( )n
ii
y - ys
n -1
2
1 122
( )
( 1)
n m
ij ii j
y y
sn m
19
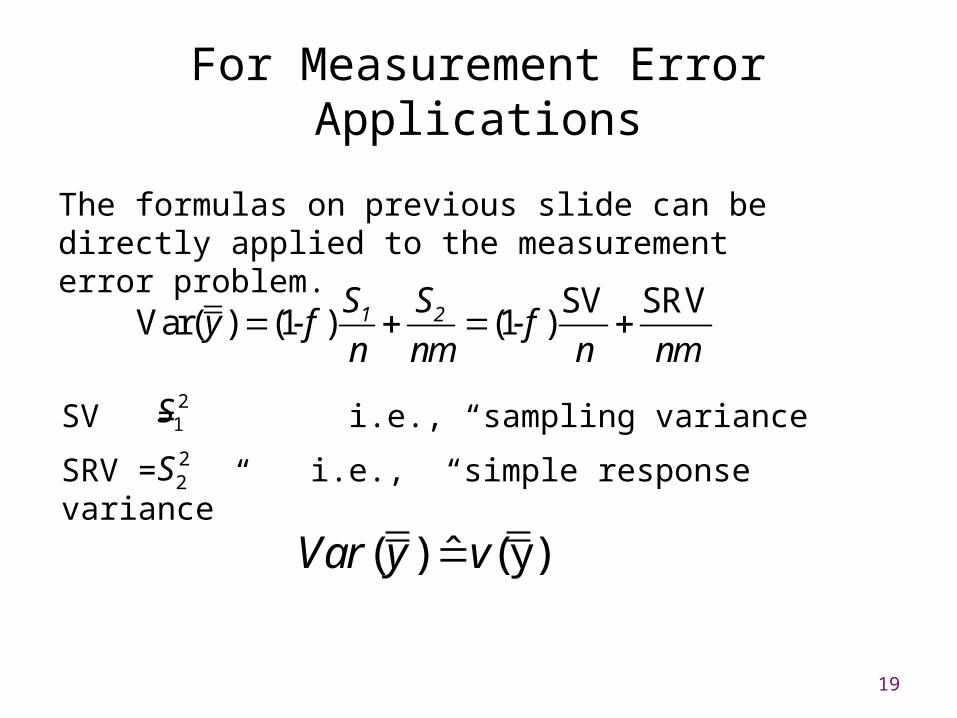
For Measurement Error Applications
SV SRVVar( ) (1 ) (1 )1 2S S
y -f -fn nm n nm
The formulas on previous slide can be directly applied to the measurement error problem.
( ) (y)ˆVar y v
SV = i.e., “sampling variance
SRV = i.e., “simple response variance”
21S22S
20
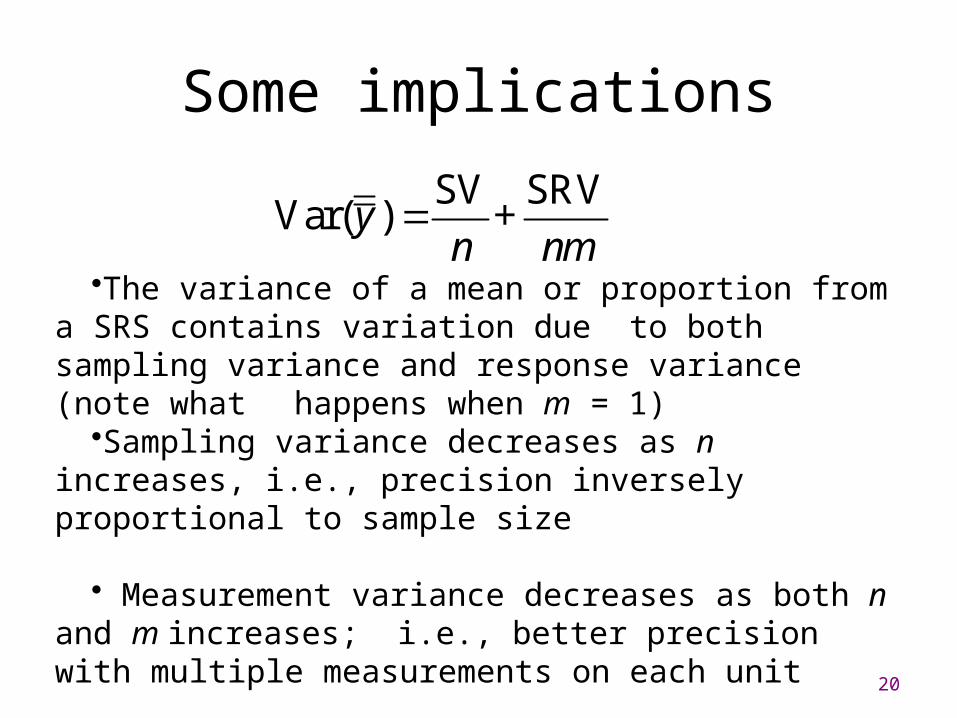
Some implications
SV SRVVar( )y +
n nm
•The variance of a mean or proportion from a SRS contains variation due to both sampling variance and response variance (note what happens when m = 1)
•Sampling variance decreases as n increases, i.e., precision inversely proportional to sample size
• Measurement variance decreases as both n and m increases; i.e., better precision with multiple measurements on each unit
21
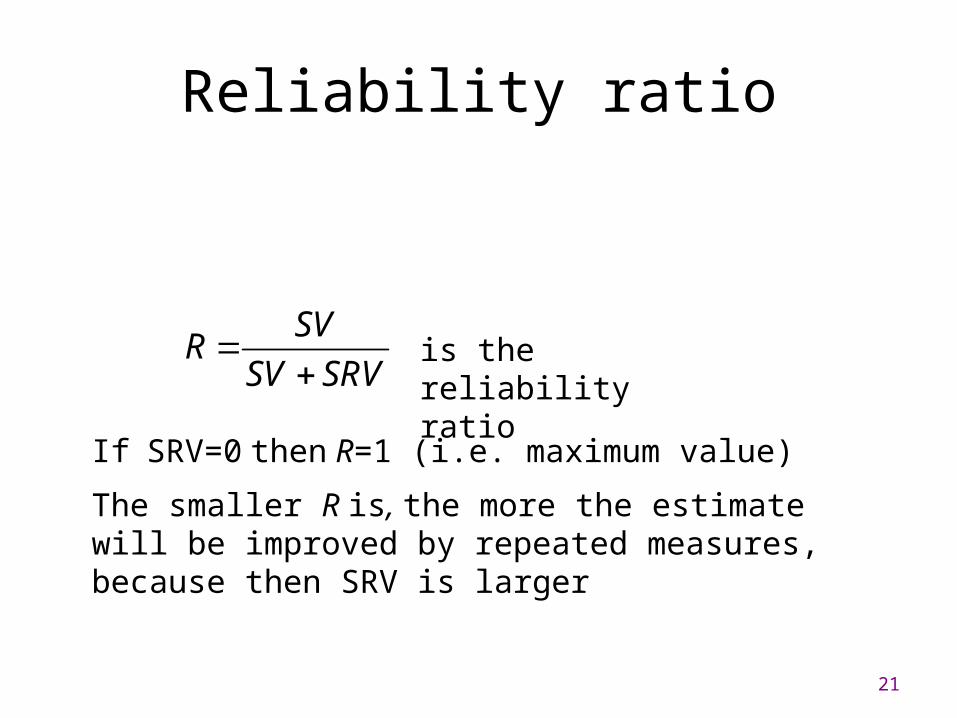
Reliability ratio
SVR
SV SRV
is the reliability ratio
If SRV=0 then R=1 (i.e. maximum value)
The smaller R is, the more the estimate will be improved by repeated measures, because then SRV is larger

22
Estimation of SRV
• Why do we want to estimate the SRV when this component is already accounted for in the usual estimate of Var(p)?– SRV increases Var(p)– SRV has implications for other analysis as well
E. g. measurement error may have implications for estimation of coefficients in some models

23
Special Formulas for Proportions
22
1
Ni i
i
PQS
N
22
1 1
( )
1
Ni
i
P PS
N
i ;; 1 ; 1 ;
; 1 ; ; 1
i i i
i i i i
P Y Q P P Y Q P
p y q p p y q p
2
2 11
( )n
ii
p ps
n -1
22
1( 1)
m
i ii
ms p q
n m

24
Total Mean Square Error of Pfor m = 1
2MSE( ) [Bias( )] Var( )p p p
2
2 22 1 2
Bias ( ) E ( )
Thus,
MSE ( ) ( ) Var ( )
( ) (1 )
p p
P
p P p
S SP f
n n
True proportion
Lack of validity

25
This can be rewritten as
2MSE( ) ( ) (1 )SV SRV
p P fn n

26
Estimation of Simple Response Variance (m=2)
1 2( )
2i i
i
y yp
Suppose m = 2 for all n (example: an interview followed by a reinterview for all cases)
Then,
It can be shown that
1 2 1 2[ ][1 ]2 2
i i i ii i
y y y yp q
21 2( )
4i i
i i
y yp q
2Hint : for dichotomous var iablesy y

27
21 2
1 1
( )
4
n ni i
i ii i
y yp q
2 22 1 2
1
1( )
2
n
i ii
SRV s y yn
28
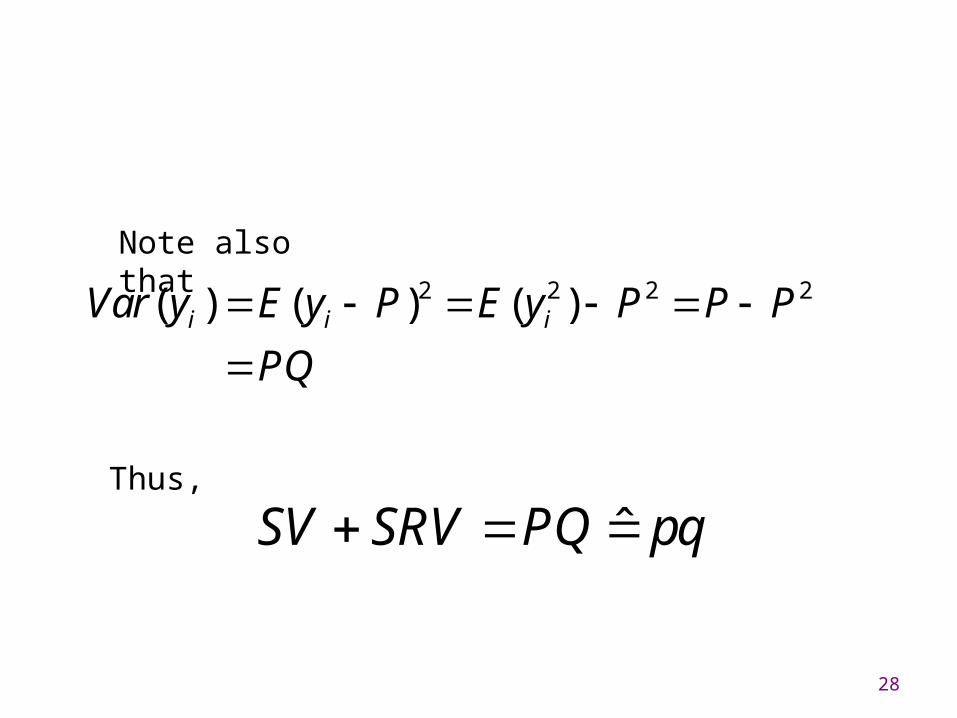
Note also that
2 2 2 2( ) ( ) ( )i i iVar y E y P E y P P P
PQ
Thus,
ˆSV SRV PQ pq
Stockholm University, autumn semester 2012
29
Some ‘science thinking’
• Is the model that the brain is a “random machine” realistic and credible?
• First, model misspecification, would that result in. As for the iid assumption, suppose the two measurements are correlated. How is the estimated variance affected?
• If the identical distribution assumption is violated?
Stockholm University, autumn semester 2012
30
• If the assumptions are mildly violated, is the test theory model useful anyway?