Embed Size (px)
Citation preview
104:704-712, 2010. First published Jun 10, 2010; doi:10.1152/jn.00767.2009 J NeurophysiolDaniel K. Freeman, Gilberto Graña and Christopher L. Passaglia
You might find this additional information useful...
53 articles, 22 of which you can access free at: This article cites http://jn.physiology.org/cgi/content/full/104/2/704#BIBL
including high-resolution figures, can be found at: Updated information and services http://jn.physiology.org/cgi/content/full/104/2/704
can be found at: Journal of Neurophysiologyabout Additional material and information http://www.the-aps.org/publications/jn
This information is current as of September 9, 2010 .
http://www.the-aps.org/.American Physiological Society. ISSN: 0022-3077, ESSN: 1522-1598. Visit our website at (monthly) by the American Physiological Society, 9650 Rockville Pike, Bethesda MD 20814-3991. Copyright © 2010 by the
publishes original articles on the function of the nervous system. It is published 12 times a yearJournal of Neurophysiology
on Septem
ber 9, 2010 jn.physiology.org
Dow
nloaded from
Retinal Ganglion Cell Adaptation to Small Luminance Fluctuations
Daniel K. Freeman, Gilberto Graña, and Christopher L. PassagliaDepartment of Biomedical Engineering, Boston University, Boston, Massachusetts
Submitted 19 August 2009; accepted in final form 8 June 2010
Freeman DK, Graña G, Passaglia CL. Retinal ganglion cell adap-tation to small luminance fluctuations. J Neurophysiol 104: 704–712,2010. First published June 10, 2010; doi:10.1152/jn.00767.2009. Toaccommodate the wide input range over which the visual systemoperates within the narrow output range of spiking neurons, the retinaadjusts its sensitivity to the mean light level so that retinal ganglioncells can faithfully signal contrast, or relative deviations from themean luminance. Given the large operating range of the visual system,the majority of work on luminance adaptation has involved logarith-mic changes in light level. We report that luminance gain controls arerecruited for remarkably small fluctuations in luminance as well.Using spike recordings from the rat optic tract, we show that ganglioncell responses to a brief flash of light are modulated in amplitude bylocal background fluctuations as little as 15% contrast. The time scaleof the gain control is rapid (�125 ms), at least for ON cells. The retinallocus of adaptation precedes the ganglion cell spike generator becauseresponse gain changes of ON cells were uncorrelated with firing rate.The mechanism seems to reside within the inner retinal network andnot in the photoreceptors, because the adaptation profiles of ON andOFF cells differed markedly. The response gain changes follow We-ber’s law, suggesting that network mechanisms of luminance adapta-tion described in previous work modulates retinal ganglion cellsensitivity, not just when we move between different lighting envi-ronments, but also as our eyes scan a visual scene. Finally, we showthat response amplitude is uniformly reduced for flashes on a modu-lated background that has spatial contrast, indicating that another gaincontrol that integrates luminance signals nonlinearly over space op-erates within the receptive field center of rat ganglion cells.
I N T R O D U C T I O N
A ubiquitous property of biological systems is adaptation,and as a consequence, much research is devoted to elucidatingthe biophysical mechanisms underlying the phenomenon andunderstanding its role in normal system function. A well-documented example is luminance adaptation (also known aslight adaptation), which increases or decreases the gain anddynamics of retinal neurons to maintain visual sensitivity andavoid response saturation as mean illumination level changes(Shapley and Enroth-Cugell 1984; Walraven et al. 1990). Themechanisms responsible for this sensitivity adjustment existboth within the photoreceptor cells (Dowling 1967; Perlmanand Norman 1998; Pugh et al. 1999; Schneeweis and Schnapf1999) and the retinal network (Cicerone and Green 1980; Dunnet al. 2007; Green and Powers 1982; Rushton and Westheimer1962). Another mechanism of sensitivity adjustment at work inthe retina is contrast adaptation. It modulates response gain anddynamics based on the variance of luminance in the scene (i.e.,contrast), regardless of the mean luminance level (Baccus andMeister 2002; Chander and Chichilnisky 2001; Kim and Rieke
2001; Manookin and Demb 2006; Shapley and Victor 1978;Smirnakis et al. 1997). The mechanism has processes that operateboth within and outside the classical receptive field of ganglioncells.
Although the evidence for luminance and contrast adaptationis ample and compelling, the extent to which the two mecha-nisms are physiologically distinct is not entirely clear. Lumi-nance adaptation is generally described as a logarithmic pro-cess, which normalizes local variations in incident light inten-sity by the ambient level so that the retinal output faithfullyrepresents the contrast of objects viewed in different lightingenvironments (Troy and Enroth-Cugell 1993). The process isoften modeled using a quasi-linear approach, in which theretinal response to a stimulus is specified by a spatiotemporalfilter that is parameterized by the steady-state retinal illumi-nance (Purpura et al. 1990;Smith et al. 2008). It is known,however, that retinal neurons integrate luminance adaptivesignals over a region of space about the size of their receptivefield center (Cleland and Enroth-Cugell 1968). Given the smallsize of the luminance adaptation pool, it has been suggestedthat the process might be recruited under constant illuminationconditions because head and eye movements across the visualscene would produce local fluctuations in mean light intensityover the retinal surface (Dunn and Rieke 2006). In support of theidea, the range of mean luminances within patches of naturalscenes about the size of ganglion cell receptive field centers wasfound to differ by a factor of 2 within regions of sky and a factorof 10 within foliage backlit by sky (Frazor and Geisler 2006).These ranges are substantial and, based on ganglion cell andgeniculate cell responses to luminance steps of similar amplitude(Mante et al. 2005; Wark et al. 2009; Yeh et al. 1996), they havethe potential to recruit light adaptive mechanisms.
The aim here was to evaluate the hypothesis with in vivorecordings from retinal ganglion cells and directly assess howmuch luminance variation is needed to produce measurablechanges in response gain. We show that rat ganglion cellsadapt to relatively small fluctuations in local light intensity(�15% contrast), which is remarkable for a system that oper-ates over several orders of magnitude. The sensitivity is com-parable to that reported for temporal contrast adaptation in theretina (Baccus and Meister 2002; Chander and Chichilnisky2001; Kim and Rieke 2001; Manookin and Demb 2006),raising the possibility that the phenomena may be the same orclosely related. We find that the luminance adaptive mecha-nism is distinct though from spatial mechanisms of contrastadaptation. Because both modulate ganglion cell responsive-ness, the two gain controls must act in concert under normalviewing conditions to dynamically shape the retinal output. Inaddition, we find differences in the adaptation profiles of ON
and OFF cells, implying that the gain changes occur downstreamof the photoreceptors, after the retinal signal is split into ON and
Address for reprint requests and other correspondence: C. L. Passaglia,Dept. of Biomedical Engineering, Boston Univ., 24 Cummington St., Room232, Boston, MA 02215 (E-mail: [email protected]).
J Neurophysiol 104: 704–712, 2010.First published June 10, 2010; doi:10.1152/jn.00767.2009.
704 0022-3077/10 Copyright © 2010 The American Physiological Society www.jn.org
on Septem
ber 9, 2010 jn.physiology.org
Dow
nloaded from
OFF pathways. This inner retinal component of luminanceadaptation is thus distinct from outer retinal components thatare also quite sensitive (Lankheet et al. 1993; Lee et al. 2003).Together, the findings show that receptoral and postreceptoralmechanisms of luminance gain control play an active role inthe dynamic encoding of visual scenes.
M E T H O D S
Physiological preparation
The experimental procedures have been described in detail else-where (Freeman et al. 2008). Briefly, adult Brown Norway rats wereanesthetized with an intraperitoneal injection of ketamine hydrochlo-ride (49 mg/kg) and xylazine (1 mg/kg) that was supplementedintravenously at 28.6 and 0.6 mg/kg/h, respectively, infused at a rateof 1.6 ml/h. The pupil was dilated with 1% atropine sulfate, and aclear contact lens was placed over the eye to protect the cornea fromdrying. The animal was positioned in a stereotaxic apparatus, and a5-mm hole was drilled in the skull over bregma. To prevent eyemovements, which would cause the location of the ganglion cellreceptive field to drift during the experiment, the animal was para-lyzed with an intravenous injection of 8 mg gallamine triethiodidesupplemented by a 24.3-mg/kg/h infusion. The animal was mechan-ically ventilated with room air at a rate that maintained end- tidal CO2
at a normal level. All procedures were approved by the BostonUniversity Animal Care and Use Committee.
Recording and visual stimulation
Custom-made tungsten-in-glass microelectrodes were used torecord extracellularly from rat retinal ganglion cell axons (Levick1972). The electrode was advanced into the brain through a protectiveguide tube located 0.5 mm anterior to bregma for optic chiasmrecording or 1.5 mm lateral to bregma for optic tract recording. Avideo monitor with 100-Hz frame rate (Multiscan 17se, Sony, 40.4 �30.2 cm) was placed 16 cm from the eye. The mean luminance was 26cd/m2, which is in the photopic range for rat (Cicerone and Green1980). Custom software controlled the monitor output using Matlab,LabView, and the Psychophysics Toolbox (Brainard 1997). Themonitor was gamma corrected to linearize the input-output relation-ship governing monitor intensity. Upon isolation of a single unit spiketrain, the receptive field was located and centered on the monitor.Spike times were recorded with a digital spike discriminator at 10 kHz(Acquisition Processor Module, FHC, Bowdoin, ME).
Cells were classified using previously described methods (Freemanet al. 2008). Briefly, ON- and OFF-center cells were determined fromtheir response to handheld wands. Cells having a center-surroundreceptive field structure and brisk response were identified as X- andY-like (Cleland and Levick 1974), whereas those with more complexreceptive field structure and a sluggish response were consideredW-like (Troy and Shou 2002). The latter were encountered tooinfrequently for inclusion. X- and Y-like cells were differentiatedusing a sinusoidal grating of high spatial frequency that reversedsinusoidally in contrast at 2 Hz. Unlike X cells, Y cells produce astrong second harmonic (F2) response for gratings that are too fine toelicit a modulated response (F1) from the center mechanism (Hoch-stein and Shapley 1976). Brisk cells that had a significant F2 response(F2 � F1) were therefore considered Y-like cells and those that didnot were considered X-like cells. Data for both cell types were pooledafter the results showed no clear differences between them.
The location of the receptive field center on the monitor wasdetermined using a 100% contrast bipartite field oriented verticallyand then horizontally. When the contrast border of the stimulus iscentered on the receptive field, alternating contrast produces no F1response in X-like cells and a pure F2 response in Y-like cells. Thesize of the receptive field center was estimated from the largest spot
diameter that gave an F1 response in the linear range of 5–10 imp/s(ips) to sinusoidal input of 2 Hz.
Probed-sinewave paradigm
The luminance of a spot overlaying the receptive field center wasmodulated sinusoidally in time at a given contrast (0–30%) andfrequency (0, 0.25, 1, 4 Hz), where contrast is defined as
CS �Lmax � Lmin
Lmax � Lmin� 100%
where Lmax is the maximum luminance and Lmin is the minimumluminance of the spot. The effect of the sinusoidal modulation onganglion cells sensitivity was probed using a 100-ms flash presentedat various temporal phases (0, 45, 90, 135, 180, 225, 270, and 315°),where 90° is the brightest phase and 270° is the darkest. Each flashwas presented 8–12 times in random order and consecutive flasheswere spaced �6 s apart. The contrast of the probe was defined as
CP �Lprobe � Lmean
Lmean� 100%
where Lmean is the mean luminance of the monitor. Probe contrast wasadjusted to give a response that is less than half-maximal and within thelinear range of the cell. ON cells were presented with bright flashes andOFF cells with dark flashes. The peak firing rate of probe responses wasmeasured after subtracting the cell’s response to sinusoidal modulationwith no flash. Probe responses on a modulated background were normal-ized by the control response to a probe on a constant gray background.The control flash was presented 10 times in 3-s intervals before and afterthe probed-sinewave stimulus to confirm that ganglion cell sensitivity didnot drift. The control response was measured as the peak firing rate minusthe resting rate. Firing rate was calculated with a 40-ms bin size andsmoothed with a 60-ms moving average window. For 0-Hz modulation,spot luminance was held for several seconds at the intensity levelspecified by each phase of the sinusoidal modulation, and sensitivity wasprobed at each phase in random order.
Probed split-sine paradigm
To assess the spatial integration of adaptive signals within the receptivefield center, the spot was split in half vertically, and each half wascountermodulated. The modulation waveform was a 0.25-Hz sinewave of25% contrast. Again, ganglion cell sensitivity was probed by flashing a100-ms spot before, during, and after background modulation. The flashstimulated both halves of the receptive field center equally. Probe re-sponse amplitude was measured with respect to the background rate,which equaled the resting rate in this case because the counter-phasemodulation centered on the receptive field produces no F1 response.
R E S U L T S
The threshold for luminance adaptation was studied in ratretinal ganglion cells with a probed-sinewave stimulus para-digm, in which the luminance of a small spot matched in sizeto the receptive field center of recorded cells was sinusoidallymodulated in time against a uniform gray background. Themean background luminance was the same for all experimentsand within the photopic range of the animal. For variousmodulation phases, the spot was flashed brighter for ON cells ordarker for OFF cells to probe for response adaptation. The flashinterval was always �3 s, because initial experiments showedthis gave independent probe responses. The stimulus paradigmhas several attractive features. First, it has frequently been usedin psychophysical studies, which have shown that a phase-
705RETINAL GANGLION CELL ADAPTATION
J Neurophysiol • VOL 104 • AUGUST 2010 • www.jn.org
on Septem
ber 9, 2010 jn.physiology.org
Dow
nloaded from
dependent modulation of flash sensitivity is indicative of lu-minance adaptation and a phase-independent reduction in sen-sitivity of contrast adaptation (Hood et al. 1997; Snippe et al.2000; Wolfson and Graham 2006). This facilitates interpreta-tion of our results, because the distinction between the pro-cesses blurs when small luminance fluctuations are involved. Italso facilitates comparisons of our results to humans. Second,the probed-sinewave paradigm avoids onset and offset tran-sients that can obscure responses to the probe stimulus ifbackground luminance were stepped up and down. Third, itconfines the adaptive signal to the receptive field center,isolating the actions of local luminance gain controls from thepotentially confounding effects of contrast gain controls in theextraclassical receptive field of retinal ganglion cells (Enroth-Cugell and Jakiela 1980; Passaglia et al. 2001, 2009).
Adaptation to local luminance fluctuations
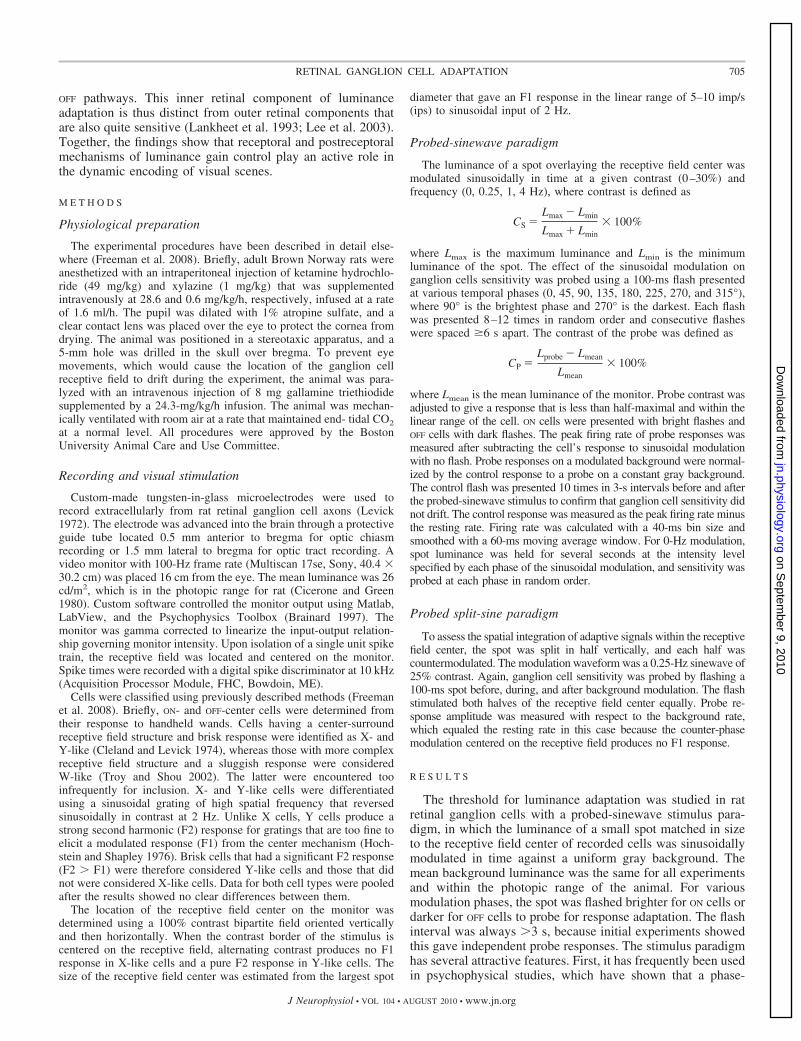
Figure 1 shows the effect of local luminance fluctuations on thesensitivity of a typical ON cell. The modulation waveform in thiscase was a 0.25-Hz sinewave of 35% contrast. The baselinesensitivity of the cell (Rcontrol) was measured before and after thestimulus paradigm by flashing the spot against the unmodulatedgray background (Fig. 1A). Flash contrast was fixed at 50% or lessrelative to this background so that probe responses were in thelinear range of the cell based on measured contrast responsefunctions (Fig. 1B). Data were excluded from analysis if Rcontrolshowed drift. Probed-sinewave responses (Rsine) were quantifiedby subtracting the response to background modulation without
flashes (Fig. 1C). The ratio of the two measurements (Rsine/Rcontrol) defined the change in response gain of the cell, whichdepended on the phase of flash presentation with respect to thelocal background modulation (Fig. 1D). The flash response grewby �30% when spot intensity decreased and shrank by roughlythe same amount when spot intensity increased. This nonlinearbehavior is indicative of a luminance adaptive process, which isknown to counteract increases in light intensity with decreases inresponse gain and vice versa. The data show that the process issensitive enough to modulate ganglion cell responsiveness evenwhen local luminance fluctuates by a fraction of a log unit andscene luminance is basically constant.
It may be noted that flash contrast is defined here relative tothe ambient light intensity. If flash contrast were insteaddefined relative to the instantaneous local luminance, it wouldnot be constant. It too would vary sinusoidally in time. Thisraises an alternative interpretation of the results, which is thatflash responses got smaller when spot intensity increased andlarger when intensity decreased because flash contrast varied,and ganglion cells are known to act as contrast detectors. Thisinterpretation does not, however, detract from the conclusionthat spot modulation caused light adaptation. The system muststill adapt to local luminance for flashes containing the samenumber of photons to produce responses of different size.
Sensitivity of luminance adaptation to stimulus contrast
The contrast of the sinewave was altered to determine thethreshold amount of background modulation needed to measur-
FIG. 1. A: the response of an ON cell to a100-ms flash (averaged over 10 presenta-tions) on a uniform gray background pre-sented both before (gray line) and after(dashed line) the probed sinwave stimulus.The average of these 2 responses (solid line)is used to estimate the amplitude of thecontrol flash response (Rcontrol). B: the re-sponse to a sinusoidally oscillating spot of35% contrast and 0.25-Hz frequency (dashedline) and the response to the same sinusoidwith a 100-ms flash presented at a phase of315° (3.5 s) (solid line). Flash response ampli-tude is quantified as Rsine. Above each re-sponse in A and B is an illustration of thestimulus. C: average response to 100 msflashes of varying contrasts for ON cells (whitecircles, n � 6) and OFF cells (dark circles, n �6). Response is normalized to the response at100% contrast. D: response gain, or sensitivity,of the ganglion cell as estimated by the ampli-tude of the flash response presented at variousphases of the sinusoid relative to the control(Rsine/Rcontrol).
706 D. K. FREEMAN, G. GRAÑA, AND C. L. PASSAGLIA
J Neurophysiol • VOL 104 • AUGUST 2010 • www.jn.org
on Septem
ber 9, 2010 jn.physiology.org
Dow
nloaded from
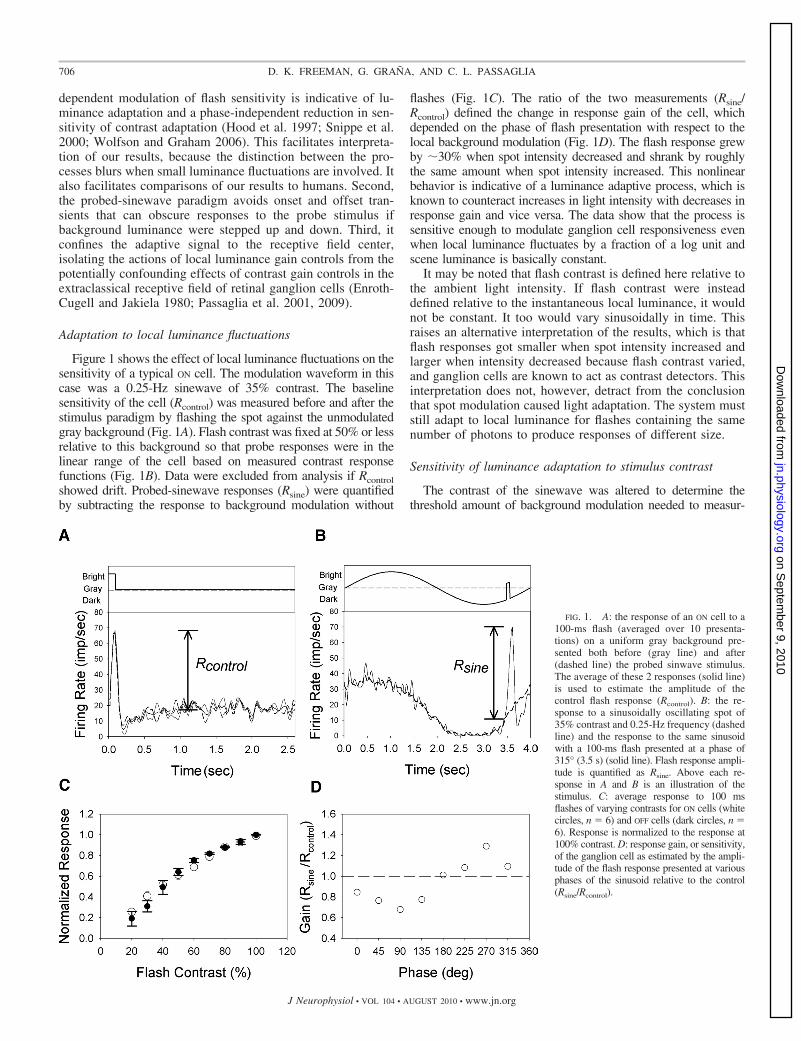
ably activate the luminance gain control, and the results wereaveraged across all ON cells (n � 7 for 5% contrast, n � 8 for 15and 25%, n � 9 for 35%). No change in response gain wasdetectable at 5% contrast, but the gain varied significantly above andbelow the baseline level for contrasts of 15% and higher (Fig. 2).These contrasts are within the threshold range for evoking aresponse from rat ganglion cells (Fig. 1B). Across the cell popu-lation, flash response amplitude was consistently reduced forphases that the spot was brighter than gray (45–135°) and en-hanced for phases that the spot was darker than gray (225–315°).For the highest contrasts, the response enhancement was under-estimated for certain dark phases as the modulated rate of some ON
cells fell to zero (Fig. 4). That such low contrasts not only affectedresponse gain but increased the gain for some phases makes itunlikely that static nonlinearities like spike rate clipping or satu-ration were involved. The data also provide little evidence forcontrast adaptation. Such a process would suppress probe re-sponses at all phases (Hood et al. 1997; Wu et al. 1997), butadaptation profiles appear fairly symmetric about the unity gainline at low contrast and are not centered markedly below.
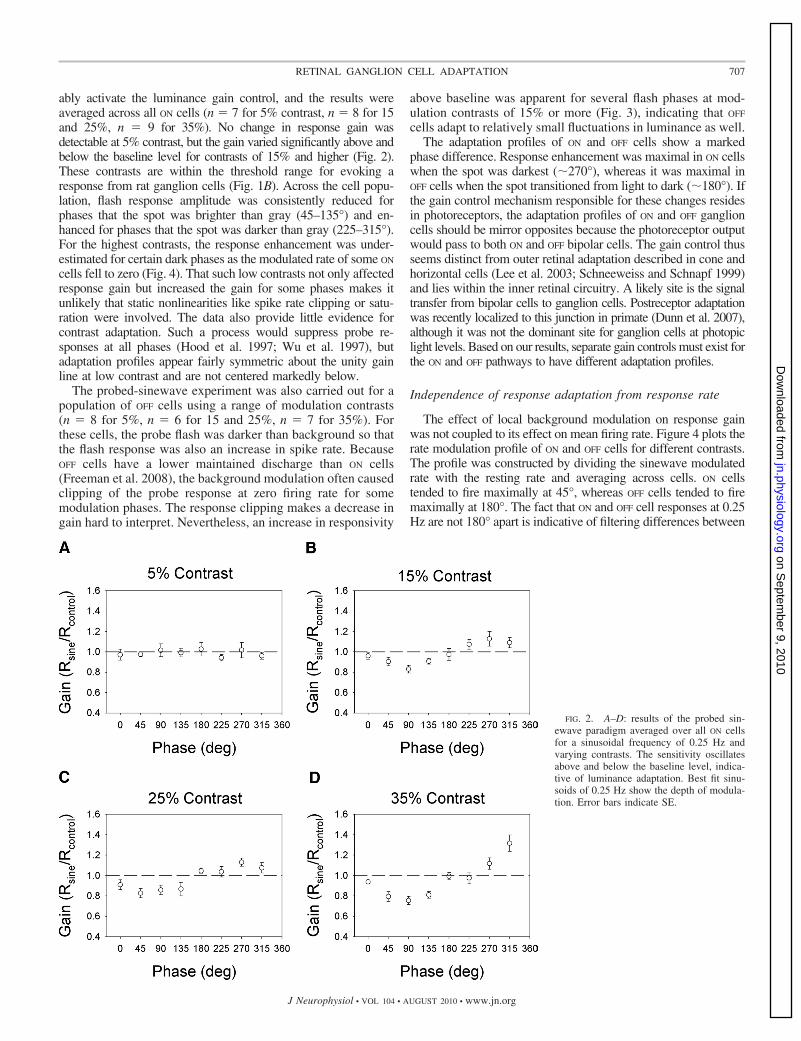
The probed-sinewave experiment was also carried out for apopulation of OFF cells using a range of modulation contrasts(n � 8 for 5%, n � 6 for 15 and 25%, n � 7 for 35%). Forthese cells, the probe flash was darker than background so thatthe flash response was also an increase in spike rate. BecauseOFF cells have a lower maintained discharge than ON cells(Freeman et al. 2008), the background modulation often causedclipping of the probe response at zero firing rate for somemodulation phases. The response clipping makes a decrease ingain hard to interpret. Nevertheless, an increase in responsivity
above baseline was apparent for several flash phases at mod-ulation contrasts of 15% or more (Fig. 3), indicating that OFF
cells adapt to relatively small fluctuations in luminance as well.The adaptation profiles of ON and OFF cells show a marked
phase difference. Response enhancement was maximal in ON cellswhen the spot was darkest (�270°), whereas it was maximal inOFF cells when the spot transitioned from light to dark (�180°). Ifthe gain control mechanism responsible for these changes residesin photoreceptors, the adaptation profiles of ON and OFF ganglioncells should be mirror opposites because the photoreceptor outputwould pass to both ON and OFF bipolar cells. The gain control thusseems distinct from outer retinal adaptation described in cone andhorizontal cells (Lee et al. 2003; Schneeweiss and Schnapf 1999)and lies within the inner retinal circuitry. A likely site is the signaltransfer from bipolar cells to ganglion cells. Postreceptor adaptationwas recently localized to this junction in primate (Dunn et al. 2007),although it was not the dominant site for ganglion cells at photopiclight levels. Based on our results, separate gain controls must exist forthe ON and OFF pathways to have different adaptation profiles.
Independence of response adaptation from response rate
The effect of local background modulation on response gainwas not coupled to its effect on mean firing rate. Figure 4 plots therate modulation profile of ON and OFF cells for different contrasts.The profile was constructed by dividing the sinewave modulatedrate with the resting rate and averaging across cells. ON cellstended to fire maximally at 45°, whereas OFF cells tended to firemaximally at 180°. The fact that ON and OFF cell responses at 0.25Hz are not 180° apart is indicative of filtering differences between
FIG. 2. A–D: results of the probed sin-ewave paradigm averaged over all ON cellsfor a sinusoidal frequency of 0.25 Hz andvarying contrasts. The sensitivity oscillatesabove and below the baseline level, indica-tive of luminance adaptation. Best fit sinu-soids of 0.25 Hz show the depth of modula-tion. Error bars indicate SE.
707RETINAL GANGLION CELL ADAPTATION
J Neurophysiol • VOL 104 • AUGUST 2010 • www.jn.org
on Septem
ber 9, 2010 jn.physiology.org
Dow
nloaded from
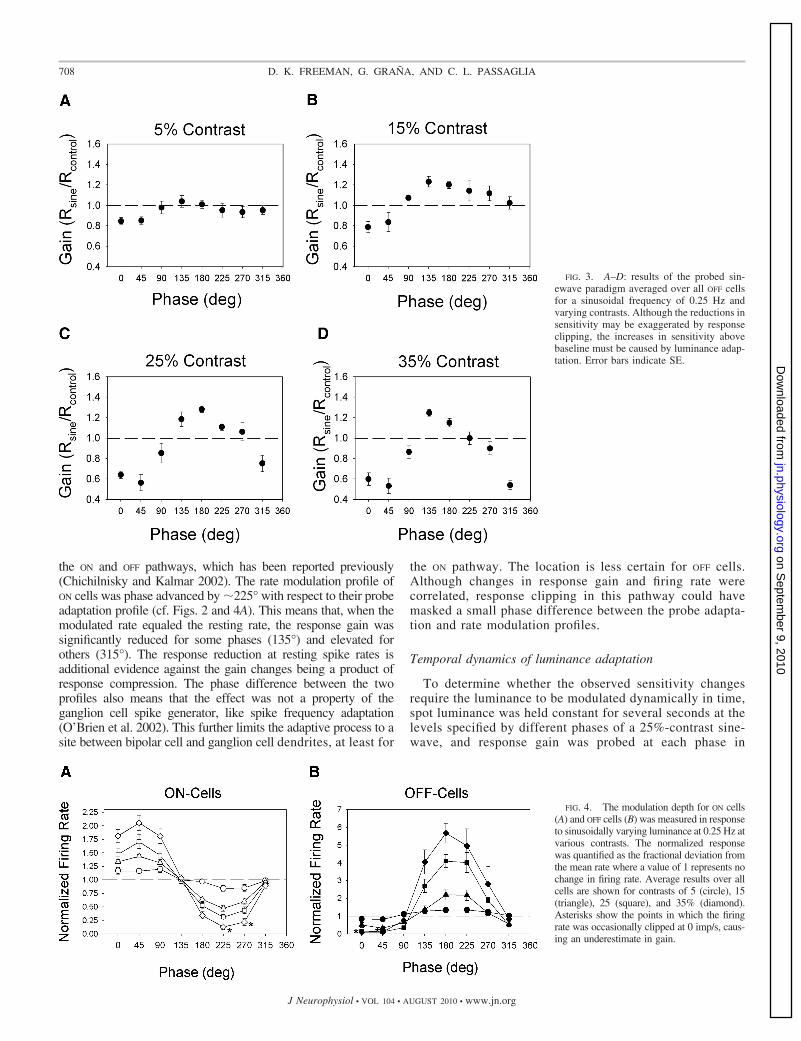
the ON and OFF pathways, which has been reported previously(Chichilnisky and Kalmar 2002). The rate modulation profile ofON cells was phase advanced by �225° with respect to their probeadaptation profile (cf. Figs. 2 and 4A). This means that, when themodulated rate equaled the resting rate, the response gain wassignificantly reduced for some phases (135°) and elevated forothers (315°). The response reduction at resting spike rates isadditional evidence against the gain changes being a product ofresponse compression. The phase difference between the twoprofiles also means that the effect was not a property of theganglion cell spike generator, like spike frequency adaptation(O’Brien et al. 2002). This further limits the adaptive process to asite between bipolar cell and ganglion cell dendrites, at least for
the ON pathway. The location is less certain for OFF cells.Although changes in response gain and firing rate werecorrelated, response clipping in this pathway could havemasked a small phase difference between the probe adapta-tion and rate modulation profiles.
Temporal dynamics of luminance adaptation
To determine whether the observed sensitivity changesrequire the luminance to be modulated dynamically in time,spot luminance was held constant for several seconds at thelevels specified by different phases of a 25%-contrast sine-wave, and response gain was probed at each phase in
FIG. 3. A–D: results of the probed sin-ewave paradigm averaged over all OFF cellsfor a sinusoidal frequency of 0.25 Hz andvarying contrasts. Although the reductions insensitivity may be exaggerated by responseclipping, the increases in sensitivity abovebaseline must be caused by luminance adap-tation. Error bars indicate SE.
FIG. 4. The modulation depth for ON cells(A) and OFF cells (B) was measured in responseto sinusoidally varying luminance at 0.25 Hz atvarious contrasts. The normalized responsewas quantified as the fractional deviation fromthe mean rate where a value of 1 represents nochange in firing rate. Average results over allcells are shown for contrasts of 5 (circle), 15(triangle), 25 (square), and 35% (diamond).Asterisks show the points in which the firingrate was occasionally clipped at 0 imp/s, caus-ing an underestimate in gain.
708 D. K. FREEMAN, G. GRAÑA, AND C. L. PASSAGLIA
J Neurophysiol • VOL 104 • AUGUST 2010 • www.jn.org
on Septem
ber 9, 2010 jn.physiology.org
Dow
nloaded from
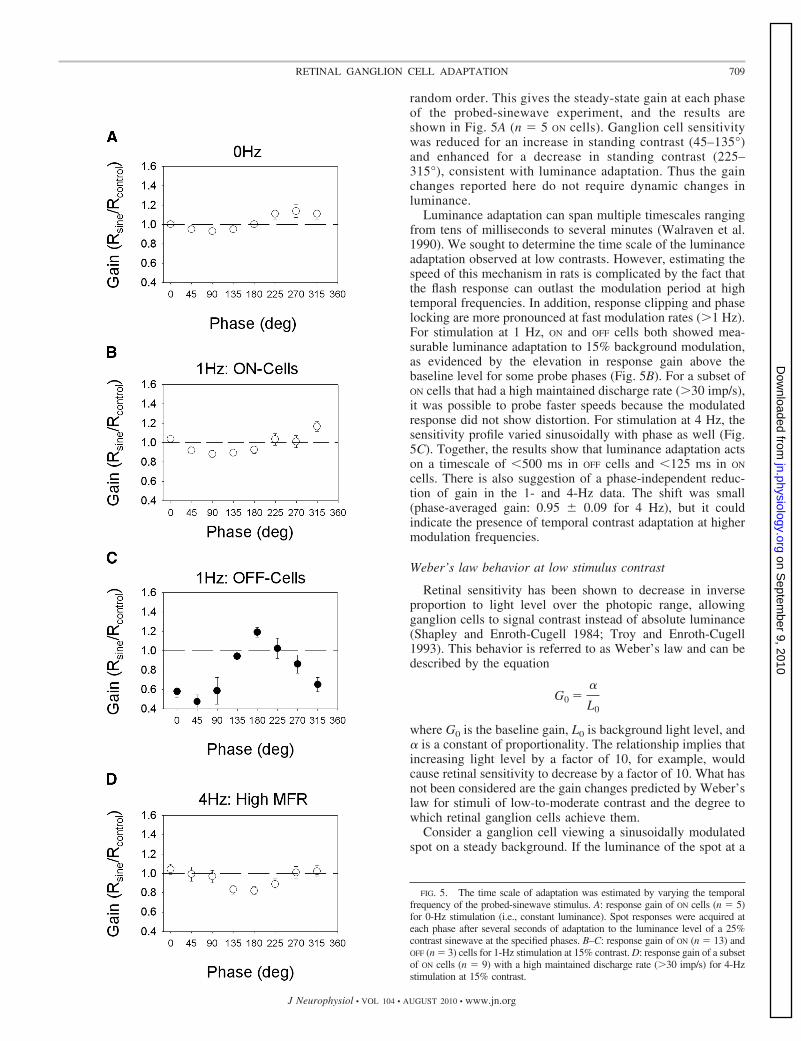
random order. This gives the steady-state gain at each phaseof the probed-sinewave experiment, and the results areshown in Fig. 5A (n � 5 ON cells). Ganglion cell sensitivitywas reduced for an increase in standing contrast (45–135°)and enhanced for a decrease in standing contrast (225–315°), consistent with luminance adaptation. Thus the gainchanges reported here do not require dynamic changes inluminance.
Luminance adaptation can span multiple timescales rangingfrom tens of milliseconds to several minutes (Walraven et al.1990). We sought to determine the time scale of the luminanceadaptation observed at low contrasts. However, estimating thespeed of this mechanism in rats is complicated by the fact thatthe flash response can outlast the modulation period at hightemporal frequencies. In addition, response clipping and phaselocking are more pronounced at fast modulation rates (�1 Hz).For stimulation at 1 Hz, ON and OFF cells both showed mea-surable luminance adaptation to 15% background modulation,as evidenced by the elevation in response gain above thebaseline level for some probe phases (Fig. 5B). For a subset ofON cells that had a high maintained discharge rate (�30 imp/s),it was possible to probe faster speeds because the modulatedresponse did not show distortion. For stimulation at 4 Hz, thesensitivity profile varied sinusoidally with phase as well (Fig.5C). Together, the results show that luminance adaptation actson a timescale of �500 ms in OFF cells and �125 ms in ON
cells. There is also suggestion of a phase-independent reduc-tion of gain in the 1- and 4-Hz data. The shift was small(phase-averaged gain: 0.95 � 0.09 for 4 Hz), but it couldindicate the presence of temporal contrast adaptation at highermodulation frequencies.
Weber’s law behavior at low stimulus contrast
Retinal sensitivity has been shown to decrease in inverseproportion to light level over the photopic range, allowingganglion cells to signal contrast instead of absolute luminance(Shapley and Enroth-Cugell 1984; Troy and Enroth-Cugell1993). This behavior is referred to as Weber’s law and can bedescribed by the equation
G0 ��
L0
where G0 is the baseline gain, L0 is background light level, and� is a constant of proportionality. The relationship implies thatincreasing light level by a factor of 10, for example, wouldcause retinal sensitivity to decrease by a factor of 10. What hasnot been considered are the gain changes predicted by Weber’slaw for stimuli of low-to-moderate contrast and the degree towhich retinal ganglion cells achieve them.
Consider a ganglion cell viewing a sinusoidally modulatedspot on a steady background. If the luminance of the spot at a
FIG. 5. The time scale of adaptation was estimated by varying the temporalfrequency of the probed-sinewave stimulus. A: response gain of ON cells (n � 5)for 0-Hz stimulation (i.e., constant luminance). Spot responses were acquired ateach phase after several seconds of adaptation to the luminance level of a 25%contrast sinewave at the specified phases. B–C: response gain of ON (n � 13) andOFF (n � 3) cells for 1-Hz stimulation at 15% contrast. D: response gain of a subsetof ON cells (n � 9) with a high maintained discharge rate (�30 imp/s) for 4-Hzstimulation at 15% contrast.
709RETINAL GANGLION CELL ADAPTATION
J Neurophysiol • VOL 104 • AUGUST 2010 • www.jn.org
on Septem
ber 9, 2010 jn.physiology.org
Dow
nloaded from
given point in time is L1, the contrast of the spot relative to thebackground is
C �L1 � L0
L0
Assuming that luminance adaptation is as fast as the lumi-nance modulation, the fractional change in response gain Fpredicted by Weber’s law is
F �G1 � G0
G0�
L0
L1� 1 �
�C
1 � C
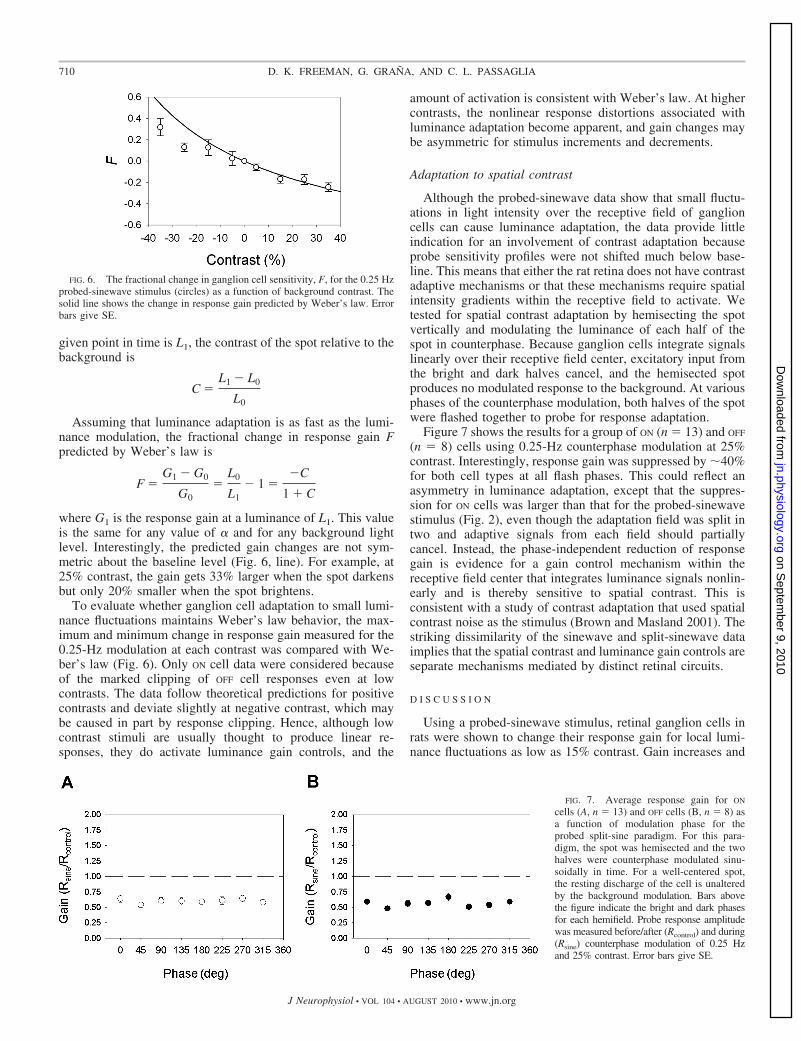
where G1 is the response gain at a luminance of L1. This valueis the same for any value of � and for any background lightlevel. Interestingly, the predicted gain changes are not sym-metric about the baseline level (Fig. 6, line). For example, at25% contrast, the gain gets 33% larger when the spot darkensbut only 20% smaller when the spot brightens.
To evaluate whether ganglion cell adaptation to small lumi-nance fluctuations maintains Weber’s law behavior, the max-imum and minimum change in response gain measured for the0.25-Hz modulation at each contrast was compared with We-ber’s law (Fig. 6). Only ON cell data were considered becauseof the marked clipping of OFF cell responses even at lowcontrasts. The data follow theoretical predictions for positivecontrasts and deviate slightly at negative contrast, which maybe caused in part by response clipping. Hence, although lowcontrast stimuli are usually thought to produce linear re-sponses, they do activate luminance gain controls, and the
amount of activation is consistent with Weber’s law. At highercontrasts, the nonlinear response distortions associated withluminance adaptation become apparent, and gain changes maybe asymmetric for stimulus increments and decrements.
Adaptation to spatial contrast
Although the probed-sinewave data show that small fluctu-ations in light intensity over the receptive field of ganglioncells can cause luminance adaptation, the data provide littleindication for an involvement of contrast adaptation becauseprobe sensitivity profiles were not shifted much below base-line. This means that either the rat retina does not have contrastadaptive mechanisms or that these mechanisms require spatialintensity gradients within the receptive field to activate. Wetested for spatial contrast adaptation by hemisecting the spotvertically and modulating the luminance of each half of thespot in counterphase. Because ganglion cells integrate signalslinearly over their receptive field center, excitatory input fromthe bright and dark halves cancel, and the hemisected spotproduces no modulated response to the background. At variousphases of the counterphase modulation, both halves of the spotwere flashed together to probe for response adaptation.
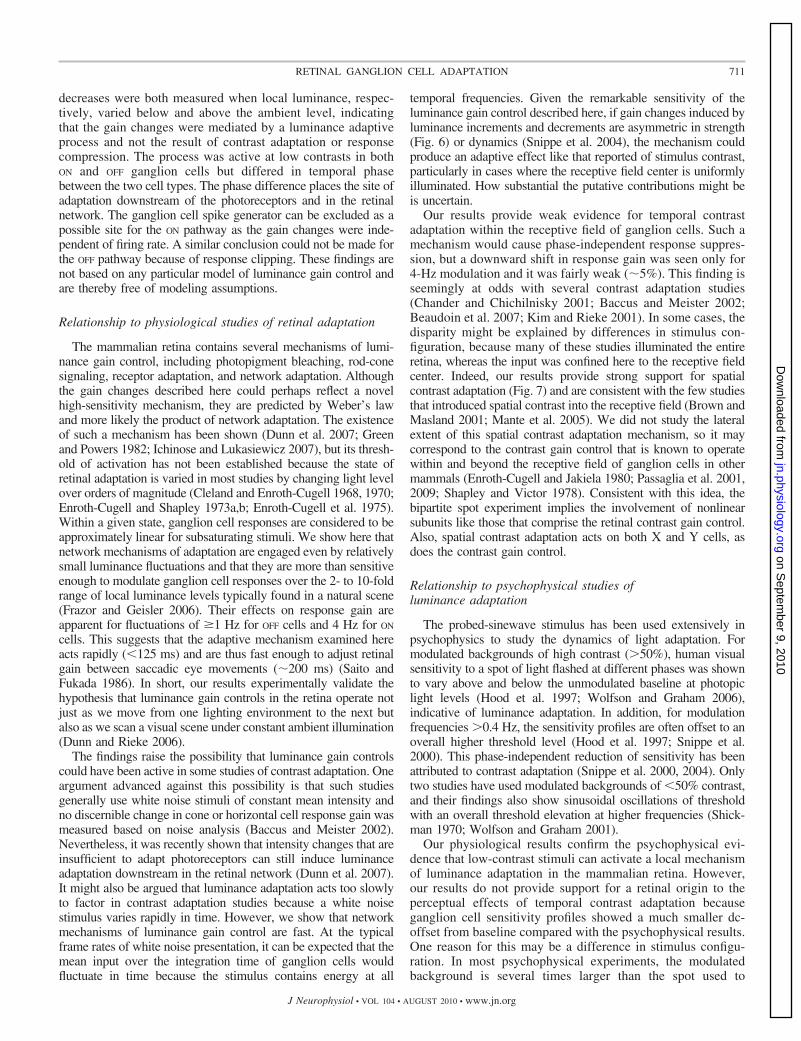
Figure 7 shows the results for a group of ON (n � 13) and OFF
(n � 8) cells using 0.25-Hz counterphase modulation at 25%contrast. Interestingly, response gain was suppressed by �40%for both cell types at all flash phases. This could reflect anasymmetry in luminance adaptation, except that the suppres-sion for ON cells was larger than that for the probed-sinewavestimulus (Fig. 2), even though the adaptation field was split intwo and adaptive signals from each field should partiallycancel. Instead, the phase-independent reduction of responsegain is evidence for a gain control mechanism within thereceptive field center that integrates luminance signals nonlin-early and is thereby sensitive to spatial contrast. This isconsistent with a study of contrast adaptation that used spatialcontrast noise as the stimulus (Brown and Masland 2001). Thestriking dissimilarity of the sinewave and split-sinewave dataimplies that the spatial contrast and luminance gain controls areseparate mechanisms mediated by distinct retinal circuits.
D I S C U S S I O N
Using a probed-sinewave stimulus, retinal ganglion cells inrats were shown to change their response gain for local lumi-nance fluctuations as low as 15% contrast. Gain increases and
FIG. 6. The fractional change in ganglion cell sensitivity, F, for the 0.25 Hzprobed-sinewave stimulus (circles) as a function of background contrast. Thesolid line shows the change in response gain predicted by Weber’s law. Errorbars give SE.
FIG. 7. Average response gain for ON
cells (A, n � 13) and OFF cells (B, n � 8) asa function of modulation phase for theprobed split-sine paradigm. For this para-digm, the spot was hemisected and the twohalves were counterphase modulated sinu-soidally in time. For a well-centered spot,the resting discharge of the cell is unalteredby the background modulation. Bars abovethe figure indicate the bright and dark phasesfor each hemifield. Probe response amplitudewas measured before/after (Rcontrol) and during(Rsine) counterphase modulation of 0.25 Hzand 25% contrast. Error bars give SE.
710 D. K. FREEMAN, G. GRAÑA, AND C. L. PASSAGLIA
J Neurophysiol • VOL 104 • AUGUST 2010 • www.jn.org
on Septem
ber 9, 2010 jn.physiology.org
Dow
nloaded from
decreases were both measured when local luminance, respec-tively, varied below and above the ambient level, indicatingthat the gain changes were mediated by a luminance adaptiveprocess and not the result of contrast adaptation or responsecompression. The process was active at low contrasts in bothON and OFF ganglion cells but differed in temporal phasebetween the two cell types. The phase difference places the site ofadaptation downstream of the photoreceptors and in the retinalnetwork. The ganglion cell spike generator can be excluded as apossible site for the ON pathway as the gain changes were inde-pendent of firing rate. A similar conclusion could not be made forthe OFF pathway because of response clipping. These findings arenot based on any particular model of luminance gain control andare thereby free of modeling assumptions.
Relationship to physiological studies of retinal adaptation
The mammalian retina contains several mechanisms of lumi-nance gain control, including photopigment bleaching, rod-conesignaling, receptor adaptation, and network adaptation. Althoughthe gain changes described here could perhaps reflect a novelhigh-sensitivity mechanism, they are predicted by Weber’s lawand more likely the product of network adaptation. The existenceof such a mechanism has been shown (Dunn et al. 2007; Greenand Powers 1982; Ichinose and Lukasiewicz 2007), but its thresh-old of activation has not been established because the state ofretinal adaptation is varied in most studies by changing light levelover orders of magnitude (Cleland and Enroth-Cugell 1968, 1970;Enroth-Cugell and Shapley 1973a,b; Enroth-Cugell et al. 1975).Within a given state, ganglion cell responses are considered to beapproximately linear for subsaturating stimuli. We show here thatnetwork mechanisms of adaptation are engaged even by relativelysmall luminance fluctuations and that they are more than sensitiveenough to modulate ganglion cell responses over the 2- to 10-foldrange of local luminance levels typically found in a natural scene(Frazor and Geisler 2006). Their effects on response gain areapparent for fluctuations of �1 Hz for OFF cells and 4 Hz for ON
cells. This suggests that the adaptive mechanism examined hereacts rapidly (�125 ms) and are thus fast enough to adjust retinalgain between saccadic eye movements (�200 ms) (Saito andFukada 1986). In short, our results experimentally validate thehypothesis that luminance gain controls in the retina operate notjust as we move from one lighting environment to the next butalso as we scan a visual scene under constant ambient illumination(Dunn and Rieke 2006).
The findings raise the possibility that luminance gain controlscould have been active in some studies of contrast adaptation. Oneargument advanced against this possibility is that such studiesgenerally use white noise stimuli of constant mean intensity andno discernible change in cone or horizontal cell response gain wasmeasured based on noise analysis (Baccus and Meister 2002).Nevertheless, it was recently shown that intensity changes that areinsufficient to adapt photoreceptors can still induce luminanceadaptation downstream in the retinal network (Dunn et al. 2007).It might also be argued that luminance adaptation acts too slowlyto factor in contrast adaptation studies because a white noisestimulus varies rapidly in time. However, we show that networkmechanisms of luminance gain control are fast. At the typicalframe rates of white noise presentation, it can be expected that themean input over the integration time of ganglion cells wouldfluctuate in time because the stimulus contains energy at all
temporal frequencies. Given the remarkable sensitivity of theluminance gain control described here, if gain changes induced byluminance increments and decrements are asymmetric in strength(Fig. 6) or dynamics (Snippe et al. 2004), the mechanism couldproduce an adaptive effect like that reported of stimulus contrast,particularly in cases where the receptive field center is uniformlyilluminated. How substantial the putative contributions might beis uncertain.
Our results provide weak evidence for temporal contrastadaptation within the receptive field of ganglion cells. Such amechanism would cause phase-independent response suppres-sion, but a downward shift in response gain was seen only for4-Hz modulation and it was fairly weak (�5%). This finding isseemingly at odds with several contrast adaptation studies(Chander and Chichilnisky 2001; Baccus and Meister 2002;Beaudoin et al. 2007; Kim and Rieke 2001). In some cases, thedisparity might be explained by differences in stimulus con-figuration, because many of these studies illuminated the entireretina, whereas the input was confined here to the receptive fieldcenter. Indeed, our results provide strong support for spatialcontrast adaptation (Fig. 7) and are consistent with the few studiesthat introduced spatial contrast into the receptive field (Brown andMasland 2001; Mante et al. 2005). We did not study the lateralextent of this spatial contrast adaptation mechanism, so it maycorrespond to the contrast gain control that is known to operatewithin and beyond the receptive field of ganglion cells in othermammals (Enroth-Cugell and Jakiela 1980; Passaglia et al. 2001,2009; Shapley and Victor 1978). Consistent with this idea, thebipartite spot experiment implies the involvement of nonlinearsubunits like those that comprise the retinal contrast gain control.Also, spatial contrast adaptation acts on both X and Y cells, asdoes the contrast gain control.
Relationship to psychophysical studies ofluminance adaptation
The probed-sinewave stimulus has been used extensively inpsychophysics to study the dynamics of light adaptation. Formodulated backgrounds of high contrast (�50%), human visualsensitivity to a spot of light flashed at different phases was shownto vary above and below the unmodulated baseline at photopiclight levels (Hood et al. 1997; Wolfson and Graham 2006),indicative of luminance adaptation. In addition, for modulationfrequencies �0.4 Hz, the sensitivity profiles are often offset to anoverall higher threshold level (Hood et al. 1997; Snippe et al.2000). This phase-independent reduction of sensitivity has beenattributed to contrast adaptation (Snippe et al. 2000, 2004). Onlytwo studies have used modulated backgrounds of �50% contrast,and their findings also show sinusoidal oscillations of thresholdwith an overall threshold elevation at higher frequencies (Shick-man 1970; Wolfson and Graham 2001).
Our physiological results confirm the psychophysical evi-dence that low-contrast stimuli can activate a local mechanismof luminance adaptation in the mammalian retina. However,our results do not provide support for a retinal origin to theperceptual effects of temporal contrast adaptation becauseganglion cell sensitivity profiles showed a much smaller dc-offset from baseline compared with the psychophysical results.One reason for this may be a difference in stimulus configu-ration. In most psychophysical experiments, the modulatedbackground is several times larger than the spot used to
711RETINAL GANGLION CELL ADAPTATION
J Neurophysiol • VOL 104 • AUGUST 2010 • www.jn.org
on Septem
ber 9, 2010 jn.physiology.org
Dow
nloaded from
measure visual sensitivity, whereas in our experiments, thebackground modulation was constrained to the same spot thatprobed the receptive field center sensitivity of ganglion cells.This means that retinal mechanisms that operate outside theclassical receptive field center and surround, such as contrastgain control (Enroth-Cugell and Jakiela 1980; Passaglia et al.2001, 2009; Shapley and Victor 1978), could have factoredprominently in the psychophysical data but not ours. Hence,probed-sinewave experiments using low contrast backgroundmodulations that are co-spatial with the probe are needed tocompare with our results more directly.
A C K N O W L E D G M E N T S
We thank W. Heine for assistance with data collection and J. Dowling, J. Troy,and B. Werner for helpful input during the preparation of this manuscript.
D I S C L O S U R E S
No conflicts of interest, financial or otherwise, are declared by the authors.
R E F E R E N C E S
Baccus SA, Meister M. Fast and slow contrast adaptation in retinal circuitry.Neuron 36: 909–919, 2002.
Benardete EA, Kaplan E, Knight BW. Contrast gain control in the primateretina: P cells are not X-like, some M cells are. Vis Neurosci 8: 483–486, 1992.
Brainard DH. The psychophysics toolbox. Spat Vis 10: 433–436, 1997.Brown SP, Masland RH. Spatial scale and cellular substrate of contrast
adaptation by retinal ganglion cells. Nat Neurosci 4: 44–51, 2001.Chander D, Chichilnisky EJ. Adaptation to temporal contrast in primate and
salamander retina. J Neurosci 21: 9904–9916, 2001.Chichilnisky EJ, Kalmar RS. Functional asymmetries in ON and OFF
ganglion cells of the primate retina. J Neurosci 22: 2737–2747, 2002.Cicerone CM, Green DG. Light adaptation within the receptive centre of rat
retinal ganglion cells. J Physiol 301: 517–534, 1980.Cleland BG, Enroth-Cugell C. Quantitative aspects of sensitivity and sum-
mation in the cat retina. J Physiol 198: 17–38, 1968.Cleland BG, Enroth-Cugell C. Quantitative aspects of gain and latency in the
cat retina. J Physiol 206: 73–91, 1970.Cleland BG, Levick WR. Brisk and sluggish concentrically organized gan-
glion cells in the cat’s retina. J Physiol 240: 421–456, 1974.Dowling JE. The site of visual adaptation. Science 155: 273–279, 1967.Dunn FA, Lankheet MJ, Rieke F. Light adaptation in cone vision involves
switching between receptor and post-receptor sites. Nature 449: 603–607, 2007.Dunn FA, Rieke R. The impact of photoreceptor noise on retinal gain
controls. Curr Opin Neurobiol 16: 363–370, 2006.Enroth-Cugell C, Jakiela HG. Suppression of cat retinal ganglion cell
responses by moving patterns. J Physiol 302: 49–72, 1980.Enroth-Cugell C, Lennie P, Shapley RM. Surround contribution in light
adaptation in cat retinal ganglion cells. J Physiol 247: 579–588, 1975.Enroth-Cugell C, Shapley RM. Adaptation and dynamics of cat retinal
ganglion cells. J Physiol 233: 271–309, 1973a.Enroth-Cugell C, Shapley RM. Flux, not retinal illumination, is what cat
retinal ganglion cells really care about. J Physiol 233: 311–326, 1973b.Frazer RA, Geisler WS. Local luminance and contrast in natural images.
Vision Res 46: 1585–1598, 2006.Freeman DK, Heine WF, Passaglia CL. The maintained discharge of rat
retinal ganglion cells. Vis Neurosci 25: 535–548, 2008.Green DG, Powers MK. The mechanisms of light adaptation in rat retina.
Vision Res 22: 209–216, 1982.Hochstein S, Shapley RM. Linear and nonlinear spatial subunits in Y cat
retinal ganglion cells. J Physiol 262: 265–284, 1976.Hood DC, Graham N, von Wiegand TE, Chase VM. Probed-sinewave
paradigm: a test of models of light-adaptation dynamics. Vision Res 37:1177–1191, 1997.
Ichinose T, Lukasiewicz PD. Ambient light regulates sodium channel activityto dynamically control retinal signaling. J Neurosci 27: 4756–4764, 2007.
Kim KJ, Rieke F. Temporal contrast adaptation in the input and output signalsof salamander retinal ganglion cells. J Neurosci 21: 287–299, 2001.
Lankheet MJ, Van Wezel RJ, Prickaerts JH, van de Grind WA. Thedynamics of light adaptation in cat horizontal cell responses. Vision Res 33:1153–1171, 1993.
Lee BB, Dacey DM, Smith VC, Pokorny J. Dynamics of sensitivity regula-tion in primate outer retina: the horizontal cell network. J Vis 3: 513–526,2003.
Levick WR. Another tungsten microelectrode. Med Biol Eng 10: 510–515,1972.
Manookin MB, Demb JB. Presynaptic mechanism for slow contrast adapta-tion in mammalian retinal ganglion cells. Neuron 50: 453–464, 2006.
Mante V, Frazor RA, Bonin V, Geisler WS, Carandini M. Independence ofluminance and contrast in natural scenes and in the early visual system. NatNeurosci 8: 1690–1697, 2005.
O’Brien BJ, Isayama T, Richardson R, Berson DM. Intrinsic physiologicalproperties of cat retinal ganglion cells. J Physiol 538: 787–802, 2002.
Passaglia CL, Enroth-Cugell C, Troy JB. Effects of remote stimulation on themean firing rate of cat retinal ganglion cells. J Neurosci 21: 5794–5803, 2001.
Passaglia CL, Freeman DF, Troy JB. Effects of remote stimulation on themodulated activity of cat retinal ganglion cells. J Neurosci 29: 2467–2476,2009.
Perlman I, Norman RA. Light adaptation and sensitivity controlling mech-anisms in vertebrate photoreceptors. Prog Retin Eye Res 17: 523–563, 1998.
Pugh EN, Nikonov S, Lamb TD. Molecular mechanisms of vertebratephotoreceptor light adaptation. Curr Opin Neurobiol 9: 410–418, 1999.
Pupura K, Tranchina D, Kaplan E, Shapley RM. Light adaptation in theprimate retina: analysis of changes in gain and dynamics of monkey retinalganglion cells. Vis Neurosci 4: 75–93, 1990.
Rushton WAH, Westheimer G. The effect upon the rod threshold of bleach-ing neighboring rods. J Physiol 164: 318–329, 1962.
Saito H, Fukada Y. Gain control mechanisms in X- and Y-type retinalganglion cells of the cat. Vis Res 26: 391–408, 1986.
Schneeweis DM, Schnapf JL. The photovoltage of macaque cone photore-ceptors: adaptation, noise, and kinetics. J Neurosci 19: 1203–1216, 1999.
Shapley RM, Enroth-Cugell C. Visual adaptation and retinal gain controls.Prog Retin Eye Res 3: 263–346, 1984.
Shapley RM, Victor JD. The effect of contrast on the transfer properties of catretinal ganglion cells. J Physiol 285: 275–298, 1978.
Shickman GM. Visual masking by low-frequency modulated light. J Opt SocAm 60: 107–117, 1970.
Smirnakis SM, Berry MJ, Warland DK, Bialek W, Meister M. Adaptationof retinal processing to image contrast and spatial scale. Nature 386: 69–73,1997.
Smith VC, Pokorny J, Lee BB, Dacey DM. Sequential processing in vision:the interaction of sensitivity regulation and temporal dynamics. Vision Res48: 2649–2656, 2008.
Snippe HP, Poot L, van Hateren JH. A temporal model for early vision thatexplains detection thresholds for light pulses on flickering backgrounds. VisNeurosci 17: 449–462, 2000.
Snippe HP, Poot L, van Hateren JH. Asymmetric dynamics of adaptationafter onset and offset of flicker. J Vis 4: 1–12, 2004.
Troy JB, Enroth-Cugell C. X and Y ganglion cells inform the cat’s brainabout contrast in the retinal image. Exp Brain Res 93: 383–390, 1993.
Troy JB, Shou T. The receptive fields of cat retinal ganglion cells inphysiological and pathological states: where we are after a half century ofresearch. Prog Retin Eye Res 21: 263–302, 2002.
Victor JD. The dynamics of the cat retinal X cell centre. J Physiol 386:219–246, 1987.
Walraven J, Enroth-Cugell C, Hood DC, Macleod DI, Schnapf JL. Thecontrol of visual sensitivity: receptoral and postreceptoral processes. In:Visual Perception: The Neurophysiological Foundations, edited by Spill-mann L, Werner JS. San Diego: Academic Press, 1990, p. 53–101.
Wark B, Fairhall A, Rieke F. Timescales of inference in visual adaptation.Neuron 61: 750–761, 2009.
Wolfson SS, Graham N. Comparing increment and decrement probes in theprobed-sinewave paradigm. Vis Res 41: 1119–1131, 2001.
Wolfson SS, Graham N. Forty-four years of studying light adaptation usingthe probed-sinewave paradigm. J Vis 6: 1026–1046, 2006.
Wu A, Burns SA, Elsner AE, Eskew RT, He J. Rapid sensitivity changes onflickering backgrounds: tests of models of light adaptation. J Opt Soc Am A14: 2367–2378, 1997.
Yeh T, Lee BB, Kremers J. The time course of adaptation in macaque retinalganglion cells. Vis Res 36: 913–931, 1996.
712 D. K. FREEMAN, G. GRAÑA, AND C. L. PASSAGLIA
J Neurophysiol • VOL 104 • AUGUST 2010 • www.jn.org
on Septem
ber 9, 2010 jn.physiology.org
Dow
nloaded from