Embed Size (px)
Citation preview
Daniel's commentary
TAIWAN RATINGS CORP. | TAIWAN'S TOP 50 CORPORATES
Title Page
2 TAIWAN RATINGS CORP. | TAIWAN'S TOP 50 CORPORATES
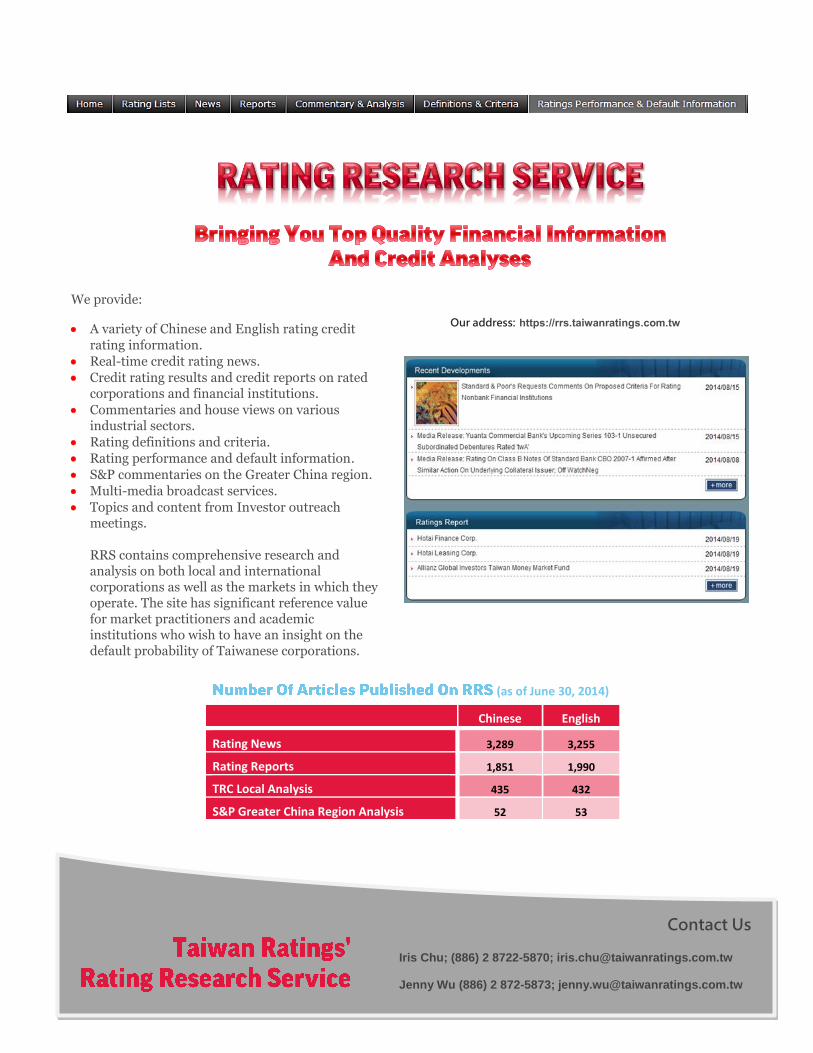
Our address: https://rrs.taiwanratings.com.tw
We provide:
A variety of Chinese and English rating credit
rating information.
Real-time credit rating news.
Credit rating results and credit reports on rated corporations and financial institutions.
Commentaries and house views on various industrial sectors.
Rating definitions and criteria.
Rating performance and default information.
S&P commentaries on the Greater China region.
Multi-media broadcast services.
Topics and content from Investor outreach meetings. RRS contains comprehensive research and analysis on both local and international corporations as well as the markets in which they operate. The site has significant reference value for market practitioners and academic institutions who wish to have an insight on the default probability of Taiwanese corporations.
(as of June 30, 2014)
Chinese English
Rating News 3,289 3,255
Rating Reports 1,851 1,990
TRC Local Analysis 435 432
S&P Greater China Region Analysis 52 53
Contact Us
Iris Chu; (886) 2 8722-5870; [email protected]
Jenny Wu (886) 2 872-5873; [email protected]
3 TAIWAN RATINGS CORP. | TAIWAN'S TOP 50 CORPORATES
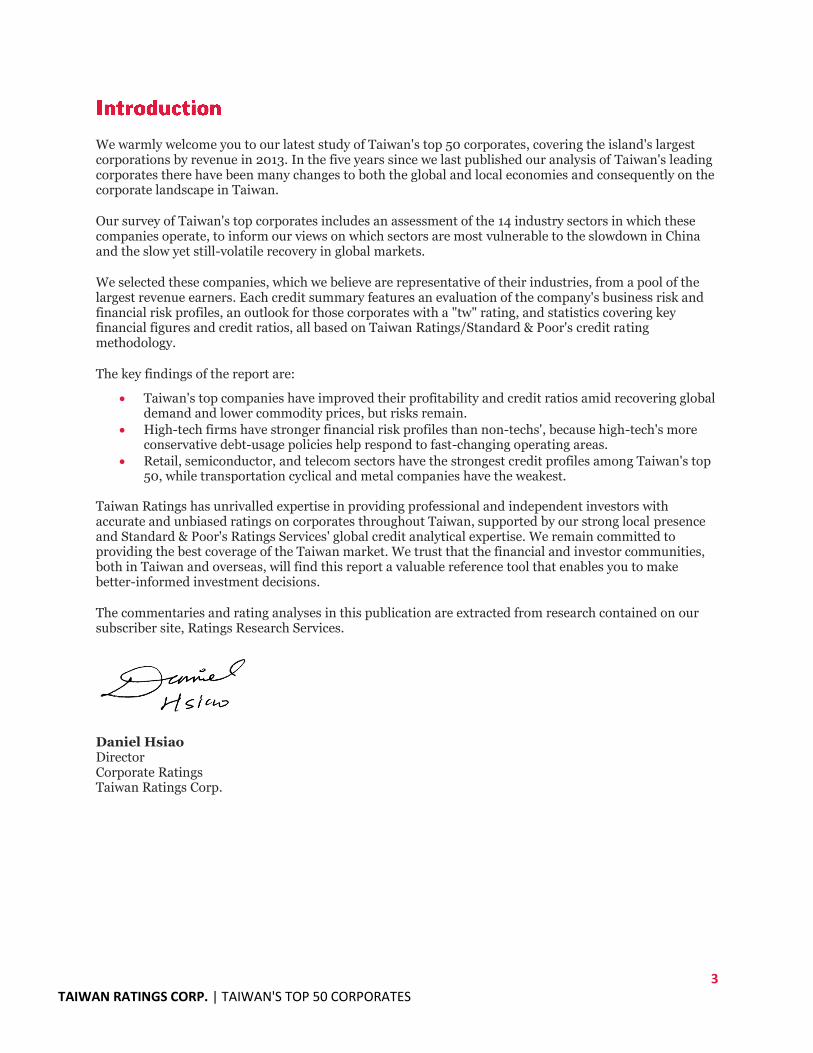
We warmly welcome you to our latest study of Taiwan's top 50 corporates, covering the island's largest corporations by revenue in 2013. In the five years since we last published our analysis of Taiwan's leading corporates there have been many changes to both the global and local economies and consequently on the corporate landscape in Taiwan.
Our survey of Taiwan's top corporates includes an assessment of the 14 industry sectors in which these companies operate, to inform our views on which sectors are most vulnerable to the slowdown in China and the slow yet still-volatile recovery in global markets.
We selected these companies, which we believe are representative of their industries, from a pool of the largest revenue earners. Each credit summary features an evaluation of the company's business risk and financial risk profiles, an outlook for those corporates with a "tw" rating, and statistics covering key financial figures and credit ratios, all based on Taiwan Ratings/Standard & Poor's credit rating methodology.
The key findings of the report are:
Taiwan's top companies have improved their profitability and credit ratios amid recovering global demand and lower commodity prices, but risks remain.
High-tech firms have stronger financial risk profiles than non-techs', because high-tech's more conservative debt-usage policies help respond to fast-changing operating areas.
Retail, semiconductor, and telecom sectors have the strongest credit profiles among Taiwan's top 50, while transportation cyclical and metal companies have the weakest.
Taiwan Ratings has unrivalled expertise in providing professional and independent investors with accurate and unbiased ratings on corporates throughout Taiwan, supported by our strong local presence and Standard & Poor's Ratings Services' global credit analytical expertise. We remain committed to providing the best coverage of the Taiwan market. We trust that the financial and investor communities, both in Taiwan and overseas, will find this report a valuable reference tool that enables you to make better-informed investment decisions.
The commentaries and rating analyses in this publication are extracted from research contained on our subscriber site, Ratings Research Services.
Daniel Hsiao Director Corporate Ratings Taiwan Ratings Corp.
4 TAIWAN RATINGS CORP. | TAIWAN'S TOP 50 CORPORATES
3 Introduction
5 Taiwan's Top Corporates Face Continued Headwind On The Road To
Recovery
15 Taiwan's IT Hardware Sector Wrestles With Increasing Risk From
Chinese Competitors
21 Taiwan Ratings' Corporate Ratings Criteria Framework
22 Business And Financial Risk Profiles 24 Credit Summaries 71 Medians Of Financial Ratios 72 Ratings List
73 Glossary Of Financial Ratios And Formulas
75 Taiwan Ratings' Ratings Definitions 77 Related Criteria
78 Standard & Poor's Asia-Pacific Office Locations
Sector Review: Taiwan's Top Corporates Face Continued Headwind On The Road To Recovery Sept. 1, 2014
5 TAIWAN RATINGS CORP. | TAIWAN'S TOP 50 CORPORATES
Primary Credit Analyst:
Daniel Hsiao, Taipei, (886) 28722-5826; [email protected]
Secondary Contacts: Raymond Hsu, CFA; (886) 2 8722-5827; [email protected]
David Hsu; (886) 2 8722-5828; [email protected]
Anne Kuo, CFA; (886) 2 8722-5829; [email protected]
Jin Dong; (886) 2 8722-5821; [email protected]
China's slowing economic growth and excess capacity remain the key credit risks for Taiwan's
corporates over the next year. Taiwan Ratings Corp. expects the island's top 50 corporates to
mostly improve their profitability during the next 12 to 18 months. A gradually strengthening
global economy and lower commodity prices helped bolster economic activity in Taiwan in
recent quarters, signaling an upturn in prosperity for export-dependent corporates. But not all
corporate players are out of danger. In particular, a greater slowdown in Chinese growth than
under our base-case scenario could weaken the credit ratios and profitability in sectors with a
higher revenue concentration in neighboring China. This includes steel and chemical sectors,
where excess capacity has built up over the past few years.
We also view rising competition from Korean competitors as a threat to Taiwanese credit
profiles if a free trade agreement (FTA) between Korea and China is implemented as planned,
without a similar FTA between Taiwan and China in place. Taiwanese and Korean players in the
chemical, steel, and thin-film-transistor liquid crystal display (TFT-LCD) panel sectors have
been competing heavily in the region over recent quarters, particularly in China.
Overview:
Taiwan's largest 50 companies by revenue have improved their profitability and credit
ratios amid recovering global demand and lower commodity prices, but risks remain.
High-tech firms have stronger financial risk profiles than non-techs', because their
more conservative debt-usage policies help respond to fast-changing operating areas.
Retail, semiconductor, and telecom sectors have the strongest credit profiles among
Taiwan's top 50, while transportation cyclical and metal companies have the weakest.
Our study covers Taiwan's top 50 corporations by revenue in 2013 (see table 1 and chart 1).
Overall, we assess the average business risk profile of these corporates as "satisfactory" and
financial risk profile as "modest," as our criteria define those terms, compared to Taiwanese
obligors, and "fair" and "intermediate," respectively, compared with their global peers. We also
believe that the high-tech and non-tech sectors share similar business risk profiles, but the
technology sector has a stronger financial risk profile.
Sector Review: Taiwan's Top Corporates Face Continued Headwind On The Road To Recovery Sept. 1, 2014
6 TAIWAN RATINGS CORP. | TAIWAN'S TOP 50 CORPORATES
Table 1
Taiwan Top 50 Corporates By Revenue In 2013
Rank Company Industry (Mil. NTS)
1 Hon Hai Precision Industry Co. Ltd. Technology hardware and semiconductors 3,952,318
2 CPC Corp., Taiwan Oil refining and marketing 1,187,701
3 Pegatron Corp. Technology hardware and semiconductors 949,752
4 Formosa Petrochemical Corp. Commodity Chemicals 931,334
5 Quanta Computer Inc. Technology hardware and semiconductors 880,402
6 Compal Electronics, Inc. Technology hardware and semiconductors 692,748
7 Wistron Corp. Technology hardware and semiconductors 624,009
8 Taiwan Semiconductor Manufacturing Co. Ltd. Technology hardware and semiconductors 597,024
9 Taiwan Power Co. Regulated utilities 592,791
10 ASUSTeK Computer Inc. Technology hardware and semiconductors 463,287
11 INVENTEC Corp. Technology hardware and semiconductors 461,091
12 Formosa Chemicals & Fibre Corp. Commodity Chemicals 428,294
13 Uni-President Enterprises Corp. Branded Nondurables 423,056
14 Innolux Corp. Technology hardware and semiconductors 422,730
15 AU Optronics Corp. Technology hardware and semiconductors 416,363
16 WPG Holding Ltd. Technology hardware and semiconductors 406,256
17 Acer Inc. Technology hardware and semiconductors 360,132
18 China Steel Corp. Metal and mining downstream 347,829
19 Synnex Technology International Corp. Technology hardware and semiconductors 330,260
20 Tingyi (Cayman Islands) Holding Corp. Branded Nondurables 326,151
21 Nan Ya Plastics Corp. Commodity Chemicals 311,005
22 Far Eastern New Century Corp. Telecommunications and cable 238,840
23 Chunghwa Telecom Co. Ltd. Telecommunications and cable 227,981
24 Pou Chen Corp. Business and consumer services 226,665
25 Advanced Semiconductor Engineering Inc. Technology hardware and semiconductors 219,862
26 Formosa Plastics Corp. Commodity Chemicals 215,425
27 Lite-On Technology Corp. Technology hardware and semiconductors 213,214
28 HTC Corp. Technology hardware and semiconductors 203,403
29 President Chain Store Corp. Retail and resturants 200,610
30 Chi Mei Corp. Commodity Chemicals 179,384
31 Delta Electronics Inc. Technology hardware and semiconductors 177,053
32 TPK Holding Co., Ltd Technology hardware and semiconductors 159,067
33 Walsin Lihwa Corp. Metal and mining downstream 148,634
34 China Airlines Ltd. Transportation cyclical 141,703
35 Evergreen Marine Corp. (Taiwan) Ltd. Transportation cyclical 139,216
36 MediaTek Inc. Technology hardware and semiconductors 136,056
37 Yieh United Steel Corp. Metal and mining downstream 133,756
38 Cheng Shin Rubber Ind. Co. Ltd. Auto supplier 133,087
39 Hotai Motor Co. Ltd. Retail and resturants 131,835
40 Eva Airways Corp. Transportation cyclical 124,164
41 United Microelectronics Corp. Technology hardware and semiconductors 123,812
42 Qisda Corp. Technology hardware and semiconductors 119,231
43 Yang Ming Marine Transport Corp. Transportation cyclical 118,874
44 Taiwan Cement Corp. Building materials 116,099
45 Chang Chun Petrochemical Co. Ltd. Specialty Chemical 114,950
46 Tatung Co. Technology hardware and semiconductors 112,927
47 Taiwan Mobile Co. Ltd. Telecommunications and cable 109,143
48 Cheng Uei Precision Industry Co. Ltd. Technology hardware and semiconductors 106,156
49 Foxconn Technology Co. Ltd. Technology hardware and semiconductors 94,598
50 Great Wall Enterprise Co. Ltd. Agribusiness and commodity foods 90,478
NT$--New Taiwan dollar. Source: Audited company financial reports.
Sector Review: Taiwan's Top Corporates Face Continued Headwind On The Road To Recovery Sept. 1, 2014
7 TAIWAN RATINGS CORP. | TAIWAN'S TOP 50 CORPORATES
We believe the transportation cyclical sector has the weakest business risk profile among the top
50, followed by metal, and two sub-sectors of technology hardware and semiconductors,
including consumer electronics (i.e. branded technology companies), and computer hardware
and electronics component firms (such as TFT-LCD panel makers), which are all below the top
50 average. The transportation cyclical, metal, and technology distributors (a subsector of
technology hardware and semiconductors) sectors all have below-average financial risk profiles.
Accordingly, we believe the transportation cyclical and metal sectors have the weakest credit
profiles among Taiwan's top 50 corporates (see chart 2). This is mainly due to industry
overcapacity and weaker competitive positions that constrain profitability. Meanwhile, we
believe the retail, semiconductor (a subsector of technology hardware and semiconductors), and
telecommunications sectors have the strongest overall credit profiles, supported by their
established market positions and conservative debt use policy.
Sector Review: Taiwan's Top Corporates Face Continued Headwind On The Road To Recovery Sept. 1, 2014
8 TAIWAN RATINGS CORP. | TAIWAN'S TOP 50 CORPORATES
We expect corporate profitability to generally improve in 2014, but individual performance will
diverge. Our analysis of median EBITDA margins for the top 50 companies reveals that overall
profitability improved to 9.4% in 2013 from 8.6% in 2011, partly due to lower material cost, such
as coals and iron ore (see chart 3). For instance, Taiwan Power Co.'s EBITDA margin rose to
23.5% in 2013 from 19.3% in 2011, partly due to the positive effect of tariff hikes and lower coal
prices, meanwhile EBITDA margins in the metal sector rose to 4.7% from 3% over the same
period. Oversupply in the natural rubber and synthetic rubber markets also helped to improve
the profitability of tire manufacturers, such as Cheng Shin Rubber Industries Co. We expect
semiconductor, retail, and building material sectors to see profitability improve in 2014, backed
by recovery in demand and more disciplined supply in China's cement market.
Conversely, several sectors are facing margin pressure as a result of rising competition,
overcapacity, or unfavorable regulations. We believe that Taiwanese consumer electronics
companies (or branded technology companies), including smartphone and PC branded
companies such as HTC Corp. and Acer Inc., will continue to experience severe competition
from Chinese branded IT firms, due to the lack of product differentiation and control on
operating platforms. Commodity chemical companies and metal manufacturers are also likely to
experience problems from continued overcapacity in China, depending on their product offering.
Meanwhile, a regulatory requirement for tariff reductions is likely to exert continued margin
pressure in the telecom sector.
We expect the cash flow protection of Taiwan's top 50 companies to strengthen in 2014,
supported by their improving profitability. The median credit protection level (measured by the
ratio of funds from operations to debt) improved to 33.4% in 2013 from 26.6% in 2011,
according to our analysis. We believe this was the result of improved profitability and flat capital
expenditures. Sectors with higher capital expenditures in 2013 include regulated utilities
Sector Review: Taiwan's Top Corporates Face Continued Headwind On The Road To Recovery Sept. 1, 2014
9 TAIWAN RATINGS CORP. | TAIWAN'S TOP 50 CORPORATES
(Taipower), oil refining and marketing (CPC Corp., Taiwan), and telecommunications.
Meanwhile, higher capital expenditures in the telecom sector were the result of bidding on 4G
mobile license fees.
Technology companies represented within the top 50 generally reduced their capital
expenditures in 2013, with the exception of Taiwan Semiconductor Manufacturing Co. Ltd.
(TSMC), TPK Holding Co. Ltd., and Lite-On Technology Corp. The electronics manufacturing
service sector (Hon Hai Precision Industry Co. Ltd.), TFT-LCD panel firms (AU Optronics Corp.
and Innolux Corp.), and branded technology firms (Acer Inc. and HTC Corp.) all took a more
conservative approach to capital expenditure in 2013, partly due to the absorption of current
capacity and restructuring of product lines. We expect these sectors to increase capital
expenditure in 2014. Demand recovery for EMS and panel sectors and capital expenditure were
already the lowest in the branded technology sector in 2013.
Although the median debt level was unchanged in 2013 from 2012, several sectors continue to
take on more debt. Taipower and CPC had the highest debt in 2013, which reflects the fact that
their cash flow generation isn't sufficient to cover their capital expenditures. We believe this
imbalance will continue in 2014, because the companies are obliged to fulfill their government
policy roles. Players in the telecom sector borrowed to fund the 4G license fee in 2013, but we
believe the debt will gradually be repaid, because the sector's cash flow generation is generally
strong. Meanwhile, the semiconductor sector built up debt as a result of widespread practices to
maintain high cash balances in 2013. We expect the sector to maintain a relatively high level of
debt in 2014 to support its capital expenditures and cash dividend payout.
We note that the chemical, building material, and auto suppliers sectors reduced their respective
debt levels in 2013, due to decreasing expansion opportunities or a slowdown in capital
expenditure plans, which we believe are unlikely to change over the next one to two years.
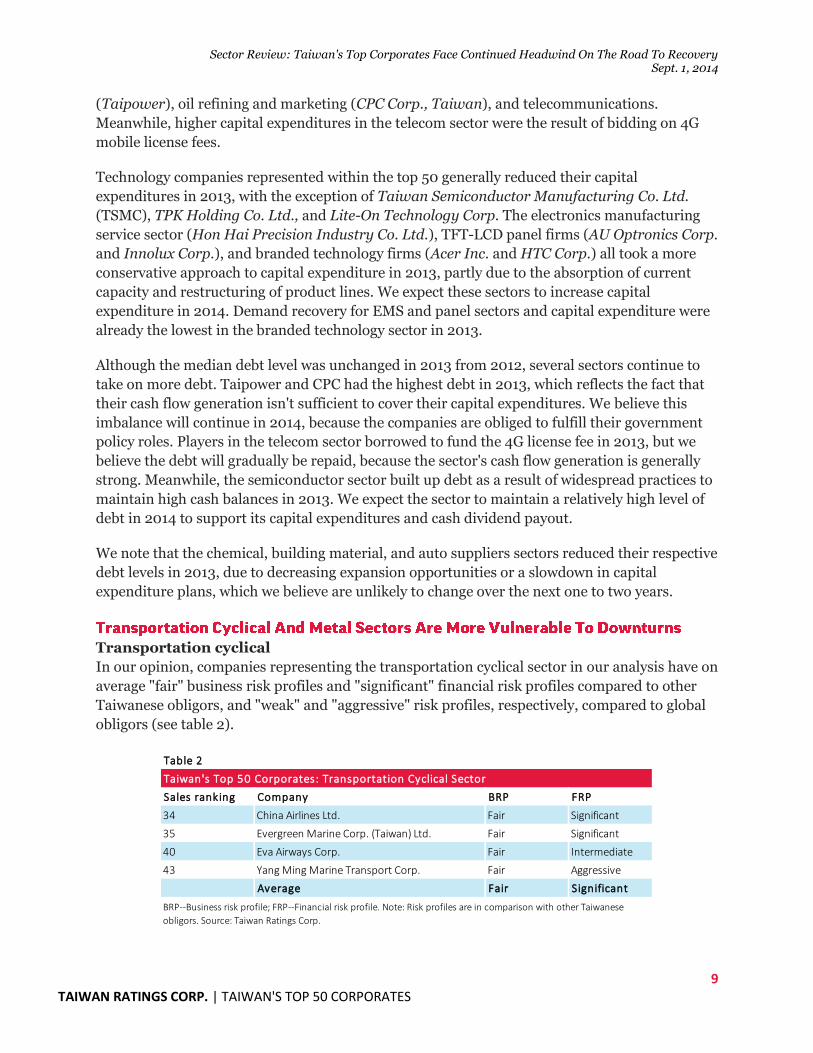
Transportation cyclical
In our opinion, companies representing the transportation cyclical sector in our analysis have on
average "fair" business risk profiles and "significant" financial risk profiles compared to other
Taiwanese obligors, and "weak" and "aggressive" risk profiles, respectively, compared to global
obligors (see table 2).
Sales ranking Company BRP FRP
34 China Airlines Ltd. Fair Significant
35 Evergreen Marine Corp. (Taiwan) Ltd. Fair Significant
40 Eva Airways Corp. Fair Intermediate
43 Yang Ming Marine Transport Corp. Fair Aggressive
Average Fair Significant
Table 2
Taiwan's Top 50 Corporates: Transportation Cyclical Sector
BRP--Business risk profile; FRP--Financial risk profile. Note: Risk profiles are in comparison with other Taiwanese
obligors. Source: Taiwan Ratings Corp.
Sector Review: Taiwan's Top Corporates Face Continued Headwind On The Road To Recovery Sept. 1, 2014
10 TAIWAN RATINGS CORP. | TAIWAN'S TOP 50 CORPORATES
We believe that sliding demand in the highly cyclical shipping subsector has just about
bottomed out. However, we anticipate that business volatility will remain high given our view
that the problem of oversupply is unlikely to end anytime soon. In particular, we believe that
container freight rates will not rebound significantly and could stay near their lowest point for
much longer than in previous downturns. Airlines are also likely to see business conditions
remain weak (excluding cross-Strait routes between Taiwan and China), given rising
competition particularly from low-cost carriers, and weaker cargo performance. However, direct
cross-Strait flights and stable fuel prices could partly support airlines' performances over the
next year. We believe that direct flights between Taiwan and China that are not code shared with
foreign carriers remain highly undersupplied, supporting more stable pricing for the route.
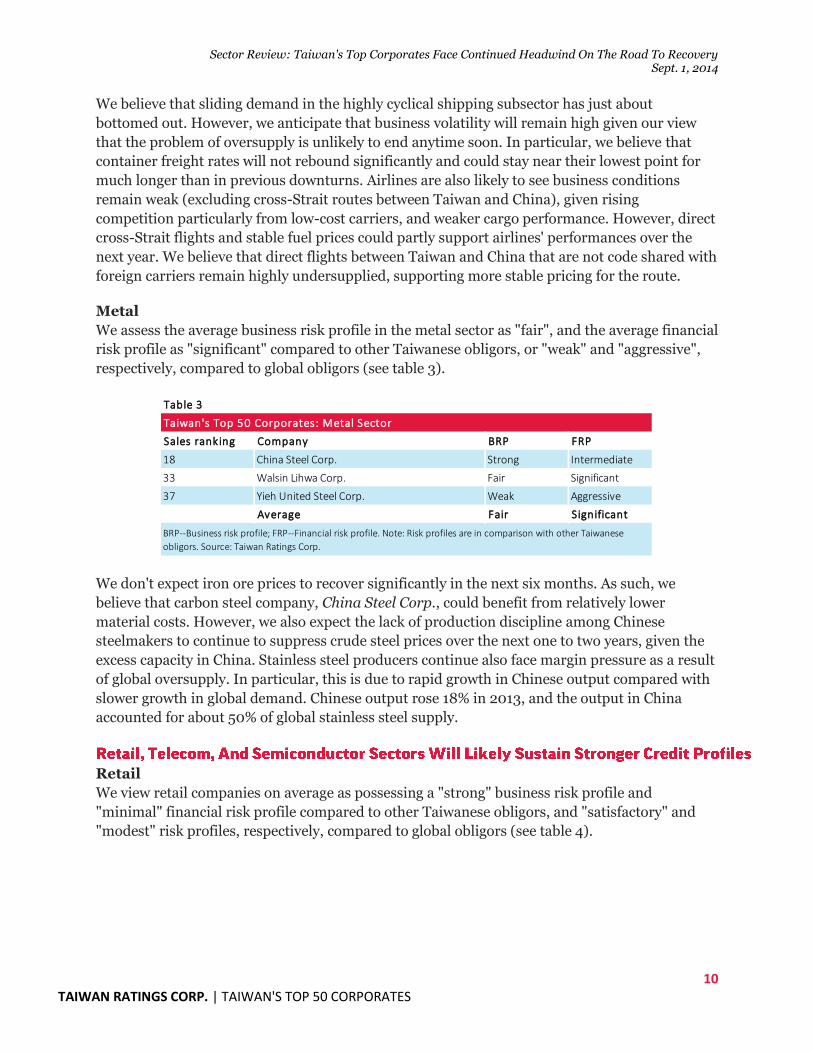
Metal
We assess the average business risk profile in the metal sector as "fair", and the average financial
risk profile as "significant" compared to other Taiwanese obligors, or "weak" and "aggressive",
respectively, compared to global obligors (see table 3).
We don't expect iron ore prices to recover significantly in the next six months. As such, we
believe that carbon steel company, China Steel Corp., could benefit from relatively lower
material costs. However, we also expect the lack of production discipline among Chinese
steelmakers to continue to suppress crude steel prices over the next one to two years, given the
excess capacity in China. Stainless steel producers continue also face margin pressure as a result
of global oversupply. In particular, this is due to rapid growth in Chinese output compared with
slower growth in global demand. Chinese output rose 18% in 2013, and the output in China
accounted for about 50% of global stainless steel supply.
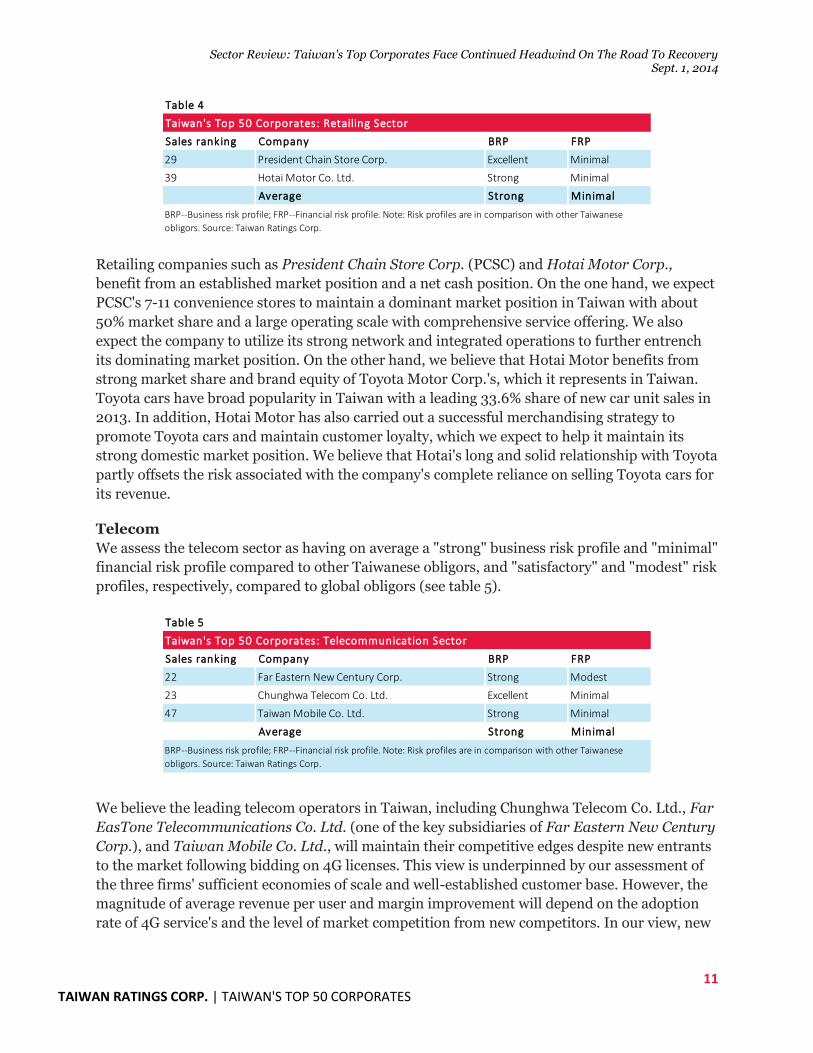
Retail
We view retail companies on average as possessing a "strong" business risk profile and
"minimal" financial risk profile compared to other Taiwanese obligors, and "satisfactory" and
"modest" risk profiles, respectively, compared to global obligors (see table 4).
Sales ranking Company BRP FRP
18 China Steel Corp. Strong Intermediate
33 Walsin Lihwa Corp. Fair Significant
37 Yieh United Steel Corp. Weak Aggressive
Average Fair Significant
Table 3
Taiwan's Top 50 Corporates: Metal Sector
BRP--Business risk profile; FRP--Financial risk profile. Note: Risk profiles are in comparison with other Taiwanese
obligors. Source: Taiwan Ratings Corp.
Sector Review: Taiwan's Top Corporates Face Continued Headwind On The Road To Recovery Sept. 1, 2014
11 TAIWAN RATINGS CORP. | TAIWAN'S TOP 50 CORPORATES
Retailing companies such as President Chain Store Corp. (PCSC) and Hotai Motor Corp.,
benefit from an established market position and a net cash position. On the one hand, we expect
PCSC's 7-11 convenience stores to maintain a dominant market position in Taiwan with about
50% market share and a large operating scale with comprehensive service offering. We also
expect the company to utilize its strong network and integrated operations to further entrench
its dominating market position. On the other hand, we believe that Hotai Motor benefits from
strong market share and brand equity of Toyota Motor Corp.'s, which it represents in Taiwan.
Toyota cars have broad popularity in Taiwan with a leading 33.6% share of new car unit sales in
2013. In addition, Hotai Motor has also carried out a successful merchandising strategy to
promote Toyota cars and maintain customer loyalty, which we expect to help it maintain its
strong domestic market position. We believe that Hotai's long and solid relationship with Toyota
partly offsets the risk associated with the company's complete reliance on selling Toyota cars for
its revenue.
Telecom
We assess the telecom sector as having on average a "strong" business risk profile and "minimal"
financial risk profile compared to other Taiwanese obligors, and "satisfactory" and "modest" risk
profiles, respectively, compared to global obligors (see table 5).
We believe the leading telecom operators in Taiwan, including Chunghwa Telecom Co. Ltd., Far
EasTone Telecommunications Co. Ltd. (one of the key subsidiaries of Far Eastern New Century
Corp.), and Taiwan Mobile Co. Ltd., will maintain their competitive edges despite new entrants
to the market following bidding on 4G licenses. This view is underpinned by our assessment of
the three firms' sufficient economies of scale and well-established customer base. However, the
magnitude of average revenue per user and margin improvement will depend on the adoption
rate of 4G service's and the level of market competition from new competitors. In our view, new
Sales ranking Company BRP FRP
29 President Chain Store Corp. Excellent Minimal
39 Hotai Motor Co. Ltd. Strong Minimal
Average Strong Minimal
Table 4
Taiwan's Top 50 Corporates: Retailing Sector
BRP--Business risk profile; FRP--Financial risk profile. Note: Risk profiles are in comparison with other Taiwanese
obligors. Source: Taiwan Ratings Corp.
Sales ranking Company BRP FRP
22 Far Eastern New Century Corp. Strong Modest
23 Chunghwa Telecom Co. Ltd. Excellent Minimal
47 Taiwan Mobile Co. Ltd. Strong Minimal
Average Strong Minimal
Table 5
Taiwan's Top 50 Corporates: Telecommunication Sector
BRP--Business risk profile; FRP--Financial risk profile. Note: Risk profiles are in comparison with other Taiwanese
obligors. Source: Taiwan Ratings Corp.
Sector Review: Taiwan's Top Corporates Face Continued Headwind On The Road To Recovery Sept. 1, 2014
12 TAIWAN RATINGS CORP. | TAIWAN'S TOP 50 CORPORATES
telecom companies are unlikely to weaken the leading operators' credit profiles over the next
two to three years, given their established user base and more comprehensive service offering.
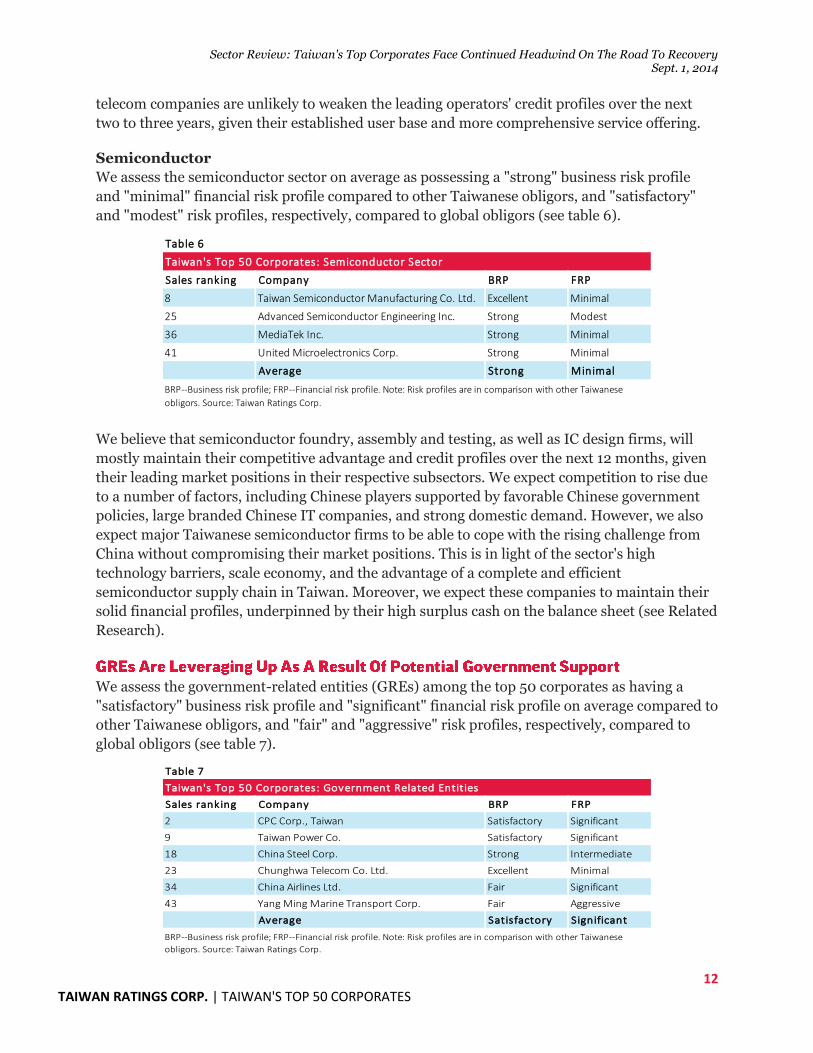
Semiconductor
We assess the semiconductor sector on average as possessing a "strong" business risk profile
and "minimal" financial risk profile compared to other Taiwanese obligors, and "satisfactory"
and "modest" risk profiles, respectively, compared to global obligors (see table 6).
We believe that semiconductor foundry, assembly and testing, as well as IC design firms, will
mostly maintain their competitive advantage and credit profiles over the next 12 months, given
their leading market positions in their respective subsectors. We expect competition to rise due
to a number of factors, including Chinese players supported by favorable Chinese government
policies, large branded Chinese IT companies, and strong domestic demand. However, we also
expect major Taiwanese semiconductor firms to be able to cope with the rising challenge from
China without compromising their market positions. This is in light of the sector's high
technology barriers, scale economy, and the advantage of a complete and efficient
semiconductor supply chain in Taiwan. Moreover, we expect these companies to maintain their
solid financial profiles, underpinned by their high surplus cash on the balance sheet (see Related
Research).
We assess the government-related entities (GREs) among the top 50 corporates as having a
"satisfactory" business risk profile and "significant" financial risk profile on average compared to
other Taiwanese obligors, and "fair" and "aggressive" risk profiles, respectively, compared to
global obligors (see table 7).
Sales ranking Company BRP FRP
8 Taiwan Semiconductor Manufacturing Co. Ltd. Excellent Minimal
25 Advanced Semiconductor Engineering Inc. Strong Modest
36 MediaTek Inc. Strong Minimal
41 United Microelectronics Corp. Strong Minimal
Average Strong Minimal
Table 6
Taiwan's Top 50 Corporates: Semiconductor Sector
BRP--Business risk profile; FRP--Financial risk profile. Note: Risk profiles are in comparison with other Taiwanese
obligors. Source: Taiwan Ratings Corp.
Sales ranking Company BRP FRP
2 CPC Corp., Taiwan Satisfactory Significant
9 Taiwan Power Co. Satisfactory Significant
18 China Steel Corp. Strong Intermediate
23 Chunghwa Telecom Co. Ltd. Excellent Minimal
34 China Airlines Ltd. Fair Significant
43 Yang Ming Marine Transport Corp. Fair Aggressive
Average Satisfactory Significant
Table 7
BRP--Business risk profile; FRP--Financial risk profile. Note: Risk profiles are in comparison with other Taiwanese
obligors. Source: Taiwan Ratings Corp.
Taiwan's Top 50 Corporates: Government Related Entities
Sector Review: Taiwan's Top Corporates Face Continued Headwind On The Road To Recovery Sept. 1, 2014
13 TAIWAN RATINGS CORP. | TAIWAN'S TOP 50 CORPORATES
The GREs in our survey cover various sectors, from the low industry risk regulated utilities
sector (Taipower) to the high industry risk transportation cyclical sector (China Airlines Ltd.
and Yang Ming Marine Transport Corp.). Excluding the exceptional case of Chunghwa
Telecom Co. Ltd., the financial leverage of these GREs is generally higher than that of the
average of the top 50 companies. However, we believe these GREs will maintain their better
access to capital markets and higher interest coverage ratios than similarly leveraged non-GRE
peers partly due to their government-owned status. This status is underpinned by both entities'
government ownership and their policy carrying roles, which enable the local credit market to
finance their balance sheet on the basis of government support. The Taiwan government has in
the past demonstrated its financial support for weaker GREs, in the case of two transportation
companies. Moreover, the government still owns several large and important banks, which are
also likely to provide funding flexibility to GREs in times of stress.
Taiwan Ratings expects the island's top 50 corporates to further strengthen their profitability
and credit profiles over the next 12 to 24 months. But the gradually improving global economy
doesn't guarantee a swift recovery for all corporates. The risk of an economic slowdown in China
could negatively affect the creditworthiness of companies that face supply overcapacity in China
or for which the country serves as their main revenue source. In additional, transportation
cyclical and metal sectors are particularly vulnerable to economic downturns and have the
weakest business and financial risk profiles among the 50 corporates we studied.
Nevertheless, we believe that Taiwan's competitive banking sector and strong liquidity in the
domestic financial market provide a short-term liquidity buffer for larger corporates. Moreover,
the low cost of holding cash generally helps island's largest companies to maintain high cash
balances and stronger liquidity to weather future downturns. The key to future profitability and
stronger credit profiles could rest on a number of factors, but key among these are the potential
for a free trade agreement with China, better product differentiation, and building technology
barriers to restrict long-term competition.
Corporate Methodology, Nov. 19, 2013
Methodology: Industry Risk, Nov. 19, 2013
Corporate Methodology: Ratios And Adjustments, Nov. 19, 2013
Country Risk Assessment Methodology And Assumptions, Nov. 19, 2013
Taiwan's IT Hardware Sector Wrestles With Increasing Risk From Chinese Competitors, Sept. 1, 2014
Asia-Pacific Economic Outlook: China Embraces Risk And Japan Provides An Unexpected Boost, www.globalcreditportal, June 9, 2014
Challenges Remain For Some Asia-Pacific Sectors In Q2 2014, www.globalcreditportal, June 9, 2014
Asia-Pacific Credit Outlook 2Q 2014: Auto, Oil And Gas Outperform Others As Negative Bias Persists, www.globalcreditportal, June 9, 2014
(Unless otherwise stated, these articles are published on www.standardandpoors.com, access to which requires a registered account)
Under Taiwan Ratings' Standard & Poor's policies, only a Rating Committee can determine a Credit Rating Action (including a
Credit Rating change, affirmation or withdrawal, Rating Outlook change, or CreditWatch action). This commentary and its subject
matter have not been the subject of Rating Committee action and should not be interpreted as a change to, or affirmation of, a Credit
Rating or Rating Outlook.
14 TAIWAN RATINGS CORP. | TAIWAN'S TOP 50 CORPORATES
Service Description "Ratings Export" is a custom-made fee service capable of exporting TRC's rating updates to its data users via digital transmission. The service of which is as follows: 1. Transmission method: via email or FTP. 2. Frequency of Transmission: On the same day of any rating updates or every month. 3. Content of transmission: Data feed to be included in the "Ratings Export" mainly includes "Public
issuer credit rating records" and "Issue rating records". TRC will generate a data feed according to the above format upon completion of any rating actions, and will send out the data to the data user's server as an update on an intra-day basis, enabling users to update their respective database via the GUI number or ISIN Code. The "Ratings Export" service will enable users to keep abreast of any new rating changes, thereby gaining a clearer picture of the distribution of their overall risk categories as well as establishing their own internal credit rating model and risk premiums. For fee inquiries or to apply for the "Ratings Export" service, please contact our client services representative Iris Chu/New Product Division, +886 2-8722-5870; [email protected]
Contact Us
Iris Chu (886) 2 8722-5870; [email protected]
Jenny Wu (886) 2 8722-5873; [email protected]
Sector Review: Taiwan's IT Hardware Sector Wrestles With Increasing Risk From Chinese Competitors Sept. 1, 2014
15 TAIWAN RATINGS CORP. | TAIWAN'S TOP 50 CORPORATES
Primary Credit Analyst:
Raymond Hsu, CFA, Taipei, (886) 28722-5827; [email protected]
Secondary Contact:
Daniel Hsiao, Taipei, (886) 2 8722-5826; [email protected]
Chinese manufacturers of low-priced IT products and components are widening their global
market share. This could pose a significant threat to more established Taiwanese peers in
competing hardware subsectors. Taiwan Ratings Corp. expects the pressure on Taiwanese credit
profiles to strengthen over time, but the impact on individual players will depend on the level of
product differentiation and technology barriers in each subsector.
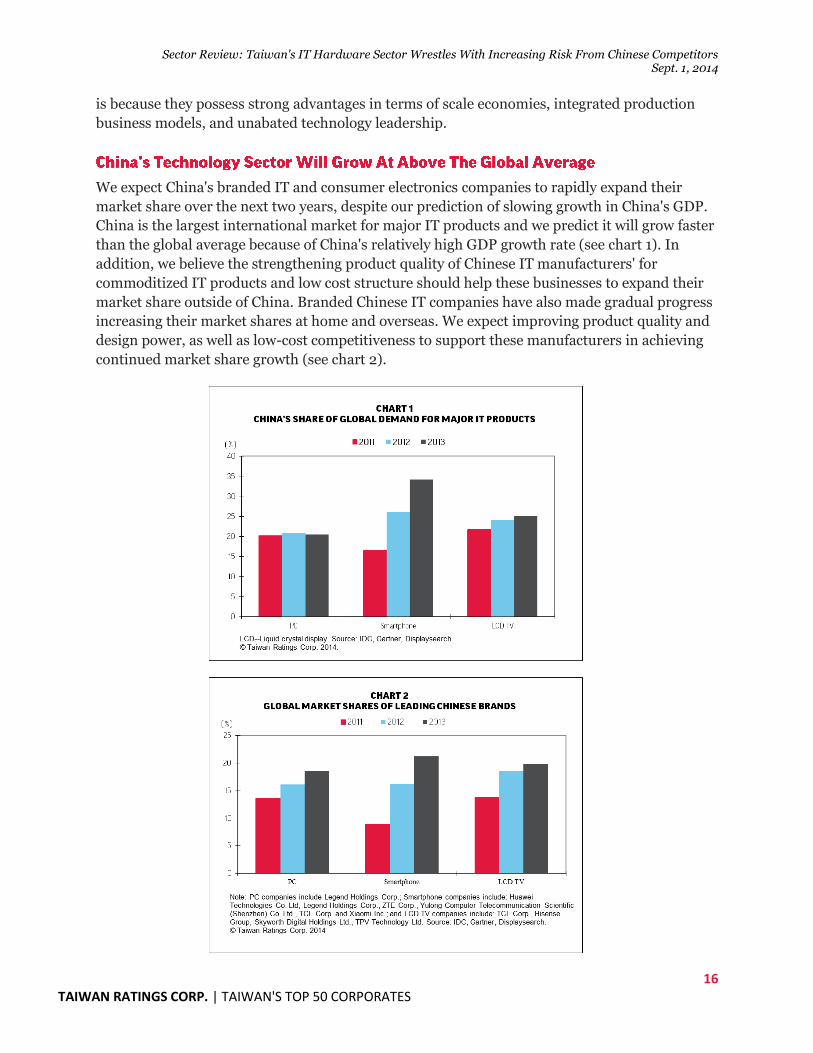
We expect China's IT sector to maintain rapid growth over the next few years. This is supported
by the nation's fast-growing IT market, low cost structure, and businesses' accumulated learning
curve as the global hub for IT manufacturing. Manufacturers also have the support of Chinese
government policy, which promotes the development of important technology segments such as
semiconductors and thin-film-transistor liquid crystal display (TFT-LCD) manufacturing.
Moreover, we expect China's branded technology hardware firms to make substantial progress
increasing their share of major IT product markets over the next few quarters. This development
will likely foster a stronger local supply chain in China and increase competition for Taiwanese
technology companies in the regional IT supply chain.
Overview:
China's branded IT hardware companies are likely to make significant market gains and
strengthen their local supply chain over the next few quarters.
The majority of Taiwan's largest high tech firms will continue to benefit from scale
advantages, product differentiation and technology leadership, but commoditized
product manufacturers are likely to suffer from rising Chinese competition.
Branded IT companies and TFT-LCD panel makers will experience the highest
competition risk from Chinese competitors, but semiconductor and EMS firms should
be able to cope with rising challenges.
In our opinion, branded IT product and TFT LCD manufacturing companies in Taiwan will
continue to face substantial margin and market pressure. This is despite some differentiation in
technology and quality in their respective sectors. The potential realization of a free trade
agreement between Taiwan and China will likely bring only short-term relief to Taiwanese
panels makers, whose futures remain dependent on individual product and technology
differentiation. Component manufacturers such as printed circuit board (PCB) makers are also
likely to experience more intense competition given Chinese peers' improving manufacturing
capability. But Taiwan's leading electronic manufacturing services (EMS) and semiconductor
companies are better equipped to cope with the growing challenge from China, in our view. This
Sector Review: Taiwan's IT Hardware Sector Wrestles With Increasing Risk From Chinese Competitors Sept. 1, 2014
16 TAIWAN RATINGS CORP. | TAIWAN'S TOP 50 CORPORATES
is because they possess strong advantages in terms of scale economies, integrated production
business models, and unabated technology leadership.
We expect China's branded IT and consumer electronics companies to rapidly expand their
market share over the next two years, despite our prediction of slowing growth in China's GDP.
China is the largest international market for major IT products and we predict it will grow faster
than the global average because of China's relatively high GDP growth rate (see chart 1). In
addition, we believe the strengthening product quality of Chinese IT manufacturers' for
commoditized IT products and low cost structure should help these businesses to expand their
market share outside of China. Branded Chinese IT companies have also made gradual progress
increasing their market shares at home and overseas. We expect improving product quality and
design power, as well as low-cost competitiveness to support these manufacturers in achieving
continued market share growth (see chart 2).
Sector Review: Taiwan's IT Hardware Sector Wrestles With Increasing Risk From Chinese Competitors Sept. 1, 2014
17 TAIWAN RATINGS CORP. | TAIWAN'S TOP 50 CORPORATES
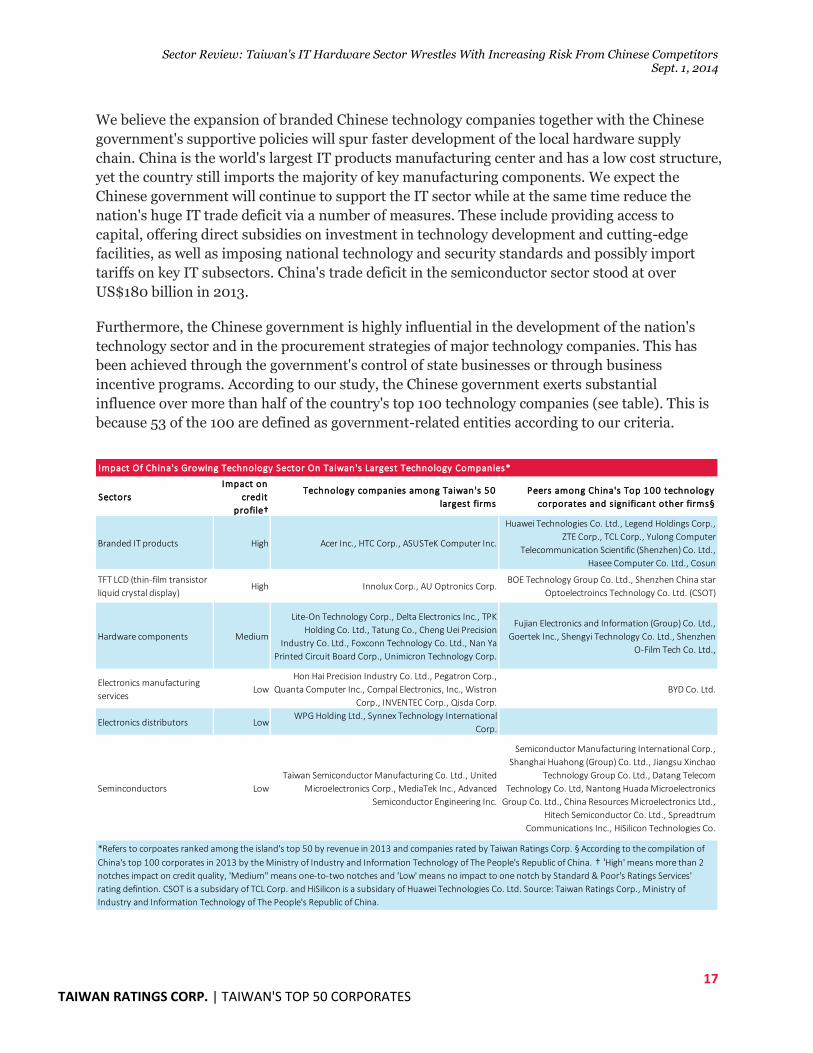
We believe the expansion of branded Chinese technology companies together with the Chinese
government's supportive policies will spur faster development of the local hardware supply
chain. China is the world's largest IT products manufacturing center and has a low cost structure,
yet the country still imports the majority of key manufacturing components. We expect the
Chinese government will continue to support the IT sector while at the same time reduce the
nation's huge IT trade deficit via a number of measures. These include providing access to
capital, offering direct subsidies on investment in technology development and cutting-edge
facilities, as well as imposing national technology and security standards and possibly import
tariffs on key IT subsectors. China's trade deficit in the semiconductor sector stood at over
US$180 billion in 2013.
Furthermore, the Chinese government is highly influential in the development of the nation's
technology sector and in the procurement strategies of major technology companies. This has
been achieved through the government's control of state businesses or through business
incentive programs. According to our study, the Chinese government exerts substantial
influence over more than half of the country's top 100 technology companies (see table). This is
because 53 of the 100 are defined as government-related entities according to our criteria.
Sectors
Impact on
credit
profile†
Technology companies among Taiwan's 50
largest firms
Peers among China's Top 100 technology
corporates and significant other firms§
Branded IT products High Acer Inc., HTC Corp., ASUSTeK Computer Inc.
Huawei Technologies Co. Ltd., Legend Holdings Corp.,
ZTE Corp., TCL Corp., Yulong Computer
Telecommunication Scientific (Shenzhen) Co. Ltd.,
Hasee Computer Co. Ltd., Cosun
TFT LCD (thin-film transistor
liquid crystal display)High Innolux Corp., AU Optronics Corp.
BOE Technology Group Co. Ltd., Shenzhen China star
Optoelectroincs Technology Co. Ltd. (CSOT)
Hardware components Medium
Lite-On Technology Corp., Delta Electronics Inc., TPK
Holding Co. Ltd., Tatung Co., Cheng Uei Precision
Industry Co. Ltd., Foxconn Technology Co. Ltd., Nan Ya
Printed Circuit Board Corp., Unimicron Technology Corp.
Fujian Electronics and Information (Group) Co. Ltd.,
Goertek Inc., Shengyi Technology Co. Ltd., Shenzhen
O-Film Tech Co. Ltd.,
Electronics manufacturing
servicesLow
Hon Hai Precision Industry Co. Ltd., Pegatron Corp.,
Quanta Computer Inc., Compal Electronics, Inc., Wistron
Corp., INVENTEC Corp., Qisda Corp.
BYD Co. Ltd.
Electronics distributors LowWPG Holding Ltd., Synnex Technology International
Corp.
Seminconductors Low
Taiwan Semiconductor Manufacturing Co. Ltd., United
Microelectronics Corp., MediaTek Inc., Advanced
Semiconductor Engineering Inc.
Semiconductor Manufacturing International Corp.,
Shanghai Huahong (Group) Co. Ltd., Jiangsu Xinchao
Technology Group Co. Ltd., Datang Telecom
Technology Co. Ltd, Nantong Huada Microelectronics
Group Co. Ltd., China Resources Microelectronics Ltd.,
Hitech Semiconductor Co. Ltd., Spreadtrum
Communications Inc., HiSilicon Technologies Co.
Impact Of China's Growing Technology Sector On Taiwan's Largest Technology Companies*
*Refers to corpoates ranked among the island's top 50 by revenue in 2013 and companies rated by Taiwan Ratings Corp. § According to the compilation of
China's top 100 corporates in 2013 by the Ministry of Industry and Information Technology of The People's Republic of China. † 'High' means more than 2
notches impact on credit quality, 'Medium" means one-to-two notches and 'Low' means no impact to one notch by Standard & Poor's Ratings Services'
rating defintion. CSOT is a subsidary of TCL Corp. and HiSilicon is a subsidary of Huawei Technologies Co. Ltd. Source: Taiwan Ratings Corp., Ministry of
Industry and Information Technology of The People's Republic of China.
Sector Review: Taiwan's IT Hardware Sector Wrestles With Increasing Risk From Chinese Competitors Sept. 1, 2014
18 TAIWAN RATINGS CORP. | TAIWAN'S TOP 50 CORPORATES
In our opinion, Taiwanese branded hardware companies including smartphone manufacturers
will continue to face severe competition due to their lack of product differentiation and control
on operating systems. Smartphone and consumer electronics companies such as HTC Corp. face
particular downside risk due to intense price competition from their Chinese counterparts. We
believe that branded PC companies, such as Acer Inc. and ASUSTeK Computer Inc. will also
experience rising pressure from Chinese competitors including Legend Holdings Corp.
However, the downside risk for PC companies is somewhat offset by the fact that the PC market
is likely to become more consolidated with a low likelihood of significant competition from new
entrants over the next two to three years.
Taiwanese TFT-LCD companies are most vulnerable to Chinese competition, in our view. This is
due to Chinese panel makers' aggressive expansion and the Chinese government's support for
this sector through import tariffs and subsidies on technology and new facilities. Taiwanese
panel makers have a weaker position in high-end small-to-mid-size panels, which aggravates
their competitive risk despite manufacturers' progress in transforming their product mix.
However, we expect that if executed the proposed free trade agreement will remove this pricing
disadvantage. In addition, we believe that large Taiwanese panel makers such as AU Optronics
Inc. and Innolux Corp. can maintain their product performance and production cost advantages
if they can maintain technology leadership over the next two years.
We expect other Taiwanese hardware component makers to face a high risk of market share and
margin erosion due to a strengthening supply chain in China. We also believe Taiwanese
manufacturers of commoditized products such as solar cells will continue to experience
significant margin pressure from Chinese and Korean competitors. A growing Chinese supply
chain could also affect sectors that require higher technology and product customization such as
PCB and mechanical parts where Chinese companies have a significant presence in low-end
products. However, we believe that leading Taiwanese PCB, power supply and mechanical parts
companies possess better technology that will help them to maintain their market positions over
the next one to two years.
We believe that Taiwanese EMS companies can maintain a competitive edge and satisfactory
margins against their Chinese rivals despite the rapid growth of a competing supply chain in
China. In our view, Chinese companies still lack scale economies, product development
capability, and more importantly the integration into upstream component manufacturing that
could help customers to shorten design and production cycles.
In addition, Taiwanese companies continue to benefit from their global production and logistics
networks that strengthen individual competitive positions, given manufacturers' long track
records serving global branded IT companies. Taiwanese original design manufacturing (ODM)
and EMS companies are also highly efficient at controlling their cost structure as evidenced by
their management of rising production costs in China. Nonetheless, competition from Chinese
EMS companies could still pressure margins for their Taiwanese counterparts, whose clients can
Sector Review: Taiwan's IT Hardware Sector Wrestles With Increasing Risk From Chinese Competitors Sept. 1, 2014
19 TAIWAN RATINGS CORP. | TAIWAN'S TOP 50 CORPORATES
benchmark the pricing offered by Chinese competitors.
We believe that high technology barriers will help Taiwan's semiconductor supply chain to
retain most of its competitive advantages over the next two to three years, despite the Chinese
government's strong support for competing Chinese firms. The most advanced foundry
company in China, Semiconductor Manufacturing International Corp. (SMIC) is still at least
two generations behind Taiwanese competitor Taiwan Semiconductor Manufacturing Co. Ltd.
(TSMC) in terms of leading-edge process technology. In addition, we believe that SMIC's volume
production using 28 nanometer process technologies is still at least several quarters behind the
other leading Taiwanese competitor, United Microelectronics Corp. This is despite the fact that
SMIC has recently improved its performance by focusing on specialty processes and capacity
utilization. We do not expect SMIC to substantially narrow its technology gap with leading
foundries over the next two to three years.
In the outsourced semiconductor assembly and testing (OSAT) sector, we expect the leading
Taiwanese companies by revenue to continue to expand their market shares, because of the high
levels of technology, scale and customization required for newcomers to compete effectively. The
top three Taiwanese OSAT companies increased their aggregate global market share to 33.3% in
2013, up from 32.5% in 2012. We expect this share to increase, given the firms' leading position
in advanced products. Chinese OSAT companies are unlikely to represent competition
significant threat over the next one to two years, considering the still limited size of China's
foundry sector and foundries' substantial technology lag.
Conversely, Taiwan's IC design sector is likely to face higher competition risk from Chinese
peers given that Chinese companies have a stronger position in the global communications
equipment market. We believe the Chinese government's favorable IT policies coupled with the
support of large branded IT companies and strong domestic demand will accelerate the reach
and competitiveness of Chinese IC designers over the next two to three years. However, we
expect Taiwan's large IC design houses such as MediaTek Inc. to be able to maintain their
technology leadership over the next two years. These companies possess good research and
development capabilities to provide better total solutions than their Chinese peers such as
Spreadtrum Communications Inc. and HiSilicon Technologies Co.
In Taiwan Ratings' opinion, the free trade agreement with China could positively affect only a
few Taiwanese technology companies, particularly those in the TFT LCD industry. It could not
strengthen pricing competitiveness in other technology subsectors given their significant
production output in China and the fact that most IT products and components imported to
China are tariff free. We also believe that prevailing low funding costs and ample liquidity in
Taiwan's banking sector offer only a short-term buffer against potential business volatility. In
our view, technology leadership and product and service differentiation are keys to helping
Taiwanese technology firms cope with rising competition from China. Crucially, we believe that
Taiwan's branded IT companies and TFT-LCD panel makers are particularly susceptible to
Sector Review: Taiwan's IT Hardware Sector Wrestles With Increasing Risk From Chinese Competitors Sept. 1, 2014
20 TAIWAN RATINGS CORP. | TAIWAN'S TOP 50 CORPORATES
weakening competitive positions and credit profiles over the next two to three years if they fail
to increase their product differentiation.
Economic Research: Asia-Pacific Economic Outlook: China Embraces Risk And Japan Provides An
Unexpected Boost, www.globalcreditportal.com, June 9, 2014
Under Taiwan Ratings' policies, only a Rating Committee can determine a Credit Rating Action (including a Credit Rating change,
affirmation or withdrawal, Rating Outlook change, or CreditWatch action). This commentary and its subject matter have not been
the subject of Rating Committee action and should not be interpreted as a change to, or affirmation of, a Credit Rating or Rating
Outlook.
21 TAIWAN RATINGS CORP. | TAIWAN'S TOP 50 CORPORATES
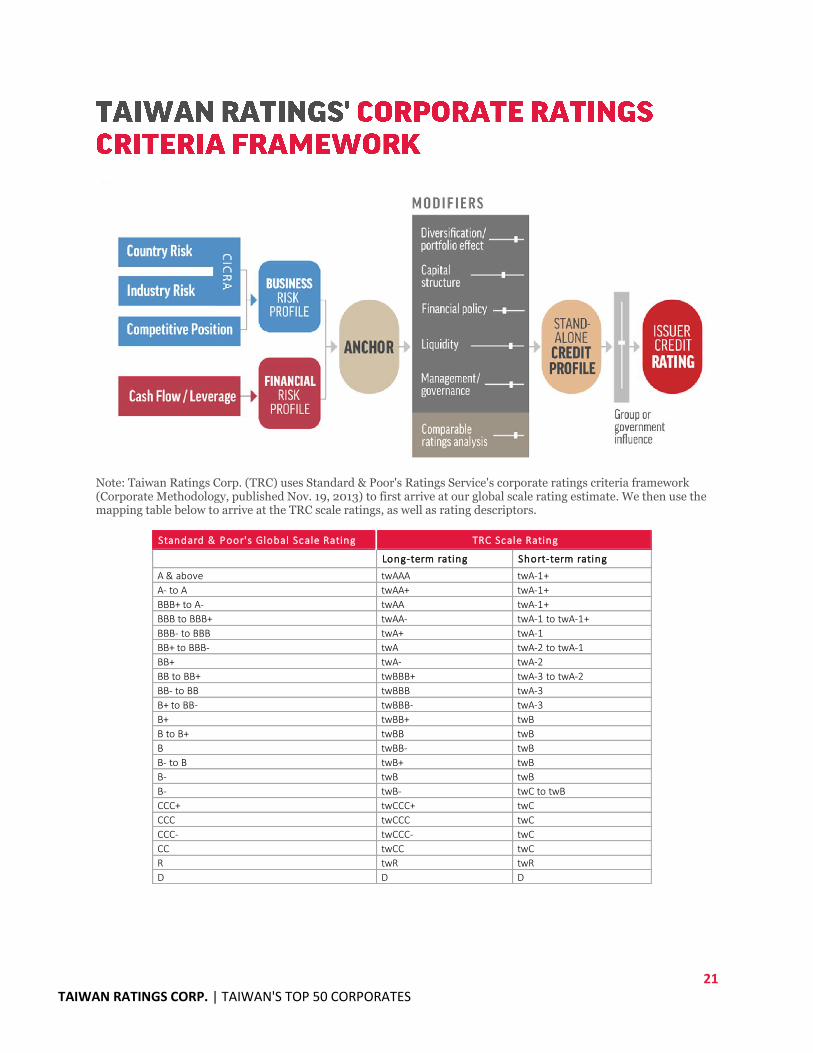
Note: Taiwan Ratings Corp. (TRC) uses Standard & Poor's Ratings Service's corporate ratings criteria framework (Corporate Methodology, published Nov. 19, 2013) to first arrive at our global scale rating estimate. We then use the mapping table below to arrive at the TRC scale ratings, as well as rating descriptors.
Standard & Poor's Global Scale Rating
Long-term rating Short-term rating
A & above twAAA twA-1+
A- to A twAA+ twA-1+
BBB+ to A- twAA twA-1+
BBB to BBB+ twAA- twA-1 to twA-1+
BBB- to BBB twA+ twA-1
BB+ to BBB- twA twA-2 to twA-1
BB+ twA- twA-2
BB to BB+ twBBB+ twA-3 to twA-2
BB- to BB twBBB twA-3
B+ to BB- twBBB- twA-3
B+ twBB+ twB
B to B+ twBB twB
B twBB- twB
B- to B twB+ twB
B- twB twB
B- twB- twC to twB
CCC+ twCCC+ twC
CCC twCCC twC
CCC- twCCC- twC
CC twCC twC
R twR twR
D D D
TRC Scale Rating
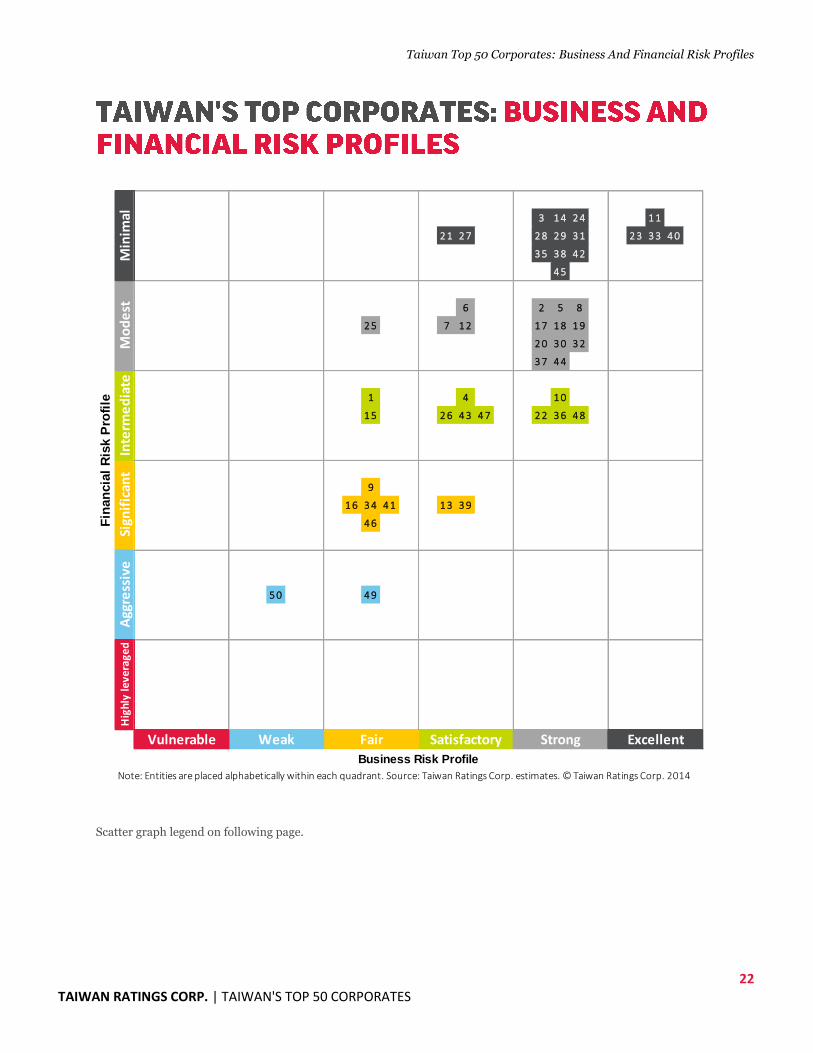
Taiwan Top 50 Corporates: Business And Financial Risk Profiles
22 TAIWAN RATINGS CORP. | TAIWAN'S TOP 50 CORPORATES
Scatter graph legend on following page.
3 1 4 2 4 1 1
2 1 2 7 2 8 2 9 3 1 2 3 3 3 4 0
3 5 3 8 4 2
4 5
6 2 5 8
2 5 7 1 2 1 7 1 8 1 9
2 0 3 0 3 2
3 7 4 4
1 4 1 0
1 5 2 6 4 3 4 7 2 2 3 6 4 8
9
1 6 3 4 4 1 1 3 3 9
4 6
5 0 4 9
Fair Strong ExcellentSatisfactory
Note: Entities are placed alphabetically within each quadrant. Source: Taiwan Ratings Corp. estimates. © Taiwan Ratings Corp. 2014
Vulnerable Weak
Business Risk Profile
Fin
an
cia
l R
isk P
rofi
le
Inte
rme
dia
teSi
gnif
ican
tA
ggre
ssiv
eH
ighl
y le
vera
ged
Min
imal
Mo
de
st
Taiwan Top 50 Corporates: Business And Financial Risk Profiles
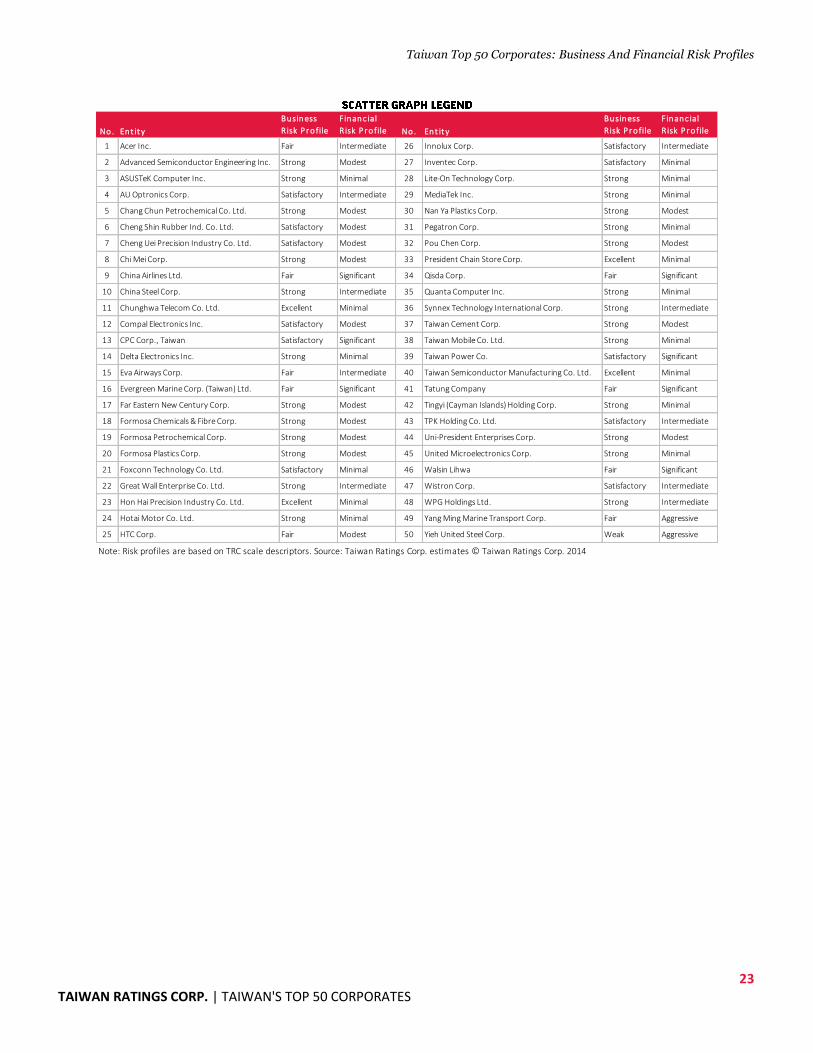
23 TAIWAN RATINGS CORP. | TAIWAN'S TOP 50 CORPORATES
No. En t it y
Business
R isk P rofile
Financ ial
R isk P rofile No. Ent it y
Business
R isk P rofile
Financ ial
R isk P rofile
1 Acer Inc. Fair Intermediate 26 Innolux Corp. Satisfactory Intermediate
2 Advanced Semiconductor Engineering Inc. Strong Modest 27 Inventec Corp. Satisfactory Minimal
3 ASUSTeK Computer Inc. Strong Minimal 28 Lite-On Technology Corp. Strong Minimal
4 AU Optronics Corp. Satisfactory Intermediate 29 MediaTek Inc. Strong Minimal
5 Chang Chun Petrochemical Co. Ltd. Strong Modest 30 Nan Ya Plastics Corp. Strong Modest
6 Cheng Shin Rubber Ind. Co. Ltd. Satisfactory Modest 31 Pegatron Corp. Strong Minimal
7 Cheng Uei Precision Industry Co. Ltd. Satisfactory Modest 32 Pou Chen Corp. Strong Modest
8 Chi Mei Corp. Strong Modest 33 President Chain Store Corp. Excellent Minimal
9 China Airlines Ltd. Fair Significant 34 Qisda Corp. Fair Significant
10 China Steel Corp. Strong Intermediate 35 Quanta Computer Inc. Strong Minimal
11 Chunghwa Telecom Co. Ltd. Excellent Minimal 36 Synnex Technology International Corp. Strong Intermediate
12 Compal Electronics Inc. Satisfactory Modest 37 Taiwan Cement Corp. Strong Modest
13 CPC Corp., Taiwan Satisfactory Significant 38 Taiwan Mobile Co. Ltd. Strong Minimal
14 Delta Electronics Inc. Strong Minimal 39 Taiwan Power Co. Satisfactory Significant
15 Eva Airways Corp. Fair Intermediate 40 Taiwan Semiconductor Manufacturing Co. Ltd. Excellent Minimal
16 Evergreen Marine Corp. (Taiwan) Ltd. Fair Significant 41 Tatung Company Fair Significant
17 Far Eastern New Century Corp. Strong Modest 42 Tingyi (Cayman Islands) Holding Corp. Strong Minimal
18 Formosa Chemicals & Fibre Corp. Strong Modest 43 TPK Holding Co. Ltd. Satisfactory Intermediate
19 Formosa Petrochemical Corp. Strong Modest 44 Uni-President Enterprises Corp. Strong Modest
20 Formosa Plastics Corp. Strong Modest 45 United Microelectronics Corp. Strong Minimal
21 Foxconn Technology Co. Ltd. Satisfactory Minimal 46 Walsin Lihwa Fair Significant
22 Great Wall Enterprise Co. Ltd. Strong Intermediate 47 Wistron Corp. Satisfactory Intermediate
23 Hon Hai Precision Industry Co. Ltd. Excellent Minimal 48 WPG Holdings Ltd. Strong Intermediate
24 Hotai Motor Co. Ltd. Strong Minimal 49 Yang Ming Marine Transport Corp. Fair Aggressive
25 HTC Corp. Fair Modest 50 Yieh United Steel Corp. Weak Aggressive
Note: Risk profiles are based on TRC scale descriptors. Source: Taiwan Ratings Corp. estimates © Taiwan Ratings Corp. 2014
Sept. 1, 2014
24 Disclaimer: Where an entity is assigned a public rating, a full analysis is available on our subscriber website rrs.taiwanratings.com.tw. For unrated entities, the credit summary only discusses the entity's business and financial risk profiles; it does not factor in the likelihood of government or group support.
TAIWAN RATINGS CORP. | TAIWAN'S TOP 50 CORPORATES
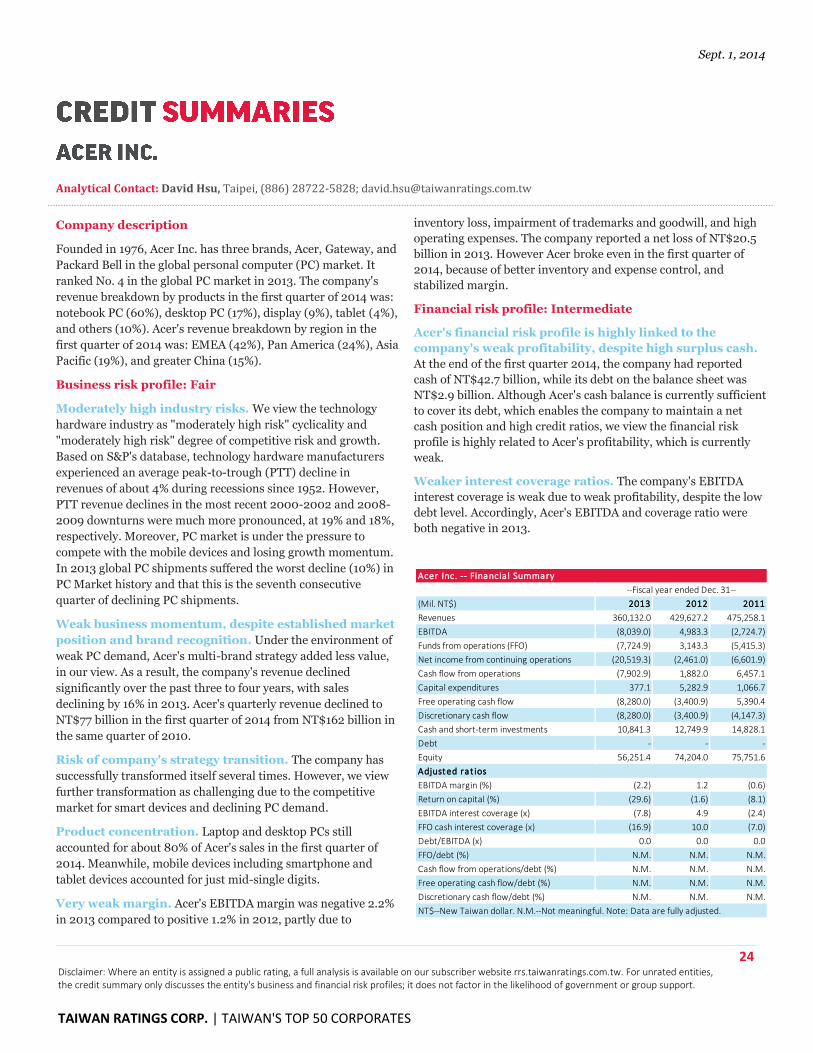
Analytical Contact: David Hsu, Taipei, (886) 28722-5828; [email protected]
Company description
Founded in 1976, Acer Inc. has three brands, Acer, Gateway, and
Packard Bell in the global personal computer (PC) market. It
ranked No. 4 in the global PC market in 2013. The company's
revenue breakdown by products in the first quarter of 2014 was:
notebook PC (60%), desktop PC (17%), display (9%), tablet (4%),
and others (10%). Acer's revenue breakdown by region in the
first quarter of 2014 was: EMEA (42%), Pan America (24%), Asia
Pacific (19%), and greater China (15%).
Business risk profile: Fair
Moderately high industry risks. We view the technology
hardware industry as "moderately high risk" cyclicality and
"moderately high risk" degree of competitive risk and growth.
Based on S&P's database, technology hardware manufacturers
experienced an average peak-to-trough (PTT) decline in
revenues of about 4% during recessions since 1952. However,
PTT revenue declines in the most recent 2000-2002 and 2008-
2009 downturns were much more pronounced, at 19% and 18%,
respectively. Moreover, PC market is under the pressure to
compete with the mobile devices and losing growth momentum.
In 2013 global PC shipments suffered the worst decline (10%) in
PC Market history and that this is the seventh consecutive
quarter of declining PC shipments.
Weak business momentum, despite established market
position and brand recognition. Under the environment of
weak PC demand, Acer's multi-brand strategy added less value,
in our view. As a result, the company's revenue declined
significantly over the past three to four years, with sales
declining by 16% in 2013. Acer's quarterly revenue declined to
NT$77 billion in the first quarter of 2014 from NT$162 billion in
the same quarter of 2010.
Risk of company's strategy transition. The company has
successfully transformed itself several times. However, we view
further transformation as challenging due to the competitive
market for smart devices and declining PC demand.
Product concentration. Laptop and desktop PCs still
accounted for about 80% of Acer's sales in the first quarter of
2014. Meanwhile, mobile devices including smartphone and
tablet devices accounted for just mid-single digits.
Very weak margin. Acer's EBITDA margin was negative 2.2%
in 2013 compared to positive 1.2% in 2012, partly due to
inventory loss, impairment of trademarks and goodwill, and high
operating expenses. The company reported a net loss of NT$20.5
billion in 2013. However Acer broke even in the first quarter of
2014, because of better inventory and expense control, and
stabilized margin.
Financial risk profile: Intermediate
Acer's financial risk profile is highly linked to the
company's weak profitability, despite high surplus cash.
At the end of the first quarter 2014, the company had reported
cash of NT$42.7 billion, while its debt on the balance sheet was
NT$2.9 billion. Although Acer's cash balance is currently sufficient
to cover its debt, which enables the company to maintain a net
cash position and high credit ratios, we view the financial risk
profile is highly related to Acer's profitability, which is currently
weak.
Weaker interest coverage ratios. The company's EBITDA
interest coverage is weak due to weak profitability, despite the low
debt level. Accordingly, Acer's EBITDA and coverage ratio were
both negative in 2013.
(Mil. NT$) 2013 2012 2011
Revenues 360,132.0 429,627.2 475,258.1
EBITDA (8,039.0) 4,983.3 (2,724.7)
Funds from operations (FFO) (7,724.9) 3,143.3 (5,415.3)
Net income from continuing operations (20,519.3) (2,461.0) (6,601.9)
Cash flow from operations (7,902.9) 1,882.0 6,457.1
Capital expenditures 377.1 5,282.9 1,066.7
Free operating cash flow (8,280.0) (3,400.9) 5,390.4
Discretionary cash flow (8,280.0) (3,400.9) (4,147.3)
Cash and short-term investments 10,841.3 12,749.9 14,828.1
Debt - - -
Equity 56,251.4 74,204.0 75,751.6
Adjusted rat ios
EBITDA margin (%) (2.2) 1.2 (0.6)
Return on capital (%) (29.6) (1.6) (8.1)
EBITDA interest coverage (x) (7.8) 4.9 (2.4)
FFO cash interest coverage (x) (16.9) 10.0 (7.0)
Debt/EBITDA (x) 0.0 0.0 0.0
FFO/debt (%) N.M. N.M. N.M.
Cash flow from operations/debt (%) N.M. N.M. N.M.
Free operating cash flow/debt (%) N.M. N.M. N.M.
Discretionary cash flow/debt (%) N.M. N.M. N.M.
NT$--New Taiwan dollar. N.M.--Not meaningful. Note: Data are fully adjusted.
--Fiscal year ended Dec. 31--
Acer Inc. -- Financia l Summary
Credit Summaries Sept. 1, 2014
25 Disclaimer: Where an entity is assigned a public rating, a full analysis is available on our subscriber website rrs.taiwanratings.com.tw. For unrated entities, the credit summary only discusses the entity's business and financial risk profiles; it does not factor in the likelihood of government or group support.
TAIWAN RATINGS CORP. | TAIWAN'S TOP 50 CORPORATES
Analytical Contact: Anne Kuo, CFA, Taipei, (886) 28722-5829; [email protected]
Company description
Established in 1984, Advanced Semiconductor Engineering Inc.
(ASE) is the world's largest backend semiconductor packaging
and testing service provider. It has production bases in Taiwan,
China, Korea, Malaysia, Singapore, Japan, and the U.S. The
company also provides electronics manufacturing services
(EMS) through Universal Scientific Industrial Co. Ltd. (USI),
which ASE acquired in 2010. In 2013, packaging, testing and
EMS accounted for 51%, 11% and 36%, respectively, of ASE's
total revenue.
Business risk profile: Strong
Largest player in the outsourced semiconductor
assembly and testing services (OSATS) market. We
expect ASE to maintain its leading position with revenue growth
above the industry average over the next one to two years. The
company sustained its No.1 position in the world's OSATS
market with a market share of 18.9% in 2013 according to
Gartner, and maintained a meaningful gap with the second
largest player, Amkor Technology Inc. which holds 11.8% market
share. We believe ASE's capability of integrating the IC
packaging and electronics manufacturing service (EMS) will
continue to support its lead market position because it helps the
company to capture stronger growth opportunities.
Stable profitability amid intensifying competition. ASE's
EBITDA margin declined to a low of 20% from about 30% after
it acquired USI in 2010. USI is engaged in EMS business which
carries a lower margin. We expect ASE's profitability to remain
average supported by its improving product mix and good
technology positioning amid intensifying margin pressure.
Satisfactory operating efficiency supported by
economies of scale and integrated business model.
ASE's operating efficiency is satisfactory, in our view, given the
company's good economies of scale and high capacity utilization.
Its operating efficiency is further enhanced by its established
integrated model with expertise in semiconductor assembly and
module business. This will continue to support ASE's growth
momentum and cost competitiveness, in our opinion.
Moderately high industry risks. ASE is subject to
moderately high industry risk, in our view. We assess the
technology hardware and semiconductor industry has a
"moderately high risk" assessment for cyclicality and a
"moderately high risk" assessment of competitive risk and
growth. Major industry risks for the OSATS segment include
rising price competition, rapid technological changes, and its
cyclical and highly capital intensive business nature. The relatively
stable structure of the OSATS market partly offsets these risks, in
our view.
Financial risk profile: Modest
Strong cash flow protection metrics due to stable cash
generation. We expect ASE to maintain its adjusted debt to
EBITDA below 1.5x over the next one to two years given our
expectation of the company's good growth momentum and stable
profitability. We expect ASE's capital expenditure to remain high
to support its growth in the following two to three years, but the
company will generate sufficient operating cash flow to meet its
capital expenditure and cash dividend payments. However, we
believe ASE's financial ratios could come under pressure during
periods of economic stress from high industry volatility in the
global semiconductor sector.
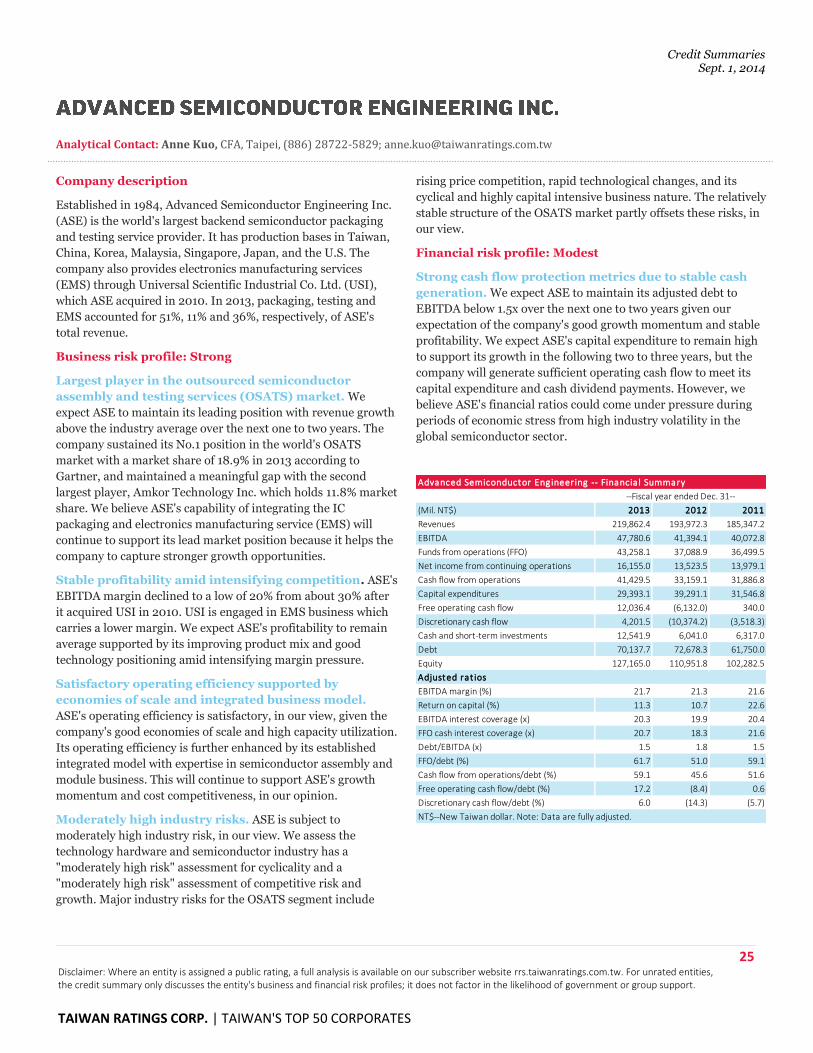
(Mil. NT$) 2013 2012 2011
Revenues 219,862.4 193,972.3 185,347.2
EBITDA 47,780.6 41,394.1 40,072.8
Funds from operations (FFO) 43,258.1 37,088.9 36,499.5
Net income from continuing operations 16,155.0 13,523.5 13,979.1
Cash flow from operations 41,429.5 33,159.1 31,886.8
Capital expenditures 29,393.1 39,291.1 31,546.8
Free operating cash flow 12,036.4 (6,132.0) 340.0
Discretionary cash flow 4,201.5 (10,374.2) (3,518.3)
Cash and short-term investments 12,541.9 6,041.0 6,317.0
Debt 70,137.7 72,678.3 61,750.0
Equity 127,165.0 110,951.8 102,282.5
Adjusted rat ios
EBITDA margin (%) 21.7 21.3 21.6
Return on capital (%) 11.3 10.7 22.6
EBITDA interest coverage (x) 20.3 19.9 20.4
FFO cash interest coverage (x) 20.7 18.3 21.6
Debt/EBITDA (x) 1.5 1.8 1.5
FFO/debt (%) 61.7 51.0 59.1
Cash flow from operations/debt (%) 59.1 45.6 51.6
Free operating cash flow/debt (%) 17.2 (8.4) 0.6
Discretionary cash flow/debt (%) 6.0 (14.3) (5.7)
NT$--New Taiwan dollar. Note: Data are fully adjusted.
Advanced Semiconductor Engineering -- Financia l Summary
--Fiscal year ended Dec. 31--
Credit Summaries Sept. 1, 2014
26 Disclaimer: Where an entity is assigned a public rating, a full analysis is available on our subscriber website rrs.taiwanratings.com.tw. For unrated entities, the credit summary only discusses the entity's business and financial risk profiles; it does not factor in the likelihood of government or group support.
TAIWAN RATINGS CORP. | TAIWAN'S TOP 50 CORPORATES
Analytical Contact: Jin Dong, Taipei, (886) 28722-5821; [email protected]
Company description
Founded in 1989 and headquartered in Taiwan, ASUSTeK (Asus)
mainly produces PC components, notebooks, tablets, servers and
smartphones. ASUSTeK is the fourth largest notebook vendor
and largest motherboard manufacturer in the world. Its products
are sold mainly to APAC countries (64% of its revenue in 2013),
Taiwan (13%), and the U.S (19%).
Business risk profile: Strong
Satisfactory market position in major product
categories. We believe Asus has a satisfactory market position
in its major product categories including notebook PC (No. 4
globally), motherboard (No. 1) and tablet (No.3), ranking in the
top spectrum in the world. We expect the company's market
position to remain strong supported by its products with high
cost performance as well as the company's strong design and
development capabilities. In addition, recent notebook industry
consolidation with some players exiting the market is likely to
positively contribute to Asus's market share, in our view. Its
market share of the notebook PC segment was 10%-11% in 2013.
Moderately high concentration on notebooks mitigated
by low customer concentration. We expect the company's
product concentration risk to remain relatively high with
notebooks to remain the most important business segment for
ASUS in the next one to two years. However, we expect the
company's rapid growing handheld business to take over in the
mid-term given the market trend toward mobile devices, and
Asus's growing market shares.
Continued margin pressure. While we expect consolidation
in the notebook PC industry to slightly improve the competitive
landscape, the tablet and smartphone segment remain highly
competitive. Overall, we expect heavy pricing pressure to
continue, especially for mid-to-low-end products, which account
for the majority of Asus's product library. However, the
company's strong operating efficiency underpinned by its scale
and management capabilities mitigate this margin pressure.
Moderately high industry risks. We expect Asus to continue
to face the risk of rapid shifts in technology trends and consumer
preferences, which can trigger quick market position changes
given the industry's short products cycles. Successful and
frequent new product launches are essential for companies to
stay competitive in the market.
Financial risk profile: Minimal
Low leverage level with plenty of cash on hand. We expect
Asus to maintain a minimal financial risk profile supported by a
high cash balance and strong operating cash flow. We expect the
company to continue to generate positive discretionary cash flow
after capital expenditures and cash dividends over the next two to
three years, supported by limited capital expenditure and
moderate dividend payments. The company announced a cash
dividend of NT$14.5 billion in 2014, which is about 67% of its net
income in 2013.
High volatility of cash flow coverage ratios. We expect the
volatility of Asus's cash flow/leverage ratios to be high due to
rapid technology changes, evolving customer preferences, short
product cycles, and intense competition.
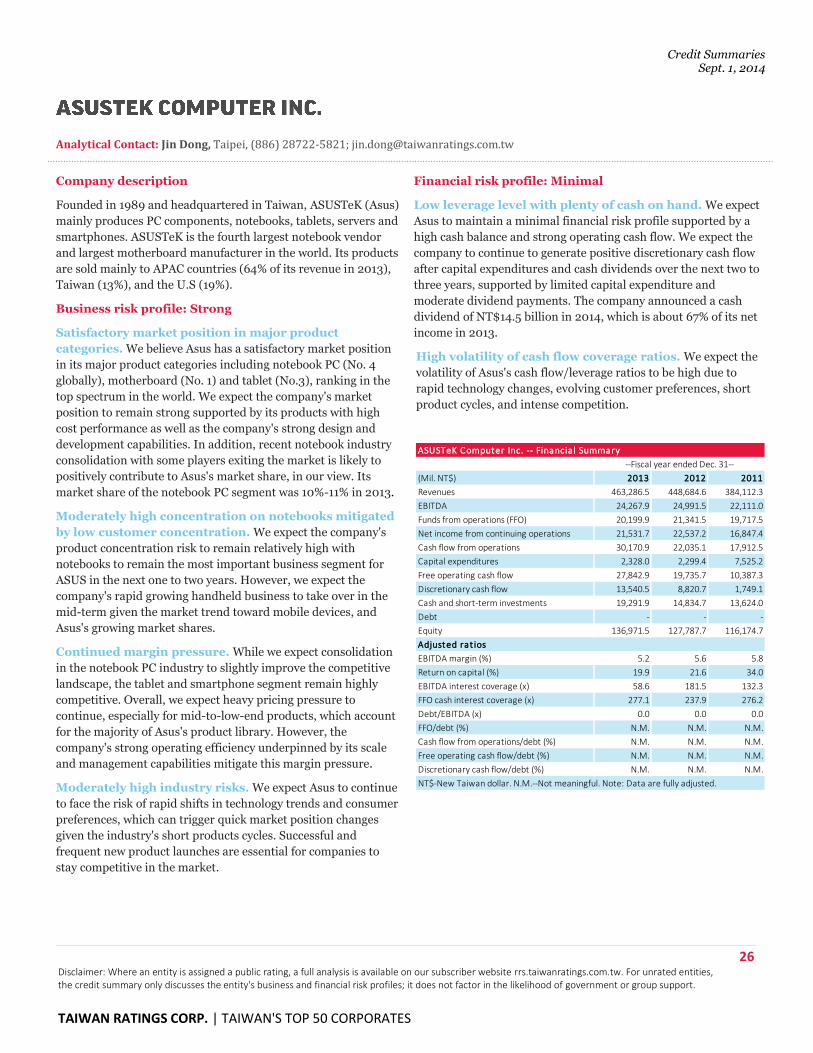
(Mil. NT$) 2013 2012 2011
Revenues 463,286.5 448,684.6 384,112.3
EBITDA 24,267.9 24,991.5 22,111.0
Funds from operations (FFO) 20,199.9 21,341.5 19,717.5
Net income from continuing operations 21,531.7 22,537.2 16,847.4
Cash flow from operations 30,170.9 22,035.1 17,912.5
Capital expenditures 2,328.0 2,299.4 7,525.2
Free operating cash flow 27,842.9 19,735.7 10,387.3
Discretionary cash flow 13,540.5 8,820.7 1,749.1
Cash and short-term investments 19,291.9 14,834.7 13,624.0
Debt - - -
Equity 136,971.5 127,787.7 116,174.7
Adjusted rat ios
EBITDA margin (%) 5.2 5.6 5.8
Return on capital (%) 19.9 21.6 34.0
EBITDA interest coverage (x) 58.6 181.5 132.3
FFO cash interest coverage (x) 277.1 237.9 276.2
Debt/EBITDA (x) 0.0 0.0 0.0
FFO/debt (%) N.M. N.M. N.M.
Cash flow from operations/debt (%) N.M. N.M. N.M.
Free operating cash flow/debt (%) N.M. N.M. N.M.
Discretionary cash flow/debt (%) N.M. N.M. N.M.
NT$-New Taiwan dollar. N.M.--Not meaningful. Note: Data are fully adjusted.
ASUSTeK Computer Inc. -- Financia l Summary
--Fiscal year ended Dec. 31--
Credit Summaries Sept. 1, 2014
27 Disclaimer: Where an entity is assigned a public rating, a full analysis is available on our subscriber website rrs.taiwanratings.com.tw. For unrated entities, the credit summary only discusses the entity's business and financial risk profiles; it does not factor in the likelihood of government or group support.
TAIWAN RATINGS CORP. | TAIWAN'S TOP 50 CORPORATES
Analytical Contact: Jin Dong, Taipei, (886) 28722-5821; [email protected]
Company description
AU Optronics Corp. (AUO) is a leading manufacturer of thin film
transistor liquid crystal display (TFT-LCD) panels. The company
has a wide and well established customer base including global
top branded TV makers and original engineering manufacturers.
Taiwan and China are two of the most important markets for
AUO, each representing 34% of revenue in 2013.
Business risk profile: Satisfactory
Fourth largest TFT-LCD manufacturer. We expect AUO to
maintain its position as the world's fourth largest LCD panel
manufacturer by market share over the next one to two years,
despite growing competition from Chinese companies. The
company had a 16.7% market share in large size TV panels in
2013 behind LG Display, Samsung Display and Innolux. We
believe that AUO's established customer base and technology
capability, particularly in small-and-medium size panels will
enable the company to maintain its competitive position over the
next one to two years.
Oversupply to intensify price competition for large-size
TV panels. We believe that the TFT-LCD market could
experience material oversupply particularly after 2015 if Chinese
suppliers add capacity according to their current schedule. We
expect panel supply to be increasingly localized for Chinese TV
makers, a move that is likely to materially affect AUO's large
panel sales, which accounted for 45% of its sales in 2013.
Nevertheless, we expect AUO to stay technologically ahead of its
Chinese peers and that the company's growing focus on small-to-
medium size panels will partly offset the oversupply risk.
Adequate operating efficiency with improving cost
structure. We believe that AUO can maintain its profitability
relative to its peers given the company's improving product mix
and cost-down efforts, despite the downward trend for panel
prices. We also expect AUO's better technology capability
relative to its Chinese peers to help the company generate higher
selling prices while lowering its material costs.
Moderately high industry risk. AUO is subject to
moderately high industry risk, in our view. The TFT LCD
industry has high demand cyclicality, high capital intensity and
intense competition and significant technology risk. The
increasing commoditization of LCD TV and PC panels is also
increasing margin pressures and price competition, particularly
from emerging Chinese panel makers. In addition, the tariffs
imposed on panel exports to China also place Taiwanese panel
makers at an inferior cost position.
Financial risk profile: Intermediate
Recovering profitability should lift cash flow coverage
ratios. We expect AUO's recovering profitability and reduced
debt level will enable the company to limit the increase in its
leverage, despite our expectation of rising capital spending,
including the construction of new LTPS fab in China. However, we
expect high demand cyclicality and intense price competition to
continue to challenge the sustainability of its cash flow generation.
Very high volatility of cash flow coverage ratios. AUO's
cash flow coverage ratios have experienced substantial volatility
due to the company's capital intensity, volatile demand and
increasing commoditization of large size panels that leads to high
price competition and frequent oversupply. We expect such
factors to continue to heavily influence the company's cash flow
coverage ratios.
(Mil. NT$) 2013 2012 2011
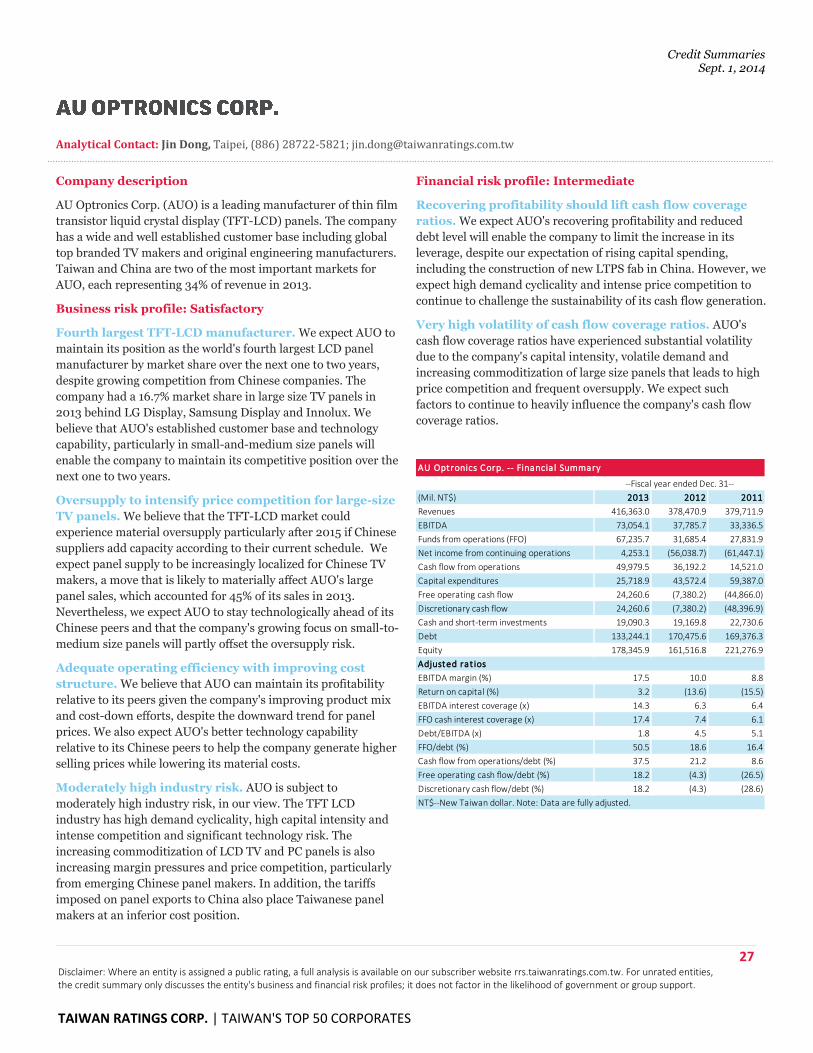
Revenues 416,363.0 378,470.9 379,711.9
EBITDA 73,054.1 37,785.7 33,336.5
Funds from operations (FFO) 67,235.7 31,685.4 27,831.9
Net income from continuing operations 4,253.1 (56,038.7) (61,447.1)
Cash flow from operations 49,979.5 36,192.2 14,521.0
Capital expenditures 25,718.9 43,572.4 59,387.0
Free operating cash flow 24,260.6 (7,380.2) (44,866.0)
Discretionary cash flow 24,260.6 (7,380.2) (48,396.9)
Cash and short-term investments 19,090.3 19,169.8 22,730.6
Debt 133,244.1 170,475.6 169,376.3
Equity 178,345.9 161,516.8 221,276.9
Adjusted rat ios
EBITDA margin (%) 17.5 10.0 8.8
Return on capital (%) 3.2 (13.6) (15.5)
EBITDA interest coverage (x) 14.3 6.3 6.4
FFO cash interest coverage (x) 17.4 7.4 6.1
Debt/EBITDA (x) 1.8 4.5 5.1
FFO/debt (%) 50.5 18.6 16.4
Cash flow from operations/debt (%) 37.5 21.2 8.6
Free operating cash flow/debt (%) 18.2 (4.3) (26.5)
Discretionary cash flow/debt (%) 18.2 (4.3) (28.6)
NT$--New Taiwan dollar. Note: Data are fully adjusted.
--Fiscal year ended Dec. 31--
AU Optronics Corp. -- Financia l Summary
Credit Summaries Sept. 1, 2014
28 Disclaimer: Where an entity is assigned a public rating, a full analysis is available on our subscriber website rrs.taiwanratings.com.tw. For unrated entities, the credit summary only discusses the entity's business and financial risk profiles; it does not factor in the likelihood of government or group support.
TAIWAN RATINGS CORP. | TAIWAN'S TOP 50 CORPORATES
Analytical Contact: Jin Dong, Taipei, (886) 28722-5821; [email protected]
Company description
Found in 1964, Chang Chun is a key member of the Chang Chun
group, the second largest petrochemical conglomerate in
Taiwan. The company has three plants in Taiwan, located in
MiaoLi, MaiLiao and DaFa, employing more than 1800
employees. Its major products include polyvinyl alcohol, glacial
acetic acid, hydrogen peroxide, copper foil and epoxidized soya
bean oil, among others. Products are supplied to chemical,
textile, coating, resin, semiconductor, pharmaceutical,
electronic, paper, and plastic industries.
Business risk profile: Strong
Strong domestic market position support by robust
technology developments. Chang Chun is a leading specialty
chemical company in Taiwan with a strong customer base. We
expect the company to maintain some degree of differentiation
and experience less competition relative to other major
commodity chemical companies, given Chang Chun's good
capability of new product and new application developments.
Diverse product mix and low costumer concentration.
Chang Chun has a diverse product mix and wide product
applications, which could partly offset the negative impact from
volatility in a single product or business sector, in our view. We
also expect the company's customer base to remain diverse with
no single customer accounting for more than 10% of its sales due
to the wide application of its products.
Moderate profit volatility. We expect a relatively high degree
of volatility for Chang Chun's profitability to persist given the
company's exposure to volatile feedstock prices. However, a
certain degree of vertical integration within the group
strengthens feedstock supply and enhances each member's cost
position.
Financial risk profile: Modest
Stable operating cash flow and lower capital spending
support an improving financial risk. We expect Chang
Chun's relatively high debt level to decline and its Debt/EBITDA
ratio to gradually improve to about 2x in the next two to three
years given the company's reduced capital expenditure needs.
Chang Chun's debt level has increased substantially over the past
two years due to intensive capacity expansion in China. In
addition, the company's stable operating cash flow could
gradually reverse its negative free operating cash flow with
reduced capital spending.
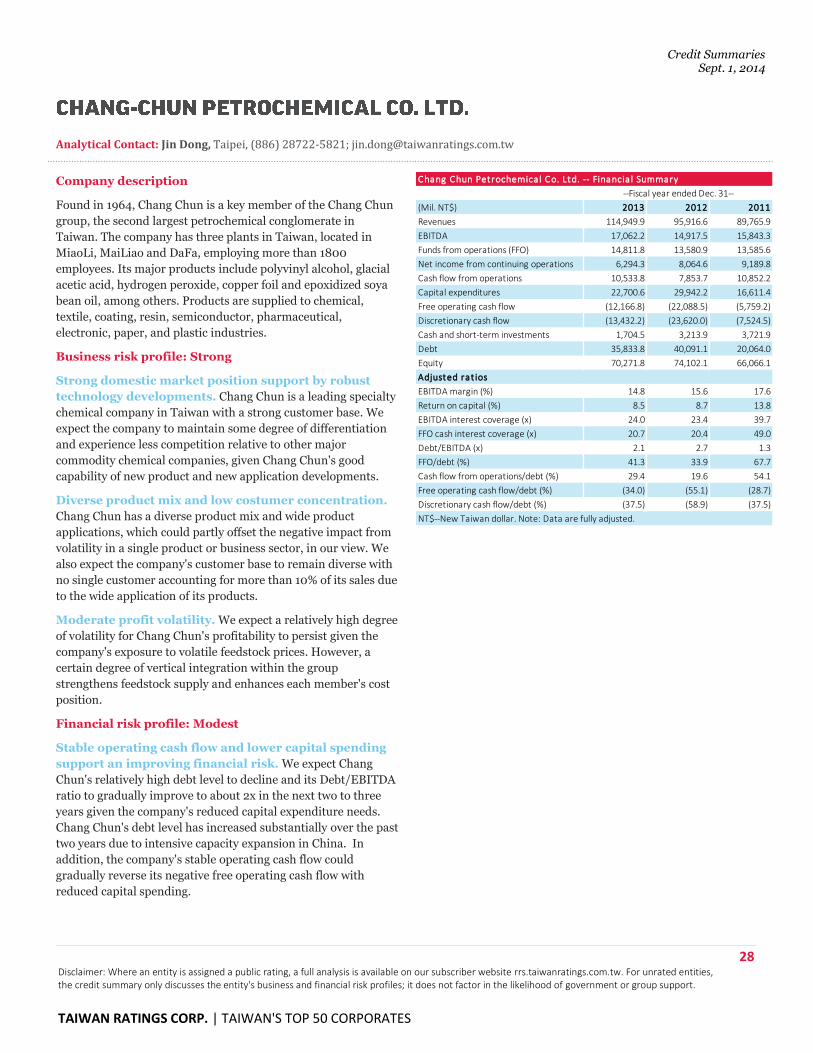
(Mil. NT$) 2013 2012 2011
Revenues 114,949.9 95,916.6 89,765.9
EBITDA 17,062.2 14,917.5 15,843.3
Funds from operations (FFO) 14,811.8 13,580.9 13,585.6
Net income from continuing operations 6,294.3 8,064.6 9,189.8
Cash flow from operations 10,533.8 7,853.7 10,852.2
Capital expenditures 22,700.6 29,942.2 16,611.4
Free operating cash flow (12,166.8) (22,088.5) (5,759.2)
Discretionary cash flow (13,432.2) (23,620.0) (7,524.5)
Cash and short-term investments 1,704.5 3,213.9 3,721.9
Debt 35,833.8 40,091.1 20,064.0
Equity 70,271.8 74,102.1 66,066.1
Adjusted rat ios
EBITDA margin (%) 14.8 15.6 17.6
Return on capital (%) 8.5 8.7 13.8
EBITDA interest coverage (x) 24.0 23.4 39.7
FFO cash interest coverage (x) 20.7 20.4 49.0
Debt/EBITDA (x) 2.1 2.7 1.3
FFO/debt (%) 41.3 33.9 67.7
Cash flow from operations/debt (%) 29.4 19.6 54.1
Free operating cash flow/debt (%) (34.0) (55.1) (28.7)
Discretionary cash flow/debt (%) (37.5) (58.9) (37.5)
NT$--New Taiwan dollar. Note: Data are fully adjusted.
Chang Chun Petrochemical Co. Ltd. -- Financia l Summary
--Fiscal year ended Dec. 31--
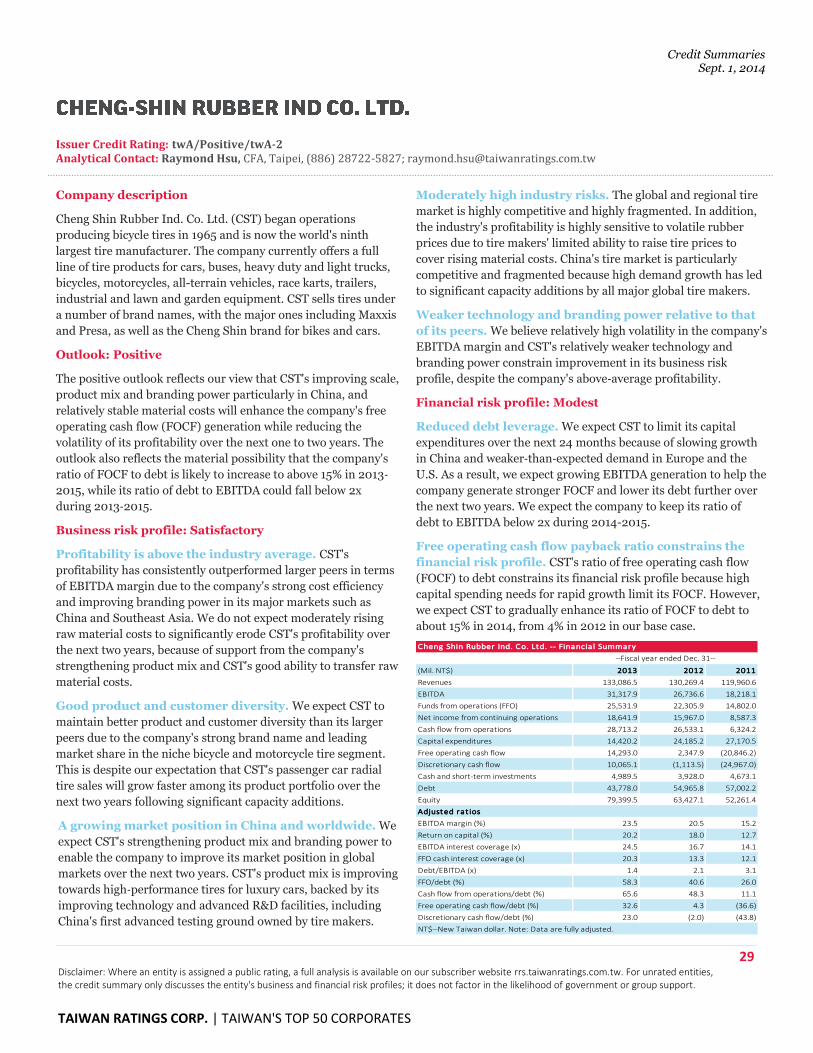
Credit Summaries Sept. 1, 2014
29 Disclaimer: Where an entity is assigned a public rating, a full analysis is available on our subscriber website rrs.taiwanratings.com.tw. For unrated entities, the credit summary only discusses the entity's business and financial risk profiles; it does not factor in the likelihood of government or group support.
TAIWAN RATINGS CORP. | TAIWAN'S TOP 50 CORPORATES
Issuer Credit Rating: twA/Positive/twA-2 Analytical Contact: Raymond Hsu, CFA, Taipei, (886) 28722-5827; [email protected]
Company description
Cheng Shin Rubber Ind. Co. Ltd. (CST) began operations
producing bicycle tires in 1965 and is now the world's ninth
largest tire manufacturer. The company currently offers a full
line of tire products for cars, buses, heavy duty and light trucks,
bicycles, motorcycles, all-terrain vehicles, race karts, trailers,
industrial and lawn and garden equipment. CST sells tires under
a number of brand names, with the major ones including Maxxis
and Presa, as well as the Cheng Shin brand for bikes and cars.
Outlook: Positive
The positive outlook reflects our view that CST's improving scale,
product mix and branding power particularly in China, and
relatively stable material costs will enhance the company's free
operating cash flow (FOCF) generation while reducing the
volatility of its profitability over the next one to two years. The
outlook also reflects the material possibility that the company's
ratio of FOCF to debt is likely to increase to above 15% in 2013‐
2015, while its ratio of debt to EBITDA could fall below 2x
during 2013‐2015.
Business risk profile: Satisfactory
Profitability is above the industry average. CST's
profitability has consistently outperformed larger peers in terms
of EBITDA margin due to the company's strong cost efficiency
and improving branding power in its major markets such as
China and Southeast Asia. We do not expect moderately rising
raw material costs to significantly erode CST's profitability over
the next two years, because of support from the company's
strengthening product mix and CST's good ability to transfer raw
material costs.
Good product and customer diversity. We expect CST to
maintain better product and customer diversity than its larger
peers due to the company's strong brand name and leading
market share in the niche bicycle and motorcycle tire segment.
This is despite our expectation that CST's passenger car radial
tire sales will grow faster among its product portfolio over the
next two years following significant capacity additions.
A growing market position in China and worldwide. We
expect CST's strengthening product mix and branding power to
enable the company to improve its market position in global
markets over the next two years. CST's product mix is improving
towards high‐performance tires for luxury cars, backed by its
improving technology and advanced R&D facilities, including
China's first advanced testing ground owned by tire makers.
Moderately high industry risks. The global and regional tire
market is highly competitive and highly fragmented. In addition,
the industry's profitability is highly sensitive to volatile rubber
prices due to tire makers' limited ability to raise tire prices to
cover rising material costs. China's tire market is particularly
competitive and fragmented because high demand growth has led
to significant capacity additions by all major global tire makers.
Weaker technology and branding power relative to that
of its peers. We believe relatively high volatility in the company's
EBITDA margin and CST's relatively weaker technology and
branding power constrain improvement in its business risk
profile, despite the company's above‐average profitability.
Financial risk profile: Modest
Reduced debt leverage. We expect CST to limit its capital
expenditures over the next 24 months because of slowing growth
in China and weaker‐than‐expected demand in Europe and the
U.S. As a result, we expect growing EBITDA generation to help the
company generate stronger FOCF and lower its debt further over
the next two years. We expect the company to keep its ratio of
debt to EBITDA below 2x during 2014-2015.
Free operating cash flow payback ratio constrains the
financial risk profile. CST's ratio of free operating cash flow
(FOCF) to debt constrains its financial risk profile because high
capital spending needs for rapid growth limit its FOCF. However,
we expect CST to gradually enhance its ratio of FOCF to debt to
about 15% in 2014, from 4% in 2012 in our base case.
(Mil. NT$) 2013 2012 2011
Revenues 133,086.5 130,269.4 119,960.6
EBITDA 31,317.9 26,736.6 18,218.1
Funds from operations (FFO) 25,531.9 22,305.9 14,802.0
Net income from continuing operations 18,641.9 15,967.0 8,587.3
Cash flow from operations 28,713.2 26,533.1 6,324.2
Capital expenditures 14,420.2 24,185.2 27,170.5
Free operating cash flow 14,293.0 2,347.9 (20,846.2)
Discretionary cash flow 10,065.1 (1,113.5) (24,967.0)
Cash and short-term investments 4,989.5 3,928.0 4,673.1
Debt 43,778.0 54,965.8 57,002.2
Equity 79,399.5 63,427.1 52,261.4
Adjusted rat ios
EBITDA margin (%) 23.5 20.5 15.2
Return on capital (%) 20.2 18.0 12.7
EBITDA interest coverage (x) 24.5 16.7 14.1
FFO cash interest coverage (x) 20.3 13.3 12.1
Debt/EBITDA (x) 1.4 2.1 3.1
FFO/debt (%) 58.3 40.6 26.0
Cash flow from operations/debt (%) 65.6 48.3 11.1
Free operating cash flow/debt (%) 32.6 4.3 (36.6)
Discretionary cash flow/debt (%) 23.0 (2.0) (43.8)
NT$--New Taiwan dollar. Note: Data are fully adjusted.
Cheng Shin Rubber Ind. Co. Ltd. -- Financia l Summary
--Fiscal year ended Dec. 31--
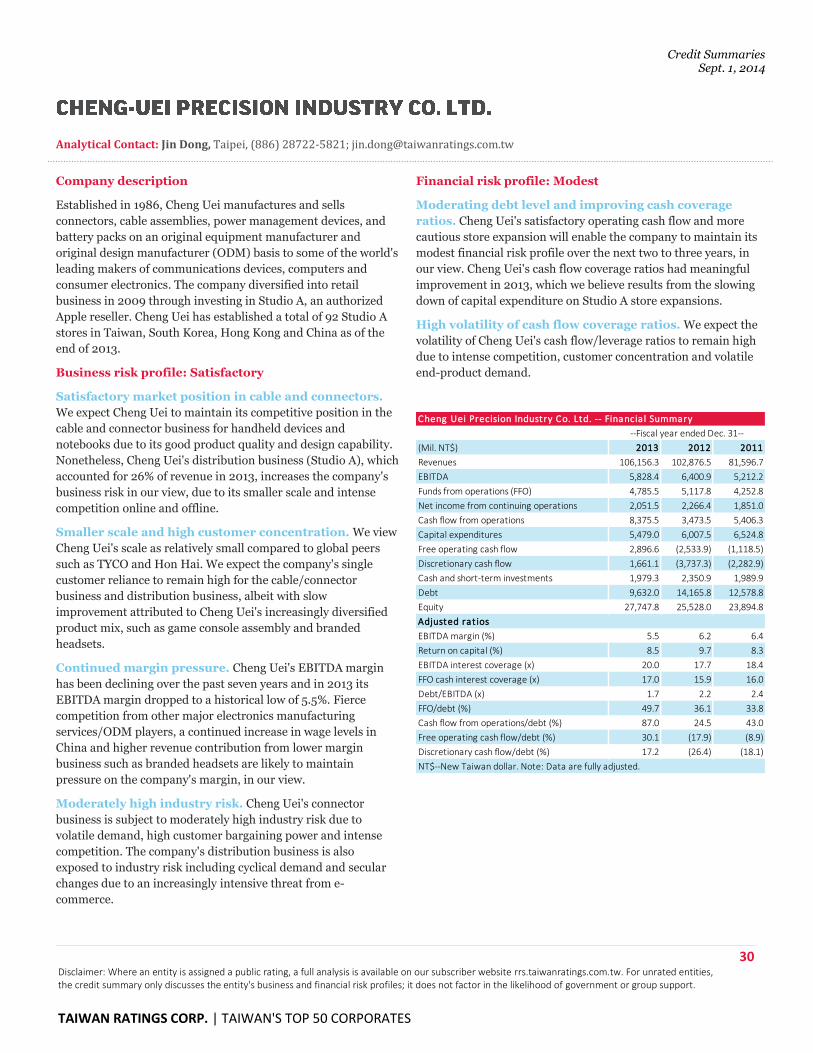
Credit Summaries Sept. 1, 2014
30 Disclaimer: Where an entity is assigned a public rating, a full analysis is available on our subscriber website rrs.taiwanratings.com.tw. For unrated entities, the credit summary only discusses the entity's business and financial risk profiles; it does not factor in the likelihood of government or group support.
TAIWAN RATINGS CORP. | TAIWAN'S TOP 50 CORPORATES
Analytical Contact: Jin Dong, Taipei, (886) 28722-5821; [email protected]
Company description
Established in 1986, Cheng Uei manufactures and sells
connectors, cable assemblies, power management devices, and
battery packs on an original equipment manufacturer and
original design manufacturer (ODM) basis to some of the world's
leading makers of communications devices, computers and
consumer electronics. The company diversified into retail
business in 2009 through investing in Studio A, an authorized
Apple reseller. Cheng Uei has established a total of 92 Studio A
stores in Taiwan, South Korea, Hong Kong and China as of the
end of 2013.
Business risk profile: Satisfactory
Satisfactory market position in cable and connectors.
We expect Cheng Uei to maintain its competitive position in the
cable and connector business for handheld devices and
notebooks due to its good product quality and design capability.
Nonetheless, Cheng Uei's distribution business (Studio A), which
accounted for 26% of revenue in 2013, increases the company's
business risk in our view, due to its smaller scale and intense
competition online and offline.
Smaller scale and high customer concentration. We view
Cheng Uei's scale as relatively small compared to global peers
such as TYCO and Hon Hai. We expect the company's single
customer reliance to remain high for the cable/connector
business and distribution business, albeit with slow
improvement attributed to Cheng Uei's increasingly diversified
product mix, such as game console assembly and branded
headsets.
Continued margin pressure. Cheng Uei's EBITDA margin
has been declining over the past seven years and in 2013 its
EBITDA margin dropped to a historical low of 5.5%. Fierce
competition from other major electronics manufacturing
services/ODM players, a continued increase in wage levels in
China and higher revenue contribution from lower margin
business such as branded headsets are likely to maintain
pressure on the company's margin, in our view.
Moderately high industry risk. Cheng Uei's connector
business is subject to moderately high industry risk due to
volatile demand, high customer bargaining power and intense
competition. The company's distribution business is also
exposed to industry risk including cyclical demand and secular
changes due to an increasingly intensive threat from e-
commerce.
Financial risk profile: Modest
Moderating debt level and improving cash coverage
ratios. Cheng Uei's satisfactory operating cash flow and more
cautious store expansion will enable the company to maintain its
modest financial risk profile over the next two to three years, in
our view. Cheng Uei's cash flow coverage ratios had meaningful
improvement in 2013, which we believe results from the slowing
down of capital expenditure on Studio A store expansions.
High volatility of cash flow coverage ratios. We expect the
volatility of Cheng Uei's cash flow/leverage ratios to remain high
due to intense competition, customer concentration and volatile
end-product demand.
(Mil. NT$) 2013 2012 2011
Revenues 106,156.3 102,876.5 81,596.7
EBITDA 5,828.4 6,400.9 5,212.2
Funds from operations (FFO) 4,785.5 5,117.8 4,252.8
Net income from continuing operations 2,051.5 2,266.4 1,851.0
Cash flow from operations 8,375.5 3,473.5 5,406.3
Capital expenditures 5,479.0 6,007.5 6,524.8
Free operating cash flow 2,896.6 (2,533.9) (1,118.5)
Discretionary cash flow 1,661.1 (3,737.3) (2,282.9)
Cash and short-term investments 1,979.3 2,350.9 1,989.9
Debt 9,632.0 14,165.8 12,578.8
Equity 27,747.8 25,528.0 23,894.8
Adjusted rat ios
EBITDA margin (%) 5.5 6.2 6.4
Return on capital (%) 8.5 9.7 8.3
EBITDA interest coverage (x) 20.0 17.7 18.4
FFO cash interest coverage (x) 17.0 15.9 16.0
Debt/EBITDA (x) 1.7 2.2 2.4
FFO/debt (%) 49.7 36.1 33.8
Cash flow from operations/debt (%) 87.0 24.5 43.0
Free operating cash flow/debt (%) 30.1 (17.9) (8.9)
Discretionary cash flow/debt (%) 17.2 (26.4) (18.1)
NT$--New Taiwan dollar. Note: Data are fully adjusted.
Cheng Uei Precision Industry Co. Ltd. -- Financia l Summary
--Fiscal year ended Dec. 31--
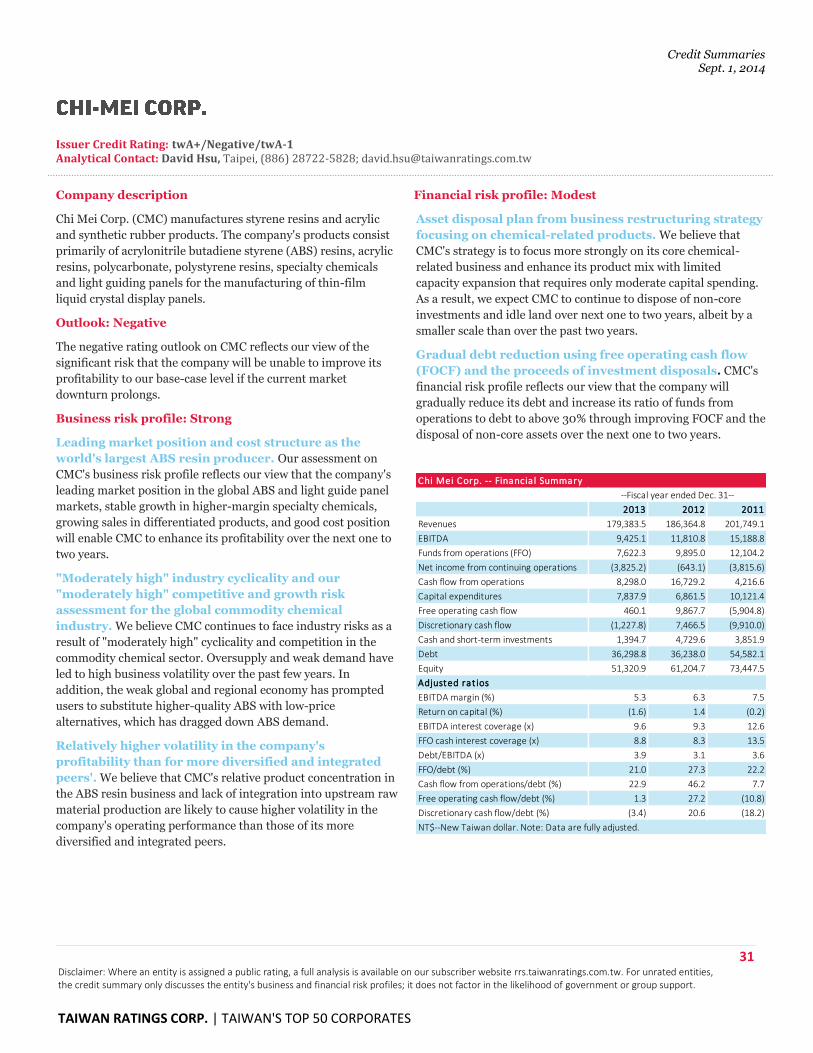
Credit Summaries Sept. 1, 2014
31 Disclaimer: Where an entity is assigned a public rating, a full analysis is available on our subscriber website rrs.taiwanratings.com.tw. For unrated entities, the credit summary only discusses the entity's business and financial risk profiles; it does not factor in the likelihood of government or group support.
TAIWAN RATINGS CORP. | TAIWAN'S TOP 50 CORPORATES
Issuer Credit Rating: twA+/Negative/twA-1 Analytical Contact: David Hsu, Taipei, (886) 28722-5828; [email protected]
Company description
Chi Mei Corp. (CMC) manufactures styrene resins and acrylic
and synthetic rubber products. The company's products consist
primarily of acrylonitrile butadiene styrene (ABS) resins, acrylic
resins, polycarbonate, polystyrene resins, specialty chemicals
and light guiding panels for the manufacturing of thin-film
liquid crystal display panels.
Outlook: Negative
The negative rating outlook on CMC reflects our view of the
significant risk that the company will be unable to improve its
profitability to our base-case level if the current market
downturn prolongs.
Business risk profile: Strong
Leading market position and cost structure as the
world's largest ABS resin producer. Our assessment on
CMC's business risk profile reflects our view that the company's
leading market position in the global ABS and light guide panel
markets, stable growth in higher-margin specialty chemicals,
growing sales in differentiated products, and good cost position
will enable CMC to enhance its profitability over the next one to
two years.
"Moderately high" industry cyclicality and our
"moderately high" competitive and growth risk
assessment for the global commodity chemical
industry. We believe CMC continues to face industry risks as a
result of "moderately high" cyclicality and competition in the
commodity chemical sector. Oversupply and weak demand have
led to high business volatility over the past few years. In
addition, the weak global and regional economy has prompted
users to substitute higher-quality ABS with low-price
alternatives, which has dragged down ABS demand.
Relatively higher volatility in the company's
profitability than for more diversified and integrated
peers'. We believe that CMC's relative product concentration in
the ABS resin business and lack of integration into upstream raw
material production are likely to cause higher volatility in the
company's operating performance than those of its more
diversified and integrated peers.
Financial risk profile: Modest
Asset disposal plan from business restructuring strategy
focusing on chemical-related products. We believe that
CMC's strategy is to focus more strongly on its core chemical-
related business and enhance its product mix with limited
capacity expansion that requires only moderate capital spending.
As a result, we expect CMC to continue to dispose of non-core
investments and idle land over next one to two years, albeit by a
smaller scale than over the past two years.
Gradual debt reduction using free operating cash flow
(FOCF) and the proceeds of investment disposals. CMC's
financial risk profile reflects our view that the company will
gradually reduce its debt and increase its ratio of funds from
operations to debt to above 30% through improving FOCF and the
disposal of non-core assets over the next one to two years.
2013 2012 2011
Revenues 179,383.5 186,364.8 201,749.1
EBITDA 9,425.1 11,810.8 15,188.8
Funds from operations (FFO) 7,622.3 9,895.0 12,104.2
Net income from continuing operations (3,825.2) (643.1) (3,815.6)
Cash flow from operations 8,298.0 16,729.2 4,216.6
Capital expenditures 7,837.9 6,861.5 10,121.4
Free operating cash flow 460.1 9,867.7 (5,904.8)
Discretionary cash flow (1,227.8) 7,466.5 (9,910.0)
Cash and short-term investments 1,394.7 4,729.6 3,851.9
Debt 36,298.8 36,238.0 54,582.1
Equity 51,320.9 61,204.7 73,447.5
Adjusted rat ios
EBITDA margin (%) 5.3 6.3 7.5
Return on capital (%) (1.6) 1.4 (0.2)
EBITDA interest coverage (x) 9.6 9.3 12.6
FFO cash interest coverage (x) 8.8 8.3 13.5
Debt/EBITDA (x) 3.9 3.1 3.6
FFO/debt (%) 21.0 27.3 22.2
Cash flow from operations/debt (%) 22.9 46.2 7.7
Free operating cash flow/debt (%) 1.3 27.2 (10.8)
Discretionary cash flow/debt (%) (3.4) 20.6 (18.2)
NT$--New Taiwan dollar. Note: Data are fully adjusted.
Chi Mei Corp. -- Financia l Summary
--Fiscal year ended Dec. 31--
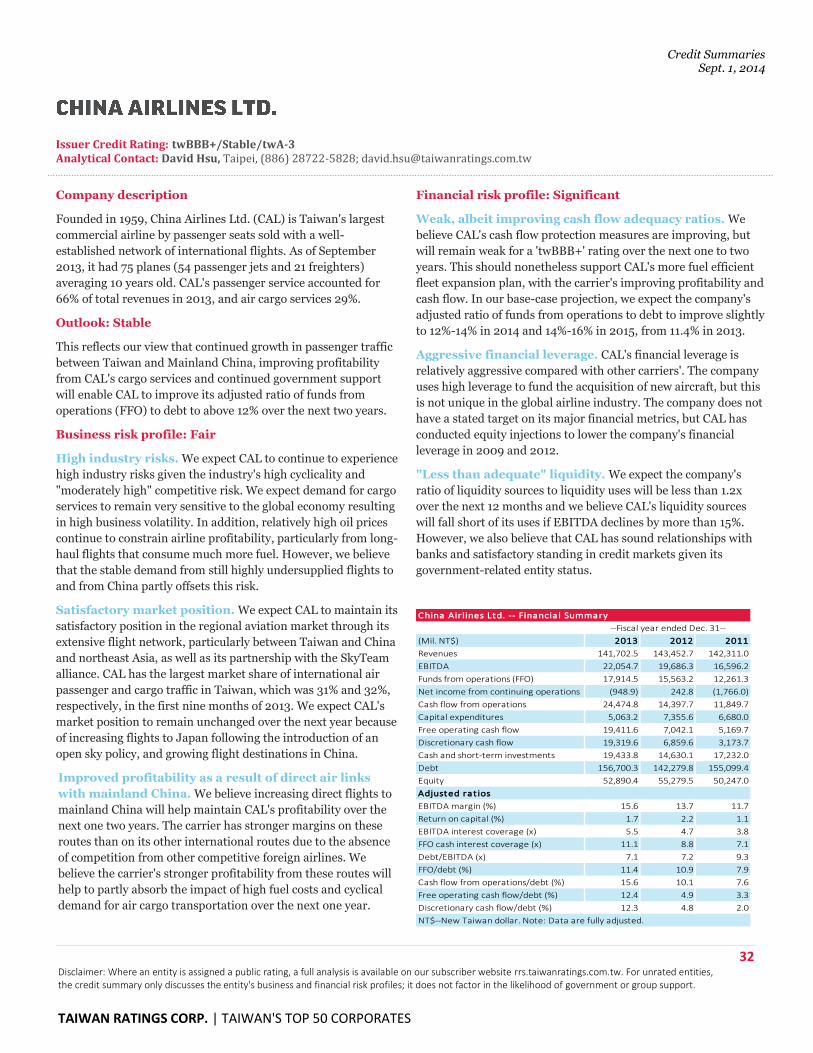
Credit Summaries Sept. 1, 2014
32 Disclaimer: Where an entity is assigned a public rating, a full analysis is available on our subscriber website rrs.taiwanratings.com.tw. For unrated entities, the credit summary only discusses the entity's business and financial risk profiles; it does not factor in the likelihood of government or group support.
TAIWAN RATINGS CORP. | TAIWAN'S TOP 50 CORPORATES
Issuer Credit Rating: twBBB+/Stable/twA-3 Analytical Contact: David Hsu, Taipei, (886) 28722-5828; [email protected]
Company description
Founded in 1959, China Airlines Ltd. (CAL) is Taiwan's largest
commercial airline by passenger seats sold with a well-
established network of international flights. As of September
2013, it had 75 planes (54 passenger jets and 21 freighters)
averaging 10 years old. CAL's passenger service accounted for
66% of total revenues in 2013, and air cargo services 29%.
Outlook: Stable
This reflects our view that continued growth in passenger traffic
between Taiwan and Mainland China, improving profitability
from CAL's cargo services and continued government support
will enable CAL to improve its adjusted ratio of funds from
operations (FFO) to debt to above 12% over the next two years.
Business risk profile: Fair
High industry risks. We expect CAL to continue to experience
high industry risks given the industry's high cyclicality and
"moderately high" competitive risk. We expect demand for cargo
services to remain very sensitive to the global economy resulting
in high business volatility. In addition, relatively high oil prices
continue to constrain airline profitability, particularly from long-
haul flights that consume much more fuel. However, we believe
that the stable demand from still highly undersupplied flights to
and from China partly offsets this risk.
Satisfactory market position. We expect CAL to maintain its
satisfactory position in the regional aviation market through its
extensive flight network, particularly between Taiwan and China
and northeast Asia, as well as its partnership with the SkyTeam
alliance. CAL has the largest market share of international air
passenger and cargo traffic in Taiwan, which was 31% and 32%,
respectively, in the first nine months of 2013. We expect CAL's
market position to remain unchanged over the next year because
of increasing flights to Japan following the introduction of an
open sky policy, and growing flight destinations in China.
Improved profitability as a result of direct air links
with mainland China. We believe increasing direct flights to
mainland China will help maintain CAL's profitability over the
next one two years. The carrier has stronger margins on these
routes than on its other international routes due to the absence
of competition from other competitive foreign airlines. We
believe the carrier's stronger profitability from these routes will
help to partly absorb the impact of high fuel costs and cyclical
demand for air cargo transportation over the next one year.
Financial risk profile: Significant
Weak, albeit improving cash flow adequacy ratios. We
believe CAL's cash flow protection measures are improving, but
will remain weak for a 'twBBB+' rating over the next one to two
years. This should nonetheless support CAL's more fuel efficient
fleet expansion plan, with the carrier's improving profitability and
cash flow. In our base-case projection, we expect the company's
adjusted ratio of funds from operations to debt to improve slightly
to 12%-14% in 2014 and 14%-16% in 2015, from 11.4% in 2013.
Aggressive financial leverage. CAL's financial leverage is
relatively aggressive compared with other carriers'. The company
uses high leverage to fund the acquisition of new aircraft, but this
is not unique in the global airline industry. The company does not
have a stated target on its major financial metrics, but CAL has
conducted equity injections to lower the company's financial
leverage in 2009 and 2012.
"Less than adequate" liquidity. We expect the company's
ratio of liquidity sources to liquidity uses will be less than 1.2x
over the next 12 months and we believe CAL's liquidity sources
will fall short of its uses if EBITDA declines by more than 15%.
However, we also believe that CAL has sound relationships with
banks and satisfactory standing in credit markets given its
government-related entity status.
(Mil. NT$) 2013 2012 2011
Revenues 141,702.5 143,452.7 142,311.0
EBITDA 22,054.7 19,686.3 16,596.2
Funds from operations (FFO) 17,914.5 15,563.2 12,261.3
Net income from continuing operations (948.9) 242.8 (1,766.0)
Cash flow from operations 24,474.8 14,397.7 11,849.7
Capital expenditures 5,063.2 7,355.6 6,680.0
Free operating cash flow 19,411.6 7,042.1 5,169.7
Discretionary cash flow 19,319.6 6,859.6 3,173.7
Cash and short-term investments 19,433.8 14,630.1 17,232.0
Debt 156,700.3 142,279.8 155,099.4
Equity 52,890.4 55,279.5 50,247.0
Adjusted rat ios
EBITDA margin (%) 15.6 13.7 11.7
Return on capital (%) 1.7 2.2 1.1
EBITDA interest coverage (x) 5.5 4.7 3.8
FFO cash interest coverage (x) 11.1 8.8 7.1
Debt/EBITDA (x) 7.1 7.2 9.3
FFO/debt (%) 11.4 10.9 7.9
Cash flow from operations/debt (%) 15.6 10.1 7.6
Free operating cash flow/debt (%) 12.4 4.9 3.3
Discretionary cash flow/debt (%) 12.3 4.8 2.0
NT$--New Taiwan dollar. Note: Data are fully adjusted.
China Airlines Ltd. -- Financia l Summary
--Fiscal year ended Dec. 31--
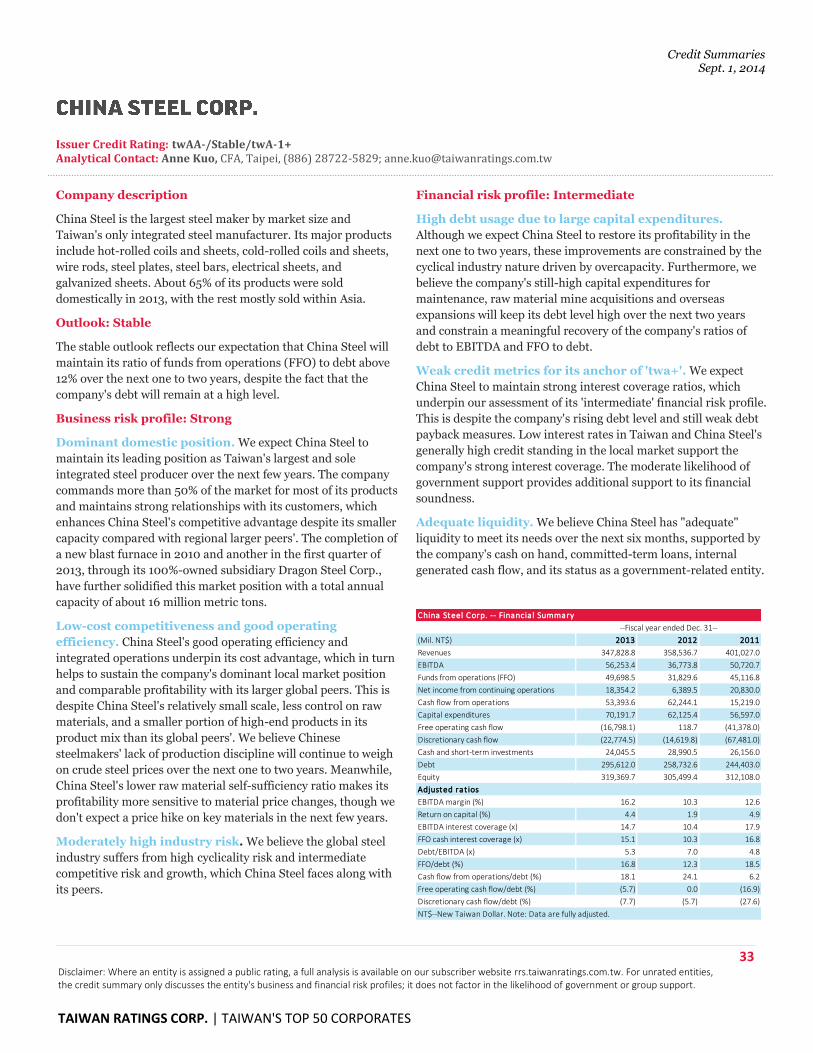
Credit Summaries Sept. 1, 2014
33 Disclaimer: Where an entity is assigned a public rating, a full analysis is available on our subscriber website rrs.taiwanratings.com.tw. For unrated entities, the credit summary only discusses the entity's business and financial risk profiles; it does not factor in the likelihood of government or group support.
TAIWAN RATINGS CORP. | TAIWAN'S TOP 50 CORPORATES
Issuer Credit Rating: twAA-/Stable/twA-1+ Analytical Contact: Anne Kuo, CFA, Taipei, (886) 28722-5829; [email protected]
Company description
China Steel is the largest steel maker by market size and
Taiwan's only integrated steel manufacturer. Its major products
include hot-rolled coils and sheets, cold-rolled coils and sheets,
wire rods, steel plates, steel bars, electrical sheets, and
galvanized sheets. About 65% of its products were sold
domestically in 2013, with the rest mostly sold within Asia.
Outlook: Stable
The stable outlook reflects our expectation that China Steel will
maintain its ratio of funds from operations (FFO) to debt above
12% over the next one to two years, despite the fact that the
company's debt will remain at a high level.
Business risk profile: Strong
Dominant domestic position. We expect China Steel to
maintain its leading position as Taiwan's largest and sole
integrated steel producer over the next few years. The company
commands more than 50% of the market for most of its products
and maintains strong relationships with its customers, which
enhances China Steel's competitive advantage despite its smaller
capacity compared with regional larger peers'. The completion of
a new blast furnace in 2010 and another in the first quarter of
2013, through its 100%-owned subsidiary Dragon Steel Corp.,
have further solidified this market position with a total annual
capacity of about 16 million metric tons.
Low-cost competitiveness and good operating
efficiency. China Steel's good operating efficiency and
integrated operations underpin its cost advantage, which in turn
helps to sustain the company's dominant local market position
and comparable profitability with its larger global peers. This is
despite China Steel's relatively small scale, less control on raw
materials, and a smaller portion of high-end products in its
product mix than its global peers'. We believe Chinese
steelmakers' lack of production discipline will continue to weigh
on crude steel prices over the next one to two years. Meanwhile,
China Steel's lower raw material self-sufficiency ratio makes its
profitability more sensitive to material price changes, though we
don't expect a price hike on key materials in the next few years.
Moderately high industry risk. We believe the global steel
industry suffers from high cyclicality risk and intermediate
competitive risk and growth, which China Steel faces along with
its peers.
Financial risk profile: Intermediate
High debt usage due to large capital expenditures.
Although we expect China Steel to restore its profitability in the
next one to two years, these improvements are constrained by the
cyclical industry nature driven by overcapacity. Furthermore, we
believe the company's still-high capital expenditures for
maintenance, raw material mine acquisitions and overseas
expansions will keep its debt level high over the next two years
and constrain a meaningful recovery of the company's ratios of
debt to EBITDA and FFO to debt.
Weak credit metrics for its anchor of 'twa+'. We expect
China Steel to maintain strong interest coverage ratios, which
underpin our assessment of its 'intermediate' financial risk profile.
This is despite the company's rising debt level and still weak debt
payback measures. Low interest rates in Taiwan and China Steel's
generally high credit standing in the local market support the
company's strong interest coverage. The moderate likelihood of
government support provides additional support to its financial
soundness.
Adequate liquidity. We believe China Steel has "adequate"
liquidity to meet its needs over the next six months, supported by
the company's cash on hand, committed-term loans, internal
generated cash flow, and its status as a government-related entity.
(Mil. NT$) 2013 2012 2011
Revenues 347,828.8 358,536.7 401,027.0
EBITDA 56,253.4 36,773.8 50,720.7
Funds from operations (FFO) 49,698.5 31,829.6 45,116.8
Net income from continuing operations 18,354.2 6,389.5 20,830.0
Cash flow from operations 53,393.6 62,244.1 15,219.0
Capital expenditures 70,191.7 62,125.4 56,597.0
Free operating cash flow (16,798.1) 118.7 (41,378.0)
Discretionary cash flow (22,774.5) (14,619.8) (67,481.0)
Cash and short-term investments 24,045.5 28,990.5 26,156.0
Debt 295,612.0 258,732.6 244,403.0
Equity 319,369.7 305,499.4 312,108.0
Adjusted rat ios
EBITDA margin (%) 16.2 10.3 12.6
Return on capital (%) 4.4 1.9 4.9
EBITDA interest coverage (x) 14.7 10.4 17.9
FFO cash interest coverage (x) 15.1 10.3 16.8
Debt/EBITDA (x) 5.3 7.0 4.8
FFO/debt (%) 16.8 12.3 18.5
Cash flow from operations/debt (%) 18.1 24.1 6.2
Free operating cash flow/debt (%) (5.7) 0.0 (16.9)
Discretionary cash flow/debt (%) (7.7) (5.7) (27.6)
NT$--New Taiwan Dollar. Note: Data are fully adjusted.
--Fiscal year ended Dec. 31--
China Steel Corp. -- Financia l Summary
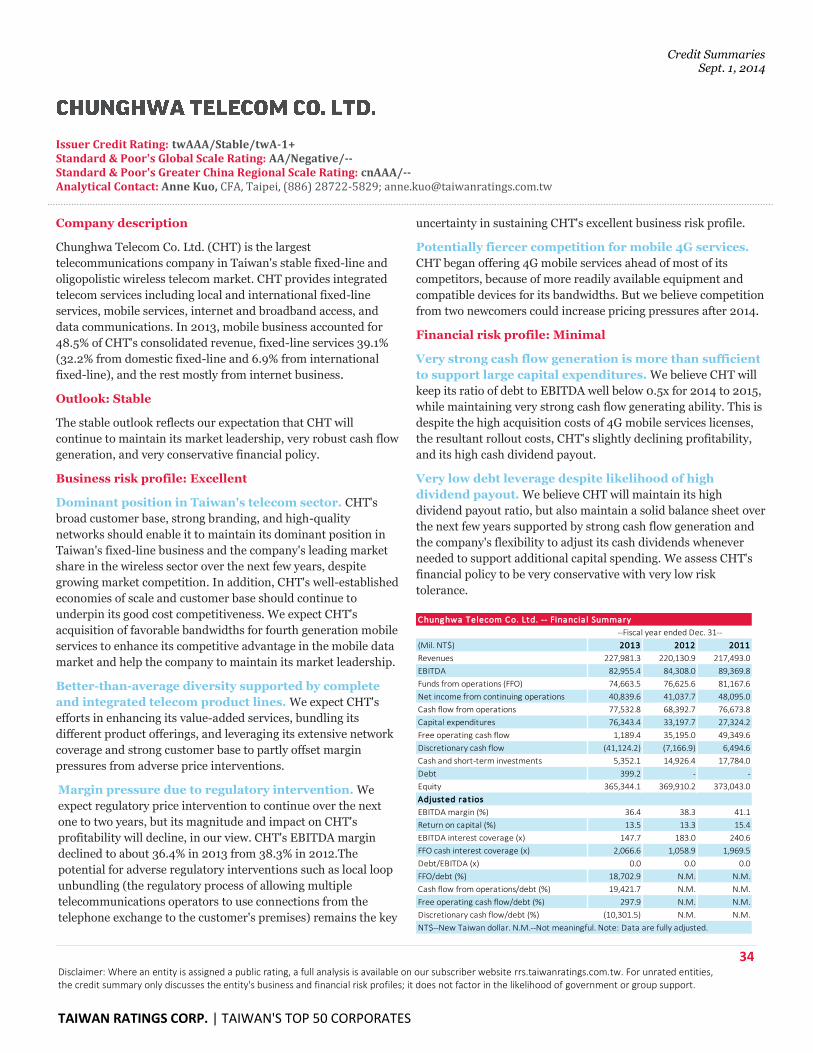
Credit Summaries Sept. 1, 2014
34 Disclaimer: Where an entity is assigned a public rating, a full analysis is available on our subscriber website rrs.taiwanratings.com.tw. For unrated entities, the credit summary only discusses the entity's business and financial risk profiles; it does not factor in the likelihood of government or group support.
TAIWAN RATINGS CORP. | TAIWAN'S TOP 50 CORPORATES
Issuer Credit Rating: twAAA/Stable/twA-1+ Standard & Poor's Global Scale Rating: AA/Negative/-- Standard & Poor's Greater China Regional Scale Rating: cnAAA/-- Analytical Contact: Anne Kuo, CFA, Taipei, (886) 28722-5829; [email protected]
Company description
Chunghwa Telecom Co. Ltd. (CHT) is the largest
telecommunications company in Taiwan's stable fixed-line and
oligopolistic wireless telecom market. CHT provides integrated
telecom services including local and international fixed-line
services, mobile services, internet and broadband access, and
data communications. In 2013, mobile business accounted for
48.5% of CHT's consolidated revenue, fixed-line services 39.1%
(32.2% from domestic fixed-line and 6.9% from international
fixed-line), and the rest mostly from internet business.
Outlook: Stable
The stable outlook reflects our expectation that CHT will
continue to maintain its market leadership, very robust cash flow
generation, and very conservative financial policy.
Business risk profile: Excellent
Dominant position in Taiwan's telecom sector. CHT's
broad customer base, strong branding, and high-quality
networks should enable it to maintain its dominant position in
Taiwan's fixed-line business and the company's leading market
share in the wireless sector over the next few years, despite
growing market competition. In addition, CHT's well-established
economies of scale and customer base should continue to
underpin its good cost competitiveness. We expect CHT's
acquisition of favorable bandwidths for fourth generation mobile
services to enhance its competitive advantage in the mobile data
market and help the company to maintain its market leadership.
Better-than-average diversity supported by complete
and integrated telecom product lines. We expect CHT's
efforts in enhancing its value-added services, bundling its
different product offerings, and leveraging its extensive network
coverage and strong customer base to partly offset margin
pressures from adverse price interventions.
Margin pressure due to regulatory intervention. We
expect regulatory price intervention to continue over the next
one to two years, but its magnitude and impact on CHT's
profitability will decline, in our view. CHT's EBITDA margin
declined to about 36.4% in 2013 from 38.3% in 2012.The
potential for adverse regulatory interventions such as local loop
unbundling (the regulatory process of allowing multiple
telecommunications operators to use connections from the
telephone exchange to the customer's premises) remains the key
uncertainty in sustaining CHT's excellent business risk profile.
Potentially fiercer competition for mobile 4G services.
CHT began offering 4G mobile services ahead of most of its
competitors, because of more readily available equipment and
compatible devices for its bandwidths. But we believe competition
from two newcomers could increase pricing pressures after 2014.
Financial risk profile: Minimal
Very strong cash flow generation is more than sufficient
to support large capital expenditures. We believe CHT will
keep its ratio of debt to EBITDA well below 0.5x for 2014 to 2015,
while maintaining very strong cash flow generating ability. This is
despite the high acquisition costs of 4G mobile services licenses,
the resultant rollout costs, CHT's slightly declining profitability,
and its high cash dividend payout.
Very low debt leverage despite likelihood of high
dividend payout. We believe CHT will maintain its high
dividend payout ratio, but also maintain a solid balance sheet over
the next few years supported by strong cash flow generation and
the company's flexibility to adjust its cash dividends whenever
needed to support additional capital spending. We assess CHT's
financial policy to be very conservative with very low risk
tolerance.
(Mil. NT$) 2013 2012 2011
Revenues 227,981.3 220,130.9 217,493.0
EBITDA 82,955.4 84,308.0 89,369.8
Funds from operations (FFO) 74,663.5 76,625.6 81,167.6
Net income from continuing operations 40,839.6 41,037.7 48,095.0
Cash flow from operations 77,532.8 68,392.7 76,673.8
Capital expenditures 76,343.4 33,197.7 27,324.2
Free operating cash flow 1,189.4 35,195.0 49,349.6
Discretionary cash flow (41,124.2) (7,166.9) 6,494.6
Cash and short-term investments 5,352.1 14,926.4 17,784.0
Debt 399.2 - -
Equity 365,344.1 369,910.2 373,043.0
Adjusted rat ios
EBITDA margin (%) 36.4 38.3 41.1
Return on capital (%) 13.5 13.3 15.4
EBITDA interest coverage (x) 147.7 183.0 240.6
FFO cash interest coverage (x) 2,066.6 1,058.9 1,969.5
Debt/EBITDA (x) 0.0 0.0 0.0
FFO/debt (%) 18,702.9 N.M. N.M.
Cash flow from operations/debt (%) 19,421.7 N.M. N.M.
Free operating cash flow/debt (%) 297.9 N.M. N.M.
Discretionary cash flow/debt (%) (10,301.5) N.M. N.M.
NT$--New Taiwan dollar. N.M.--Not meaningful. Note: Data are fully adjusted.
--Fiscal year ended Dec. 31--
Chunghwa Telecom Co. Ltd. -- Financia l Summary
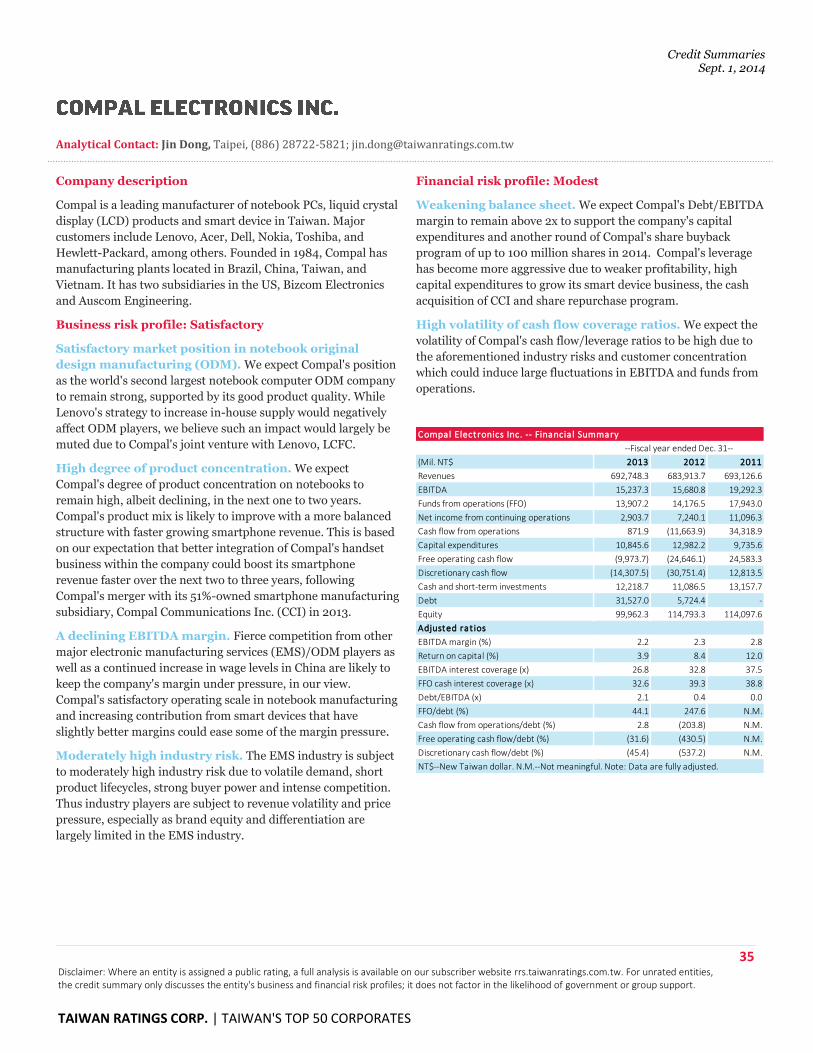
Credit Summaries Sept. 1, 2014
35 Disclaimer: Where an entity is assigned a public rating, a full analysis is available on our subscriber website rrs.taiwanratings.com.tw. For unrated entities, the credit summary only discusses the entity's business and financial risk profiles; it does not factor in the likelihood of government or group support.
TAIWAN RATINGS CORP. | TAIWAN'S TOP 50 CORPORATES
Analytical Contact: Jin Dong, Taipei, (886) 28722-5821; [email protected]
Company description
Compal is a leading manufacturer of notebook PCs, liquid crystal
display (LCD) products and smart device in Taiwan. Major
customers include Lenovo, Acer, Dell, Nokia, Toshiba, and
Hewlett-Packard, among others. Founded in 1984, Compal has
manufacturing plants located in Brazil, China, Taiwan, and
Vietnam. It has two subsidiaries in the US, Bizcom Electronics
and Auscom Engineering.
Business risk profile: Satisfactory
Satisfactory market position in notebook original
design manufacturing (ODM). We expect Compal's position
as the world's second largest notebook computer ODM company
to remain strong, supported by its good product quality. While
Lenovo's strategy to increase in-house supply would negatively
affect ODM players, we believe such an impact would largely be
muted due to Compal's joint venture with Lenovo, LCFC.
High degree of product concentration. We expect
Compal's degree of product concentration on notebooks to
remain high, albeit declining, in the next one to two years.
Compal's product mix is likely to improve with a more balanced
structure with faster growing smartphone revenue. This is based
on our expectation that better integration of Compal's handset
business within the company could boost its smartphone
revenue faster over the next two to three years, following
Compal's merger with its 51%-owned smartphone manufacturing
subsidiary, Compal Communications Inc. (CCI) in 2013.
A declining EBITDA margin. Fierce competition from other
major electronic manufacturing services (EMS)/ODM players as
well as a continued increase in wage levels in China are likely to
keep the company's margin under pressure, in our view.
Compal's satisfactory operating scale in notebook manufacturing
and increasing contribution from smart devices that have
slightly better margins could ease some of the margin pressure.
Moderately high industry risk. The EMS industry is subject
to moderately high industry risk due to volatile demand, short
product lifecycles, strong buyer power and intense competition.
Thus industry players are subject to revenue volatility and price
pressure, especially as brand equity and differentiation are
largely limited in the EMS industry.
Financial risk profile: Modest
Weakening balance sheet. We expect Compal's Debt/EBITDA
margin to remain above 2x to support the company's capital
expenditures and another round of Compal's share buyback
program of up to 100 million shares in 2014. Compal's leverage
has become more aggressive due to weaker profitability, high
capital expenditures to grow its smart device business, the cash
acquisition of CCI and share repurchase program.
High volatility of cash flow coverage ratios. We expect the
volatility of Compal's cash flow/leverage ratios to be high due to
the aforementioned industry risks and customer concentration
which could induce large fluctuations in EBITDA and funds from
operations.
(Mil. NT$ 2013 2012 2011
Revenues 692,748.3 683,913.7 693,126.6
EBITDA 15,237.3 15,680.8 19,292.3
Funds from operations (FFO) 13,907.2 14,176.5 17,943.0
Net income from continuing operations 2,903.7 7,240.1 11,096.3
Cash flow from operations 871.9 (11,663.9) 34,318.9
Capital expenditures 10,845.6 12,982.2 9,735.6
Free operating cash flow (9,973.7) (24,646.1) 24,583.3
Discretionary cash flow (14,307.5) (30,751.4) 12,813.5
Cash and short-term investments 12,218.7 11,086.5 13,157.7
Debt 31,527.0 5,724.4 -
Equity 99,962.3 114,793.3 114,097.6
Adjusted rat ios
EBITDA margin (%) 2.2 2.3 2.8
Return on capital (%) 3.9 8.4 12.0
EBITDA interest coverage (x) 26.8 32.8 37.5
FFO cash interest coverage (x) 32.6 39.3 38.8
Debt/EBITDA (x) 2.1 0.4 0.0
FFO/debt (%) 44.1 247.6 N.M.
Cash flow from operations/debt (%) 2.8 (203.8) N.M.
Free operating cash flow/debt (%) (31.6) (430.5) N.M.
Discretionary cash flow/debt (%) (45.4) (537.2) N.M.
NT$--New Taiwan dollar. N.M.--Not meaningful. Note: Data are fully adjusted.
Compal Electronics Inc. -- Financia l Summary
--Fiscal year ended Dec. 31--
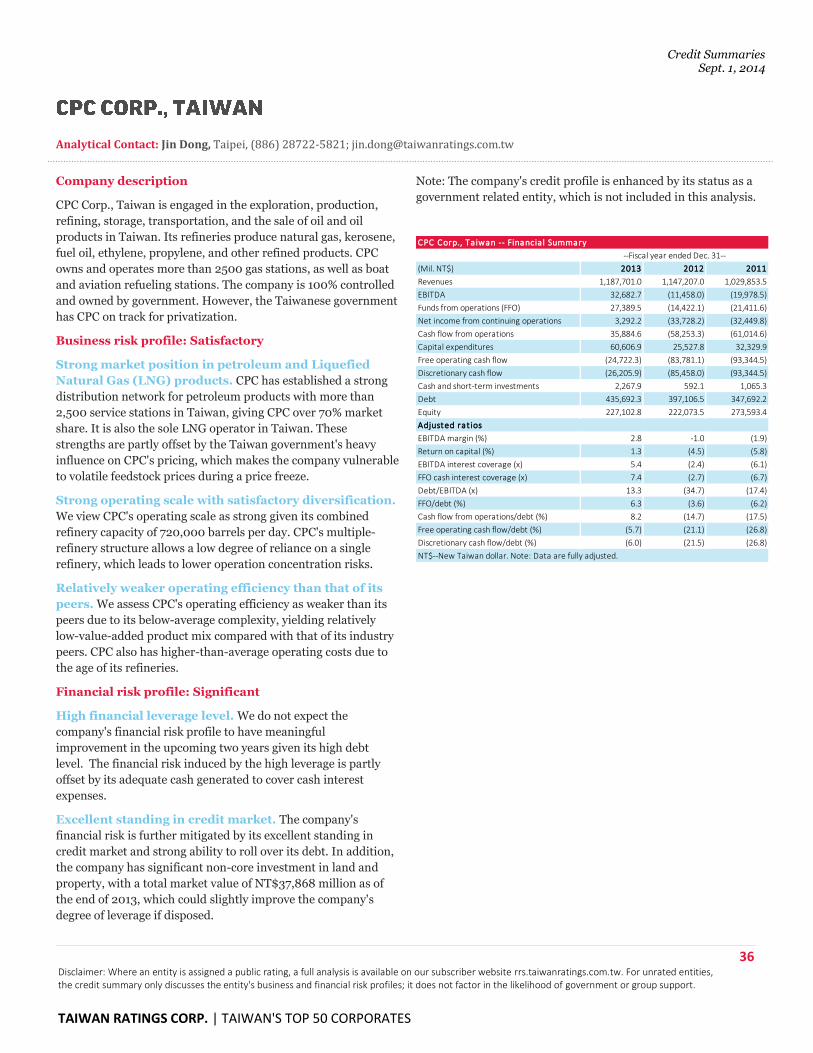
Credit Summaries Sept. 1, 2014
36 Disclaimer: Where an entity is assigned a public rating, a full analysis is available on our subscriber website rrs.taiwanratings.com.tw. For unrated entities, the credit summary only discusses the entity's business and financial risk profiles; it does not factor in the likelihood of government or group support.
TAIWAN RATINGS CORP. | TAIWAN'S TOP 50 CORPORATES
Analytical Contact: Jin Dong, Taipei, (886) 28722-5821; [email protected]
Company description
CPC Corp., Taiwan is engaged in the exploration, production,
refining, storage, transportation, and the sale of oil and oil
products in Taiwan. Its refineries produce natural gas, kerosene,
fuel oil, ethylene, propylene, and other refined products. CPC
owns and operates more than 2500 gas stations, as well as boat
and aviation refueling stations. The company is 100% controlled
and owned by government. However, the Taiwanese government
has CPC on track for privatization.
Business risk profile: Satisfactory
Strong market position in petroleum and Liquefied
Natural Gas (LNG) products. CPC has established a strong
distribution network for petroleum products with more than
2,500 service stations in Taiwan, giving CPC over 70% market
share. It is also the sole LNG operator in Taiwan. These
strengths are partly offset by the Taiwan government's heavy
influence on CPC's pricing, which makes the company vulnerable
to volatile feedstock prices during a price freeze.
Strong operating scale with satisfactory diversification.
We view CPC's operating scale as strong given its combined
refinery capacity of 720,000 barrels per day. CPC's multiple-
refinery structure allows a low degree of reliance on a single
refinery, which leads to lower operation concentration risks.
Relatively weaker operating efficiency than that of its
peers. We assess CPC's operating efficiency as weaker than its
peers due to its below-average complexity, yielding relatively
low-value-added product mix compared with that of its industry
peers. CPC also has higher-than-average operating costs due to
the age of its refineries.
Financial risk profile: Significant
High financial leverage level. We do not expect the
company's financial risk profile to have meaningful
improvement in the upcoming two years given its high debt
level. The financial risk induced by the high leverage is partly
offset by its adequate cash generated to cover cash interest
expenses.
Excellent standing in credit market. The company's
financial risk is further mitigated by its excellent standing in
credit market and strong ability to roll over its debt. In addition,
the company has significant non-core investment in land and
property, with a total market value of NT$37,868 million as of
the end of 2013, which could slightly improve the company's
degree of leverage if disposed.
Note: The company's credit profile is enhanced by its status as a
government related entity, which is not included in this analysis.
(Mil. NT$) 2013 2012 2011
Revenues 1,187,701.0 1,147,207.0 1,029,853.5
EBITDA 32,682.7 (11,458.0) (19,978.5)
Funds from operations (FFO) 27,389.5 (14,422.1) (21,411.6)
Net income from continuing operations 3,292.2 (33,728.2) (32,449.8)
Cash flow from operations 35,884.6 (58,253.3) (61,014.6)
Capital expenditures 60,606.9 25,527.8 32,329.9
Free operating cash flow (24,722.3) (83,781.1) (93,344.5)
Discretionary cash flow (26,205.9) (85,458.0) (93,344.5)
Cash and short-term investments 2,267.9 592.1 1,065.3
Debt 435,692.3 397,106.5 347,692.2
Equity 227,102.8 222,073.5 273,593.4
Adjusted rat ios
EBITDA margin (%) 2.8 -1.0 (1.9)
Return on capital (%) 1.3 (4.5) (5.8)
EBITDA interest coverage (x) 5.4 (2.4) (6.1)
FFO cash interest coverage (x) 7.4 (2.7) (6.7)
Debt/EBITDA (x) 13.3 (34.7) (17.4)
FFO/debt (%) 6.3 (3.6) (6.2)
Cash flow from operations/debt (%) 8.2 (14.7) (17.5)
Free operating cash flow/debt (%) (5.7) (21.1) (26.8)
Discretionary cash flow/debt (%) (6.0) (21.5) (26.8)
NT$--New Taiwan dollar. Note: Data are fully adjusted.
CPC Corp., Ta iwan -- Financia l Summary
--Fiscal year ended Dec. 31--
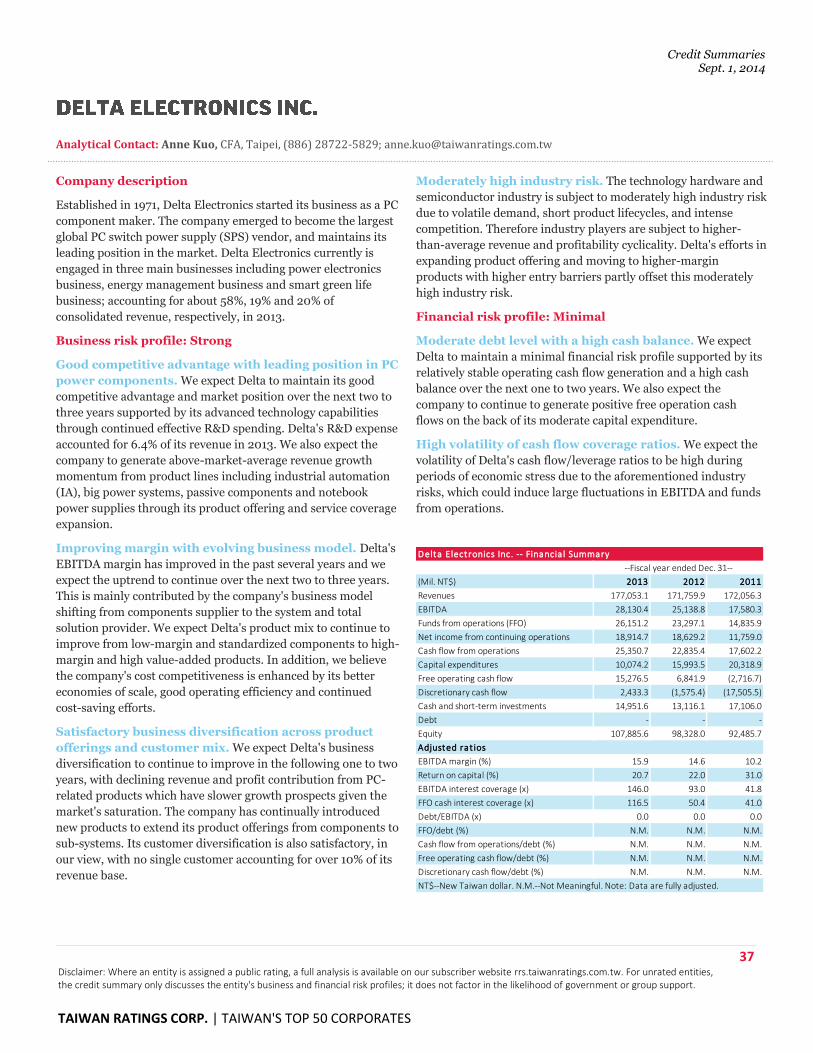
Credit Summaries Sept. 1, 2014
37 Disclaimer: Where an entity is assigned a public rating, a full analysis is available on our subscriber website rrs.taiwanratings.com.tw. For unrated entities, the credit summary only discusses the entity's business and financial risk profiles; it does not factor in the likelihood of government or group support.
TAIWAN RATINGS CORP. | TAIWAN'S TOP 50 CORPORATES
Analytical Contact: Anne Kuo, CFA, Taipei, (886) 28722-5829; [email protected]
Company description
Established in 1971, Delta Electronics started its business as a PC
component maker. The company emerged to become the largest
global PC switch power supply (SPS) vendor, and maintains its
leading position in the market. Delta Electronics currently is
engaged in three main businesses including power electronics
business, energy management business and smart green life
business; accounting for about 58%, 19% and 20% of
consolidated revenue, respectively, in 2013.
Business risk profile: Strong
Good competitive advantage with leading position in PC
power components. We expect Delta to maintain its good
competitive advantage and market position over the next two to
three years supported by its advanced technology capabilities
through continued effective R&D spending. Delta's R&D expense
accounted for 6.4% of its revenue in 2013. We also expect the
company to generate above-market-average revenue growth
momentum from product lines including industrial automation
(IA), big power systems, passive components and notebook
power supplies through its product offering and service coverage
expansion.
Improving margin with evolving business model. Delta's
EBITDA margin has improved in the past several years and we
expect the uptrend to continue over the next two to three years.
This is mainly contributed by the company's business model
shifting from components supplier to the system and total
solution provider. We expect Delta's product mix to continue to
improve from low-margin and standardized components to high-
margin and high value-added products. In addition, we believe
the company's cost competitiveness is enhanced by its better
economies of scale, good operating efficiency and continued
cost-saving efforts.
Satisfactory business diversification across product
offerings and customer mix. We expect Delta's business
diversification to continue to improve in the following one to two
years, with declining revenue and profit contribution from PC-
related products which have slower growth prospects given the
market's saturation. The company has continually introduced
new products to extend its product offerings from components to
sub-systems. Its customer diversification is also satisfactory, in
our view, with no single customer accounting for over 10% of its
revenue base.
Moderately high industry risk. The technology hardware and
semiconductor industry is subject to moderately high industry risk
due to volatile demand, short product lifecycles, and intense
competition. Therefore industry players are subject to higher-
than-average revenue and profitability cyclicality. Delta's efforts in
expanding product offering and moving to higher-margin
products with higher entry barriers partly offset this moderately
high industry risk.
Financial risk profile: Minimal
Moderate debt level with a high cash balance. We expect
Delta to maintain a minimal financial risk profile supported by its
relatively stable operating cash flow generation and a high cash
balance over the next one to two years. We also expect the
company to continue to generate positive free operation cash
flows on the back of its moderate capital expenditure.
High volatility of cash flow coverage ratios. We expect the
volatility of Delta's cash flow/leverage ratios to be high during
periods of economic stress due to the aforementioned industry
risks, which could induce large fluctuations in EBITDA and funds
from operations.
(Mil. NT$) 2013 2012 2011
Revenues 177,053.1 171,759.9 172,056.3
EBITDA 28,130.4 25,138.8 17,580.3
Funds from operations (FFO) 26,151.2 23,297.1 14,835.9
Net income from continuing operations 18,914.7 18,629.2 11,759.0
Cash flow from operations 25,350.7 22,835.4 17,602.2
Capital expenditures 10,074.2 15,993.5 20,318.9
Free operating cash flow 15,276.5 6,841.9 (2,716.7)
Discretionary cash flow 2,433.3 (1,575.4) (17,505.5)
Cash and short-term investments 14,951.6 13,116.1 17,106.0
Debt - - -
Equity 107,885.6 98,328.0 92,485.7
Adjusted rat ios
EBITDA margin (%) 15.9 14.6 10.2
Return on capital (%) 20.7 22.0 31.0
EBITDA interest coverage (x) 146.0 93.0 41.8
FFO cash interest coverage (x) 116.5 50.4 41.0
Debt/EBITDA (x) 0.0 0.0 0.0
FFO/debt (%) N.M. N.M. N.M.
Cash flow from operations/debt (%) N.M. N.M. N.M.
Free operating cash flow/debt (%) N.M. N.M. N.M.
Discretionary cash flow/debt (%) N.M. N.M. N.M.
NT$--New Taiwan dollar. N.M.--Not Meaningful. Note: Data are fully adjusted.
--Fiscal year ended Dec. 31--
Delta Electronics Inc. -- Financia l Summary
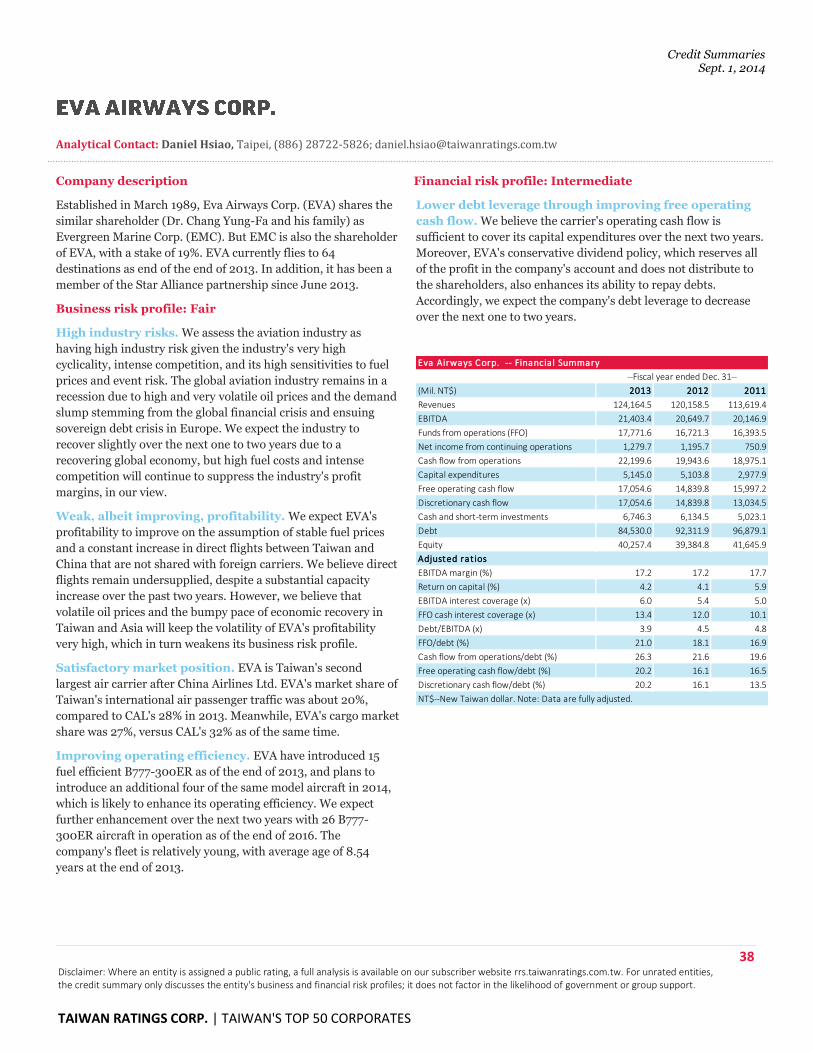
Credit Summaries Sept. 1, 2014
38 Disclaimer: Where an entity is assigned a public rating, a full analysis is available on our subscriber website rrs.taiwanratings.com.tw. For unrated entities, the credit summary only discusses the entity's business and financial risk profiles; it does not factor in the likelihood of government or group support.
TAIWAN RATINGS CORP. | TAIWAN'S TOP 50 CORPORATES
Analytical Contact: Daniel Hsiao, Taipei, (886) 28722-5826; [email protected]
Company description
Established in March 1989, Eva Airways Corp. (EVA) shares the
similar shareholder (Dr. Chang Yung-Fa and his family) as
Evergreen Marine Corp. (EMC). But EMC is also the shareholder
of EVA, with a stake of 19%. EVA currently flies to 64
destinations as end of the end of 2013. In addition, it has been a
member of the Star Alliance partnership since June 2013.
Business risk profile: Fair
High industry risks. We assess the aviation industry as
having high industry risk given the industry's very high
cyclicality, intense competition, and its high sensitivities to fuel
prices and event risk. The global aviation industry remains in a
recession due to high and very volatile oil prices and the demand
slump stemming from the global financial crisis and ensuing
sovereign debt crisis in Europe. We expect the industry to
recover slightly over the next one to two years due to a
recovering global economy, but high fuel costs and intense
competition will continue to suppress the industry's profit
margins, in our view.
Weak, albeit improving, profitability. We expect EVA's
profitability to improve on the assumption of stable fuel prices
and a constant increase in direct flights between Taiwan and
China that are not shared with foreign carriers. We believe direct
flights remain undersupplied, despite a substantial capacity
increase over the past two years. However, we believe that
volatile oil prices and the bumpy pace of economic recovery in
Taiwan and Asia will keep the volatility of EVA's profitability
very high, which in turn weakens its business risk profile.
Satisfactory market position. EVA is Taiwan's second
largest air carrier after China Airlines Ltd. EVA's market share of
Taiwan's international air passenger traffic was about 20%,
compared to CAL's 28% in 2013. Meanwhile, EVA's cargo market
share was 27%, versus CAL's 32% as of the same time.
Improving operating efficiency. EVA have introduced 15
fuel efficient B777-300ER as of the end of 2013, and plans to
introduce an additional four of the same model aircraft in 2014,
which is likely to enhance its operating efficiency. We expect
further enhancement over the next two years with 26 B777-
300ER aircraft in operation as of the end of 2016. The
company's fleet is relatively young, with average age of 8.54
years at the end of 2013.
Financial risk profile: Intermediate
Lower debt leverage through improving free operating
cash flow. We believe the carrier's operating cash flow is
sufficient to cover its capital expenditures over the next two years.
Moreover, EVA's conservative dividend policy, which reserves all
of the profit in the company's account and does not distribute to
the shareholders, also enhances its ability to repay debts.
Accordingly, we expect the company's debt leverage to decrease
over the next one to two years.
(Mil. NT$) 2013 2012 2011
Revenues 124,164.5 120,158.5 113,619.4
EBITDA 21,403.4 20,649.7 20,146.9
Funds from operations (FFO) 17,771.6 16,721.3 16,393.5
Net income from continuing operations 1,279.7 1,195.7 750.9
Cash flow from operations 22,199.6 19,943.6 18,975.1
Capital expenditures 5,145.0 5,103.8 2,977.9
Free operating cash flow 17,054.6 14,839.8 15,997.2
Discretionary cash flow 17,054.6 14,839.8 13,034.5
Cash and short-term investments 6,746.3 6,134.5 5,023.1
Debt 84,530.0 92,311.9 96,879.1
Equity 40,257.4 39,384.8 41,645.9
Adjusted rat ios
EBITDA margin (%) 17.2 17.2 17.7
Return on capital (%) 4.2 4.1 5.9
EBITDA interest coverage (x) 6.0 5.4 5.0
FFO cash interest coverage (x) 13.4 12.0 10.1
Debt/EBITDA (x) 3.9 4.5 4.8
FFO/debt (%) 21.0 18.1 16.9
Cash flow from operations/debt (%) 26.3 21.6 19.6
Free operating cash flow/debt (%) 20.2 16.1 16.5
Discretionary cash flow/debt (%) 20.2 16.1 13.5
NT$--New Taiwan dollar. Note: Data are fully adjusted.
Eva Airways Corp. -- Financia l Summary
--Fiscal year ended Dec. 31--
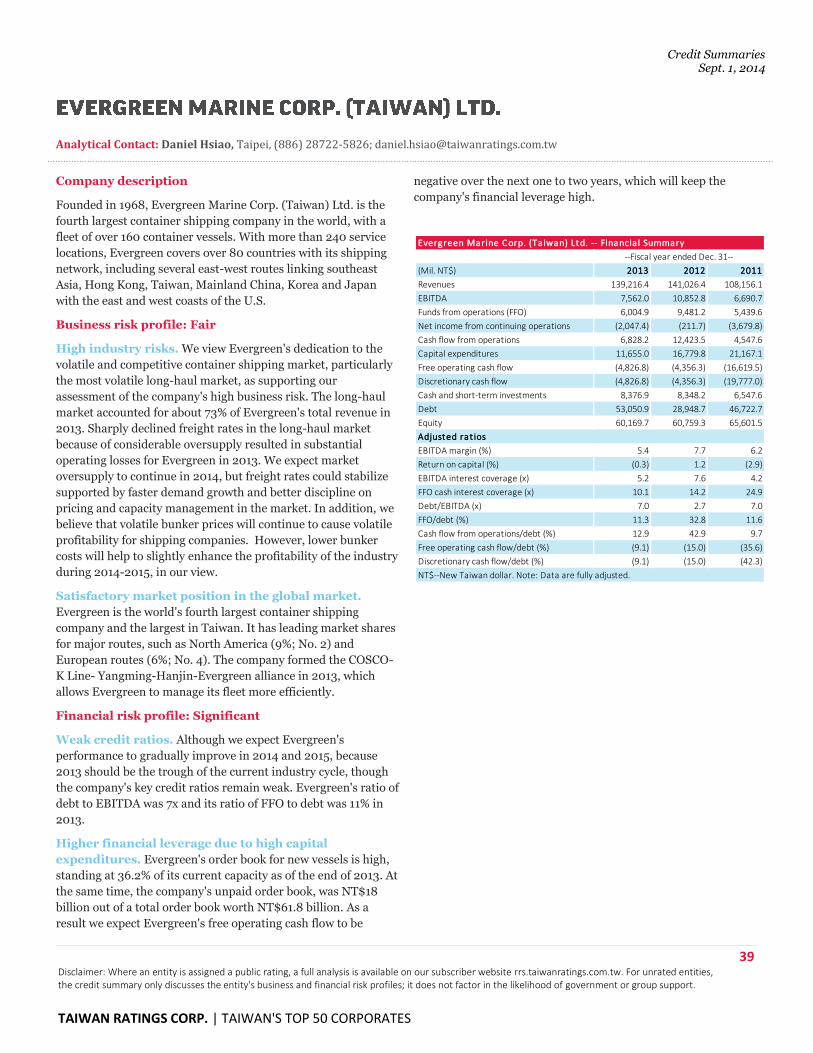
Credit Summaries Sept. 1, 2014
39 Disclaimer: Where an entity is assigned a public rating, a full analysis is available on our subscriber website rrs.taiwanratings.com.tw. For unrated entities, the credit summary only discusses the entity's business and financial risk profiles; it does not factor in the likelihood of government or group support.
TAIWAN RATINGS CORP. | TAIWAN'S TOP 50 CORPORATES
Analytical Contact: Daniel Hsiao, Taipei, (886) 28722-5826; [email protected]
Company description
Founded in 1968, Evergreen Marine Corp. (Taiwan) Ltd. is the
fourth largest container shipping company in the world, with a
fleet of over 160 container vessels. With more than 240 service
locations, Evergreen covers over 80 countries with its shipping
network, including several east-west routes linking southeast
Asia, Hong Kong, Taiwan, Mainland China, Korea and Japan
with the east and west coasts of the U.S.
Business risk profile: Fair
High industry risks. We view Evergreen's dedication to the
volatile and competitive container shipping market, particularly
the most volatile long-haul market, as supporting our
assessment of the company's high business risk. The long-haul
market accounted for about 73% of Evergreen's total revenue in
2013. Sharply declined freight rates in the long-haul market
because of considerable oversupply resulted in substantial
operating losses for Evergreen in 2013. We expect market
oversupply to continue in 2014, but freight rates could stabilize
supported by faster demand growth and better discipline on
pricing and capacity management in the market. In addition, we
believe that volatile bunker prices will continue to cause volatile
profitability for shipping companies. However, lower bunker
costs will help to slightly enhance the profitability of the industry
during 2014-2015, in our view.
Satisfactory market position in the global market.
Evergreen is the world's fourth largest container shipping
company and the largest in Taiwan. It has leading market shares
for major routes, such as North America (9%; No. 2) and
European routes (6%; No. 4). The company formed the COSCO-
K Line- Yangming-Hanjin-Evergreen alliance in 2013, which
allows Evergreen to manage its fleet more efficiently.
Financial risk profile: Significant
Weak credit ratios. Although we expect Evergreen's
performance to gradually improve in 2014 and 2015, because
2013 should be the trough of the current industry cycle, though
the company's key credit ratios remain weak. Evergreen's ratio of
debt to EBITDA was 7x and its ratio of FFO to debt was 11% in
2013.
Higher financial leverage due to high capital
expenditures. Evergreen's order book for new vessels is high,
standing at 36.2% of its current capacity as of the end of 2013. At
the same time, the company's unpaid order book, was NT$18
billion out of a total order book worth NT$61.8 billion. As a
result we expect Evergreen's free operating cash flow to be
negative over the next one to two years, which will keep the
company's financial leverage high.
(Mil. NT$) 2013 2012 2011
Revenues 139,216.4 141,026.4 108,156.1
EBITDA 7,562.0 10,852.8 6,690.7
Funds from operations (FFO) 6,004.9 9,481.2 5,439.6
Net income from continuing operations (2,047.4) (211.7) (3,679.8)
Cash flow from operations 6,828.2 12,423.5 4,547.6
Capital expenditures 11,655.0 16,779.8 21,167.1
Free operating cash flow (4,826.8) (4,356.3) (16,619.5)
Discretionary cash flow (4,826.8) (4,356.3) (19,777.0)
Cash and short-term investments 8,376.9 8,348.2 6,547.6
Debt 53,050.9 28,948.7 46,722.7
Equity 60,169.7 60,759.3 65,601.5
Adjusted rat ios
EBITDA margin (%) 5.4 7.7 6.2
Return on capital (%) (0.3) 1.2 (2.9)
EBITDA interest coverage (x) 5.2 7.6 4.2
FFO cash interest coverage (x) 10.1 14.2 24.9
Debt/EBITDA (x) 7.0 2.7 7.0
FFO/debt (%) 11.3 32.8 11.6
Cash flow from operations/debt (%) 12.9 42.9 9.7
Free operating cash flow/debt (%) (9.1) (15.0) (35.6)
Discretionary cash flow/debt (%) (9.1) (15.0) (42.3)
NT$--New Taiwan dollar. Note: Data are fully adjusted.
Evergreen Marine Corp. (Ta iwan) Ltd. -- Financia l Summary
--Fiscal year ended Dec. 31--
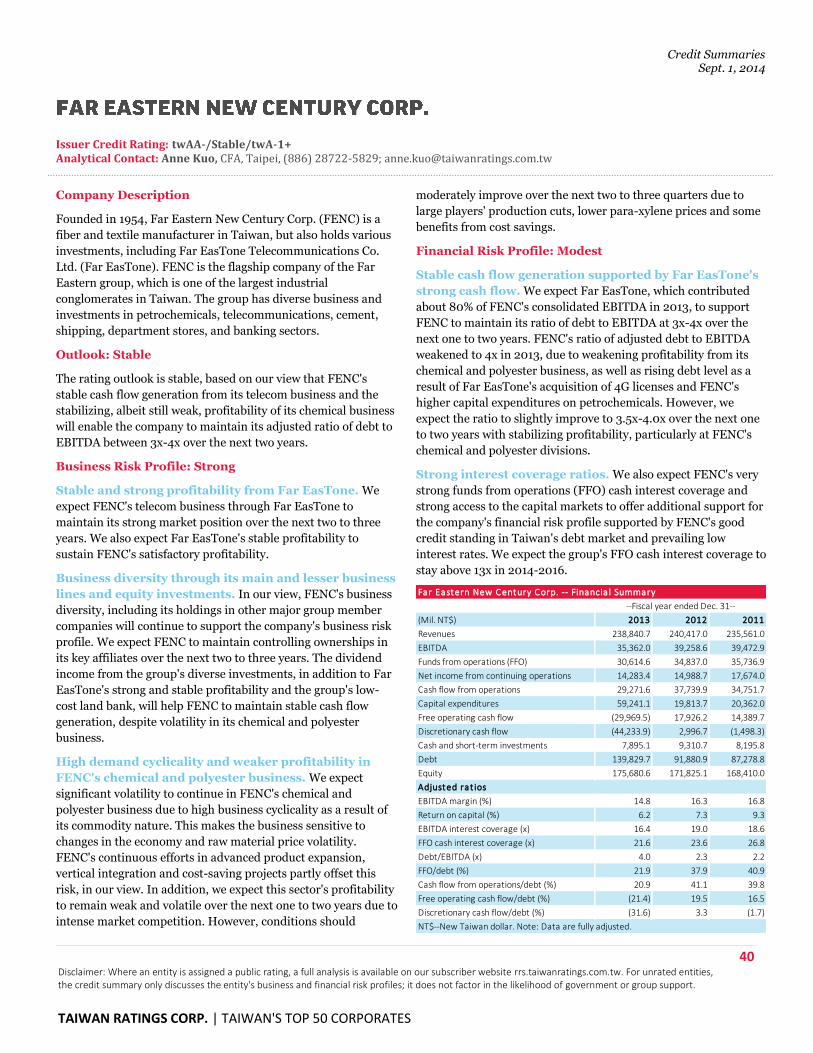
Credit Summaries Sept. 1, 2014
40 Disclaimer: Where an entity is assigned a public rating, a full analysis is available on our subscriber website rrs.taiwanratings.com.tw. For unrated entities, the credit summary only discusses the entity's business and financial risk profiles; it does not factor in the likelihood of government or group support.
TAIWAN RATINGS CORP. | TAIWAN'S TOP 50 CORPORATES
Issuer Credit Rating: twAA-/Stable/twA-1+ Analytical Contact: Anne Kuo, CFA, Taipei, (886) 28722-5829; [email protected]
Company Description
Founded in 1954, Far Eastern New Century Corp. (FENC) is a
fiber and textile manufacturer in Taiwan, but also holds various
investments, including Far EasTone Telecommunications Co.
Ltd. (Far EasTone). FENC is the flagship company of the Far
Eastern group, which is one of the largest industrial
conglomerates in Taiwan. The group has diverse business and
investments in petrochemicals, telecommunications, cement,
shipping, department stores, and banking sectors.
Outlook: Stable
The rating outlook is stable, based on our view that FENC's
stable cash flow generation from its telecom business and the
stabilizing, albeit still weak, profitability of its chemical business
will enable the company to maintain its adjusted ratio of debt to
EBITDA between 3x-4x over the next two years.
Business Risk Profile: Strong
Stable and strong profitability from Far EasTone. We
expect FENC's telecom business through Far EasTone to
maintain its strong market position over the next two to three
years. We also expect Far EasTone's stable profitability to
sustain FENC's satisfactory profitability.
Business diversity through its main and lesser business
lines and equity investments. In our view, FENC's business
diversity, including its holdings in other major group member
companies will continue to support the company's business risk
profile. We expect FENC to maintain controlling ownerships in
its key affiliates over the next two to three years. The dividend
income from the group's diverse investments, in addition to Far
EasTone's strong and stable profitability and the group's low-
cost land bank, will help FENC to maintain stable cash flow
generation, despite volatility in its chemical and polyester
business.
High demand cyclicality and weaker profitability in
FENC's chemical and polyester business. We expect
significant volatility to continue in FENC's chemical and
polyester business due to high business cyclicality as a result of
its commodity nature. This makes the business sensitive to
changes in the economy and raw material price volatility.
FENC's continuous efforts in advanced product expansion,
vertical integration and cost-saving projects partly offset this
risk, in our view. In addition, we expect this sector's profitability
to remain weak and volatile over the next one to two years due to
intense market competition. However, conditions should
moderately improve over the next two to three quarters due to
large players' production cuts, lower para-xylene prices and some
benefits from cost savings.
Financial Risk Profile: Modest
Stable cash flow generation supported by Far EasTone's
strong cash flow. We expect Far EasTone, which contributed
about 80% of FENC's consolidated EBITDA in 2013, to support
FENC to maintain its ratio of debt to EBITDA at 3x-4x over the
next one to two years. FENC's ratio of adjusted debt to EBITDA
weakened to 4x in 2013, due to weakening profitability from its
chemical and polyester business, as well as rising debt level as a
result of Far EasTone's acquisition of 4G licenses and FENC's
higher capital expenditures on petrochemicals. However, we
expect the ratio to slightly improve to 3.5x-4.0x over the next one
to two years with stabilizing profitability, particularly at FENC's
chemical and polyester divisions.
Strong interest coverage ratios. We also expect FENC's very
strong funds from operations (FFO) cash interest coverage and
strong access to the capital markets to offer additional support for
the company's financial risk profile supported by FENC's good
credit standing in Taiwan's debt market and prevailing low
interest rates. We expect the group's FFO cash interest coverage to
stay above 13x in 2014-2016.
(Mil. NT$) 2013 2012 2011
Revenues 238,840.7 240,417.0 235,561.0
EBITDA 35,362.0 39,258.6 39,472.9
Funds from operations (FFO) 30,614.6 34,837.0 35,736.9
Net income from continuing operations 14,283.4 14,988.7 17,674.0
Cash flow from operations 29,271.6 37,739.9 34,751.7
Capital expenditures 59,241.1 19,813.7 20,362.0
Free operating cash flow (29,969.5) 17,926.2 14,389.7
Discretionary cash flow (44,233.9) 2,996.7 (1,498.3)
Cash and short-term investments 7,895.1 9,310.7 8,195.8
Debt 139,829.7 91,880.9 87,278.8
Equity 175,680.6 171,825.1 168,410.0
Adjusted rat ios
EBITDA margin (%) 14.8 16.3 16.8
Return on capital (%) 6.2 7.3 9.3
EBITDA interest coverage (x) 16.4 19.0 18.6
FFO cash interest coverage (x) 21.6 23.6 26.8
Debt/EBITDA (x) 4.0 2.3 2.2
FFO/debt (%) 21.9 37.9 40.9
Cash flow from operations/debt (%) 20.9 41.1 39.8
Free operating cash flow/debt (%) (21.4) 19.5 16.5
Discretionary cash flow/debt (%) (31.6) 3.3 (1.7)
NT$--New Taiwan dollar. Note: Data are fully adjusted.
--Fiscal year ended Dec. 31--
Far Eastern New Century Corp. -- Financia l Summary
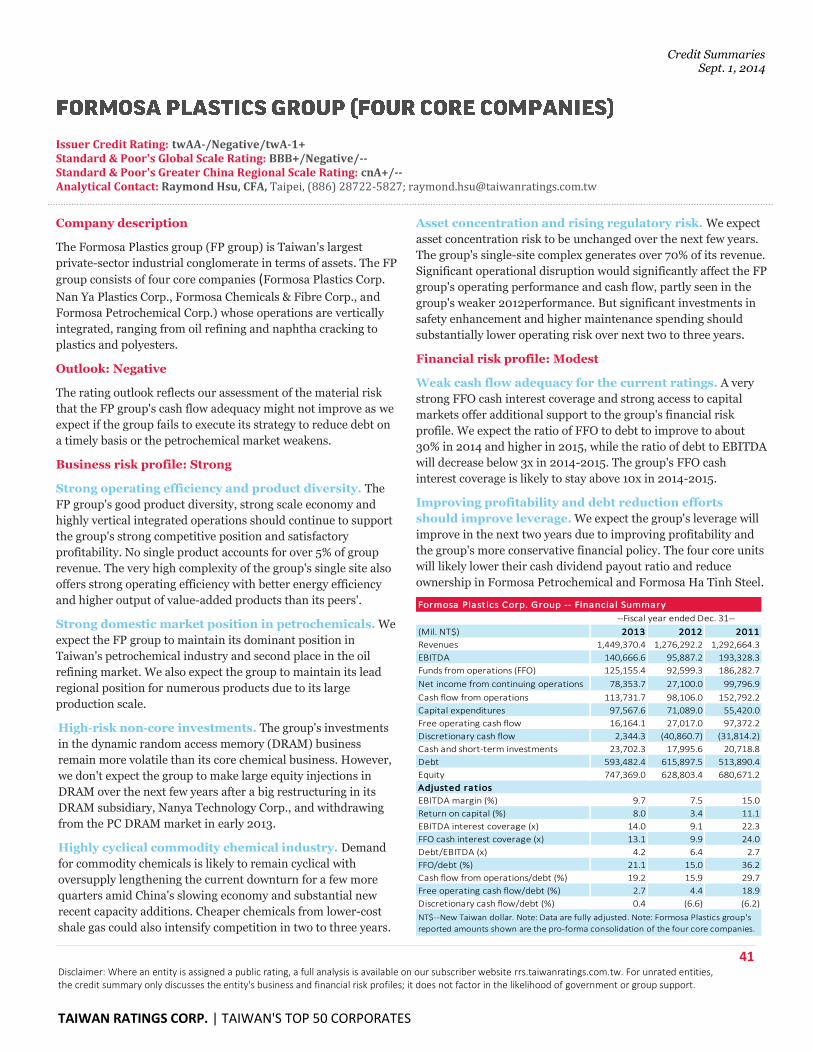
Credit Summaries Sept. 1, 2014
41 Disclaimer: Where an entity is assigned a public rating, a full analysis is available on our subscriber website rrs.taiwanratings.com.tw. For unrated entities, the credit summary only discusses the entity's business and financial risk profiles; it does not factor in the likelihood of government or group support.
TAIWAN RATINGS CORP. | TAIWAN'S TOP 50 CORPORATES
Issuer Credit Rating: twAA-/Negative/twA-1+ Standard & Poor's Global Scale Rating: BBB+/Negative/-- Standard & Poor's Greater China Regional Scale Rating: cnA+/-- Analytical Contact: Raymond Hsu, CFA, Taipei, (886) 28722-5827; [email protected]
Company description
The Formosa Plastics group (FP group) is Taiwan's largest
private-sector industrial conglomerate in terms of assets. The FP
group consists of four core companies (Formosa Plastics Corp.
Nan Ya Plastics Corp., Formosa Chemicals & Fibre Corp., and
Formosa Petrochemical Corp.) whose operations are vertically
integrated, ranging from oil refining and naphtha cracking to
plastics and polyesters.
Outlook: Negative
The rating outlook reflects our assessment of the material risk
that the FP group's cash flow adequacy might not improve as we
expect if the group fails to execute its strategy to reduce debt on
a timely basis or the petrochemical market weakens.
Business risk profile: Strong
Strong operating efficiency and product diversity. The
FP group's good product diversity, strong scale economy and
highly vertical integrated operations should continue to support
the group's strong competitive position and satisfactory
profitability. No single product accounts for over 5% of group
revenue. The very high complexity of the group's single site also
offers strong operating efficiency with better energy efficiency
and higher output of value-added products than its peers'.
Strong domestic market position in petrochemicals. We
expect the FP group to maintain its dominant position in
Taiwan's petrochemical industry and second place in the oil
refining market. We also expect the group to maintain its lead
regional position for numerous products due to its large
production scale.
High‐risk non‐core investments. The group's investments
in the dynamic random access memory (DRAM) business
remain more volatile than its core chemical business. However,
we don't expect the group to make large equity injections in
DRAM over the next few years after a big restructuring in its
DRAM subsidiary, Nanya Technology Corp., and withdrawing
from the PC DRAM market in early 2013.
Highly cyclical commodity chemical industry. Demand
for commodity chemicals is likely to remain cyclical with
oversupply lengthening the current downturn for a few more
quarters amid China's slowing economy and substantial new
recent capacity additions. Cheaper chemicals from lower-cost
shale gas could also intensify competition in two to three years.
Asset concentration and rising regulatory risk. We expect
asset concentration risk to be unchanged over the next few years.
The group's single-site complex generates over 70% of its revenue.
Significant operational disruption would significantly affect the FP
group's operating performance and cash flow, partly seen in the
group's weaker 2012performance. But significant investments in
safety enhancement and higher maintenance spending should
substantially lower operating risk over next two to three years.
Financial risk profile: Modest
Weak cash flow adequacy for the current ratings. A very
strong FFO cash interest coverage and strong access to capital
markets offer additional support to the group's financial risk
profile. We expect the ratio of FFO to debt to improve to about
30% in 2014 and higher in 2015, while the ratio of debt to EBITDA
will decrease below 3x in 2014-2015. The group's FFO cash
interest coverage is likely to stay above 10x in 2014-2015.
Improving profitability and debt reduction efforts
should improve leverage. We expect the group's leverage will
improve in the next two years due to improving profitability and
the group's more conservative financial policy. The four core units
will likely lower their cash dividend payout ratio and reduce
ownership in Formosa Petrochemical and Formosa Ha Tinh Steel.
(Mil. NT$) 2013 2012 2011
Revenues 1,449,370.4 1,276,292.2 1,292,664.3
EBITDA 140,666.6 95,887.2 193,328.3
Funds from operations (FFO) 125,155.4 92,599.3 186,282.7
Net income from continuing operations 78,353.7 27,100.0 99,796.9
Cash flow from operations 113,731.7 98,106.0 152,792.2
Capital expenditures 97,567.6 71,089.0 55,420.0
Free operating cash flow 16,164.1 27,017.0 97,372.2
Discretionary cash flow 2,344.3 (40,860.7) (31,814.2)
Cash and short-term investments 23,702.3 17,995.6 20,718.8
Debt 593,482.4 615,897.5 513,890.4
Equity 747,369.0 628,803.4 680,671.2
Adjusted rat ios
EBITDA margin (%) 9.7 7.5 15.0
Return on capital (%) 8.0 3.4 11.1
EBITDA interest coverage (x) 14.0 9.1 22.3
FFO cash interest coverage (x) 13.1 9.9 24.0
Debt/EBITDA (x) 4.2 6.4 2.7
FFO/debt (%) 21.1 15.0 36.2
Cash flow from operations/debt (%) 19.2 15.9 29.7
Free operating cash flow/debt (%) 2.7 4.4 18.9
Discretionary cash flow/debt (%) 0.4 (6.6) (6.2)
--Fiscal year ended Dec. 31--
NT$--New Taiwan dollar. Note: Data are fully adjusted. Note: Formosa Plastics group's
reported amounts shown are the pro-forma consolidation of the four core companies.
Formosa Plast ics Corp. Group -- Financia l Summary
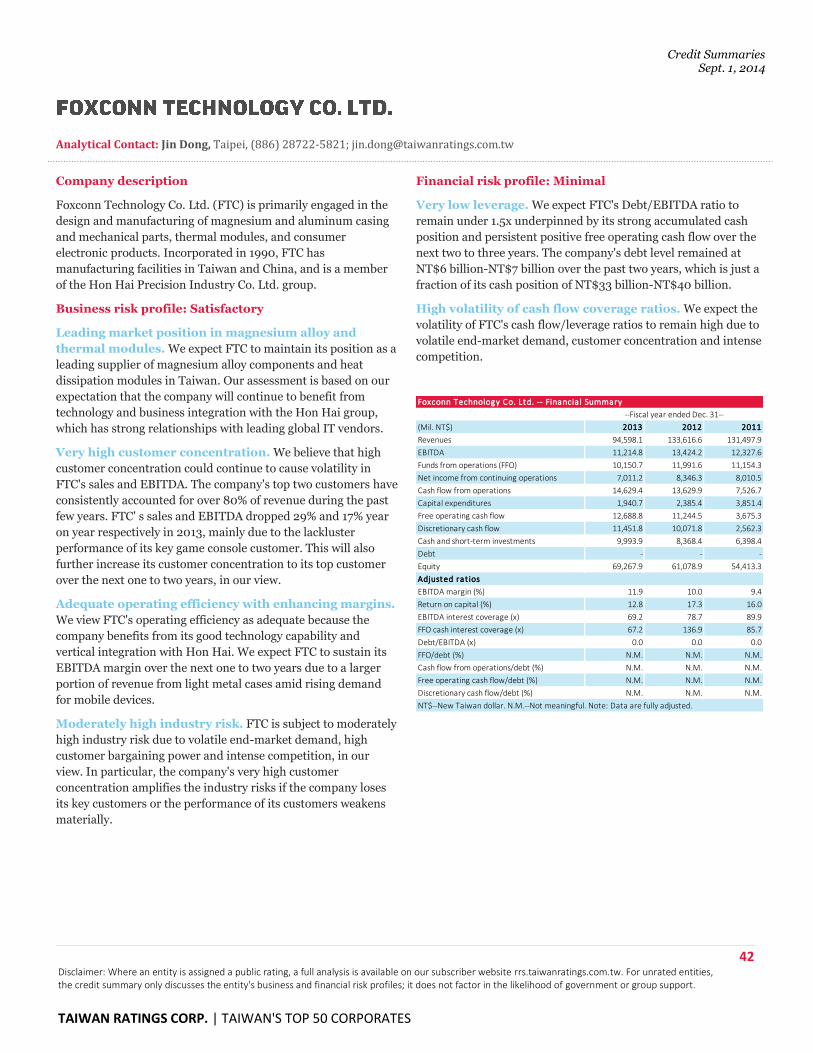
Credit Summaries Sept. 1, 2014
42 Disclaimer: Where an entity is assigned a public rating, a full analysis is available on our subscriber website rrs.taiwanratings.com.tw. For unrated entities, the credit summary only discusses the entity's business and financial risk profiles; it does not factor in the likelihood of government or group support.
TAIWAN RATINGS CORP. | TAIWAN'S TOP 50 CORPORATES
Analytical Contact: Jin Dong, Taipei, (886) 28722-5821; [email protected]
Company description
Foxconn Technology Co. Ltd. (FTC) is primarily engaged in the
design and manufacturing of magnesium and aluminum casing
and mechanical parts, thermal modules, and consumer
electronic products. Incorporated in 1990, FTC has
manufacturing facilities in Taiwan and China, and is a member
of the Hon Hai Precision Industry Co. Ltd. group.
Business risk profile: Satisfactory
Leading market position in magnesium alloy and
thermal modules. We expect FTC to maintain its position as a
leading supplier of magnesium alloy components and heat
dissipation modules in Taiwan. Our assessment is based on our
expectation that the company will continue to benefit from
technology and business integration with the Hon Hai group,
which has strong relationships with leading global IT vendors.
Very high customer concentration. We believe that high
customer concentration could continue to cause volatility in
FTC's sales and EBITDA. The company's top two customers have
consistently accounted for over 80% of revenue during the past
few years. FTC' s sales and EBITDA dropped 29% and 17% year
on year respectively in 2013, mainly due to the lackluster
performance of its key game console customer. This will also
further increase its customer concentration to its top customer
over the next one to two years, in our view.
Adequate operating efficiency with enhancing margins.
We view FTC's operating efficiency as adequate because the
company benefits from its good technology capability and
vertical integration with Hon Hai. We expect FTC to sustain its
EBITDA margin over the next one to two years due to a larger
portion of revenue from light metal cases amid rising demand
for mobile devices.
Moderately high industry risk. FTC is subject to moderately
high industry risk due to volatile end-market demand, high
customer bargaining power and intense competition, in our
view. In particular, the company's very high customer
concentration amplifies the industry risks if the company loses
its key customers or the performance of its customers weakens
materially.
Financial risk profile: Minimal
Very low leverage. We expect FTC's Debt/EBITDA ratio to
remain under 1.5x underpinned by its strong accumulated cash
position and persistent positive free operating cash flow over the
next two to three years. The company's debt level remained at
NT$6 billion-NT$7 billion over the past two years, which is just a
fraction of its cash position of NT$33 billion-NT$40 billion.
High volatility of cash flow coverage ratios. We expect the
volatility of FTC's cash flow/leverage ratios to remain high due to
volatile end-market demand, customer concentration and intense
competition.
(Mil. NT$) 2013 2012 2011
Revenues 94,598.1 133,616.6 131,497.9
EBITDA 11,214.8 13,424.2 12,327.6
Funds from operations (FFO) 10,150.7 11,991.6 11,154.3
Net income from continuing operations 7,011.2 8,346.3 8,010.5
Cash flow from operations 14,629.4 13,629.9 7,526.7
Capital expenditures 1,940.7 2,385.4 3,851.4
Free operating cash flow 12,688.8 11,244.5 3,675.3
Discretionary cash flow 11,451.8 10,071.8 2,562.3
Cash and short-term investments 9,993.9 8,368.4 6,398.4
Debt - - -
Equity 69,267.9 61,078.9 54,413.3
Adjusted rat ios
EBITDA margin (%) 11.9 10.0 9.4
Return on capital (%) 12.8 17.3 16.0
EBITDA interest coverage (x) 69.2 78.7 89.9
FFO cash interest coverage (x) 67.2 136.9 85.7
Debt/EBITDA (x) 0.0 0.0 0.0
FFO/debt (%) N.M. N.M. N.M.
Cash flow from operations/debt (%) N.M. N.M. N.M.
Free operating cash flow/debt (%) N.M. N.M. N.M.
Discretionary cash flow/debt (%) N.M. N.M. N.M.
NT$--New Taiwan dollar. N.M.--Not meaningful. Note: Data are fully adjusted.
Foxconn Technology Co. Ltd. -- Financia l Summary
--Fiscal year ended Dec. 31--
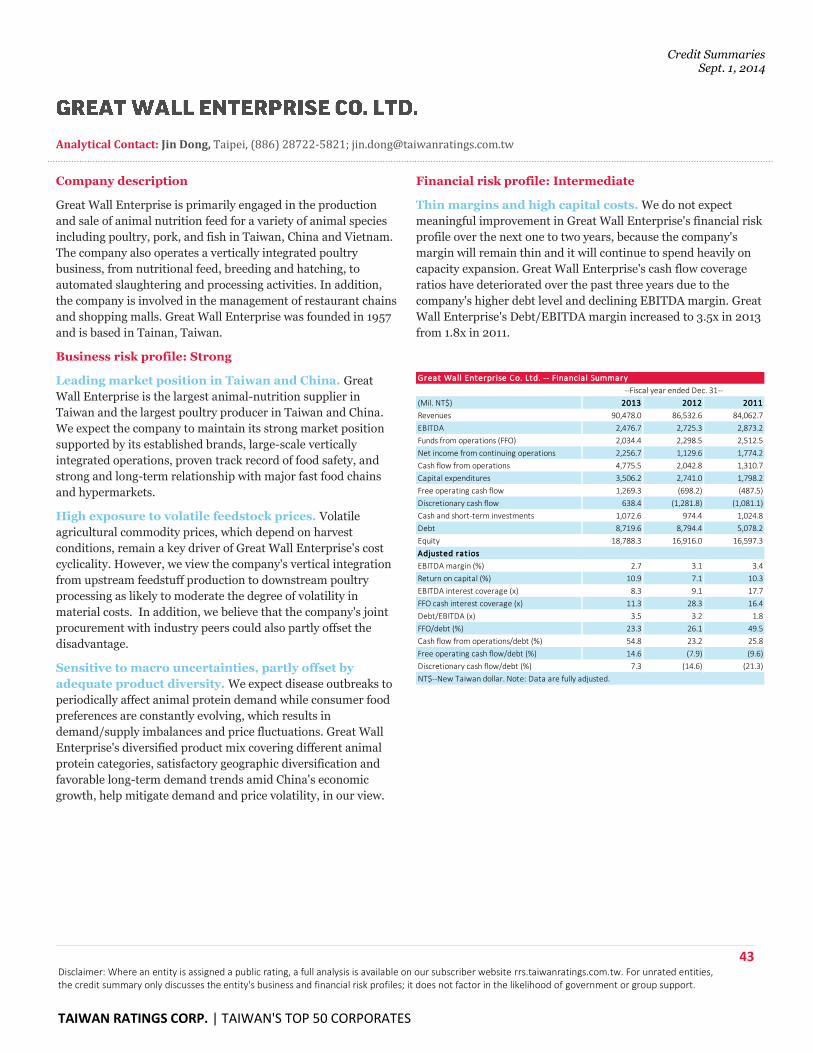
Credit Summaries Sept. 1, 2014
43 Disclaimer: Where an entity is assigned a public rating, a full analysis is available on our subscriber website rrs.taiwanratings.com.tw. For unrated entities, the credit summary only discusses the entity's business and financial risk profiles; it does not factor in the likelihood of government or group support.
TAIWAN RATINGS CORP. | TAIWAN'S TOP 50 CORPORATES
Analytical Contact: Jin Dong, Taipei, (886) 28722-5821; [email protected]
Company description
Great Wall Enterprise is primarily engaged in the production
and sale of animal nutrition feed for a variety of animal species
including poultry, pork, and fish in Taiwan, China and Vietnam.
The company also operates a vertically integrated poultry
business, from nutritional feed, breeding and hatching, to
automated slaughtering and processing activities. In addition,
the company is involved in the management of restaurant chains
and shopping malls. Great Wall Enterprise was founded in 1957
and is based in Tainan, Taiwan.
Business risk profile: Strong
Leading market position in Taiwan and China. Great
Wall Enterprise is the largest animal-nutrition supplier in
Taiwan and the largest poultry producer in Taiwan and China.
We expect the company to maintain its strong market position
supported by its established brands, large-scale vertically
integrated operations, proven track record of food safety, and
strong and long-term relationship with major fast food chains
and hypermarkets.
High exposure to volatile feedstock prices. Volatile
agricultural commodity prices, which depend on harvest
conditions, remain a key driver of Great Wall Enterprise's cost
cyclicality. However, we view the company's vertical integration
from upstream feedstuff production to downstream poultry
processing as likely to moderate the degree of volatility in
material costs. In addition, we believe that the company's joint
procurement with industry peers could also partly offset the
disadvantage.
Sensitive to macro uncertainties, partly offset by
adequate product diversity. We expect disease outbreaks to
periodically affect animal protein demand while consumer food
preferences are constantly evolving, which results in
demand/supply imbalances and price fluctuations. Great Wall
Enterprise's diversified product mix covering different animal
protein categories, satisfactory geographic diversification and
favorable long-term demand trends amid China's economic
growth, help mitigate demand and price volatility, in our view.
Financial risk profile: Intermediate
Thin margins and high capital costs. We do not expect
meaningful improvement in Great Wall Enterprise's financial risk
profile over the next one to two years, because the company's
margin will remain thin and it will continue to spend heavily on
capacity expansion. Great Wall Enterprise's cash flow coverage
ratios have deteriorated over the past three years due to the
company's higher debt level and declining EBITDA margin. Great
Wall Enterprise's Debt/EBITDA margin increased to 3.5x in 2013
from 1.8x in 2011.
(Mil. NT$) 2013 2012 2011
Revenues 90,478.0 86,532.6 84,062.7
EBITDA 2,476.7 2,725.3 2,873.2
Funds from operations (FFO) 2,034.4 2,298.5 2,512.5
Net income from continuing operations 2,256.7 1,129.6 1,774.2
Cash flow from operations 4,775.5 2,042.8 1,310.7
Capital expenditures 3,506.2 2,741.0 1,798.2
Free operating cash flow 1,269.3 (698.2) (487.5)
Discretionary cash flow 638.4 (1,281.8) (1,081.1)
Cash and short-term investments 1,072.6 974.4 1,024.8
Debt 8,719.6 8,794.4 5,078.2
Equity 18,788.3 16,916.0 16,597.3
Adjusted rat ios
EBITDA margin (%) 2.7 3.1 3.4
Return on capital (%) 10.9 7.1 10.3
EBITDA interest coverage (x) 8.3 9.1 17.7
FFO cash interest coverage (x) 11.3 28.3 16.4
Debt/EBITDA (x) 3.5 3.2 1.8
FFO/debt (%) 23.3 26.1 49.5
Cash flow from operations/debt (%) 54.8 23.2 25.8
Free operating cash flow/debt (%) 14.6 (7.9) (9.6)
Discretionary cash flow/debt (%) 7.3 (14.6) (21.3)
NT$--New Taiwan dollar. Note: Data are fully adjusted.
Great Wall Enterprise Co. Ltd. -- Financia l Summary
--Fiscal year ended Dec. 31--
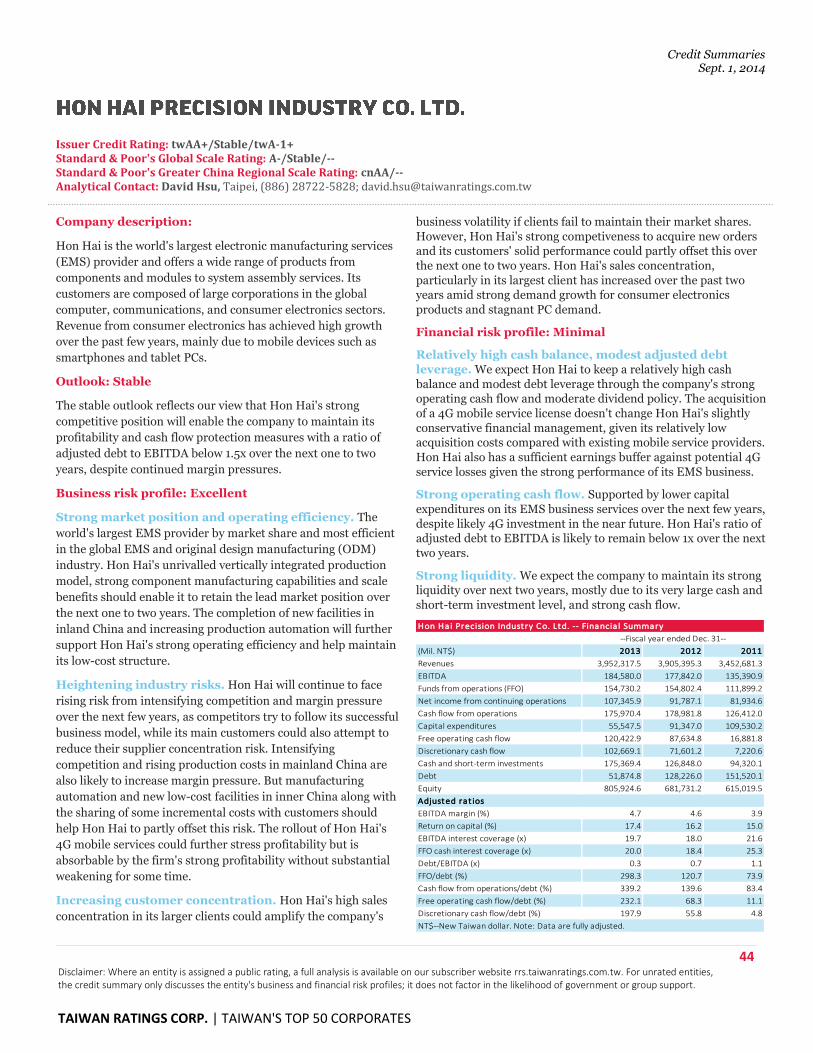
Credit Summaries Sept. 1, 2014
44 Disclaimer: Where an entity is assigned a public rating, a full analysis is available on our subscriber website rrs.taiwanratings.com.tw. For unrated entities, the credit summary only discusses the entity's business and financial risk profiles; it does not factor in the likelihood of government or group support.
TAIWAN RATINGS CORP. | TAIWAN'S TOP 50 CORPORATES
Issuer Credit Rating: twAA+/Stable/twA-1+ Standard & Poor's Global Scale Rating: A-/Stable/-- Standard & Poor's Greater China Regional Scale Rating: cnAA/-- Analytical Contact: David Hsu, Taipei, (886) 28722-5828; [email protected]
Company description:
Hon Hai is the world's largest electronic manufacturing services
(EMS) provider and offers a wide range of products from
components and modules to system assembly services. Its
customers are composed of large corporations in the global
computer, communications, and consumer electronics sectors.
Revenue from consumer electronics has achieved high growth
over the past few years, mainly due to mobile devices such as
smartphones and tablet PCs.
Outlook: Stable
The stable outlook reflects our view that Hon Hai's strong
competitive position will enable the company to maintain its
profitability and cash flow protection measures with a ratio of
adjusted debt to EBITDA below 1.5x over the next one to two
years, despite continued margin pressures.
Business risk profile: Excellent
Strong market position and operating efficiency. The
world's largest EMS provider by market share and most efficient
in the global EMS and original design manufacturing (ODM)
industry. Hon Hai's unrivalled vertically integrated production
model, strong component manufacturing capabilities and scale
benefits should enable it to retain the lead market position over
the next one to two years. The completion of new facilities in
inland China and increasing production automation will further
support Hon Hai's strong operating efficiency and help maintain
its low-cost structure.
Heightening industry risks. Hon Hai will continue to face
rising risk from intensifying competition and margin pressure
over the next few years, as competitors try to follow its successful
business model, while its main customers could also attempt to
reduce their supplier concentration risk. Intensifying
competition and rising production costs in mainland China are
also likely to increase margin pressure. But manufacturing
automation and new low-cost facilities in inner China along with
the sharing of some incremental costs with customers should
help Hon Hai to partly offset this risk. The rollout of Hon Hai's
4G mobile services could further stress profitability but is
absorbable by the firm's strong profitability without substantial
weakening for some time.
Increasing customer concentration. Hon Hai's high sales
concentration in its larger clients could amplify the company's
business volatility if clients fail to maintain their market shares.
However, Hon Hai's strong competiveness to acquire new orders and its customers' solid performance could partly offset this over
the next one to two years. Hon Hai's sales concentration,
particularly in its largest client has increased over the past two
years amid strong demand growth for consumer electronics
products and stagnant PC demand.
Financial risk profile: Minimal
Relatively high cash balance, modest adjusted debt
leverage. We expect Hon Hai to keep a relatively high cash
balance and modest debt leverage through the company's strong operating cash flow and moderate dividend policy. The acquisition
of a 4G mobile service license doesn't change Hon Hai's slightly
conservative financial management, given its relatively low acquisition costs compared with existing mobile service providers.
Hon Hai also has a sufficient earnings buffer against potential 4G
service losses given the strong performance of its EMS business.
Strong operating cash flow. Supported by lower capital
expenditures on its EMS business services over the next few years,
despite likely 4G investment in the near future. Hon Hai's ratio of adjusted debt to EBITDA is likely to remain below 1x over the next
two years.
Strong liquidity. We expect the company to maintain its strong liquidity over next two years, mostly due to its very large cash and
short-term investment level, and strong cash flow.
(Mil. NT$) 2013 2012 2011
Revenues 3,952,317.5 3,905,395.3 3,452,681.3
EBITDA 184,580.0 177,842.0 135,390.9
Funds from operations (FFO) 154,730.2 154,802.4 111,899.2
Net income from continuing operations 107,345.9 91,787.1 81,934.6
Cash flow from operations 175,970.4 178,981.8 126,412.0
Capital expenditures 55,547.5 91,347.0 109,530.2
Free operating cash flow 120,422.9 87,634.8 16,881.8
Discretionary cash flow 102,669.1 71,601.2 7,220.6
Cash and short-term investments 175,369.4 126,848.0 94,320.1
Debt 51,874.8 128,226.0 151,520.1
Equity 805,924.6 681,731.2 615,019.5
Adjusted rat ios
EBITDA margin (%) 4.7 4.6 3.9
Return on capital (%) 17.4 16.2 15.0
EBITDA interest coverage (x) 19.7 18.0 21.6
FFO cash interest coverage (x) 20.0 18.4 25.3
Debt/EBITDA (x) 0.3 0.7 1.1
FFO/debt (%) 298.3 120.7 73.9
Cash flow from operations/debt (%) 339.2 139.6 83.4
Free operating cash flow/debt (%) 232.1 68.3 11.1
Discretionary cash flow/debt (%) 197.9 55.8 4.8
NT$--New Taiwan dollar. Note: Data are fully adjusted.
Hon Hai Precision Industry Co. Ltd. -- Financia l Summary
--Fiscal year ended Dec. 31--
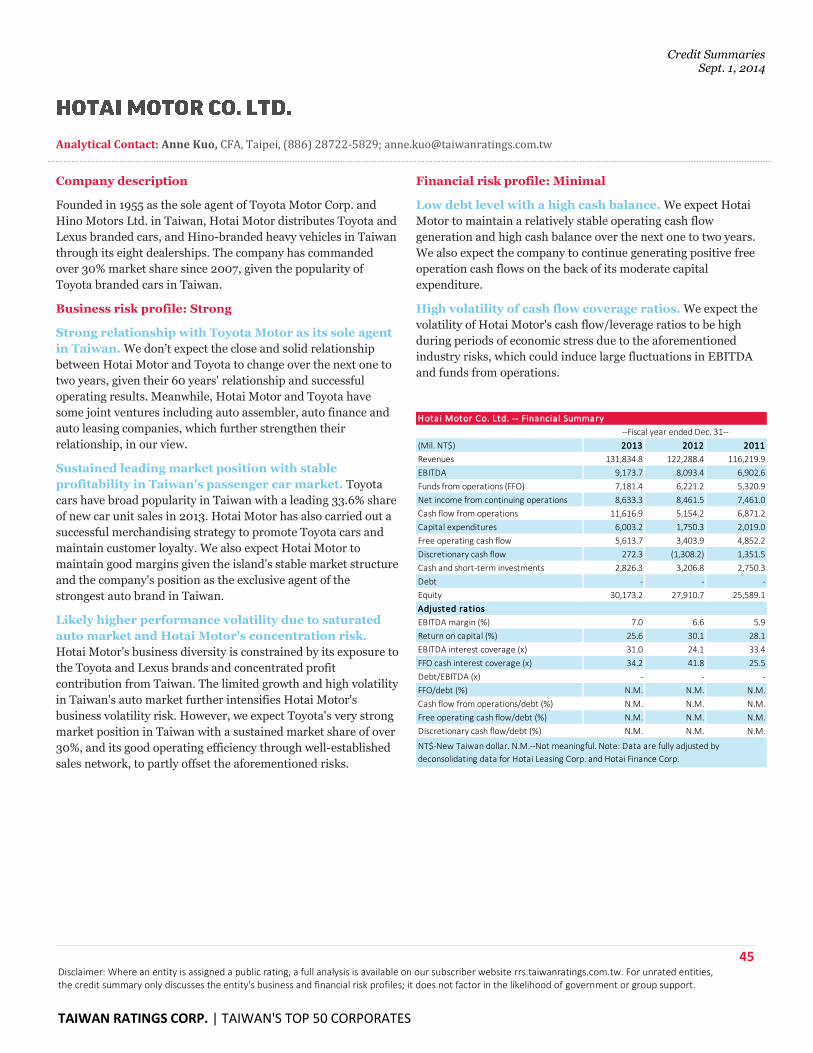
Credit Summaries Sept. 1, 2014
45 Disclaimer: Where an entity is assigned a public rating, a full analysis is available on our subscriber website rrs.taiwanratings.com.tw. For unrated entities, the credit summary only discusses the entity's business and financial risk profiles; it does not factor in the likelihood of government or group support.
TAIWAN RATINGS CORP. | TAIWAN'S TOP 50 CORPORATES
Analytical Contact: Anne Kuo, CFA, Taipei, (886) 28722-5829; [email protected]
Company description
Founded in 1955 as the sole agent of Toyota Motor Corp. and
Hino Motors Ltd. in Taiwan, Hotai Motor distributes Toyota and
Lexus branded cars, and Hino-branded heavy vehicles in Taiwan
through its eight dealerships. The company has commanded
over 30% market share since 2007, given the popularity of
Toyota branded cars in Taiwan.
Business risk profile: Strong
Strong relationship with Toyota Motor as its sole agent
in Taiwan. We don’t expect the close and solid relationship
between Hotai Motor and Toyota to change over the next one to
two years, given their 60 years' relationship and successful
operating results. Meanwhile, Hotai Motor and Toyota have
some joint ventures including auto assembler, auto finance and
auto leasing companies, which further strengthen their
relationship, in our view.
Sustained leading market position with stable
profitability in Taiwan's passenger car market. Toyota
cars have broad popularity in Taiwan with a leading 33.6% share
of new car unit sales in 2013. Hotai Motor has also carried out a
successful merchandising strategy to promote Toyota cars and
maintain customer loyalty. We also expect Hotai Motor to
maintain good margins given the island's stable market structure
and the company's position as the exclusive agent of the
strongest auto brand in Taiwan.
Likely higher performance volatility due to saturated
auto market and Hotai Motor's concentration risk.
Hotai Motor's business diversity is constrained by its exposure to
the Toyota and Lexus brands and concentrated profit
contribution from Taiwan. The limited growth and high volatility
in Taiwan's auto market further intensifies Hotai Motor's
business volatility risk. However, we expect Toyota's very strong
market position in Taiwan with a sustained market share of over
30%, and its good operating efficiency through well-established
sales network, to partly offset the aforementioned risks.
Financial risk profile: Minimal
Low debt level with a high cash balance. We expect Hotai
Motor to maintain a relatively stable operating cash flow
generation and high cash balance over the next one to two years.
We also expect the company to continue generating positive free
operation cash flows on the back of its moderate capital
expenditure.
High volatility of cash flow coverage ratios. We expect the
volatility of Hotai Motor's cash flow/leverage ratios to be high
during periods of economic stress due to the aforementioned
industry risks, which could induce large fluctuations in EBITDA
and funds from operations.
(Mil. NT$) 2013 2012 2011
Revenues 131,834.8 122,288.4 116,219.9
EBITDA 9,173.7 8,093.4 6,902.6
Funds from operations (FFO) 7,181.4 6,221.2 5,320.9
Net income from continuing operations 8,633.3 8,461.5 7,461.0
Cash flow from operations 11,616.9 5,154.2 6,871.2
Capital expenditures 6,003.2 1,750.3 2,019.0
Free operating cash flow 5,613.7 3,403.9 4,852.2
Discretionary cash flow 272.3 (1,308.2) 1,351.5
Cash and short-term investments 2,826.3 3,206.8 2,750.3
Debt - - -
Equity 30,173.2 27,910.7 25,589.1
Adjusted rat ios
EBITDA margin (%) 7.0 6.6 5.9
Return on capital (%) 25.6 30.1 28.1
EBITDA interest coverage (x) 31.0 24.1 33.4
FFO cash interest coverage (x) 34.2 41.8 25.5
Debt/EBITDA (x) - - -
FFO/debt (%) N.M. N.M. N.M.
Cash flow from operations/debt (%) N.M. N.M. N.M.
Free operating cash flow/debt (%) N.M. N.M. N.M.
Discretionary cash flow/debt (%) N.M. N.M. N.M.
Hotai Motor Co. Ltd. -- Financia l Summary
--Fiscal year ended Dec. 31--
NT$-New Taiwan dollar. N.M.--Not meaningful. Note: Data are fully adjusted by
deconsolidating data for Hotai Leasing Corp. and Hotai Finance Corp.
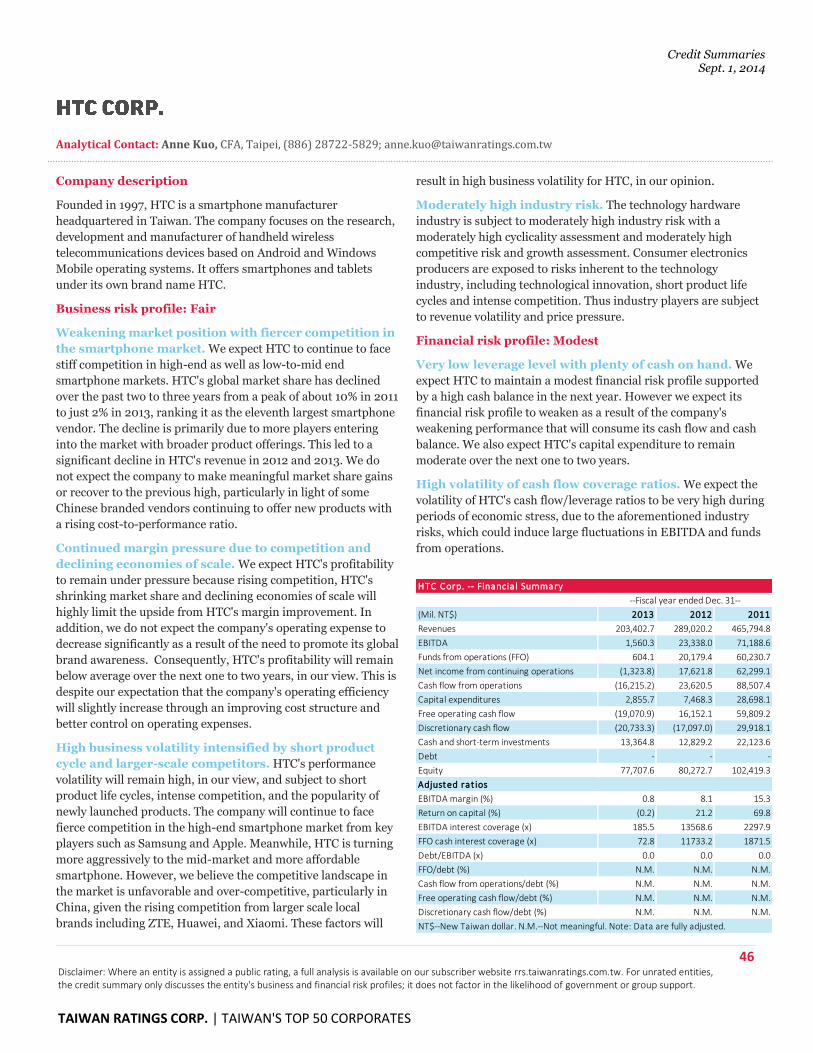
Credit Summaries Sept. 1, 2014
46 Disclaimer: Where an entity is assigned a public rating, a full analysis is available on our subscriber website rrs.taiwanratings.com.tw. For unrated entities, the credit summary only discusses the entity's business and financial risk profiles; it does not factor in the likelihood of government or group support.
TAIWAN RATINGS CORP. | TAIWAN'S TOP 50 CORPORATES
Analytical Contact: Anne Kuo, CFA, Taipei, (886) 28722-5829; [email protected]
Company description
Founded in 1997, HTC is a smartphone manufacturer
headquartered in Taiwan. The company focuses on the research,
development and manufacturer of handheld wireless
telecommunications devices based on Android and Windows
Mobile operating systems. It offers smartphones and tablets
under its own brand name HTC.
Business risk profile: Fair
Weakening market position with fiercer competition in
the smartphone market. We expect HTC to continue to face
stiff competition in high-end as well as low-to-mid end
smartphone markets. HTC's global market share has declined
over the past two to three years from a peak of about 10% in 2011
to just 2% in 2013, ranking it as the eleventh largest smartphone
vendor. The decline is primarily due to more players entering
into the market with broader product offerings. This led to a
significant decline in HTC's revenue in 2012 and 2013. We do
not expect the company to make meaningful market share gains
or recover to the previous high, particularly in light of some
Chinese branded vendors continuing to offer new products with
a rising cost-to-performance ratio.
Continued margin pressure due to competition and
declining economies of scale. We expect HTC's profitability
to remain under pressure because rising competition, HTC's
shrinking market share and declining economies of scale will
highly limit the upside from HTC's margin improvement. In
addition, we do not expect the company's operating expense to
decrease significantly as a result of the need to promote its global
brand awareness. Consequently, HTC's profitability will remain
below average over the next one to two years, in our view. This is
despite our expectation that the company's operating efficiency
will slightly increase through an improving cost structure and
better control on operating expenses.
High business volatility intensified by short product
cycle and larger-scale competitors. HTC's performance
volatility will remain high, in our view, and subject to short
product life cycles, intense competition, and the popularity of
newly launched products. The company will continue to face
fierce competition in the high-end smartphone market from key
players such as Samsung and Apple. Meanwhile, HTC is turning
more aggressively to the mid-market and more affordable
smartphone. However, we believe the competitive landscape in
the market is unfavorable and over-competitive, particularly in
China, given the rising competition from larger scale local
brands including ZTE, Huawei, and Xiaomi. These factors will
result in high business volatility for HTC, in our opinion.
Moderately high industry risk. The technology hardware
industry is subject to moderately high industry risk with a
moderately high cyclicality assessment and moderately high
competitive risk and growth assessment. Consumer electronics
producers are exposed to risks inherent to the technology
industry, including technological innovation, short product life
cycles and intense competition. Thus industry players are subject
to revenue volatility and price pressure.
Financial risk profile: Modest
Very low leverage level with plenty of cash on hand. We
expect HTC to maintain a modest financial risk profile supported
by a high cash balance in the next year. However we expect its
financial risk profile to weaken as a result of the company's
weakening performance that will consume its cash flow and cash
balance. We also expect HTC's capital expenditure to remain
moderate over the next one to two years.
High volatility of cash flow coverage ratios. We expect the
volatility of HTC's cash flow/leverage ratios to be very high during
periods of economic stress, due to the aforementioned industry
risks, which could induce large fluctuations in EBITDA and funds
from operations.
(Mil. NT$) 2013 2012 2011
Revenues 203,402.7 289,020.2 465,794.8
EBITDA 1,560.3 23,338.0 71,188.6
Funds from operations (FFO) 604.1 20,179.4 60,230.7
Net income from continuing operations (1,323.8) 17,621.8 62,299.1
Cash flow from operations (16,215.2) 23,620.5 88,507.4
Capital expenditures 2,855.7 7,468.3 28,698.1
Free operating cash flow (19,070.9) 16,152.1 59,809.2
Discretionary cash flow (20,733.3) (17,097.0) 29,918.1
Cash and short-term investments 13,364.8 12,829.2 22,123.6
Debt - - -
Equity 77,707.6 80,272.7 102,419.3
Adjusted rat ios
EBITDA margin (%) 0.8 8.1 15.3
Return on capital (%) (0.2) 21.2 69.8
EBITDA interest coverage (x) 185.5 13568.6 2297.9
FFO cash interest coverage (x) 72.8 11733.2 1871.5
Debt/EBITDA (x) 0.0 0.0 0.0
FFO/debt (%) N.M. N.M. N.M.
Cash flow from operations/debt (%) N.M. N.M. N.M.
Free operating cash flow/debt (%) N.M. N.M. N.M.
Discretionary cash flow/debt (%) N.M. N.M. N.M.
NT$--New Taiwan dollar. N.M.--Not meaningful. Note: Data are fully adjusted.
HTC Corp. -- Financia l Summary
--Fiscal year ended Dec. 31--
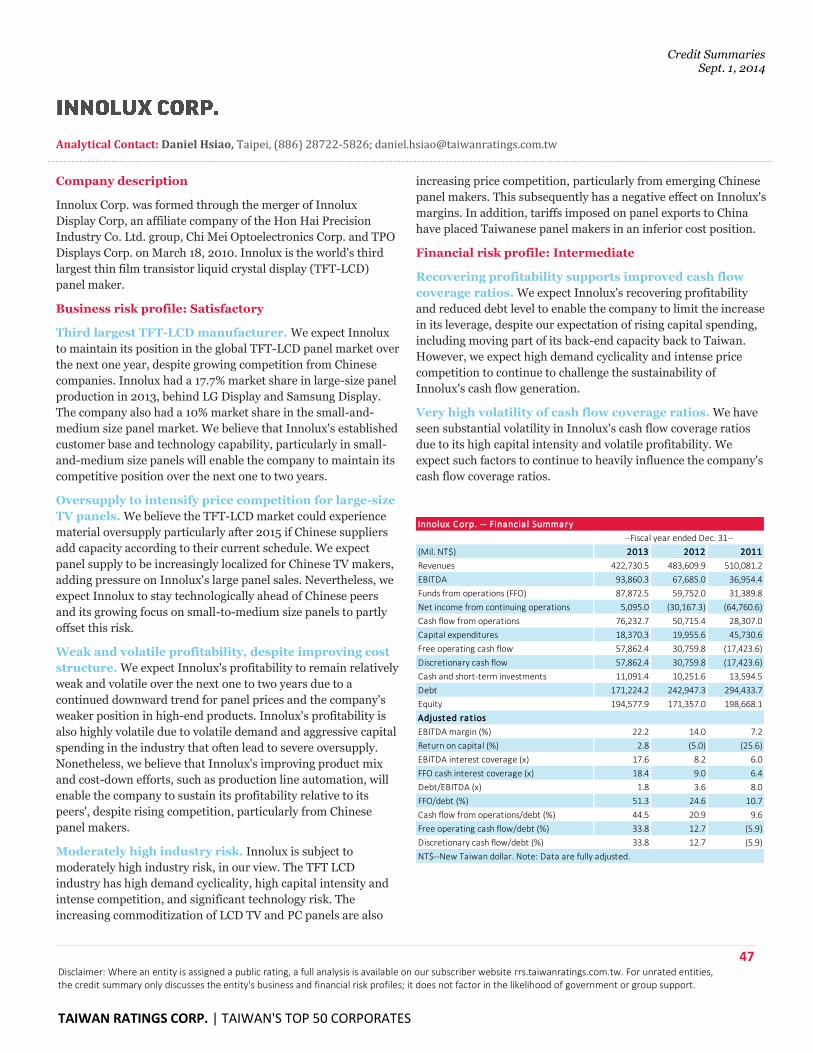
Credit Summaries Sept. 1, 2014
47 Disclaimer: Where an entity is assigned a public rating, a full analysis is available on our subscriber website rrs.taiwanratings.com.tw. For unrated entities, the credit summary only discusses the entity's business and financial risk profiles; it does not factor in the likelihood of government or group support.
TAIWAN RATINGS CORP. | TAIWAN'S TOP 50 CORPORATES
Analytical Contact: Daniel Hsiao, Taipei, (886) 28722-5826; [email protected]
Company description
Innolux Corp. was formed through the merger of Innolux
Display Corp, an affiliate company of the Hon Hai Precision
Industry Co. Ltd. group, Chi Mei Optoelectronics Corp. and TPO
Displays Corp. on March 18, 2010. Innolux is the world's third
largest thin film transistor liquid crystal display (TFT-LCD)
panel maker.
Business risk profile: Satisfactory
Third largest TFT-LCD manufacturer. We expect Innolux
to maintain its position in the global TFT-LCD panel market over
the next one year, despite growing competition from Chinese
companies. Innolux had a 17.7% market share in large-size panel
production in 2013, behind LG Display and Samsung Display.
The company also had a 10% market share in the small-and-
medium size panel market. We believe that Innolux's established
customer base and technology capability, particularly in small-
and-medium size panels will enable the company to maintain its
competitive position over the next one to two years.
Oversupply to intensify price competition for large-size
TV panels. We believe the TFT-LCD market could experience
material oversupply particularly after 2015 if Chinese suppliers
add capacity according to their current schedule. We expect
panel supply to be increasingly localized for Chinese TV makers,
adding pressure on Innolux's large panel sales. Nevertheless, we
expect Innolux to stay technologically ahead of Chinese peers
and its growing focus on small-to-medium size panels to partly
offset this risk.
Weak and volatile profitability, despite improving cost
structure. We expect Innolux's profitability to remain relatively
weak and volatile over the next one to two years due to a
continued downward trend for panel prices and the company's
weaker position in high-end products. Innolux's profitability is
also highly volatile due to volatile demand and aggressive capital
spending in the industry that often lead to severe oversupply.
Nonetheless, we believe that Innolux's improving product mix
and cost-down efforts, such as production line automation, will
enable the company to sustain its profitability relative to its
peers', despite rising competition, particularly from Chinese
panel makers.
Moderately high industry risk. Innolux is subject to
moderately high industry risk, in our view. The TFT LCD
industry has high demand cyclicality, high capital intensity and
intense competition, and significant technology risk. The
increasing commoditization of LCD TV and PC panels are also
increasing price competition, particularly from emerging Chinese
panel makers. This subsequently has a negative effect on Innolux's
margins. In addition, tariffs imposed on panel exports to China
have placed Taiwanese panel makers in an inferior cost position.
Financial risk profile: Intermediate
Recovering profitability supports improved cash flow
coverage ratios. We expect Innolux's recovering profitability
and reduced debt level to enable the company to limit the increase
in its leverage, despite our expectation of rising capital spending,
including moving part of its back-end capacity back to Taiwan.
However, we expect high demand cyclicality and intense price
competition to continue to challenge the sustainability of
Innolux's cash flow generation.
Very high volatility of cash flow coverage ratios. We have
seen substantial volatility in Innolux's cash flow coverage ratios
due to its high capital intensity and volatile profitability. We
expect such factors to continue to heavily influence the company's
cash flow coverage ratios.
(Mil. NT$) 2013 2012 2011
Revenues 422,730.5 483,609.9 510,081.2
EBITDA 93,860.3 67,685.0 36,954.4
Funds from operations (FFO) 87,872.5 59,752.0 31,389.8
Net income from continuing operations 5,095.0 (30,167.3) (64,760.6)
Cash flow from operations 76,232.7 50,715.4 28,307.0
Capital expenditures 18,370.3 19,955.6 45,730.6
Free operating cash flow 57,862.4 30,759.8 (17,423.6)
Discretionary cash flow 57,862.4 30,759.8 (17,423.6)
Cash and short-term investments 11,091.4 10,251.6 13,594.5
Debt 171,224.2 242,947.3 294,433.7
Equity 194,577.9 171,357.0 198,668.1
Adjusted rat ios
EBITDA margin (%) 22.2 14.0 7.2
Return on capital (%) 2.8 (5.0) (25.6)
EBITDA interest coverage (x) 17.6 8.2 6.0
FFO cash interest coverage (x) 18.4 9.0 6.4
Debt/EBITDA (x) 1.8 3.6 8.0
FFO/debt (%) 51.3 24.6 10.7
Cash flow from operations/debt (%) 44.5 20.9 9.6
Free operating cash flow/debt (%) 33.8 12.7 (5.9)
Discretionary cash flow/debt (%) 33.8 12.7 (5.9)
NT$--New Taiwan dollar. Note: Data are fully adjusted.
Innolux Corp. -- Financia l Summary
--Fiscal year ended Dec. 31--
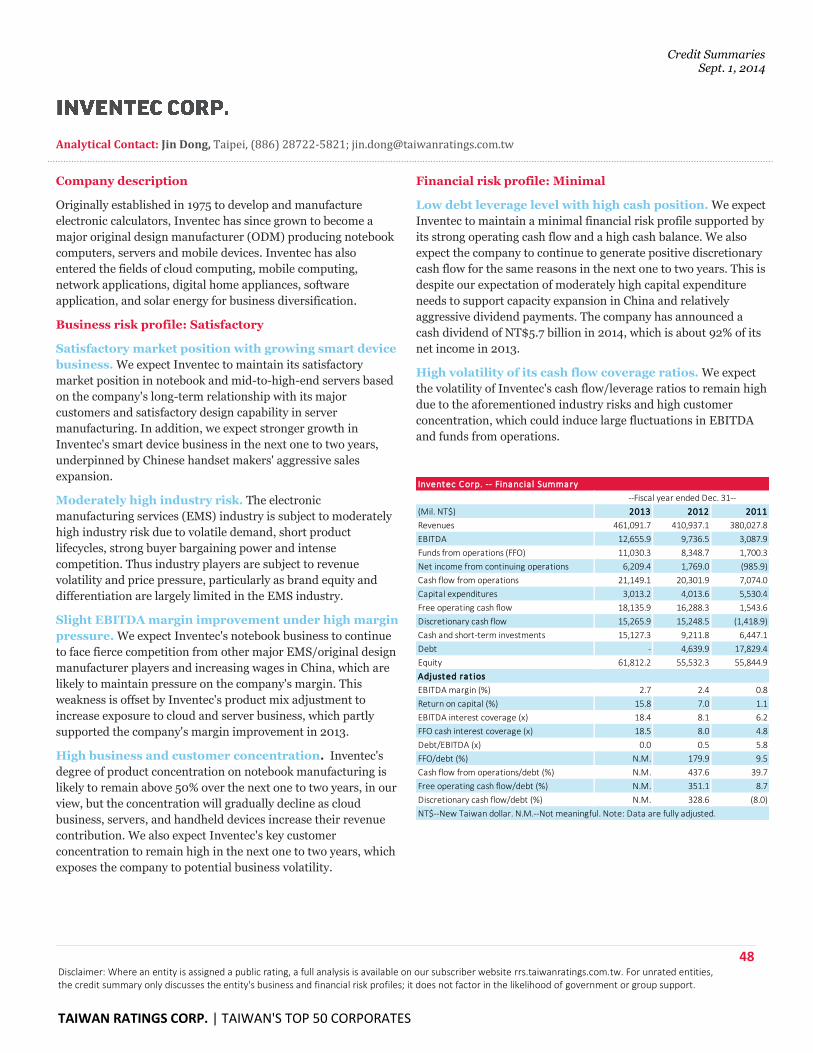
Credit Summaries Sept. 1, 2014
48 Disclaimer: Where an entity is assigned a public rating, a full analysis is available on our subscriber website rrs.taiwanratings.com.tw. For unrated entities, the credit summary only discusses the entity's business and financial risk profiles; it does not factor in the likelihood of government or group support.
TAIWAN RATINGS CORP. | TAIWAN'S TOP 50 CORPORATES
Analytical Contact: Jin Dong, Taipei, (886) 28722-5821; [email protected]
Company description
Originally established in 1975 to develop and manufacture
electronic calculators, Inventec has since grown to become a
major original design manufacturer (ODM) producing notebook
computers, servers and mobile devices. Inventec has also
entered the fields of cloud computing, mobile computing,
network applications, digital home appliances, software
application, and solar energy for business diversification.
Business risk profile: Satisfactory
Satisfactory market position with growing smart device
business. We expect Inventec to maintain its satisfactory
market position in notebook and mid-to-high-end servers based
on the company's long-term relationship with its major
customers and satisfactory design capability in server
manufacturing. In addition, we expect stronger growth in
Inventec's smart device business in the next one to two years,
underpinned by Chinese handset makers' aggressive sales
expansion.
Moderately high industry risk. The electronic
manufacturing services (EMS) industry is subject to moderately
high industry risk due to volatile demand, short product
lifecycles, strong buyer bargaining power and intense
competition. Thus industry players are subject to revenue
volatility and price pressure, particularly as brand equity and
differentiation are largely limited in the EMS industry.
Slight EBITDA margin improvement under high margin
pressure. We expect Inventec's notebook business to continue
to face fierce competition from other major EMS/original design
manufacturer players and increasing wages in China, which are
likely to maintain pressure on the company's margin. This
weakness is offset by Inventec's product mix adjustment to
increase exposure to cloud and server business, which partly
supported the company's margin improvement in 2013.
High business and customer concentration. Inventec's
degree of product concentration on notebook manufacturing is
likely to remain above 50% over the next one to two years, in our
view, but the concentration will gradually decline as cloud
business, servers, and handheld devices increase their revenue
contribution. We also expect Inventec's key customer
concentration to remain high in the next one to two years, which
exposes the company to potential business volatility.
Financial risk profile: Minimal
Low debt leverage level with high cash position. We expect
Inventec to maintain a minimal financial risk profile supported by
its strong operating cash flow and a high cash balance. We also
expect the company to continue to generate positive discretionary
cash flow for the same reasons in the next one to two years. This is
despite our expectation of moderately high capital expenditure
needs to support capacity expansion in China and relatively
aggressive dividend payments. The company has announced a
cash dividend of NT$5.7 billion in 2014, which is about 92% of its
net income in 2013.
High volatility of its cash flow coverage ratios. We expect
the volatility of Inventec's cash flow/leverage ratios to remain high
due to the aforementioned industry risks and high customer
concentration, which could induce large fluctuations in EBITDA
and funds from operations.
(Mil. NT$) 2013 2012 2011
Revenues 461,091.7 410,937.1 380,027.8
EBITDA 12,655.9 9,736.5 3,087.9
Funds from operations (FFO) 11,030.3 8,348.7 1,700.3
Net income from continuing operations 6,209.4 1,769.0 (985.9)
Cash flow from operations 21,149.1 20,301.9 7,074.0
Capital expenditures 3,013.2 4,013.6 5,530.4
Free operating cash flow 18,135.9 16,288.3 1,543.6
Discretionary cash flow 15,265.9 15,248.5 (1,418.9)
Cash and short-term investments 15,127.3 9,211.8 6,447.1
Debt - 4,639.9 17,829.4
Equity 61,812.2 55,532.3 55,844.9
Adjusted rat ios
EBITDA margin (%) 2.7 2.4 0.8
Return on capital (%) 15.8 7.0 1.1
EBITDA interest coverage (x) 18.4 8.1 6.2
FFO cash interest coverage (x) 18.5 8.0 4.8
Debt/EBITDA (x) 0.0 0.5 5.8
FFO/debt (%) N.M. 179.9 9.5
Cash flow from operations/debt (%) N.M. 437.6 39.7
Free operating cash flow/debt (%) N.M. 351.1 8.7
Discretionary cash flow/debt (%) N.M. 328.6 (8.0)
NT$--New Taiwan dollar. N.M.--Not meaningful. Note: Data are fully adjusted.
Inventec Corp. -- Financia l Summary
--Fiscal year ended Dec. 31--
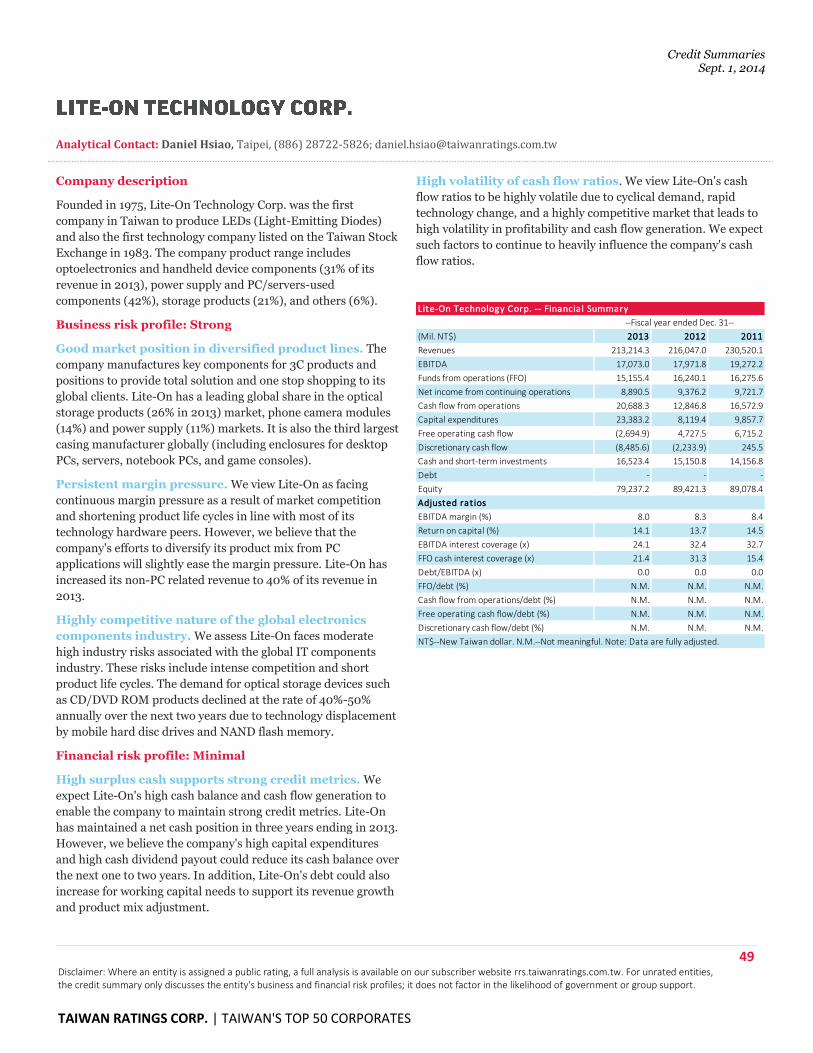
Credit Summaries Sept. 1, 2014
49 Disclaimer: Where an entity is assigned a public rating, a full analysis is available on our subscriber website rrs.taiwanratings.com.tw. For unrated entities, the credit summary only discusses the entity's business and financial risk profiles; it does not factor in the likelihood of government or group support.
TAIWAN RATINGS CORP. | TAIWAN'S TOP 50 CORPORATES
Analytical Contact: Daniel Hsiao, Taipei, (886) 28722-5826; [email protected]
Company description
Founded in 1975, Lite-On Technology Corp. was the first
company in Taiwan to produce LEDs (Light-Emitting Diodes)
and also the first technology company listed on the Taiwan Stock
Exchange in 1983. The company product range includes
optoelectronics and handheld device components (31% of its
revenue in 2013), power supply and PC/servers-used
components (42%), storage products (21%), and others (6%).
Business risk profile: Strong
Good market position in diversified product lines. The
company manufactures key components for 3C products and
positions to provide total solution and one stop shopping to its
global clients. Lite-On has a leading global share in the optical
storage products (26% in 2013) market, phone camera modules
(14%) and power supply (11%) markets. It is also the third largest
casing manufacturer globally (including enclosures for desktop
PCs, servers, notebook PCs, and game consoles).
Persistent margin pressure. We view Lite-On as facing
continuous margin pressure as a result of market competition
and shortening product life cycles in line with most of its
technology hardware peers. However, we believe that the
company's efforts to diversify its product mix from PC
applications will slightly ease the margin pressure. Lite-On has
increased its non-PC related revenue to 40% of its revenue in
2013.
Highly competitive nature of the global electronics
components industry. We assess Lite-On faces moderate
high industry risks associated with the global IT components
industry. These risks include intense competition and short
product life cycles. The demand for optical storage devices such
as CD/DVD ROM products declined at the rate of 40%-50%
annually over the next two years due to technology displacement
by mobile hard disc drives and NAND flash memory.
Financial risk profile: Minimal
High surplus cash supports strong credit metrics. We
expect Lite-On's high cash balance and cash flow generation to
enable the company to maintain strong credit metrics. Lite-On
has maintained a net cash position in three years ending in 2013.
However, we believe the company's high capital expenditures
and high cash dividend payout could reduce its cash balance over
the next one to two years. In addition, Lite-On's debt could also
increase for working capital needs to support its revenue growth
and product mix adjustment.
High volatility of cash flow ratios. We view Lite-On's cash
flow ratios to be highly volatile due to cyclical demand, rapid
technology change, and a highly competitive market that leads to
high volatility in profitability and cash flow generation. We expect
such factors to continue to heavily influence the company's cash
flow ratios.
(Mil. NT$) 2013 2012 2011
Revenues 213,214.3 216,047.0 230,520.1
EBITDA 17,073.0 17,971.8 19,272.2
Funds from operations (FFO) 15,155.4 16,240.1 16,275.6
Net income from continuing operations 8,890.5 9,376.2 9,721.7
Cash flow from operations 20,688.3 12,846.8 16,572.9
Capital expenditures 23,383.2 8,119.4 9,857.7
Free operating cash flow (2,694.9) 4,727.5 6,715.2
Discretionary cash flow (8,485.6) (2,233.9) 245.5
Cash and short-term investments 16,523.4 15,150.8 14,156.8
Debt - - -
Equity 79,237.2 89,421.3 89,078.4
Adjusted rat ios
EBITDA margin (%) 8.0 8.3 8.4
Return on capital (%) 14.1 13.7 14.5
EBITDA interest coverage (x) 24.1 32.4 32.7
FFO cash interest coverage (x) 21.4 31.3 15.4
Debt/EBITDA (x) 0.0 0.0 0.0
FFO/debt (%) N.M. N.M. N.M.
Cash flow from operations/debt (%) N.M. N.M. N.M.
Free operating cash flow/debt (%) N.M. N.M. N.M.
Discretionary cash flow/debt (%) N.M. N.M. N.M.
NT$--New Taiwan dollar. N.M.--Not meaningful. Note: Data are fully adjusted.
Lite-On Technology Corp. -- Financia l Summary
--Fiscal year ended Dec. 31--
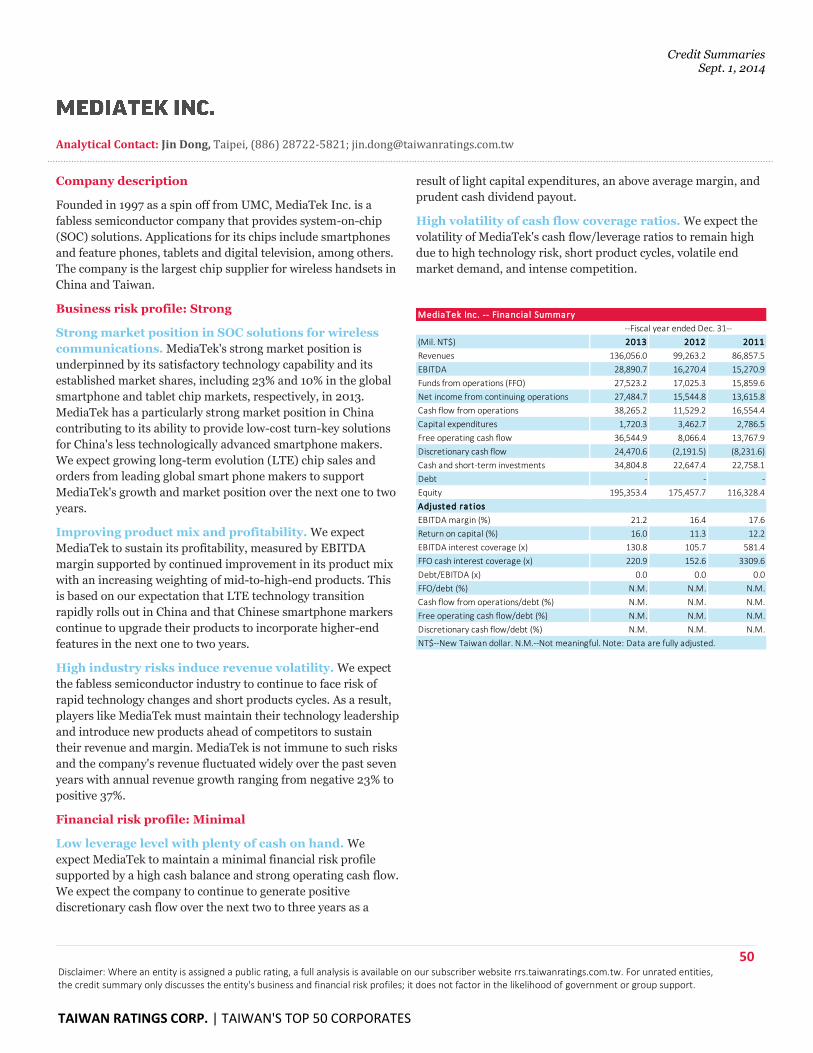
Credit Summaries Sept. 1, 2014
50 Disclaimer: Where an entity is assigned a public rating, a full analysis is available on our subscriber website rrs.taiwanratings.com.tw. For unrated entities, the credit summary only discusses the entity's business and financial risk profiles; it does not factor in the likelihood of government or group support.
TAIWAN RATINGS CORP. | TAIWAN'S TOP 50 CORPORATES
Analytical Contact: Jin Dong, Taipei, (886) 28722-5821; [email protected]
Company description
Founded in 1997 as a spin off from UMC, MediaTek Inc. is a
fabless semiconductor company that provides system-on-chip
(SOC) solutions. Applications for its chips include smartphones
and feature phones, tablets and digital television, among others.
The company is the largest chip supplier for wireless handsets in
China and Taiwan.
Business risk profile: Strong
Strong market position in SOC solutions for wireless
communications. MediaTek's strong market position is
underpinned by its satisfactory technology capability and its
established market shares, including 23% and 10% in the global
smartphone and tablet chip markets, respectively, in 2013.
MediaTek has a particularly strong market position in China
contributing to its ability to provide low-cost turn-key solutions
for China's less technologically advanced smartphone makers.
We expect growing long-term evolution (LTE) chip sales and
orders from leading global smart phone makers to support
MediaTek's growth and market position over the next one to two
years.
Improving product mix and profitability. We expect
MediaTek to sustain its profitability, measured by EBITDA
margin supported by continued improvement in its product mix
with an increasing weighting of mid-to-high-end products. This
is based on our expectation that LTE technology transition
rapidly rolls out in China and that Chinese smartphone markers
continue to upgrade their products to incorporate higher-end
features in the next one to two years.
High industry risks induce revenue volatility. We expect
the fabless semiconductor industry to continue to face risk of
rapid technology changes and short products cycles. As a result,
players like MediaTek must maintain their technology leadership
and introduce new products ahead of competitors to sustain
their revenue and margin. MediaTek is not immune to such risks
and the company's revenue fluctuated widely over the past seven
years with annual revenue growth ranging from negative 23% to
positive 37%.
Financial risk profile: Minimal
Low leverage level with plenty of cash on hand. We
expect MediaTek to maintain a minimal financial risk profile
supported by a high cash balance and strong operating cash flow.
We expect the company to continue to generate positive
discretionary cash flow over the next two to three years as a
result of light capital expenditures, an above average margin, and
prudent cash dividend payout.
High volatility of cash flow coverage ratios. We expect the
volatility of MediaTek's cash flow/leverage ratios to remain high
due to high technology risk, short product cycles, volatile end
market demand, and intense competition.
(Mil. NT$) 2013 2012 2011
Revenues 136,056.0 99,263.2 86,857.5
EBITDA 28,890.7 16,270.4 15,270.9
Funds from operations (FFO) 27,523.2 17,025.3 15,859.6
Net income from continuing operations 27,484.7 15,544.8 13,615.8
Cash flow from operations 38,265.2 11,529.2 16,554.4
Capital expenditures 1,720.3 3,462.7 2,786.5
Free operating cash flow 36,544.9 8,066.4 13,767.9
Discretionary cash flow 24,470.6 (2,191.5) (8,231.6)
Cash and short-term investments 34,804.8 22,647.4 22,758.1
Debt - - -
Equity 195,353.4 175,457.7 116,328.4
Adjusted rat ios
EBITDA margin (%) 21.2 16.4 17.6
Return on capital (%) 16.0 11.3 12.2
EBITDA interest coverage (x) 130.8 105.7 581.4
FFO cash interest coverage (x) 220.9 152.6 3309.6
Debt/EBITDA (x) 0.0 0.0 0.0
FFO/debt (%) N.M. N.M. N.M.
Cash flow from operations/debt (%) N.M. N.M. N.M.
Free operating cash flow/debt (%) N.M. N.M. N.M.
Discretionary cash flow/debt (%) N.M. N.M. N.M.
NT$--New Taiwan dollar. N.M.--Not meaningful. Note: Data are fully adjusted.
MediaTek Inc. -- Financia l Summary
--Fiscal year ended Dec. 31--
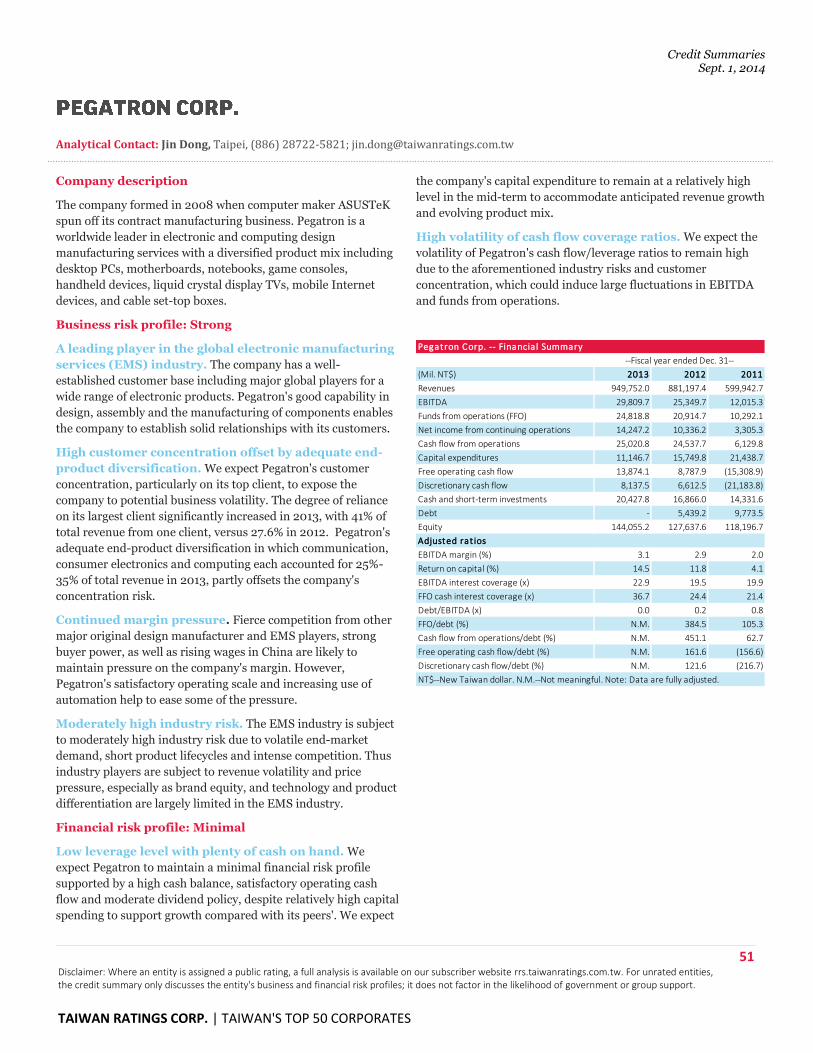
Credit Summaries Sept. 1, 2014
51 Disclaimer: Where an entity is assigned a public rating, a full analysis is available on our subscriber website rrs.taiwanratings.com.tw. For unrated entities, the credit summary only discusses the entity's business and financial risk profiles; it does not factor in the likelihood of government or group support.
TAIWAN RATINGS CORP. | TAIWAN'S TOP 50 CORPORATES
Analytical Contact: Jin Dong, Taipei, (886) 28722-5821; [email protected]
Company description
The company formed in 2008 when computer maker ASUSTeK
spun off its contract manufacturing business. Pegatron is a
worldwide leader in electronic and computing design
manufacturing services with a diversified product mix including
desktop PCs, motherboards, notebooks, game consoles,
handheld devices, liquid crystal display TVs, mobile Internet
devices, and cable set-top boxes.
Business risk profile: Strong
A leading player in the global electronic manufacturing
services (EMS) industry. The company has a well-
established customer base including major global players for a
wide range of electronic products. Pegatron's good capability in
design, assembly and the manufacturing of components enables
the company to establish solid relationships with its customers.
High customer concentration offset by adequate end-
product diversification. We expect Pegatron's customer
concentration, particularly on its top client, to expose the
company to potential business volatility. The degree of reliance
on its largest client significantly increased in 2013, with 41% of
total revenue from one client, versus 27.6% in 2012. Pegatron's
adequate end-product diversification in which communication,
consumer electronics and computing each accounted for 25%-
35% of total revenue in 2013, partly offsets the company's
concentration risk.
Continued margin pressure. Fierce competition from other
major original design manufacturer and EMS players, strong
buyer power, as well as rising wages in China are likely to
maintain pressure on the company's margin. However,
Pegatron's satisfactory operating scale and increasing use of
automation help to ease some of the pressure.
Moderately high industry risk. The EMS industry is subject
to moderately high industry risk due to volatile end-market
demand, short product lifecycles and intense competition. Thus
industry players are subject to revenue volatility and price
pressure, especially as brand equity, and technology and product
differentiation are largely limited in the EMS industry.
Financial risk profile: Minimal
Low leverage level with plenty of cash on hand. We
expect Pegatron to maintain a minimal financial risk profile
supported by a high cash balance, satisfactory operating cash
flow and moderate dividend policy, despite relatively high capital
spending to support growth compared with its peers'. We expect
the company's capital expenditure to remain at a relatively high
level in the mid-term to accommodate anticipated revenue growth
and evolving product mix.
High volatility of cash flow coverage ratios. We expect the
volatility of Pegatron's cash flow/leverage ratios to remain high
due to the aforementioned industry risks and customer
concentration, which could induce large fluctuations in EBITDA
and funds from operations.
(Mil. NT$) 2013 2012 2011
Revenues 949,752.0 881,197.4 599,942.7
EBITDA 29,809.7 25,349.7 12,015.3
Funds from operations (FFO) 24,818.8 20,914.7 10,292.1
Net income from continuing operations 14,247.2 10,336.2 3,305.3
Cash flow from operations 25,020.8 24,537.7 6,129.8
Capital expenditures 11,146.7 15,749.8 21,438.7
Free operating cash flow 13,874.1 8,787.9 (15,308.9)
Discretionary cash flow 8,137.5 6,612.5 (21,183.8)
Cash and short-term investments 20,427.8 16,866.0 14,331.6
Debt - 5,439.2 9,773.5
Equity 144,055.2 127,637.6 118,196.7
Adjusted rat ios
EBITDA margin (%) 3.1 2.9 2.0
Return on capital (%) 14.5 11.8 4.1
EBITDA interest coverage (x) 22.9 19.5 19.9
FFO cash interest coverage (x) 36.7 24.4 21.4
Debt/EBITDA (x) 0.0 0.2 0.8
FFO/debt (%) N.M. 384.5 105.3
Cash flow from operations/debt (%) N.M. 451.1 62.7
Free operating cash flow/debt (%) N.M. 161.6 (156.6)
Discretionary cash flow/debt (%) N.M. 121.6 (216.7)
NT$--New Taiwan dollar. N.M.--Not meaningful. Note: Data are fully adjusted.
--Fiscal year ended Dec. 31--
Pegatron Corp. -- Financia l Summary
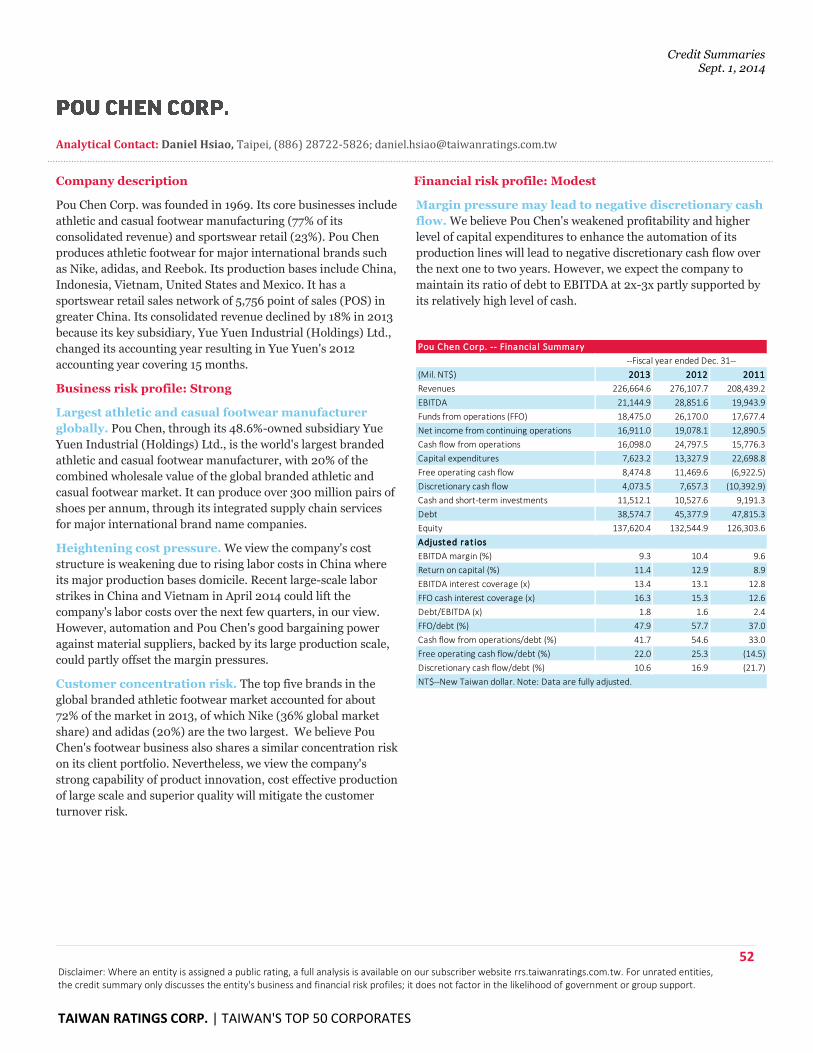
Credit Summaries Sept. 1, 2014
52 Disclaimer: Where an entity is assigned a public rating, a full analysis is available on our subscriber website rrs.taiwanratings.com.tw. For unrated entities, the credit summary only discusses the entity's business and financial risk profiles; it does not factor in the likelihood of government or group support.
TAIWAN RATINGS CORP. | TAIWAN'S TOP 50 CORPORATES
Analytical Contact: Daniel Hsiao, Taipei, (886) 28722-5826; [email protected]
Company description
Pou Chen Corp. was founded in 1969. Its core businesses include
athletic and casual footwear manufacturing (77% of its
consolidated revenue) and sportswear retail (23%). Pou Chen
produces athletic footwear for major international brands such
as Nike, adidas, and Reebok. Its production bases include China,
Indonesia, Vietnam, United States and Mexico. It has a
sportswear retail sales network of 5,756 point of sales (POS) in
greater China. Its consolidated revenue declined by 18% in 2013
because its key subsidiary, Yue Yuen Industrial (Holdings) Ltd.,
changed its accounting year resulting in Yue Yuen's 2012
accounting year covering 15 months.
Business risk profile: Strong
Largest athletic and casual footwear manufacturer
globally. Pou Chen, through its 48.6%-owned subsidiary Yue
Yuen Industrial (Holdings) Ltd., is the world's largest branded
athletic and casual footwear manufacturer, with 20% of the
combined wholesale value of the global branded athletic and
casual footwear market. It can produce over 300 million pairs of
shoes per annum, through its integrated supply chain services
for major international brand name companies.
Heightening cost pressure. We view the company's cost
structure is weakening due to rising labor costs in China where
its major production bases domicile. Recent large-scale labor
strikes in China and Vietnam in April 2014 could lift the
company's labor costs over the next few quarters, in our view.
However, automation and Pou Chen's good bargaining power
against material suppliers, backed by its large production scale,
could partly offset the margin pressures.
Customer concentration risk. The top five brands in the
global branded athletic footwear market accounted for about
72% of the market in 2013, of which Nike (36% global market
share) and adidas (20%) are the two largest. We believe Pou
Chen's footwear business also shares a similar concentration risk
on its client portfolio. Nevertheless, we view the company's
strong capability of product innovation, cost effective production
of large scale and superior quality will mitigate the customer
turnover risk.
Financial risk profile: Modest
Margin pressure may lead to negative discretionary cash
flow. We believe Pou Chen's weakened profitability and higher
level of capital expenditures to enhance the automation of its
production lines will lead to negative discretionary cash flow over
the next one to two years. However, we expect the company to
maintain its ratio of debt to EBITDA at 2x-3x partly supported by
its relatively high level of cash.
(Mil. NT$) 2013 2012 2011
Revenues 226,664.6 276,107.7 208,439.2
EBITDA 21,144.9 28,851.6 19,943.9
Funds from operations (FFO) 18,475.0 26,170.0 17,677.4
Net income from continuing operations 16,911.0 19,078.1 12,890.5
Cash flow from operations 16,098.0 24,797.5 15,776.3
Capital expenditures 7,623.2 13,327.9 22,698.8
Free operating cash flow 8,474.8 11,469.6 (6,922.5)
Discretionary cash flow 4,073.5 7,657.3 (10,392.9)
Cash and short-term investments 11,512.1 10,527.6 9,191.3
Debt 38,574.7 45,377.9 47,815.3
Equity 137,620.4 132,544.9 126,303.6
Adjusted rat ios
EBITDA margin (%) 9.3 10.4 9.6
Return on capital (%) 11.4 12.9 8.9
EBITDA interest coverage (x) 13.4 13.1 12.8
FFO cash interest coverage (x) 16.3 15.3 12.6
Debt/EBITDA (x) 1.8 1.6 2.4
FFO/debt (%) 47.9 57.7 37.0
Cash flow from operations/debt (%) 41.7 54.6 33.0
Free operating cash flow/debt (%) 22.0 25.3 (14.5)
Discretionary cash flow/debt (%) 10.6 16.9 (21.7)
NT$--New Taiwan dollar. Note: Data are fully adjusted.
Pou Chen Corp. -- Financia l Summary
--Fiscal year ended Dec. 31--
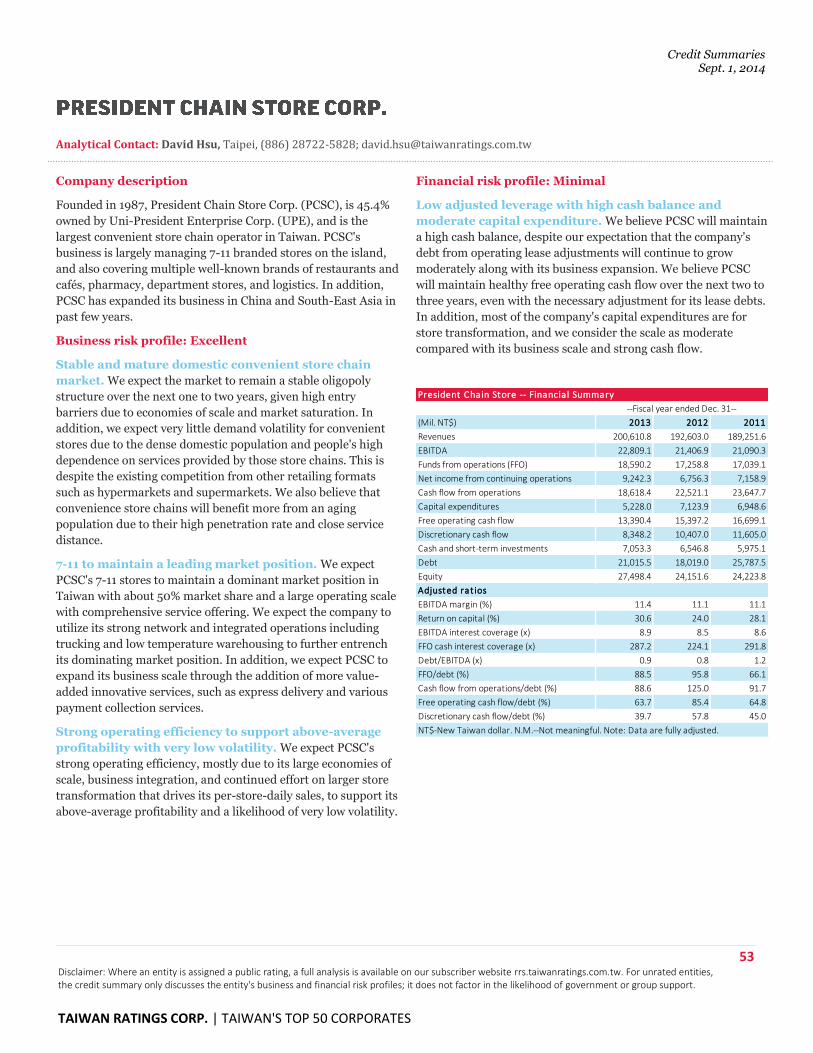
Credit Summaries Sept. 1, 2014
53 Disclaimer: Where an entity is assigned a public rating, a full analysis is available on our subscriber website rrs.taiwanratings.com.tw. For unrated entities, the credit summary only discusses the entity's business and financial risk profiles; it does not factor in the likelihood of government or group support.
TAIWAN RATINGS CORP. | TAIWAN'S TOP 50 CORPORATES
Analytical Contact: David Hsu, Taipei, (886) 28722-5828; [email protected]
Company description
Founded in 1987, President Chain Store Corp. (PCSC), is 45.4%
owned by Uni-President Enterprise Corp. (UPE), and is the
largest convenient store chain operator in Taiwan. PCSC's
business is largely managing 7-11 branded stores on the island,
and also covering multiple well-known brands of restaurants and
cafés, pharmacy, department stores, and logistics. In addition,
PCSC has expanded its business in China and South-East Asia in
past few years.
Business risk profile: Excellent
Stable and mature domestic convenient store chain
market. We expect the market to remain a stable oligopoly
structure over the next one to two years, given high entry
barriers due to economies of scale and market saturation. In
addition, we expect very little demand volatility for convenient
stores due to the dense domestic population and people's high
dependence on services provided by those store chains. This is
despite the existing competition from other retailing formats
such as hypermarkets and supermarkets. We also believe that
convenience store chains will benefit more from an aging
population due to their high penetration rate and close service
distance.
7-11 to maintain a leading market position. We expect
PCSC's 7-11 stores to maintain a dominant market position in
Taiwan with about 50% market share and a large operating scale
with comprehensive service offering. We expect the company to
utilize its strong network and integrated operations including
trucking and low temperature warehousing to further entrench
its dominating market position. In addition, we expect PCSC to
expand its business scale through the addition of more value-
added innovative services, such as express delivery and various
payment collection services.
Strong operating efficiency to support above-average
profitability with very low volatility. We expect PCSC's
strong operating efficiency, mostly due to its large economies of
scale, business integration, and continued effort on larger store
transformation that drives its per-store-daily sales, to support its
above-average profitability and a likelihood of very low volatility.
Financial risk profile: Minimal
Low adjusted leverage with high cash balance and
moderate capital expenditure. We believe PCSC will maintain
a high cash balance, despite our expectation that the company's
debt from operating lease adjustments will continue to grow
moderately along with its business expansion. We believe PCSC
will maintain healthy free operating cash flow over the next two to
three years, even with the necessary adjustment for its lease debts.
In addition, most of the company's capital expenditures are for
store transformation, and we consider the scale as moderate
compared with its business scale and strong cash flow.
(Mil. NT$) 2013 2012 2011
Revenues 200,610.8 192,603.0 189,251.6
EBITDA 22,809.1 21,406.9 21,090.3
Funds from operations (FFO) 18,590.2 17,258.8 17,039.1
Net income from continuing operations 9,242.3 6,756.3 7,158.9
Cash flow from operations 18,618.4 22,521.1 23,647.7
Capital expenditures 5,228.0 7,123.9 6,948.6
Free operating cash flow 13,390.4 15,397.2 16,699.1
Discretionary cash flow 8,348.2 10,407.0 11,605.0
Cash and short-term investments 7,053.3 6,546.8 5,975.1
Debt 21,015.5 18,019.0 25,787.5
Equity 27,498.4 24,151.6 24,223.8
Adjusted rat ios
EBITDA margin (%) 11.4 11.1 11.1
Return on capital (%) 30.6 24.0 28.1
EBITDA interest coverage (x) 8.9 8.5 8.6
FFO cash interest coverage (x) 287.2 224.1 291.8
Debt/EBITDA (x) 0.9 0.8 1.2
FFO/debt (%) 88.5 95.8 66.1
Cash flow from operations/debt (%) 88.6 125.0 91.7
Free operating cash flow/debt (%) 63.7 85.4 64.8
Discretionary cash flow/debt (%) 39.7 57.8 45.0
NT$-New Taiwan dollar. N.M.--Not meaningful. Note: Data are fully adjusted.
President Chain Store -- Financia l Summary
--Fiscal year ended Dec. 31--
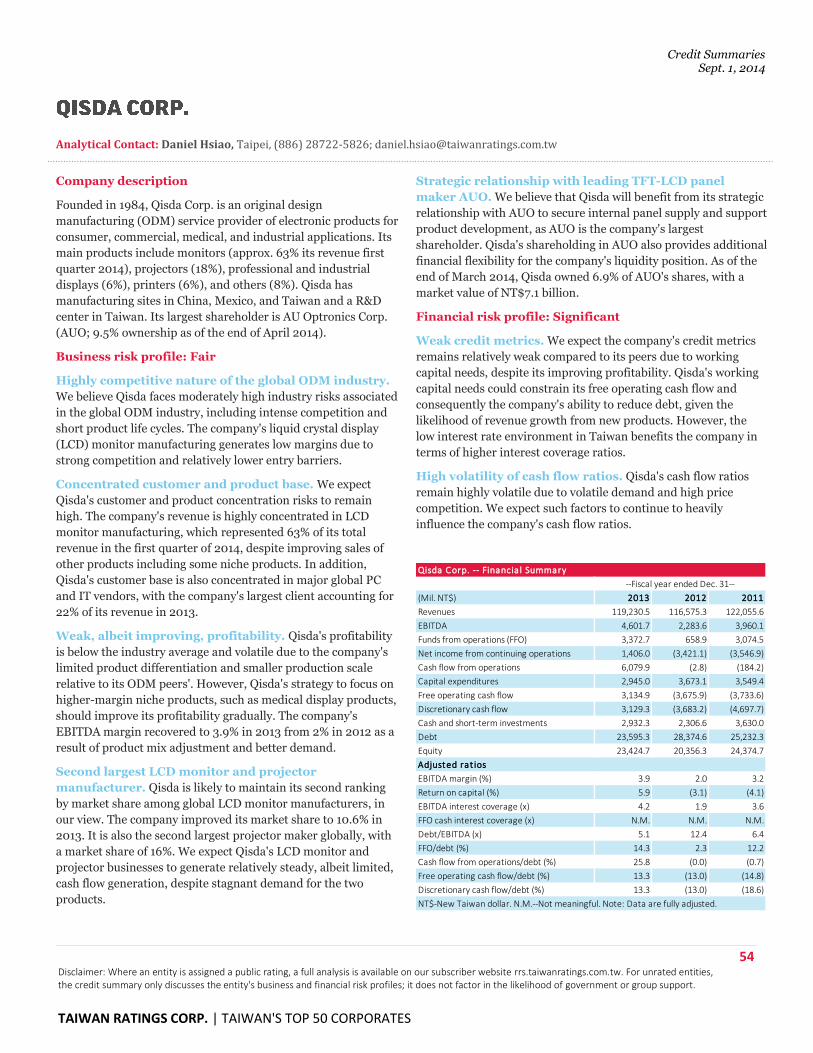
Credit Summaries Sept. 1, 2014
54 Disclaimer: Where an entity is assigned a public rating, a full analysis is available on our subscriber website rrs.taiwanratings.com.tw. For unrated entities, the credit summary only discusses the entity's business and financial risk profiles; it does not factor in the likelihood of government or group support.
TAIWAN RATINGS CORP. | TAIWAN'S TOP 50 CORPORATES
Analytical Contact: Daniel Hsiao, Taipei, (886) 28722-5826; [email protected]
Company description
Founded in 1984, Qisda Corp. is an original design
manufacturing (ODM) service provider of electronic products for
consumer, commercial, medical, and industrial applications. Its
main products include monitors (approx. 63% its revenue first
quarter 2014), projectors (18%), professional and industrial
displays (6%), printers (6%), and others (8%). Qisda has
manufacturing sites in China, Mexico, and Taiwan and a R&D
center in Taiwan. Its largest shareholder is AU Optronics Corp.
(AUO; 9.5% ownership as of the end of April 2014).
Business risk profile: Fair
Highly competitive nature of the global ODM industry.
We believe Qisda faces moderately high industry risks associated
in the global ODM industry, including intense competition and
short product life cycles. The company's liquid crystal display
(LCD) monitor manufacturing generates low margins due to
strong competition and relatively lower entry barriers.
Concentrated customer and product base. We expect
Qisda's customer and product concentration risks to remain
high. The company's revenue is highly concentrated in LCD
monitor manufacturing, which represented 63% of its total
revenue in the first quarter of 2014, despite improving sales of
other products including some niche products. In addition,
Qisda's customer base is also concentrated in major global PC
and IT vendors, with the company's largest client accounting for
22% of its revenue in 2013.
Weak, albeit improving, profitability. Qisda's profitability
is below the industry average and volatile due to the company's
limited product differentiation and smaller production scale
relative to its ODM peers'. However, Qisda's strategy to focus on
higher-margin niche products, such as medical display products,
should improve its profitability gradually. The company's
EBITDA margin recovered to 3.9% in 2013 from 2% in 2012 as a
result of product mix adjustment and better demand.
Second largest LCD monitor and projector
manufacturer. Qisda is likely to maintain its second ranking
by market share among global LCD monitor manufacturers, in
our view. The company improved its market share to 10.6% in
2013. It is also the second largest projector maker globally, with
a market share of 16%. We expect Qisda's LCD monitor and
projector businesses to generate relatively steady, albeit limited,
cash flow generation, despite stagnant demand for the two
products.
Strategic relationship with leading TFT-LCD panel
maker AUO. We believe that Qisda will benefit from its strategic
relationship with AUO to secure internal panel supply and support
product development, as AUO is the company's largest
shareholder. Qisda's shareholding in AUO also provides additional
financial flexibility for the company's liquidity position. As of the
end of March 2014, Qisda owned 6.9% of AUO's shares, with a
market value of NT$7.1 billion.
Financial risk profile: Significant
Weak credit metrics. We expect the company's credit metrics
remains relatively weak compared to its peers due to working
capital needs, despite its improving profitability. Qisda's working
capital needs could constrain its free operating cash flow and
consequently the company's ability to reduce debt, given the
likelihood of revenue growth from new products. However, the
low interest rate environment in Taiwan benefits the company in
terms of higher interest coverage ratios.
High volatility of cash flow ratios. Qisda's cash flow ratios
remain highly volatile due to volatile demand and high price
competition. We expect such factors to continue to heavily
influence the company's cash flow ratios.
(Mil. NT$) 2013 2012 2011
Revenues 119,230.5 116,575.3 122,055.6
EBITDA 4,601.7 2,283.6 3,960.1
Funds from operations (FFO) 3,372.7 658.9 3,074.5
Net income from continuing operations 1,406.0 (3,421.1) (3,546.9)
Cash flow from operations 6,079.9 (2.8) (184.2)
Capital expenditures 2,945.0 3,673.1 3,549.4
Free operating cash flow 3,134.9 (3,675.9) (3,733.6)
Discretionary cash flow 3,129.3 (3,683.2) (4,697.7)
Cash and short-term investments 2,932.3 2,306.6 3,630.0
Debt 23,595.3 28,374.6 25,232.3
Equity 23,424.7 20,356.3 24,374.7
Adjusted rat ios
EBITDA margin (%) 3.9 2.0 3.2
Return on capital (%) 5.9 (3.1) (4.1)
EBITDA interest coverage (x) 4.2 1.9 3.6
FFO cash interest coverage (x) N.M. N.M. N.M.
Debt/EBITDA (x) 5.1 12.4 6.4
FFO/debt (%) 14.3 2.3 12.2
Cash flow from operations/debt (%) 25.8 (0.0) (0.7)
Free operating cash flow/debt (%) 13.3 (13.0) (14.8)
Discretionary cash flow/debt (%) 13.3 (13.0) (18.6)
NT$-New Taiwan dollar. N.M.--Not meaningful. Note: Data are fully adjusted.
Qisda Corp. -- Financia l Summary
--Fiscal year ended Dec. 31--
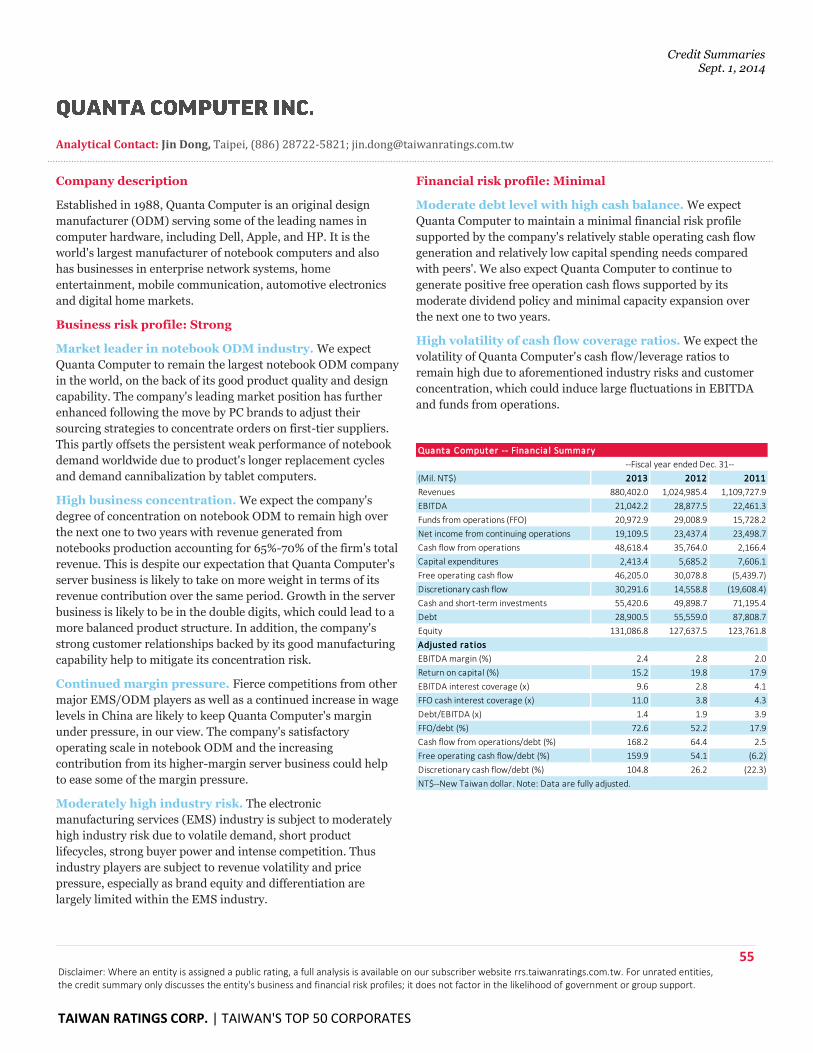
Credit Summaries Sept. 1, 2014
55 Disclaimer: Where an entity is assigned a public rating, a full analysis is available on our subscriber website rrs.taiwanratings.com.tw. For unrated entities, the credit summary only discusses the entity's business and financial risk profiles; it does not factor in the likelihood of government or group support.
TAIWAN RATINGS CORP. | TAIWAN'S TOP 50 CORPORATES
Analytical Contact: Jin Dong, Taipei, (886) 28722-5821; [email protected]
Company description
Established in 1988, Quanta Computer is an original design
manufacturer (ODM) serving some of the leading names in
computer hardware, including Dell, Apple, and HP. It is the
world's largest manufacturer of notebook computers and also
has businesses in enterprise network systems, home
entertainment, mobile communication, automotive electronics
and digital home markets.
Business risk profile: Strong
Market leader in notebook ODM industry. We expect
Quanta Computer to remain the largest notebook ODM company
in the world, on the back of its good product quality and design
capability. The company's leading market position has further
enhanced following the move by PC brands to adjust their
sourcing strategies to concentrate orders on first-tier suppliers.
This partly offsets the persistent weak performance of notebook
demand worldwide due to product's longer replacement cycles
and demand cannibalization by tablet computers.
High business concentration. We expect the company's
degree of concentration on notebook ODM to remain high over
the next one to two years with revenue generated from
notebooks production accounting for 65%-70% of the firm's total
revenue. This is despite our expectation that Quanta Computer's
server business is likely to take on more weight in terms of its
revenue contribution over the same period. Growth in the server
business is likely to be in the double digits, which could lead to a
more balanced product structure. In addition, the company's
strong customer relationships backed by its good manufacturing
capability help to mitigate its concentration risk.
Continued margin pressure. Fierce competitions from other
major EMS/ODM players as well as a continued increase in wage
levels in China are likely to keep Quanta Computer's margin
under pressure, in our view. The company's satisfactory
operating scale in notebook ODM and the increasing
contribution from its higher-margin server business could help
to ease some of the margin pressure.
Moderately high industry risk. The electronic
manufacturing services (EMS) industry is subject to moderately
high industry risk due to volatile demand, short product
lifecycles, strong buyer power and intense competition. Thus
industry players are subject to revenue volatility and price
pressure, especially as brand equity and differentiation are
largely limited within the EMS industry.
Financial risk profile: Minimal
Moderate debt level with high cash balance. We expect
Quanta Computer to maintain a minimal financial risk profile
supported by the company's relatively stable operating cash flow
generation and relatively low capital spending needs compared
with peers'. We also expect Quanta Computer to continue to
generate positive free operation cash flows supported by its
moderate dividend policy and minimal capacity expansion over
the next one to two years.
High volatility of cash flow coverage ratios. We expect the
volatility of Quanta Computer's cash flow/leverage ratios to
remain high due to aforementioned industry risks and customer
concentration, which could induce large fluctuations in EBITDA
and funds from operations.
(Mil. NT$) 2013 2012 2011
Revenues 880,402.0 1,024,985.4 1,109,727.9
EBITDA 21,042.2 28,877.5 22,461.3
Funds from operations (FFO) 20,972.9 29,008.9 15,728.2
Net income from continuing operations 19,109.5 23,437.4 23,498.7
Cash flow from operations 48,618.4 35,764.0 2,166.4
Capital expenditures 2,413.4 5,685.2 7,606.1
Free operating cash flow 46,205.0 30,078.8 (5,439.7)
Discretionary cash flow 30,291.6 14,558.8 (19,608.4)
Cash and short-term investments 55,420.6 49,898.7 71,195.4
Debt 28,900.5 55,559.0 87,808.7
Equity 131,086.8 127,637.5 123,761.8
Adjusted rat ios
EBITDA margin (%) 2.4 2.8 2.0
Return on capital (%) 15.2 19.8 17.9
EBITDA interest coverage (x) 9.6 2.8 4.1
FFO cash interest coverage (x) 11.0 3.8 4.3
Debt/EBITDA (x) 1.4 1.9 3.9
FFO/debt (%) 72.6 52.2 17.9
Cash flow from operations/debt (%) 168.2 64.4 2.5
Free operating cash flow/debt (%) 159.9 54.1 (6.2)
Discretionary cash flow/debt (%) 104.8 26.2 (22.3)
NT$--New Taiwan dollar. Note: Data are fully adjusted.
Quanta Computer -- Financia l Summary
--Fiscal year ended Dec. 31--
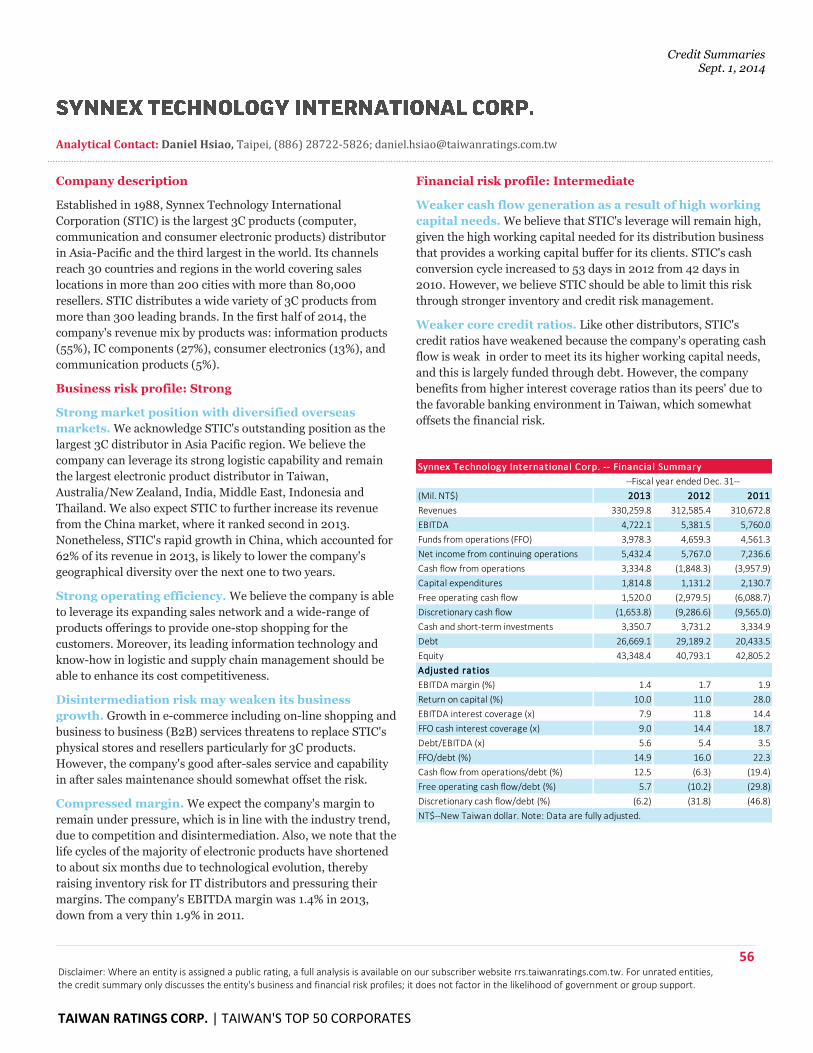
Credit Summaries Sept. 1, 2014
56 Disclaimer: Where an entity is assigned a public rating, a full analysis is available on our subscriber website rrs.taiwanratings.com.tw. For unrated entities, the credit summary only discusses the entity's business and financial risk profiles; it does not factor in the likelihood of government or group support.
TAIWAN RATINGS CORP. | TAIWAN'S TOP 50 CORPORATES
Analytical Contact: Daniel Hsiao, Taipei, (886) 28722-5826; [email protected]
Company description
Established in 1988, Synnex Technology International
Corporation (STIC) is the largest 3C products (computer,
communication and consumer electronic products) distributor
in Asia-Pacific and the third largest in the world. Its channels
reach 30 countries and regions in the world covering sales
locations in more than 200 cities with more than 80,000
resellers. STIC distributes a wide variety of 3C products from
more than 300 leading brands. In the first half of 2014, the
company's revenue mix by products was: information products
(55%), IC components (27%), consumer electronics (13%), and
communication products (5%).
Business risk profile: Strong
Strong market position with diversified overseas
markets. We acknowledge STIC's outstanding position as the
largest 3C distributor in Asia Pacific region. We believe the
company can leverage its strong logistic capability and remain
the largest electronic product distributor in Taiwan,
Australia/New Zealand, India, Middle East, Indonesia and
Thailand. We also expect STIC to further increase its revenue
from the China market, where it ranked second in 2013.
Nonetheless, STIC's rapid growth in China, which accounted for
62% of its revenue in 2013, is likely to lower the company's
geographical diversity over the next one to two years.
Strong operating efficiency. We believe the company is able
to leverage its expanding sales network and a wide-range of
products offerings to provide one-stop shopping for the
customers. Moreover, its leading information technology and
know-how in logistic and supply chain management should be
able to enhance its cost competitiveness.
Disintermediation risk may weaken its business
growth. Growth in e-commerce including on-line shopping and
business to business (B2B) services threatens to replace STIC's
physical stores and resellers particularly for 3C products.
However, the company's good after-sales service and capability
in after sales maintenance should somewhat offset the risk.
Compressed margin. We expect the company's margin to
remain under pressure, which is in line with the industry trend,
due to competition and disintermediation. Also, we note that the
life cycles of the majority of electronic products have shortened
to about six months due to technological evolution, thereby
raising inventory risk for IT distributors and pressuring their
margins. The company's EBITDA margin was 1.4% in 2013,
down from a very thin 1.9% in 2011.
Financial risk profile: Intermediate
Weaker cash flow generation as a result of high working
capital needs. We believe that STIC's leverage will remain high,
given the high working capital needed for its distribution business
that provides a working capital buffer for its clients. STIC's cash
conversion cycle increased to 53 days in 2012 from 42 days in
2010. However, we believe STIC should be able to limit this risk
through stronger inventory and credit risk management.
Weaker core credit ratios. Like other distributors, STIC's
credit ratios have weakened because the company's operating cash
flow is weak in order to meet its its higher working capital needs,
and this is largely funded through debt. However, the company
benefits from higher interest coverage ratios than its peers' due to
the favorable banking environment in Taiwan, which somewhat
offsets the financial risk.
(Mil. NT$) 2013 2012 2011
Revenues 330,259.8 312,585.4 310,672.8
EBITDA 4,722.1 5,381.5 5,760.0
Funds from operations (FFO) 3,978.3 4,659.3 4,561.3
Net income from continuing operations 5,432.4 5,767.0 7,236.6
Cash flow from operations 3,334.8 (1,848.3) (3,957.9)
Capital expenditures 1,814.8 1,131.2 2,130.7
Free operating cash flow 1,520.0 (2,979.5) (6,088.7)
Discretionary cash flow (1,653.8) (9,286.6) (9,565.0)
Cash and short-term investments 3,350.7 3,731.2 3,334.9
Debt 26,669.1 29,189.2 20,433.5
Equity 43,348.4 40,793.1 42,805.2
Adjusted rat ios
EBITDA margin (%) 1.4 1.7 1.9
Return on capital (%) 10.0 11.0 28.0
EBITDA interest coverage (x) 7.9 11.8 14.4
FFO cash interest coverage (x) 9.0 14.4 18.7
Debt/EBITDA (x) 5.6 5.4 3.5
FFO/debt (%) 14.9 16.0 22.3
Cash flow from operations/debt (%) 12.5 (6.3) (19.4)
Free operating cash flow/debt (%) 5.7 (10.2) (29.8)
Discretionary cash flow/debt (%) (6.2) (31.8) (46.8)
NT$--New Taiwan dollar. Note: Data are fully adjusted.
Synnex Technology Internat ional Corp. -- Financia l Summary
--Fiscal year ended Dec. 31--
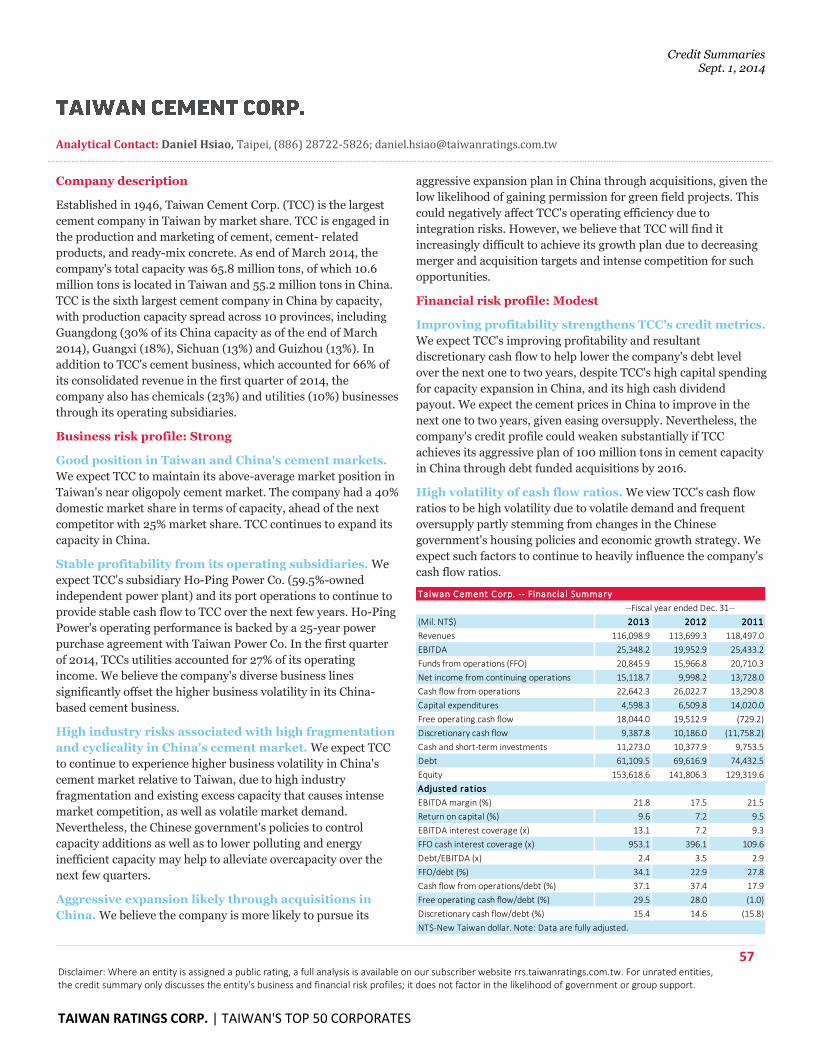
Credit Summaries Sept. 1, 2014
57 Disclaimer: Where an entity is assigned a public rating, a full analysis is available on our subscriber website rrs.taiwanratings.com.tw. For unrated entities, the credit summary only discusses the entity's business and financial risk profiles; it does not factor in the likelihood of government or group support.
TAIWAN RATINGS CORP. | TAIWAN'S TOP 50 CORPORATES
Analytical Contact: Daniel Hsiao, Taipei, (886) 28722-5826; [email protected]
Company description
Established in 1946, Taiwan Cement Corp. (TCC) is the largest
cement company in Taiwan by market share. TCC is engaged in
the production and marketing of cement, cement- related
products, and ready-mix concrete. As end of March 2014, the
company's total capacity was 65.8 million tons, of which 10.6
million tons is located in Taiwan and 55.2 million tons in China.
TCC is the sixth largest cement company in China by capacity,
with production capacity spread across 10 provinces, including
Guangdong (30% of its China capacity as of the end of March
2014), Guangxi (18%), Sichuan (13%) and Guizhou (13%). In
addition to TCC's cement business, which accounted for 66% of
its consolidated revenue in the first quarter of 2014, the
company also has chemicals (23%) and utilities (10%) businesses
through its operating subsidiaries.
Business risk profile: Strong
Good position in Taiwan and China's cement markets.
We expect TCC to maintain its above-average market position in
Taiwan's near oligopoly cement market. The company had a 40%
domestic market share in terms of capacity, ahead of the next
competitor with 25% market share. TCC continues to expand its
capacity in China.
Stable profitability from its operating subsidiaries. We
expect TCC's subsidiary Ho-Ping Power Co. (59.5%-owned
independent power plant) and its port operations to continue to
provide stable cash flow to TCC over the next few years. Ho-Ping
Power's operating performance is backed by a 25-year power
purchase agreement with Taiwan Power Co. In the first quarter
of 2014, TCCs utilities accounted for 27% of its operating
income. We believe the company's diverse business lines
significantly offset the higher business volatility in its China-
based cement business.
High industry risks associated with high fragmentation
and cyclicality in China's cement market. We expect TCC
to continue to experience higher business volatility in China's
cement market relative to Taiwan, due to high industry
fragmentation and existing excess capacity that causes intense
market competition, as well as volatile market demand.
Nevertheless, the Chinese government's policies to control
capacity additions as well as to lower polluting and energy
inefficient capacity may help to alleviate overcapacity over the
next few quarters.
Aggressive expansion likely through acquisitions in
China. We believe the company is more likely to pursue its
aggressive expansion plan in China through acquisitions, given the
low likelihood of gaining permission for green field projects. This
could negatively affect TCC's operating efficiency due to
integration risks. However, we believe that TCC will find it
increasingly difficult to achieve its growth plan due to decreasing
merger and acquisition targets and intense competition for such
opportunities.
Financial risk profile: Modest
Improving profitability strengthens TCC's credit metrics.
We expect TCC's improving profitability and resultant
discretionary cash flow to help lower the company's debt level
over the next one to two years, despite TCC's high capital spending
for capacity expansion in China, and its high cash dividend
payout. We expect the cement prices in China to improve in the
next one to two years, given easing oversupply. Nevertheless, the
company's credit profile could weaken substantially if TCC
achieves its aggressive plan of 100 million tons in cement capacity
in China through debt funded acquisitions by 2016.
High volatility of cash flow ratios. We view TCC's cash flow
ratios to be high volatility due to volatile demand and frequent
oversupply partly stemming from changes in the Chinese
government's housing policies and economic growth strategy. We
expect such factors to continue to heavily influence the company's
cash flow ratios.
(Mil. NT$) 2013 2012 2011
Revenues 116,098.9 113,699.3 118,497.0
EBITDA 25,348.2 19,952.9 25,433.2
Funds from operations (FFO) 20,845.9 15,966.8 20,710.3
Net income from continuing operations 15,118.7 9,998.2 13,728.0
Cash flow from operations 22,642.3 26,022.7 13,290.8
Capital expenditures 4,598.3 6,509.8 14,020.0
Free operating cash flow 18,044.0 19,512.9 (729.2)
Discretionary cash flow 9,387.8 10,186.0 (11,758.2)
Cash and short-term investments 11,273.0 10,377.9 9,753.5
Debt 61,109.5 69,616.9 74,432.5
Equity 153,618.6 141,806.3 129,319.6
Adjusted rat ios
EBITDA margin (%) 21.8 17.5 21.5
Return on capital (%) 9.6 7.2 9.5
EBITDA interest coverage (x) 13.1 7.2 9.3
FFO cash interest coverage (x) 953.1 396.1 109.6
Debt/EBITDA (x) 2.4 3.5 2.9
FFO/debt (%) 34.1 22.9 27.8
Cash flow from operations/debt (%) 37.1 37.4 17.9
Free operating cash flow/debt (%) 29.5 28.0 (1.0)
Discretionary cash flow/debt (%) 15.4 14.6 (15.8)
NT$-New Taiwan dollar. Note: Data are fully adjusted.
Taiwan Cement Corp. -- Financia l Summary
--Fiscal year ended Dec. 31--
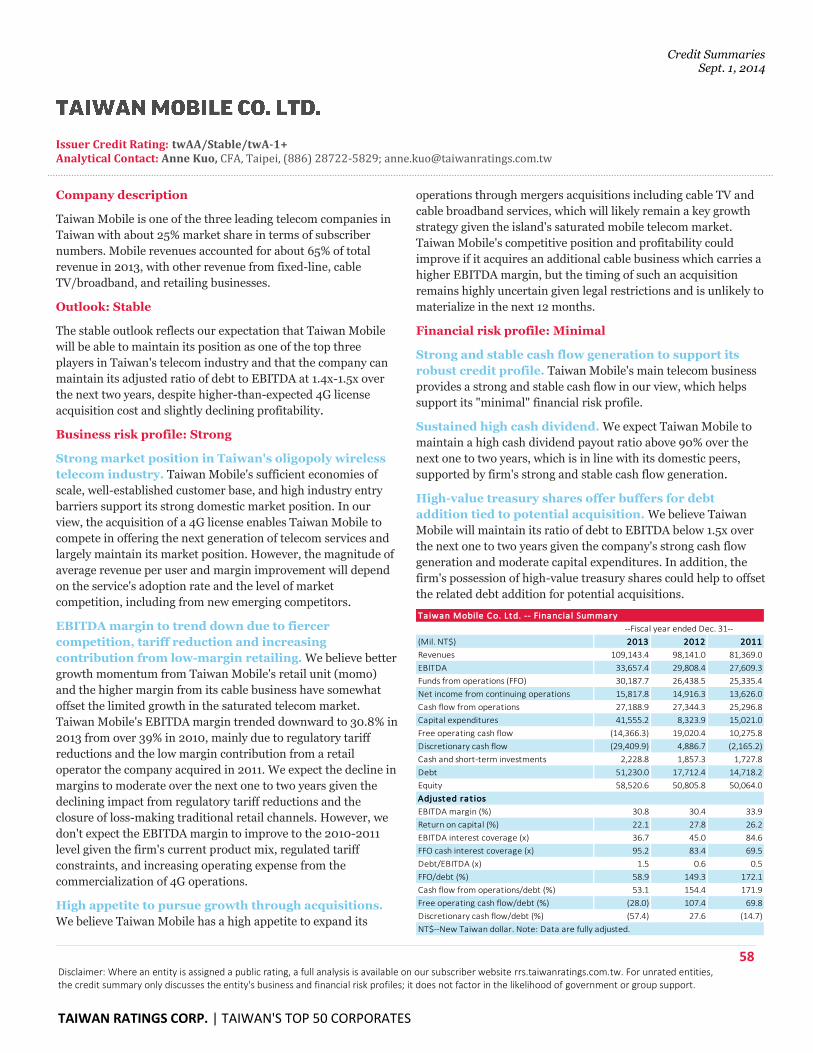
Credit Summaries Sept. 1, 2014
58 Disclaimer: Where an entity is assigned a public rating, a full analysis is available on our subscriber website rrs.taiwanratings.com.tw. For unrated entities, the credit summary only discusses the entity's business and financial risk profiles; it does not factor in the likelihood of government or group support.
TAIWAN RATINGS CORP. | TAIWAN'S TOP 50 CORPORATES
Issuer Credit Rating: twAA/Stable/twA-1+ Analytical Contact: Anne Kuo, CFA, Taipei, (886) 28722-5829; [email protected]
Company description
Taiwan Mobile is one of the three leading telecom companies in
Taiwan with about 25% market share in terms of subscriber
numbers. Mobile revenues accounted for about 65% of total
revenue in 2013, with other revenue from fixed-line, cable
TV/broadband, and retailing businesses.
Outlook: Stable
The stable outlook reflects our expectation that Taiwan Mobile
will be able to maintain its position as one of the top three
players in Taiwan's telecom industry and that the company can
maintain its adjusted ratio of debt to EBITDA at 1.4x-1.5x over
the next two years, despite higher-than-expected 4G license
acquisition cost and slightly declining profitability.
Business risk profile: Strong
Strong market position in Taiwan's oligopoly wireless
telecom industry. Taiwan Mobile's sufficient economies of
scale, well-established customer base, and high industry entry
barriers support its strong domestic market position. In our
view, the acquisition of a 4G license enables Taiwan Mobile to
compete in offering the next generation of telecom services and
largely maintain its market position. However, the magnitude of
average revenue per user and margin improvement will depend
on the service's adoption rate and the level of market
competition, including from new emerging competitors.
EBITDA margin to trend down due to fiercer
competition, tariff reduction and increasing
contribution from low-margin retailing. We believe better
growth momentum from Taiwan Mobile's retail unit (momo)
and the higher margin from its cable business have somewhat
offset the limited growth in the saturated telecom market.
Taiwan Mobile's EBITDA margin trended downward to 30.8% in
2013 from over 39% in 2010, mainly due to regulatory tariff
reductions and the low margin contribution from a retail
operator the company acquired in 2011. We expect the decline in
margins to moderate over the next one to two years given the
declining impact from regulatory tariff reductions and the
closure of loss-making traditional retail channels. However, we
don't expect the EBITDA margin to improve to the 2010-2011
level given the firm's current product mix, regulated tariff
constraints, and increasing operating expense from the
commercialization of 4G operations.
High appetite to pursue growth through acquisitions.
We believe Taiwan Mobile has a high appetite to expand its
operations through mergers acquisitions including cable TV and
cable broadband services, which will likely remain a key growth
strategy given the island's saturated mobile telecom market.
Taiwan Mobile's competitive position and profitability could
improve if it acquires an additional cable business which carries a
higher EBITDA margin, but the timing of such an acquisition
remains highly uncertain given legal restrictions and is unlikely to
materialize in the next 12 months.
Financial risk profile: Minimal
Strong and stable cash flow generation to support its
robust credit profile. Taiwan Mobile's main telecom business
provides a strong and stable cash flow in our view, which helps
support its "minimal" financial risk profile.
Sustained high cash dividend. We expect Taiwan Mobile to
maintain a high cash dividend payout ratio above 90% over the
next one to two years, which is in line with its domestic peers,
supported by firm's strong and stable cash flow generation.
High-value treasury shares offer buffers for debt
addition tied to potential acquisition. We believe Taiwan
Mobile will maintain its ratio of debt to EBITDA below 1.5x over
the next one to two years given the company's strong cash flow
generation and moderate capital expenditures. In addition, the
firm's possession of high-value treasury shares could help to offset
the related debt addition for potential acquisitions.
(Mil. NT$) 2013 2012 2011
Revenues 109,143.4 98,141.0 81,369.0
EBITDA 33,657.4 29,808.4 27,609.3
Funds from operations (FFO) 30,187.7 26,438.5 25,335.4
Net income from continuing operations 15,817.8 14,916.3 13,626.0
Cash flow from operations 27,188.9 27,344.3 25,296.8
Capital expenditures 41,555.2 8,323.9 15,021.0
Free operating cash flow (14,366.3) 19,020.4 10,275.8
Discretionary cash flow (29,409.9) 4,886.7 (2,165.2)
Cash and short-term investments 2,228.8 1,857.3 1,727.8
Debt 51,230.0 17,712.4 14,718.2
Equity 58,520.6 50,805.8 50,064.0
Adjusted rat ios
EBITDA margin (%) 30.8 30.4 33.9
Return on capital (%) 22.1 27.8 26.2
EBITDA interest coverage (x) 36.7 45.0 84.6
FFO cash interest coverage (x) 95.2 83.4 69.5
Debt/EBITDA (x) 1.5 0.6 0.5
FFO/debt (%) 58.9 149.3 172.1
Cash flow from operations/debt (%) 53.1 154.4 171.9
Free operating cash flow/debt (%) (28.0) 107.4 69.8
Discretionary cash flow/debt (%) (57.4) 27.6 (14.7)
NT$--New Taiwan dollar. Note: Data are fully adjusted.
--Fiscal year ended Dec. 31--
Taiwan Mobile Co. Ltd. -- Financia l Summary
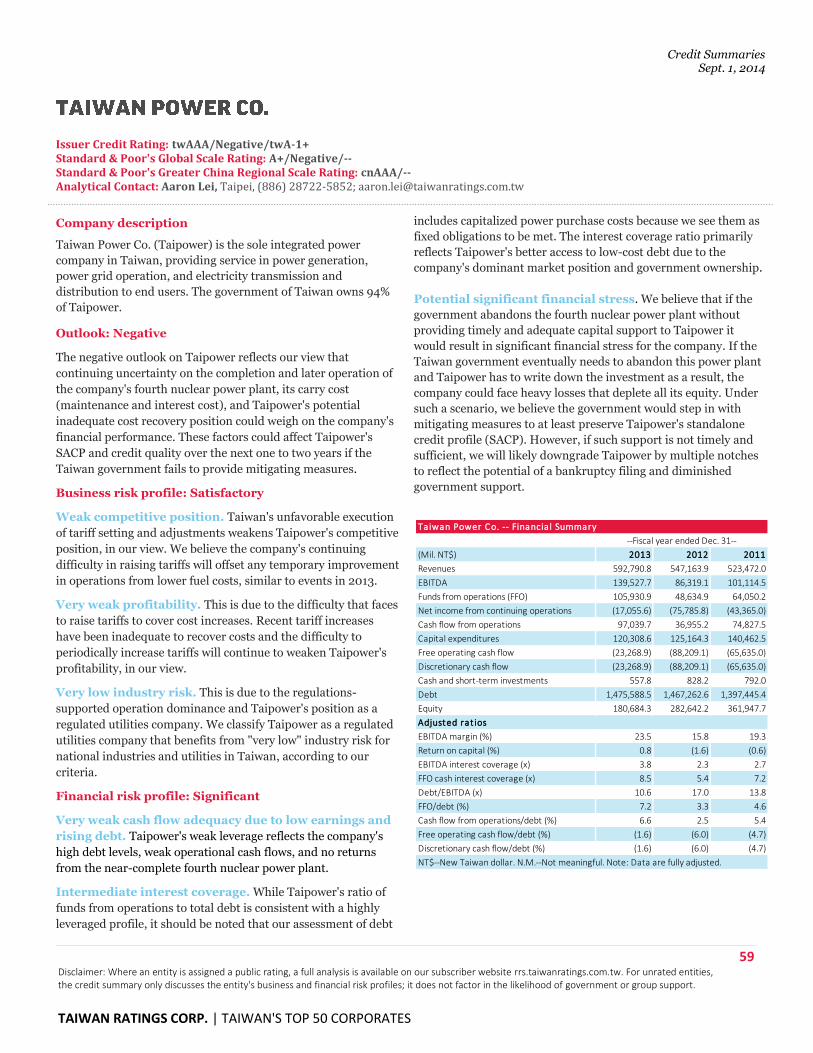
Credit Summaries Sept. 1, 2014
59 Disclaimer: Where an entity is assigned a public rating, a full analysis is available on our subscriber website rrs.taiwanratings.com.tw. For unrated entities, the credit summary only discusses the entity's business and financial risk profiles; it does not factor in the likelihood of government or group support.
TAIWAN RATINGS CORP. | TAIWAN'S TOP 50 CORPORATES
Issuer Credit Rating: twAAA/Negative/twA-1+ Standard & Poor's Global Scale Rating: A+/Negative/-- Standard & Poor's Greater China Regional Scale Rating: cnAAA/-- Analytical Contact: Aaron Lei, Taipei, (886) 28722-5852; [email protected]
Company description
Taiwan Power Co. (Taipower) is the sole integrated power
company in Taiwan, providing service in power generation,
power grid operation, and electricity transmission and
distribution to end users. The government of Taiwan owns 94%
of Taipower.
Outlook: Negative
The negative outlook on Taipower reflects our view that
continuing uncertainty on the completion and later operation of
the company's fourth nuclear power plant, its carry cost
(maintenance and interest cost), and Taipower's potential
inadequate cost recovery position could weigh on the company's
financial performance. These factors could affect Taipower's
SACP and credit quality over the next one to two years if the
Taiwan government fails to provide mitigating measures.
Business risk profile: Satisfactory
Weak competitive position. Taiwan's unfavorable execution
of tariff setting and adjustments weakens Taipower's competitive
position, in our view. We believe the company's continuing
difficulty in raising tariffs will offset any temporary improvement
in operations from lower fuel costs, similar to events in 2013.
Very weak profitability. This is due to the difficulty that faces
to raise tariffs to cover cost increases. Recent tariff increases
have been inadequate to recover costs and the difficulty to
periodically increase tariffs will continue to weaken Taipower's
profitability, in our view.
Very low industry risk. This is due to the regulations-
supported operation dominance and Taipower's position as a
regulated utilities company. We classify Taipower as a regulated
utilities company that benefits from "very low" industry risk for
national industries and utilities in Taiwan, according to our
criteria.
Financial risk profile: Significant
Very weak cash flow adequacy due to low earnings and
rising debt. Taipower's weak leverage reflects the company's
high debt levels, weak operational cash flows, and no returns
from the near-complete fourth nuclear power plant.
Intermediate interest coverage. While Taipower's ratio of
funds from operations to total debt is consistent with a highly
leveraged profile, it should be noted that our assessment of debt
includes capitalized power purchase costs because we see them as
fixed obligations to be met. The interest coverage ratio primarily
reflects Taipower's better access to low-cost debt due to the
company's dominant market position and government ownership.
Potential significant financial stress. We believe that if the
government abandons the fourth nuclear power plant without
providing timely and adequate capital support to Taipower it
would result in significant financial stress for the company. If the
Taiwan government eventually needs to abandon this power plant
and Taipower has to write down the investment as a result, the
company could face heavy losses that deplete all its equity. Under
such a scenario, we believe the government would step in with
mitigating measures to at least preserve Taipower's standalone
credit profile (SACP). However, if such support is not timely and
sufficient, we will likely downgrade Taipower by multiple notches
to reflect the potential of a bankruptcy filing and diminished
government support.
(Mil. NT$) 2013 2012 2011
Revenues 592,790.8 547,163.9 523,472.0
EBITDA 139,527.7 86,319.1 101,114.5
Funds from operations (FFO) 105,930.9 48,634.9 64,050.2
Net income from continuing operations (17,055.6) (75,785.8) (43,365.0)
Cash flow from operations 97,039.7 36,955.2 74,827.5
Capital expenditures 120,308.6 125,164.3 140,462.5
Free operating cash flow (23,268.9) (88,209.1) (65,635.0)
Discretionary cash flow (23,268.9) (88,209.1) (65,635.0)
Cash and short-term investments 557.8 828.2 792.0
Debt 1,475,588.5 1,467,262.6 1,397,445.4
Equity 180,684.3 282,642.2 361,947.7
Adjusted rat ios
EBITDA margin (%) 23.5 15.8 19.3
Return on capital (%) 0.8 (1.6) (0.6)
EBITDA interest coverage (x) 3.8 2.3 2.7
FFO cash interest coverage (x) 8.5 5.4 7.2
Debt/EBITDA (x) 10.6 17.0 13.8
FFO/debt (%) 7.2 3.3 4.6
Cash flow from operations/debt (%) 6.6 2.5 5.4
Free operating cash flow/debt (%) (1.6) (6.0) (4.7)
Discretionary cash flow/debt (%) (1.6) (6.0) (4.7)
NT$--New Taiwan dollar. N.M.--Not meaningful. Note: Data are fully adjusted.
Taiwan Power Co. -- Financia l Summary
--Fiscal year ended Dec. 31--
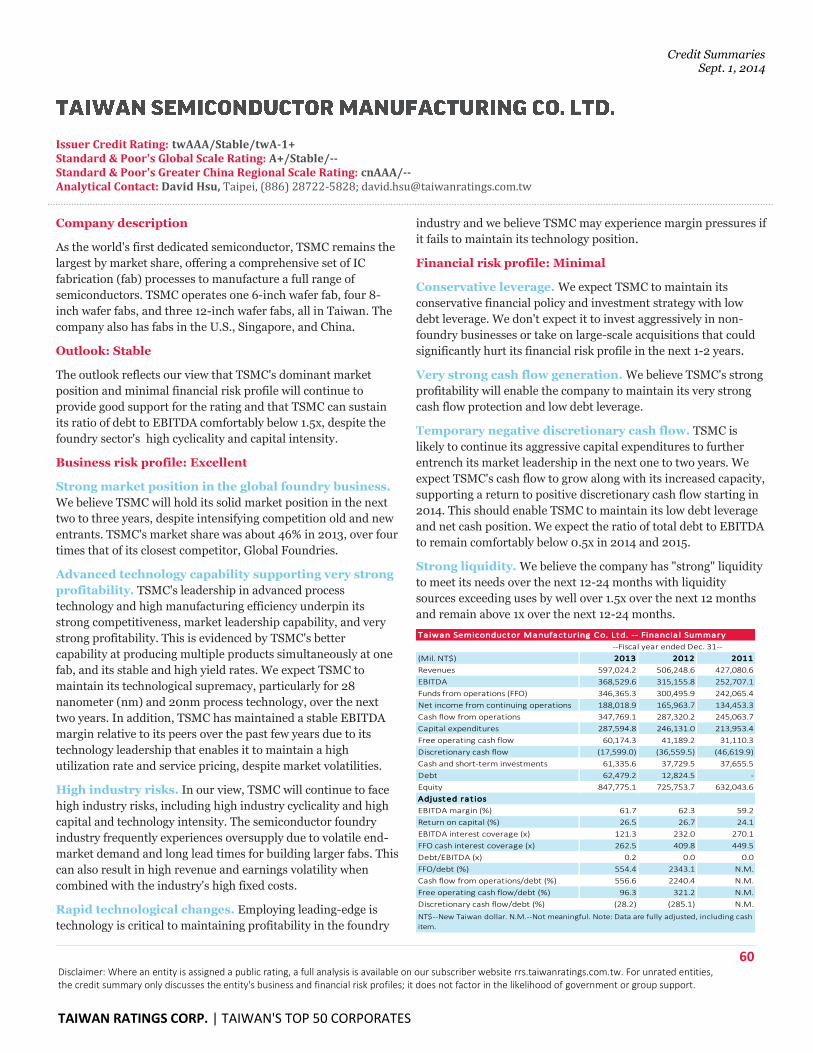
Credit Summaries Sept. 1, 2014
60 Disclaimer: Where an entity is assigned a public rating, a full analysis is available on our subscriber website rrs.taiwanratings.com.tw. For unrated entities, the credit summary only discusses the entity's business and financial risk profiles; it does not factor in the likelihood of government or group support.
TAIWAN RATINGS CORP. | TAIWAN'S TOP 50 CORPORATES
Issuer Credit Rating: twAAA/Stable/twA-1+ Standard & Poor's Global Scale Rating: A+/Stable/-- Standard & Poor's Greater China Regional Scale Rating: cnAAA/-- Analytical Contact: David Hsu, Taipei, (886) 28722-5828; [email protected]
Company description
As the world's first dedicated semiconductor, TSMC remains the
largest by market share, offering a comprehensive set of IC
fabrication (fab) processes to manufacture a full range of
semiconductors. TSMC operates one 6-inch wafer fab, four 8-
inch wafer fabs, and three 12-inch wafer fabs, all in Taiwan. The
company also has fabs in the U.S., Singapore, and China.
Outlook: Stable
The outlook reflects our view that TSMC's dominant market
position and minimal financial risk profile will continue to
provide good support for the rating and that TSMC can sustain
its ratio of debt to EBITDA comfortably below 1.5x, despite the
foundry sector's high cyclicality and capital intensity.
Business risk profile: Excellent
Strong market position in the global foundry business.
We believe TSMC will hold its solid market position in the next
two to three years, despite intensifying competition old and new
entrants. TSMC's market share was about 46% in 2013, over four
times that of its closest competitor, Global Foundries.
Advanced technology capability supporting very strong
profitability. TSMC's leadership in advanced process
technology and high manufacturing efficiency underpin its
strong competitiveness, market leadership capability, and very
strong profitability. This is evidenced by TSMC's better
capability at producing multiple products simultaneously at one
fab, and its stable and high yield rates. We expect TSMC to
maintain its technological supremacy, particularly for 28
nanometer (nm) and 20nm process technology, over the next
two years. In addition, TSMC has maintained a stable EBITDA
margin relative to its peers over the past few years due to its
technology leadership that enables it to maintain a high
utilization rate and service pricing, despite market volatilities.
High industry risks. In our view, TSMC will continue to face
high industry risks, including high industry cyclicality and high
capital and technology intensity. The semiconductor foundry
industry frequently experiences oversupply due to volatile end-
market demand and long lead times for building larger fabs. This
can also result in high revenue and earnings volatility when
combined with the industry's high fixed costs.
Rapid technological changes. Employing leading-edge is
technology is critical to maintaining profitability in the foundry
industry and we believe TSMC may experience margin pressures if
it fails to maintain its technology position.
Financial risk profile: Minimal
Conservative leverage. We expect TSMC to maintain its
conservative financial policy and investment strategy with low
debt leverage. We don't expect it to invest aggressively in non-
foundry businesses or take on large-scale acquisitions that could
significantly hurt its financial risk profile in the next 1-2 years.
Very strong cash flow generation. We believe TSMC's strong
profitability will enable the company to maintain its very strong
cash flow protection and low debt leverage.
Temporary negative discretionary cash flow. TSMC is
likely to continue its aggressive capital expenditures to further
entrench its market leadership in the next one to two years. We
expect TSMC's cash flow to grow along with its increased capacity,
supporting a return to positive discretionary cash flow starting in
2014. This should enable TSMC to maintain its low debt leverage
and net cash position. We expect the ratio of total debt to EBITDA
to remain comfortably below 0.5x in 2014 and 2015.
Strong liquidity. We believe the company has "strong" liquidity
to meet its needs over the next 12-24 months with liquidity
sources exceeding uses by well over 1.5x over the next 12 months
and remain above 1x over the next 12-24 months.
(Mil. NT$) 2013 2012 2011
Revenues 597,024.2 506,248.6 427,080.6
EBITDA 368,529.6 315,155.8 252,707.1
Funds from operations (FFO) 346,365.3 300,495.9 242,065.4
Net income from continuing operations 188,018.9 165,963.7 134,453.3
Cash flow from operations 347,769.1 287,320.2 245,063.7
Capital expenditures 287,594.8 246,131.0 213,953.4
Free operating cash flow 60,174.3 41,189.2 31,110.3
Discretionary cash flow (17,599.0) (36,559.5) (46,619.9)
Cash and short-term investments 61,335.6 37,729.5 37,655.5
Debt 62,479.2 12,824.5 -
Equity 847,775.1 725,753.7 632,043.6
Adjusted rat ios
EBITDA margin (%) 61.7 62.3 59.2
Return on capital (%) 26.5 26.7 24.1
EBITDA interest coverage (x) 121.3 232.0 270.1
FFO cash interest coverage (x) 262.5 409.8 449.5
Debt/EBITDA (x) 0.2 0.0 0.0
FFO/debt (%) 554.4 2343.1 N.M.
Cash flow from operations/debt (%) 556.6 2240.4 N.M.
Free operating cash flow/debt (%) 96.3 321.2 N.M.
Discretionary cash flow/debt (%) (28.2) (285.1) N.M.
Taiwan Semiconductor Manufacturing Co. Ltd. -- Financia l Summary
--Fiscal year ended Dec. 31--
NT$--New Taiwan dollar. N.M.--Not meaningful. Note: Data are fully adjusted, including cash
item.
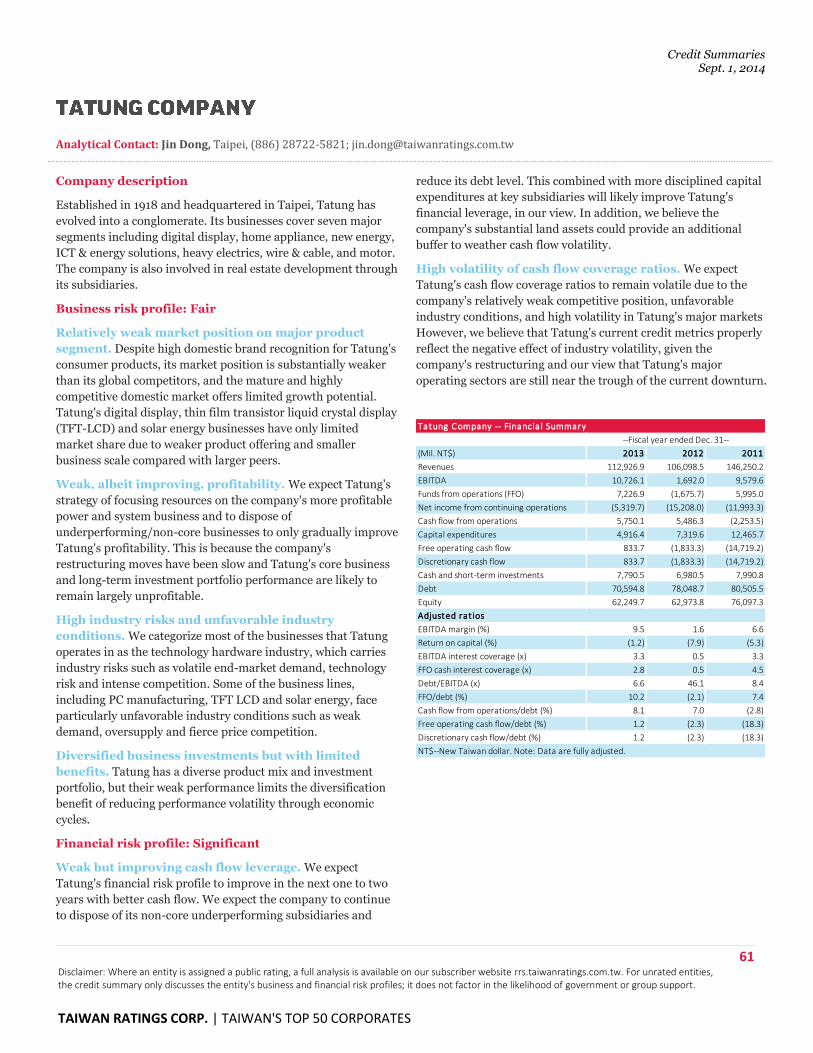
Credit Summaries Sept. 1, 2014
61 Disclaimer: Where an entity is assigned a public rating, a full analysis is available on our subscriber website rrs.taiwanratings.com.tw. For unrated entities, the credit summary only discusses the entity's business and financial risk profiles; it does not factor in the likelihood of government or group support.
TAIWAN RATINGS CORP. | TAIWAN'S TOP 50 CORPORATES
Analytical Contact: Jin Dong, Taipei, (886) 28722-5821; [email protected]
Company description
Established in 1918 and headquartered in Taipei, Tatung has
evolved into a conglomerate. Its businesses cover seven major
segments including digital display, home appliance, new energy,
ICT & energy solutions, heavy electrics, wire & cable, and motor.
The company is also involved in real estate development through
its subsidiaries.
Business risk profile: Fair
Relatively weak market position on major product
segment. Despite high domestic brand recognition for Tatung's
consumer products, its market position is substantially weaker
than its global competitors, and the mature and highly
competitive domestic market offers limited growth potential.
Tatung's digital display, thin film transistor liquid crystal display
(TFT-LCD) and solar energy businesses have only limited
market share due to weaker product offering and smaller
business scale compared with larger peers.
Weak, albeit improving, profitability. We expect Tatung's
strategy of focusing resources on the company's more profitable
power and system business and to dispose of
underperforming/non-core businesses to only gradually improve
Tatung's profitability. This is because the company's
restructuring moves have been slow and Tatung's core business
and long-term investment portfolio performance are likely to
remain largely unprofitable.
High industry risks and unfavorable industry
conditions. We categorize most of the businesses that Tatung
operates in as the technology hardware industry, which carries
industry risks such as volatile end-market demand, technology
risk and intense competition. Some of the business lines,
including PC manufacturing, TFT LCD and solar energy, face
particularly unfavorable industry conditions such as weak
demand, oversupply and fierce price competition.
Diversified business investments but with limited
benefits. Tatung has a diverse product mix and investment
portfolio, but their weak performance limits the diversification
benefit of reducing performance volatility through economic
cycles.
Financial risk profile: Significant
Weak but improving cash flow leverage. We expect
Tatung's financial risk profile to improve in the next one to two
years with better cash flow. We expect the company to continue
to dispose of its non-core underperforming subsidiaries and
reduce its debt level. This combined with more disciplined capital
expenditures at key subsidiaries will likely improve Tatung's
financial leverage, in our view. In addition, we believe the
company's substantial land assets could provide an additional
buffer to weather cash flow volatility.
High volatility of cash flow coverage ratios. We expect
Tatung's cash flow coverage ratios to remain volatile due to the
company's relatively weak competitive position, unfavorable
industry conditions, and high volatility in Tatung's major markets
However, we believe that Tatung's current credit metrics properly
reflect the negative effect of industry volatility, given the
company's restructuring and our view that Tatung's major
operating sectors are still near the trough of the current downturn.
(Mil. NT$) 2013 2012 2011
Revenues 112,926.9 106,098.5 146,250.2
EBITDA 10,726.1 1,692.0 9,579.6
Funds from operations (FFO) 7,226.9 (1,675.7) 5,995.0
Net income from continuing operations (5,319.7) (15,208.0) (11,993.3)
Cash flow from operations 5,750.1 5,486.3 (2,253.5)
Capital expenditures 4,916.4 7,319.6 12,465.7
Free operating cash flow 833.7 (1,833.3) (14,719.2)
Discretionary cash flow 833.7 (1,833.3) (14,719.2)
Cash and short-term investments 7,790.5 6,980.5 7,990.8
Debt 70,594.8 78,048.7 80,505.5
Equity 62,249.7 62,973.8 76,097.3
Adjusted rat ios
EBITDA margin (%) 9.5 1.6 6.6
Return on capital (%) (1.2) (7.9) (5.3)
EBITDA interest coverage (x) 3.3 0.5 3.3
FFO cash interest coverage (x) 2.8 0.5 4.5
Debt/EBITDA (x) 6.6 46.1 8.4
FFO/debt (%) 10.2 (2.1) 7.4
Cash flow from operations/debt (%) 8.1 7.0 (2.8)
Free operating cash flow/debt (%) 1.2 (2.3) (18.3)
Discretionary cash flow/debt (%) 1.2 (2.3) (18.3)
NT$--New Taiwan dollar. Note: Data are fully adjusted.
Tatung Company -- Financia l Summary
--Fiscal year ended Dec. 31--
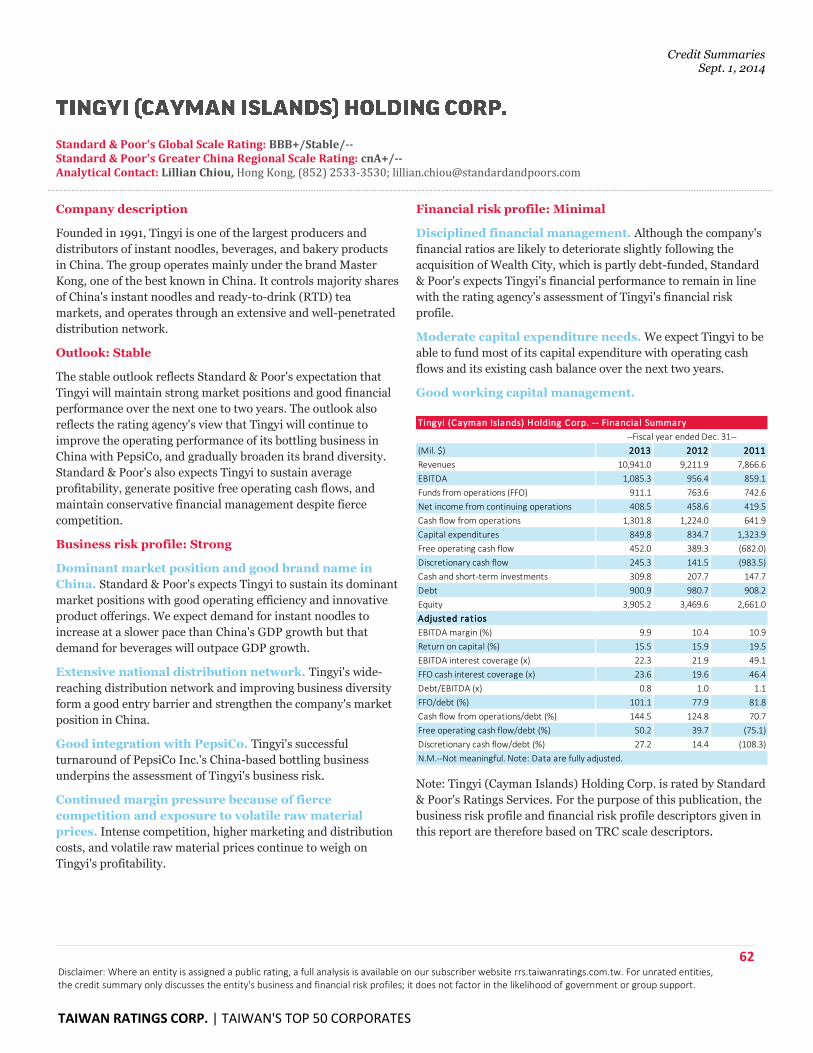
Credit Summaries Sept. 1, 2014
62 Disclaimer: Where an entity is assigned a public rating, a full analysis is available on our subscriber website rrs.taiwanratings.com.tw. For unrated entities, the credit summary only discusses the entity's business and financial risk profiles; it does not factor in the likelihood of government or group support.
TAIWAN RATINGS CORP. | TAIWAN'S TOP 50 CORPORATES
Standard & Poor's Global Scale Rating: BBB+/Stable/-- Standard & Poor's Greater China Regional Scale Rating: cnA+/-- Analytical Contact: Lillian Chiou, Hong Kong, (852) 2533-3530; [email protected]
Company description
Founded in 1991, Tingyi is one of the largest producers and
distributors of instant noodles, beverages, and bakery products
in China. The group operates mainly under the brand Master
Kong, one of the best known in China. It controls majority shares
of China's instant noodles and ready-to-drink (RTD) tea
markets, and operates through an extensive and well-penetrated
distribution network.
Outlook: Stable
The stable outlook reflects Standard & Poor's expectation that
Tingyi will maintain strong market positions and good financial
performance over the next one to two years. The outlook also
reflects the rating agency's view that Tingyi will continue to
improve the operating performance of its bottling business in
China with PepsiCo, and gradually broaden its brand diversity.
Standard & Poor's also expects Tingyi to sustain average
profitability, generate positive free operating cash flows, and
maintain conservative financial management despite fierce
competition.
Business risk profile: Strong
Dominant market position and good brand name in
China. Standard & Poor's expects Tingyi to sustain its dominant
market positions with good operating efficiency and innovative
product offerings. We expect demand for instant noodles to
increase at a slower pace than China's GDP growth but that
demand for beverages will outpace GDP growth.
Extensive national distribution network. Tingyi's wide-
reaching distribution network and improving business diversity
form a good entry barrier and strengthen the company's market
position in China.
Good integration with PepsiCo. Tingyi's successful
turnaround of PepsiCo Inc.'s China-based bottling business
underpins the assessment of Tingyi's business risk.
Continued margin pressure because of fierce
competition and exposure to volatile raw material
prices. Intense competition, higher marketing and distribution
costs, and volatile raw material prices continue to weigh on
Tingyi's profitability.
Financial risk profile: Minimal
Disciplined financial management. Although the company's
financial ratios are likely to deteriorate slightly following the
acquisition of Wealth City, which is partly debt-funded, Standard
& Poor's expects Tingyi's financial performance to remain in line
with the rating agency's assessment of Tingyi's financial risk
profile.
Moderate capital expenditure needs. We expect Tingyi to be
able to fund most of its capital expenditure with operating cash
flows and its existing cash balance over the next two years.
Good working capital management.
Note: Tingyi (Cayman Islands) Holding Corp. is rated by Standard
& Poor's Ratings Services. For the purpose of this publication, the
business risk profile and financial risk profile descriptors given in
this report are therefore based on TRC scale descriptors.
(Mil. $) 2013 2012 2011
Revenues 10,941.0 9,211.9 7,866.6
EBITDA 1,085.3 956.4 859.1
Funds from operations (FFO) 911.1 763.6 742.6
Net income from continuing operations 408.5 458.6 419.5
Cash flow from operations 1,301.8 1,224.0 641.9
Capital expenditures 849.8 834.7 1,323.9
Free operating cash flow 452.0 389.3 (682.0)
Discretionary cash flow 245.3 141.5 (983.5)
Cash and short-term investments 309.8 207.7 147.7
Debt 900.9 980.7 908.2
Equity 3,905.2 3,469.6 2,661.0
Adjusted rat ios
EBITDA margin (%) 9.9 10.4 10.9
Return on capital (%) 15.5 15.9 19.5
EBITDA interest coverage (x) 22.3 21.9 49.1
FFO cash interest coverage (x) 23.6 19.6 46.4
Debt/EBITDA (x) 0.8 1.0 1.1
FFO/debt (%) 101.1 77.9 81.8
Cash flow from operations/debt (%) 144.5 124.8 70.7
Free operating cash flow/debt (%) 50.2 39.7 (75.1)
Discretionary cash flow/debt (%) 27.2 14.4 (108.3)
N.M.--Not meaningful. Note: Data are fully adjusted.
Tingyi (Cayman Islands) Holding Corp. -- Financia l Summary
--Fiscal year ended Dec. 31--
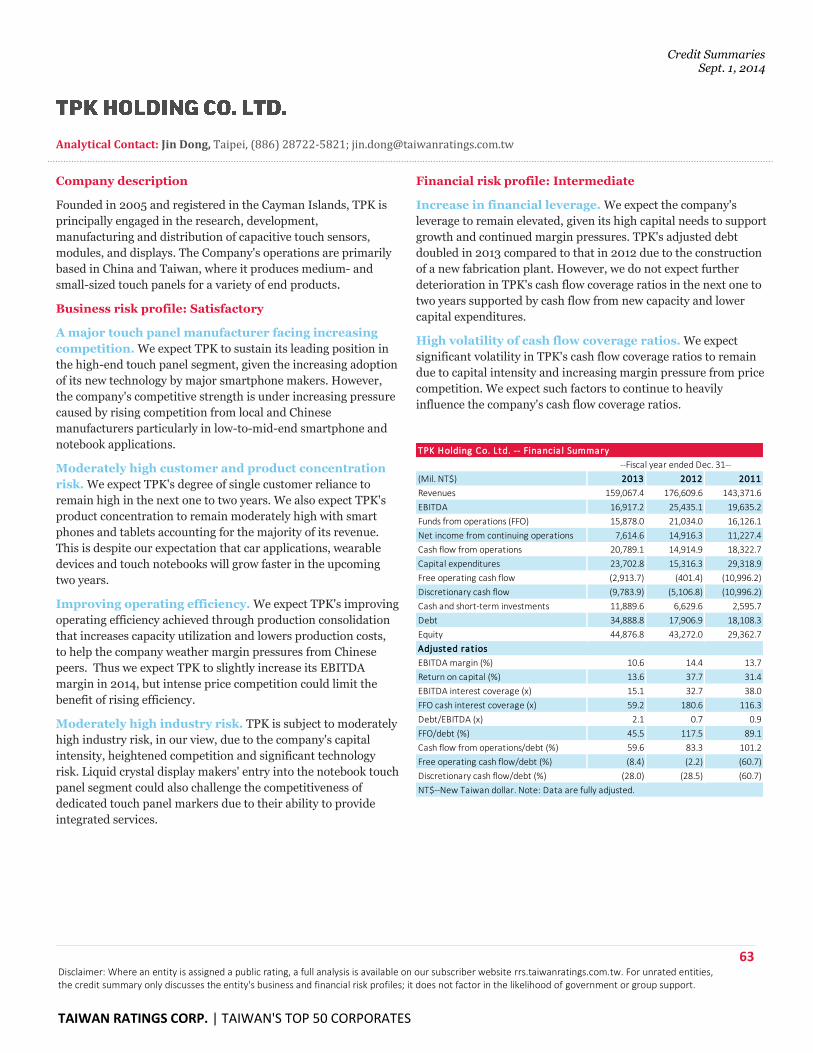
Credit Summaries Sept. 1, 2014
63 Disclaimer: Where an entity is assigned a public rating, a full analysis is available on our subscriber website rrs.taiwanratings.com.tw. For unrated entities, the credit summary only discusses the entity's business and financial risk profiles; it does not factor in the likelihood of government or group support.
TAIWAN RATINGS CORP. | TAIWAN'S TOP 50 CORPORATES
Analytical Contact: Jin Dong, Taipei, (886) 28722-5821; [email protected]
Company description
Founded in 2005 and registered in the Cayman Islands, TPK is
principally engaged in the research, development,
manufacturing and distribution of capacitive touch sensors,
modules, and displays. The Company's operations are primarily
based in China and Taiwan, where it produces medium- and
small-sized touch panels for a variety of end products.
Business risk profile: Satisfactory
A major touch panel manufacturer facing increasing
competition. We expect TPK to sustain its leading position in
the high-end touch panel segment, given the increasing adoption
of its new technology by major smartphone makers. However,
the company's competitive strength is under increasing pressure
caused by rising competition from local and Chinese
manufacturers particularly in low-to-mid-end smartphone and
notebook applications.
Moderately high customer and product concentration
risk. We expect TPK's degree of single customer reliance to
remain high in the next one to two years. We also expect TPK's
product concentration to remain moderately high with smart
phones and tablets accounting for the majority of its revenue.
This is despite our expectation that car applications, wearable
devices and touch notebooks will grow faster in the upcoming
two years.
Improving operating efficiency. We expect TPK's improving
operating efficiency achieved through production consolidation
that increases capacity utilization and lowers production costs,
to help the company weather margin pressures from Chinese
peers. Thus we expect TPK to slightly increase its EBITDA
margin in 2014, but intense price competition could limit the
benefit of rising efficiency.
Moderately high industry risk. TPK is subject to moderately
high industry risk, in our view, due to the company's capital
intensity, heightened competition and significant technology
risk. Liquid crystal display makers' entry into the notebook touch
panel segment could also challenge the competitiveness of
dedicated touch panel markers due to their ability to provide
integrated services.
Financial risk profile: Intermediate
Increase in financial leverage. We expect the company's
leverage to remain elevated, given its high capital needs to support
growth and continued margin pressures. TPK's adjusted debt
doubled in 2013 compared to that in 2012 due to the construction
of a new fabrication plant. However, we do not expect further
deterioration in TPK's cash flow coverage ratios in the next one to
two years supported by cash flow from new capacity and lower
capital expenditures.
High volatility of cash flow coverage ratios. We expect
significant volatility in TPK's cash flow coverage ratios to remain
due to capital intensity and increasing margin pressure from price
competition. We expect such factors to continue to heavily
influence the company's cash flow coverage ratios.
(Mil. NT$) 2013 2012 2011
Revenues 159,067.4 176,609.6 143,371.6
EBITDA 16,917.2 25,435.1 19,635.2
Funds from operations (FFO) 15,878.0 21,034.0 16,126.1
Net income from continuing operations 7,614.6 14,916.3 11,227.4
Cash flow from operations 20,789.1 14,914.9 18,322.7
Capital expenditures 23,702.8 15,316.3 29,318.9
Free operating cash flow (2,913.7) (401.4) (10,996.2)
Discretionary cash flow (9,783.9) (5,106.8) (10,996.2)
Cash and short-term investments 11,889.6 6,629.6 2,595.7
Debt 34,888.8 17,906.9 18,108.3
Equity 44,876.8 43,272.0 29,362.7
Adjusted rat ios
EBITDA margin (%) 10.6 14.4 13.7
Return on capital (%) 13.6 37.7 31.4
EBITDA interest coverage (x) 15.1 32.7 38.0
FFO cash interest coverage (x) 59.2 180.6 116.3
Debt/EBITDA (x) 2.1 0.7 0.9
FFO/debt (%) 45.5 117.5 89.1
Cash flow from operations/debt (%) 59.6 83.3 101.2
Free operating cash flow/debt (%) (8.4) (2.2) (60.7)
Discretionary cash flow/debt (%) (28.0) (28.5) (60.7)
NT$--New Taiwan dollar. Note: Data are fully adjusted.
TPK Holding Co. Ltd. -- Financia l Summary
--Fiscal year ended Dec. 31--
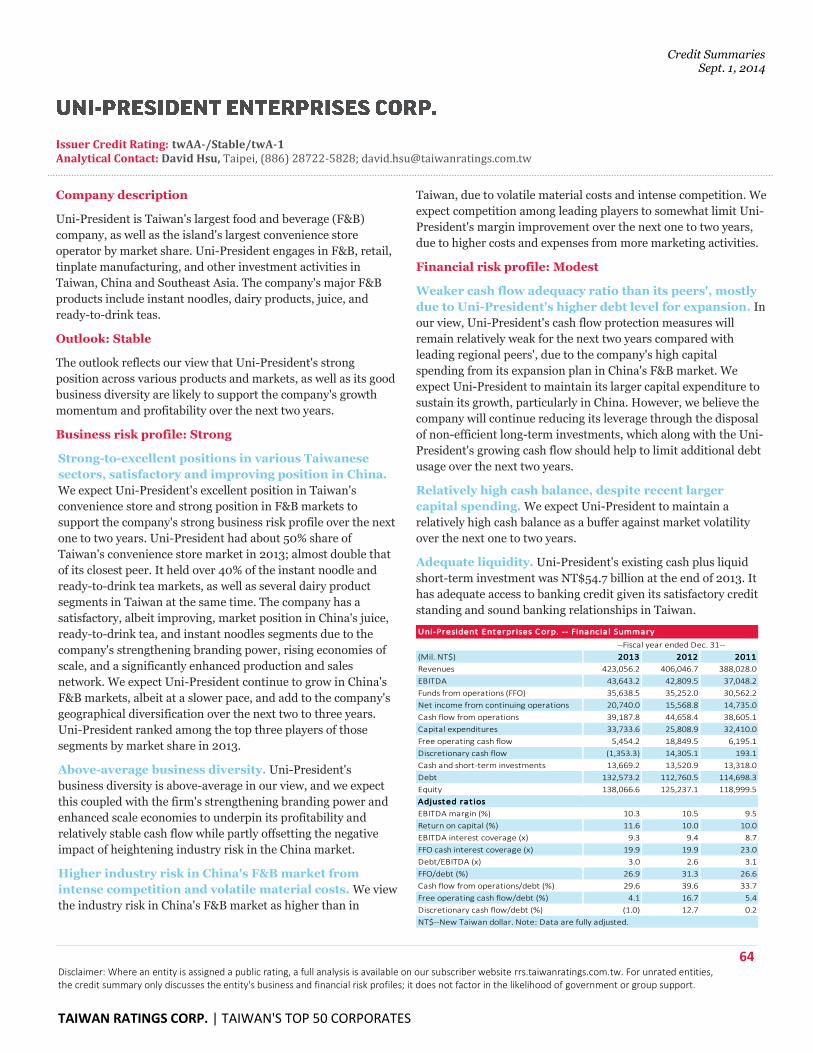
Credit Summaries Sept. 1, 2014
64 Disclaimer: Where an entity is assigned a public rating, a full analysis is available on our subscriber website rrs.taiwanratings.com.tw. For unrated entities, the credit summary only discusses the entity's business and financial risk profiles; it does not factor in the likelihood of government or group support.
TAIWAN RATINGS CORP. | TAIWAN'S TOP 50 CORPORATES
Issuer Credit Rating: twAA-/Stable/twA-1 Analytical Contact: David Hsu, Taipei, (886) 28722-5828; [email protected]
Company description
Uni-President is Taiwan's largest food and beverage (F&B)
company, as well as the island's largest convenience store
operator by market share. Uni-President engages in F&B, retail,
tinplate manufacturing, and other investment activities in
Taiwan, China and Southeast Asia. The company's major F&B
products include instant noodles, dairy products, juice, and
ready-to-drink teas.
Outlook: Stable
The outlook reflects our view that Uni-President's strong
position across various products and markets, as well as its good
business diversity are likely to support the company's growth
momentum and profitability over the next two years.
Business risk profile: Strong
Strong-to-excellent positions in various Taiwanese
sectors, satisfactory and improving position in China.
We expect Uni-President's excellent position in Taiwan's
convenience store and strong position in F&B markets to
support the company's strong business risk profile over the next
one to two years. Uni-President had about 50% share of
Taiwan's convenience store market in 2013; almost double that
of its closest peer. It held over 40% of the instant noodle and
ready-to-drink tea markets, as well as several dairy product
segments in Taiwan at the same time. The company has a
satisfactory, albeit improving, market position in China's juice,
ready-to-drink tea, and instant noodles segments due to the
company's strengthening branding power, rising economies of
scale, and a significantly enhanced production and sales
network. We expect Uni-President continue to grow in China's
F&B markets, albeit at a slower pace, and add to the company's
geographical diversification over the next two to three years.
Uni-President ranked among the top three players of those
segments by market share in 2013.
Above-average business diversity. Uni-President's
business diversity is above-average in our view, and we expect
this coupled with the firm's strengthening branding power and
enhanced scale economies to underpin its profitability and
relatively stable cash flow while partly offsetting the negative
impact of heightening industry risk in the China market.
Higher industry risk in China's F&B market from
intense competition and volatile material costs. We view
the industry risk in China's F&B market as higher than in
Taiwan, due to volatile material costs and intense competition. We
expect competition among leading players to somewhat limit Uni-
President's margin improvement over the next one to two years,
due to higher costs and expenses from more marketing activities.
Financial risk profile: Modest
Weaker cash flow adequacy ratio than its peers', mostly
due to Uni-President's higher debt level for expansion. In
our view, Uni-President's cash flow protection measures will
remain relatively weak for the next two years compared with
leading regional peers', due to the company's high capital
spending from its expansion plan in China's F&B market. We
expect Uni-President to maintain its larger capital expenditure to
sustain its growth, particularly in China. However, we believe the
company will continue reducing its leverage through the disposal
of non-efficient long-term investments, which along with the Uni-
President's growing cash flow should help to limit additional debt
usage over the next two years.
Relatively high cash balance, despite recent larger
capital spending. We expect Uni-President to maintain a
relatively high cash balance as a buffer against market volatility
over the next one to two years.
Adequate liquidity. Uni-President's existing cash plus liquid
short-term investment was NT$54.7 billion at the end of 2013. It
has adequate access to banking credit given its satisfactory credit
standing and sound banking relationships in Taiwan.
(Mil. NT$) 2013 2012 2011
Revenues 423,056.2 406,046.7 388,028.0
EBITDA 43,643.2 42,809.5 37,048.2
Funds from operations (FFO) 35,638.5 35,252.0 30,562.2
Net income from continuing operations 20,740.0 15,568.8 14,735.0
Cash flow from operations 39,187.8 44,658.4 38,605.1
Capital expenditures 33,733.6 25,808.9 32,410.0
Free operating cash flow 5,454.2 18,849.5 6,195.1
Discretionary cash flow (1,353.3) 14,305.1 193.1
Cash and short-term investments 13,669.2 13,520.9 13,318.0
Debt 132,573.2 112,760.5 114,698.3
Equity 138,066.6 125,237.1 118,999.5
Adjusted rat ios
EBITDA margin (%) 10.3 10.5 9.5
Return on capital (%) 11.6 10.0 10.0
EBITDA interest coverage (x) 9.3 9.4 8.7
FFO cash interest coverage (x) 19.9 19.9 23.0
Debt/EBITDA (x) 3.0 2.6 3.1
FFO/debt (%) 26.9 31.3 26.6
Cash flow from operations/debt (%) 29.6 39.6 33.7
Free operating cash flow/debt (%) 4.1 16.7 5.4
Discretionary cash flow/debt (%) (1.0) 12.7 0.2
NT$--New Taiwan dollar. Note: Data are fully adjusted.
Uni-President Enterprises Corp. -- Financia l Summary
--Fiscal year ended Dec. 31--
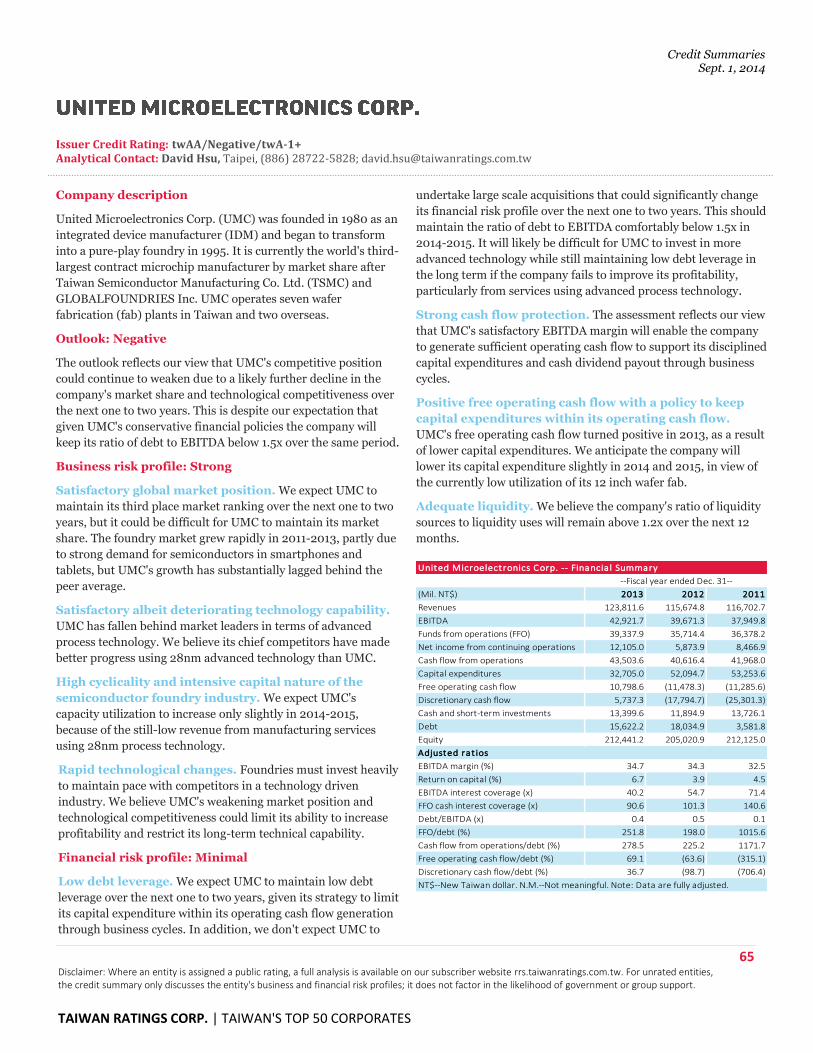
Credit Summaries Sept. 1, 2014
65 Disclaimer: Where an entity is assigned a public rating, a full analysis is available on our subscriber website rrs.taiwanratings.com.tw. For unrated entities, the credit summary only discusses the entity's business and financial risk profiles; it does not factor in the likelihood of government or group support.
TAIWAN RATINGS CORP. | TAIWAN'S TOP 50 CORPORATES
Issuer Credit Rating: twAA/Negative/twA-1+ Analytical Contact: David Hsu, Taipei, (886) 28722-5828; [email protected]
Company description
United Microelectronics Corp. (UMC) was founded in 1980 as an
integrated device manufacturer (IDM) and began to transform
into a pure-play foundry in 1995. It is currently the world's third-
largest contract microchip manufacturer by market share after
Taiwan Semiconductor Manufacturing Co. Ltd. (TSMC) and
GLOBALFOUNDRIES Inc. UMC operates seven wafer
fabrication (fab) plants in Taiwan and two overseas.
Outlook: Negative
The outlook reflects our view that UMC's competitive position
could continue to weaken due to a likely further decline in the
company's market share and technological competitiveness over
the next one to two years. This is despite our expectation that
given UMC's conservative financial policies the company will
keep its ratio of debt to EBITDA below 1.5x over the same period.
Business risk profile: Strong
Satisfactory global market position. We expect UMC to
maintain its third place market ranking over the next one to two
years, but it could be difficult for UMC to maintain its market
share. The foundry market grew rapidly in 2011-2013, partly due
to strong demand for semiconductors in smartphones and
tablets, but UMC's growth has substantially lagged behind the
peer average.
Satisfactory albeit deteriorating technology capability.
UMC has fallen behind market leaders in terms of advanced
process technology. We believe its chief competitors have made
better progress using 28nm advanced technology than UMC.
High cyclicality and intensive capital nature of the
semiconductor foundry industry. We expect UMC's
capacity utilization to increase only slightly in 2014-2015,
because of the still-low revenue from manufacturing services
using 28nm process technology.
Rapid technological changes. Foundries must invest heavily
to maintain pace with competitors in a technology driven
industry. We believe UMC's weakening market position and
technological competitiveness could limit its ability to increase
profitability and restrict its long-term technical capability.
Financial risk profile: Minimal
Low debt leverage. We expect UMC to maintain low debt
leverage over the next one to two years, given its strategy to limit
its capital expenditure within its operating cash flow generation
through business cycles. In addition, we don't expect UMC to
undertake large scale acquisitions that could significantly change
its financial risk profile over the next one to two years. This should
maintain the ratio of debt to EBITDA comfortably below 1.5x in
2014-2015. It will likely be difficult for UMC to invest in more
advanced technology while still maintaining low debt leverage in
the long term if the company fails to improve its profitability,
particularly from services using advanced process technology.
Strong cash flow protection. The assessment reflects our view
that UMC's satisfactory EBITDA margin will enable the company
to generate sufficient operating cash flow to support its disciplined
capital expenditures and cash dividend payout through business
cycles.
Positive free operating cash flow with a policy to keep
capital expenditures within its operating cash flow.
UMC's free operating cash flow turned positive in 2013, as a result
of lower capital expenditures. We anticipate the company will
lower its capital expenditure slightly in 2014 and 2015, in view of
the currently low utilization of its 12 inch wafer fab.
Adequate liquidity. We believe the company's ratio of liquidity
sources to liquidity uses will remain above 1.2x over the next 12
months.
(Mil. NT$) 2013 2012 2011
Revenues 123,811.6 115,674.8 116,702.7
EBITDA 42,921.7 39,671.3 37,949.8
Funds from operations (FFO) 39,337.9 35,714.4 36,378.2
Net income from continuing operations 12,105.0 5,873.9 8,466.9
Cash flow from operations 43,503.6 40,616.4 41,968.0
Capital expenditures 32,705.0 52,094.7 53,253.6
Free operating cash flow 10,798.6 (11,478.3) (11,285.6)
Discretionary cash flow 5,737.3 (17,794.7) (25,301.3)
Cash and short-term investments 13,399.6 11,894.9 13,726.1
Debt 15,622.2 18,034.9 3,581.8
Equity 212,441.2 205,020.9 212,125.0
Adjusted rat ios
EBITDA margin (%) 34.7 34.3 32.5
Return on capital (%) 6.7 3.9 4.5
EBITDA interest coverage (x) 40.2 54.7 71.4
FFO cash interest coverage (x) 90.6 101.3 140.6
Debt/EBITDA (x) 0.4 0.5 0.1
FFO/debt (%) 251.8 198.0 1015.6
Cash flow from operations/debt (%) 278.5 225.2 1171.7
Free operating cash flow/debt (%) 69.1 (63.6) (315.1)
Discretionary cash flow/debt (%) 36.7 (98.7) (706.4)
NT$--New Taiwan dollar. N.M.--Not meaningful. Note: Data are fully adjusted.
United Microelectronics Corp. -- Financia l Summary
--Fiscal year ended Dec. 31--
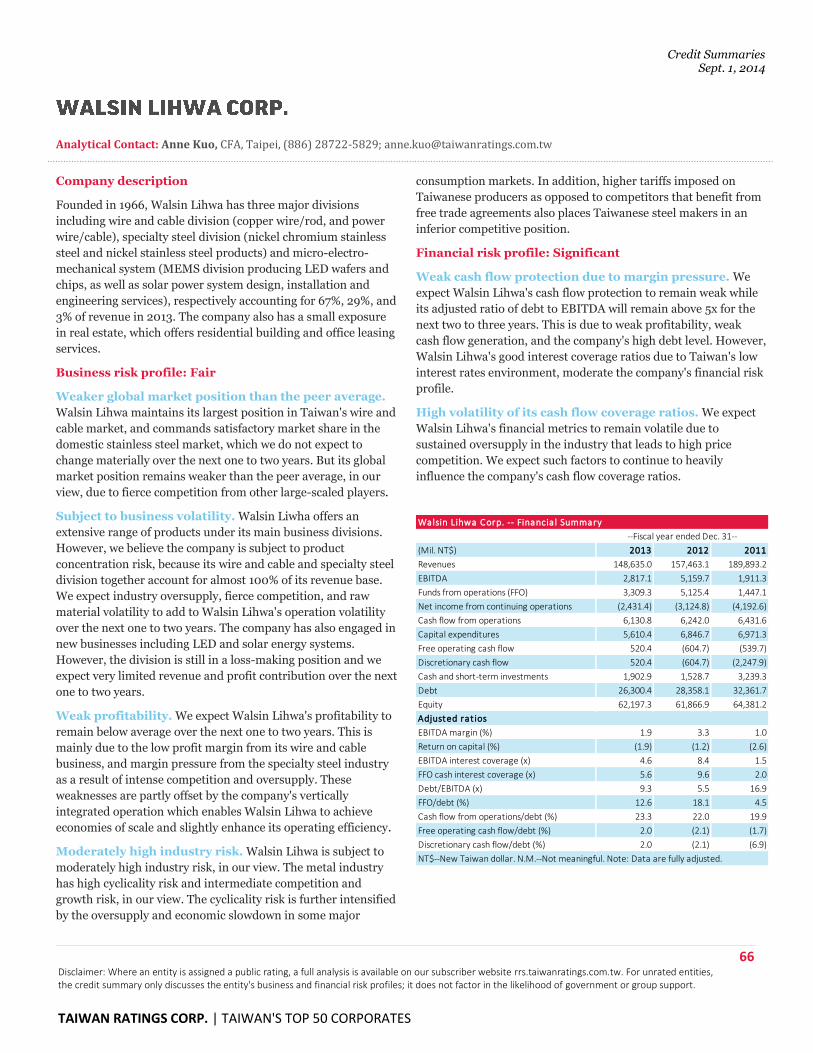
Credit Summaries Sept. 1, 2014
66 Disclaimer: Where an entity is assigned a public rating, a full analysis is available on our subscriber website rrs.taiwanratings.com.tw. For unrated entities, the credit summary only discusses the entity's business and financial risk profiles; it does not factor in the likelihood of government or group support.
TAIWAN RATINGS CORP. | TAIWAN'S TOP 50 CORPORATES
Analytical Contact: Anne Kuo, CFA, Taipei, (886) 28722-5829; [email protected]
Company description
Founded in 1966, Walsin Lihwa has three major divisions
including wire and cable division (copper wire/rod, and power
wire/cable), specialty steel division (nickel chromium stainless
steel and nickel stainless steel products) and micro-electro-
mechanical system (MEMS division producing LED wafers and
chips, as well as solar power system design, installation and
engineering services), respectively accounting for 67%, 29%, and
3% of revenue in 2013. The company also has a small exposure
in real estate, which offers residential building and office leasing
services.
Business risk profile: Fair
Weaker global market position than the peer average.
Walsin Lihwa maintains its largest position in Taiwan's wire and
cable market, and commands satisfactory market share in the
domestic stainless steel market, which we do not expect to
change materially over the next one to two years. But its global
market position remains weaker than the peer average, in our
view, due to fierce competition from other large-scaled players.
Subject to business volatility. Walsin Liwha offers an
extensive range of products under its main business divisions.
However, we believe the company is subject to product
concentration risk, because its wire and cable and specialty steel
division together account for almost 100% of its revenue base.
We expect industry oversupply, fierce competition, and raw
material volatility to add to Walsin Lihwa's operation volatility
over the next one to two years. The company has also engaged in
new businesses including LED and solar energy systems.
However, the division is still in a loss-making position and we
expect very limited revenue and profit contribution over the next
one to two years.
Weak profitability. We expect Walsin Lihwa's profitability to
remain below average over the next one to two years. This is
mainly due to the low profit margin from its wire and cable
business, and margin pressure from the specialty steel industry
as a result of intense competition and oversupply. These
weaknesses are partly offset by the company's vertically
integrated operation which enables Walsin Lihwa to achieve
economies of scale and slightly enhance its operating efficiency.
Moderately high industry risk. Walsin Lihwa is subject to
moderately high industry risk, in our view. The metal industry
has high cyclicality risk and intermediate competition and
growth risk, in our view. The cyclicality risk is further intensified
by the oversupply and economic slowdown in some major
consumption markets. In addition, higher tariffs imposed on
Taiwanese producers as opposed to competitors that benefit from
free trade agreements also places Taiwanese steel makers in an
inferior competitive position.
Financial risk profile: Significant
Weak cash flow protection due to margin pressure. We
expect Walsin Lihwa's cash flow protection to remain weak while
its adjusted ratio of debt to EBITDA will remain above 5x for the
next two to three years. This is due to weak profitability, weak
cash flow generation, and the company's high debt level. However,
Walsin Lihwa's good interest coverage ratios due to Taiwan's low
interest rates environment, moderate the company's financial risk
profile.
High volatility of its cash flow coverage ratios. We expect
Walsin Lihwa's financial metrics to remain volatile due to
sustained oversupply in the industry that leads to high price
competition. We expect such factors to continue to heavily
influence the company's cash flow coverage ratios.
(Mil. NT$) 2013 2012 2011
Revenues 148,635.0 157,463.1 189,893.2
EBITDA 2,817.1 5,159.7 1,911.3
Funds from operations (FFO) 3,309.3 5,125.4 1,447.1
Net income from continuing operations (2,431.4) (3,124.8) (4,192.6)
Cash flow from operations 6,130.8 6,242.0 6,431.6
Capital expenditures 5,610.4 6,846.7 6,971.3
Free operating cash flow 520.4 (604.7) (539.7)
Discretionary cash flow 520.4 (604.7) (2,247.9)
Cash and short-term investments 1,902.9 1,528.7 3,239.3
Debt 26,300.4 28,358.1 32,361.7
Equity 62,197.3 61,866.9 64,381.2
Adjusted rat ios
EBITDA margin (%) 1.9 3.3 1.0
Return on capital (%) (1.9) (1.2) (2.6)
EBITDA interest coverage (x) 4.6 8.4 1.5
FFO cash interest coverage (x) 5.6 9.6 2.0
Debt/EBITDA (x) 9.3 5.5 16.9
FFO/debt (%) 12.6 18.1 4.5
Cash flow from operations/debt (%) 23.3 22.0 19.9
Free operating cash flow/debt (%) 2.0 (2.1) (1.7)
Discretionary cash flow/debt (%) 2.0 (2.1) (6.9)
NT$--New Taiwan dollar. N.M.--Not meaningful. Note: Data are fully adjusted.
Walsin Lihwa Corp. -- Financia l Summary
--Fiscal year ended Dec. 31--
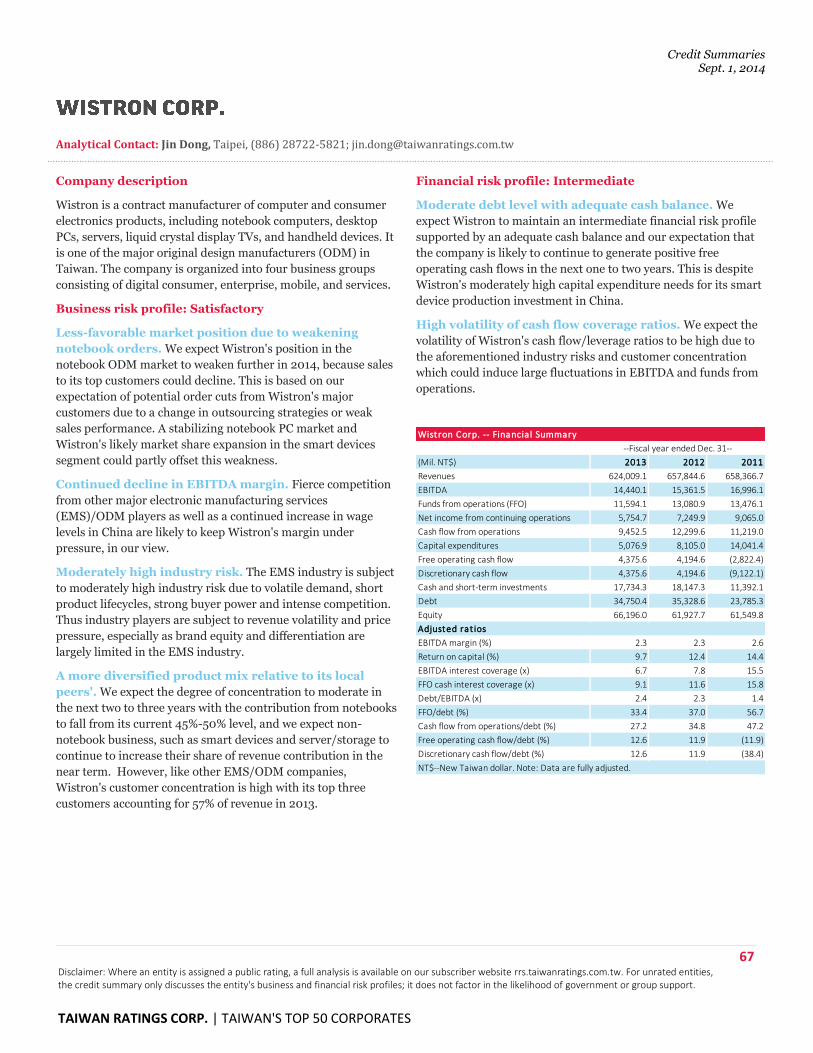
Credit Summaries Sept. 1, 2014
67 Disclaimer: Where an entity is assigned a public rating, a full analysis is available on our subscriber website rrs.taiwanratings.com.tw. For unrated entities, the credit summary only discusses the entity's business and financial risk profiles; it does not factor in the likelihood of government or group support.
TAIWAN RATINGS CORP. | TAIWAN'S TOP 50 CORPORATES
Analytical Contact: Jin Dong, Taipei, (886) 28722-5821; [email protected]
Company description
Wistron is a contract manufacturer of computer and consumer
electronics products, including notebook computers, desktop
PCs, servers, liquid crystal display TVs, and handheld devices. It
is one of the major original design manufacturers (ODM) in
Taiwan. The company is organized into four business groups
consisting of digital consumer, enterprise, mobile, and services.
Business risk profile: Satisfactory
Less-favorable market position due to weakening
notebook orders. We expect Wistron's position in the
notebook ODM market to weaken further in 2014, because sales
to its top customers could decline. This is based on our
expectation of potential order cuts from Wistron's major
customers due to a change in outsourcing strategies or weak
sales performance. A stabilizing notebook PC market and
Wistron's likely market share expansion in the smart devices
segment could partly offset this weakness.
Continued decline in EBITDA margin. Fierce competition
from other major electronic manufacturing services
(EMS)/ODM players as well as a continued increase in wage
levels in China are likely to keep Wistron's margin under
pressure, in our view.
Moderately high industry risk. The EMS industry is subject
to moderately high industry risk due to volatile demand, short
product lifecycles, strong buyer power and intense competition.
Thus industry players are subject to revenue volatility and price
pressure, especially as brand equity and differentiation are
largely limited in the EMS industry.
A more diversified product mix relative to its local
peers'. We expect the degree of concentration to moderate in
the next two to three years with the contribution from notebooks
to fall from its current 45%-50% level, and we expect non-
notebook business, such as smart devices and server/storage to
continue to increase their share of revenue contribution in the
near term. However, like other EMS/ODM companies,
Wistron's customer concentration is high with its top three
customers accounting for 57% of revenue in 2013.
Financial risk profile: Intermediate
Moderate debt level with adequate cash balance. We
expect Wistron to maintain an intermediate financial risk profile
supported by an adequate cash balance and our expectation that
the company is likely to continue to generate positive free
operating cash flows in the next one to two years. This is despite
Wistron's moderately high capital expenditure needs for its smart
device production investment in China.
High volatility of cash flow coverage ratios. We expect the
volatility of Wistron's cash flow/leverage ratios to be high due to
the aforementioned industry risks and customer concentration
which could induce large fluctuations in EBITDA and funds from
operations.
(Mil. NT$) 2013 2012 2011
Revenues 624,009.1 657,844.6 658,366.7
EBITDA 14,440.1 15,361.5 16,996.1
Funds from operations (FFO) 11,594.1 13,080.9 13,476.1
Net income from continuing operations 5,754.7 7,249.9 9,065.0
Cash flow from operations 9,452.5 12,299.6 11,219.0
Capital expenditures 5,076.9 8,105.0 14,041.4
Free operating cash flow 4,375.6 4,194.6 (2,822.4)
Discretionary cash flow 4,375.6 4,194.6 (9,122.1)
Cash and short-term investments 17,734.3 18,147.3 11,392.1
Debt 34,750.4 35,328.6 23,785.3
Equity 66,196.0 61,927.7 61,549.8
Adjusted rat ios
EBITDA margin (%) 2.3 2.3 2.6
Return on capital (%) 9.7 12.4 14.4
EBITDA interest coverage (x) 6.7 7.8 15.5
FFO cash interest coverage (x) 9.1 11.6 15.8
Debt/EBITDA (x) 2.4 2.3 1.4
FFO/debt (%) 33.4 37.0 56.7
Cash flow from operations/debt (%) 27.2 34.8 47.2
Free operating cash flow/debt (%) 12.6 11.9 (11.9)
Discretionary cash flow/debt (%) 12.6 11.9 (38.4)
NT$--New Taiwan dollar. Note: Data are fully adjusted.
Wistron Corp. -- Financia l Summary
--Fiscal year ended Dec. 31--
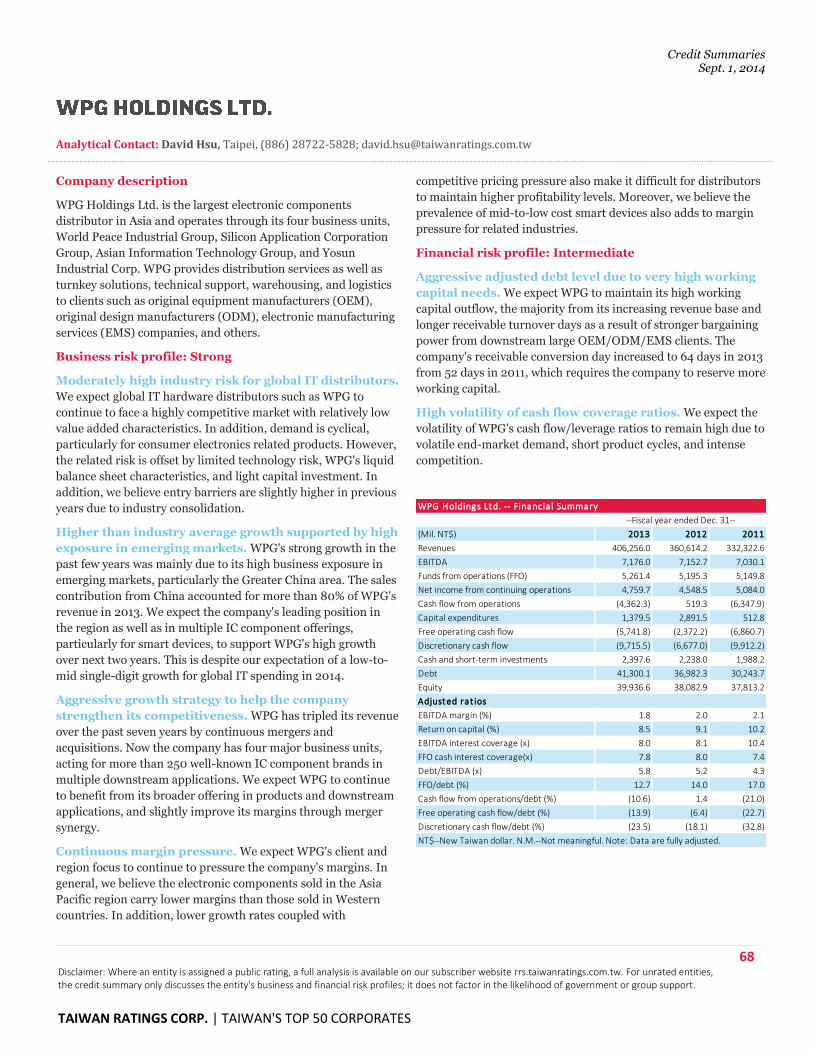
Credit Summaries Sept. 1, 2014
68 Disclaimer: Where an entity is assigned a public rating, a full analysis is available on our subscriber website rrs.taiwanratings.com.tw. For unrated entities, the credit summary only discusses the entity's business and financial risk profiles; it does not factor in the likelihood of government or group support.
TAIWAN RATINGS CORP. | TAIWAN'S TOP 50 CORPORATES
Analytical Contact: David Hsu, Taipei, (886) 28722-5828; [email protected]
Company description
WPG Holdings Ltd. is the largest electronic components
distributor in Asia and operates through its four business units,
World Peace Industrial Group, Silicon Application Corporation
Group, Asian Information Technology Group, and Yosun
Industrial Corp. WPG provides distribution services as well as
turnkey solutions, technical support, warehousing, and logistics
to clients such as original equipment manufacturers (OEM),
original design manufacturers (ODM), electronic manufacturing
services (EMS) companies, and others.
Business risk profile: Strong
Moderately high industry risk for global IT distributors.
We expect global IT hardware distributors such as WPG to
continue to face a highly competitive market with relatively low
value added characteristics. In addition, demand is cyclical,
particularly for consumer electronics related products. However,
the related risk is offset by limited technology risk, WPG's liquid
balance sheet characteristics, and light capital investment. In
addition, we believe entry barriers are slightly higher in previous
years due to industry consolidation.
Higher than industry average growth supported by high
exposure in emerging markets. WPG's strong growth in the
past few years was mainly due to its high business exposure in
emerging markets, particularly the Greater China area. The sales
contribution from China accounted for more than 80% of WPG's
revenue in 2013. We expect the company's leading position in
the region as well as in multiple IC component offerings,
particularly for smart devices, to support WPG's high growth
over next two years. This is despite our expectation of a low-to-
mid single-digit growth for global IT spending in 2014.
Aggressive growth strategy to help the company
strengthen its competitiveness. WPG has tripled its revenue
over the past seven years by continuous mergers and
acquisitions. Now the company has four major business units,
acting for more than 250 well-known IC component brands in
multiple downstream applications. We expect WPG to continue
to benefit from its broader offering in products and downstream
applications, and slightly improve its margins through merger
synergy.
Continuous margin pressure. We expect WPG's client and
region focus to continue to pressure the company's margins. In
general, we believe the electronic components sold in the Asia
Pacific region carry lower margins than those sold in Western
countries. In addition, lower growth rates coupled with
competitive pricing pressure also make it difficult for distributors
to maintain higher profitability levels. Moreover, we believe the
prevalence of mid-to-low cost smart devices also adds to margin
pressure for related industries.
Financial risk profile: Intermediate
Aggressive adjusted debt level due to very high working
capital needs. We expect WPG to maintain its high working
capital outflow, the majority from its increasing revenue base and
longer receivable turnover days as a result of stronger bargaining
power from downstream large OEM/ODM/EMS clients. The
company's receivable conversion day increased to 64 days in 2013
from 52 days in 2011, which requires the company to reserve more
working capital.
High volatility of cash flow coverage ratios. We expect the
volatility of WPG's cash flow/leverage ratios to remain high due to
volatile end-market demand, short product cycles, and intense
competition.
(Mil. NT$) 2013 2012 2011
Revenues 406,256.0 360,614.2 332,322.6
EBITDA 7,176.0 7,152.7 7,030.1
Funds from operations (FFO) 5,261.4 5,195.3 5,149.8
Net income from continuing operations 4,759.7 4,548.5 5,084.0
Cash flow from operations (4,362.3) 519.3 (6,347.9)
Capital expenditures 1,379.5 2,891.5 512.8
Free operating cash flow (5,741.8) (2,372.2) (6,860.7)
Discretionary cash flow (9,715.5) (6,677.0) (9,912.2)
Cash and short-term investments 2,397.6 2,238.0 1,988.2
Debt 41,300.1 36,982.3 30,243.7
Equity 39,936.6 38,082.9 37,813.2
Adjusted rat ios
EBITDA margin (%) 1.8 2.0 2.1
Return on capital (%) 8.5 9.1 10.2
EBITDA interest coverage (x) 8.0 8.1 10.4
FFO cash interest coverage(x) 7.8 8.0 7.4
Debt/EBITDA (x) 5.8 5.2 4.3
FFO/debt (%) 12.7 14.0 17.0
Cash flow from operations/debt (%) (10.6) 1.4 (21.0)
Free operating cash flow/debt (%) (13.9) (6.4) (22.7)
Discretionary cash flow/debt (%) (23.5) (18.1) (32.8)
NT$--New Taiwan dollar. N.M.--Not meaningful. Note: Data are fully adjusted.
WPG Holdings Ltd. -- Financia l Summary
--Fiscal year ended Dec. 31--
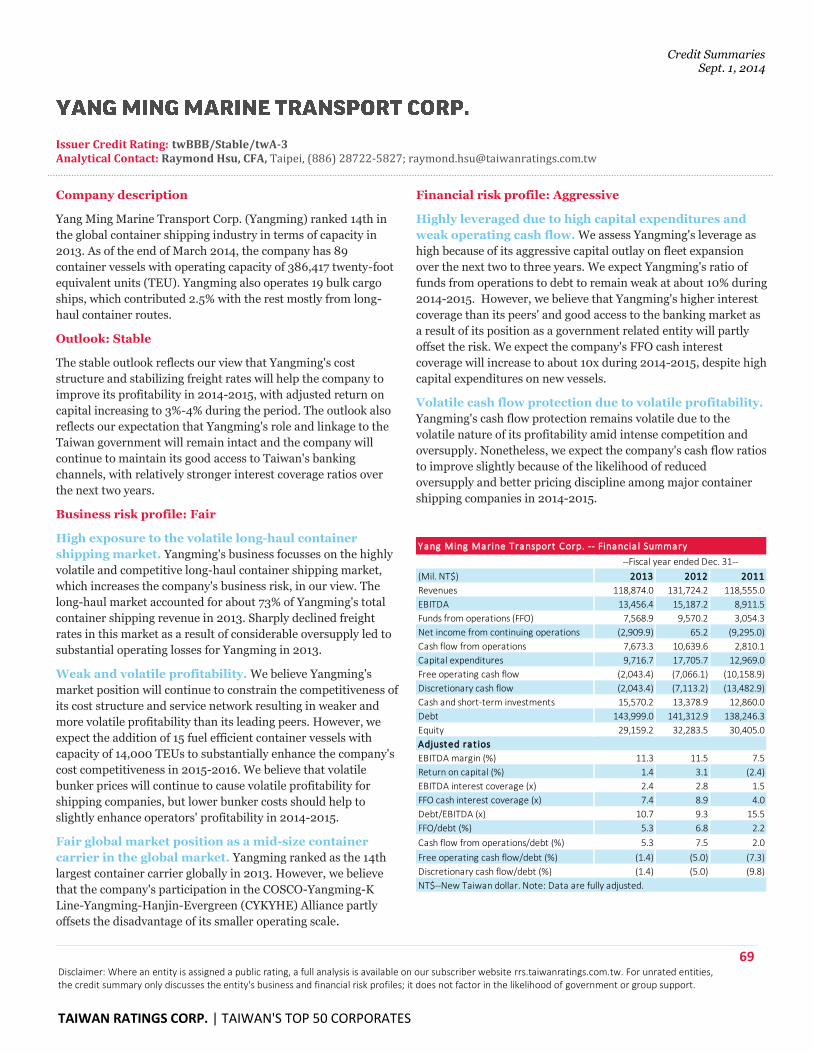
Credit Summaries Sept. 1, 2014
69 Disclaimer: Where an entity is assigned a public rating, a full analysis is available on our subscriber website rrs.taiwanratings.com.tw. For unrated entities, the credit summary only discusses the entity's business and financial risk profiles; it does not factor in the likelihood of government or group support.
TAIWAN RATINGS CORP. | TAIWAN'S TOP 50 CORPORATES
Issuer Credit Rating: twBBB/Stable/twA-3 Analytical Contact: Raymond Hsu, CFA, Taipei, (886) 28722-5827; [email protected]
Company description
Yang Ming Marine Transport Corp. (Yangming) ranked 14th in
the global container shipping industry in terms of capacity in
2013. As of the end of March 2014, the company has 89
container vessels with operating capacity of 386,417 twenty-foot
equivalent units (TEU). Yangming also operates 19 bulk cargo
ships, which contributed 2.5% with the rest mostly from long-
haul container routes.
Outlook: Stable
The stable outlook reflects our view that Yangming's cost
structure and stabilizing freight rates will help the company to
improve its profitability in 2014-2015, with adjusted return on
capital increasing to 3%-4% during the period. The outlook also
reflects our expectation that Yangming's role and linkage to the
Taiwan government will remain intact and the company will
continue to maintain its good access to Taiwan's banking
channels, with relatively stronger interest coverage ratios over
the next two years.
Business risk profile: Fair
High exposure to the volatile long-haul container
shipping market. Yangming's business focusses on the highly
volatile and competitive long-haul container shipping market,
which increases the company's business risk, in our view. The
long-haul market accounted for about 73% of Yangming's total
container shipping revenue in 2013. Sharply declined freight
rates in this market as a result of considerable oversupply led to
substantial operating losses for Yangming in 2013.
Weak and volatile profitability. We believe Yangming's
market position will continue to constrain the competitiveness of
its cost structure and service network resulting in weaker and
more volatile profitability than its leading peers. However, we
expect the addition of 15 fuel efficient container vessels with
capacity of 14,000 TEUs to substantially enhance the company's
cost competitiveness in 2015-2016. We believe that volatile
bunker prices will continue to cause volatile profitability for
shipping companies, but lower bunker costs should help to
slightly enhance operators' profitability in 2014-2015.
Fair global market position as a mid-size container
carrier in the global market. Yangming ranked as the 14th
largest container carrier globally in 2013. However, we believe
that the company's participation in the COSCO-Yangming-K
Line-Yangming-Hanjin-Evergreen (CYKYHE) Alliance partly
offsets the disadvantage of its smaller operating scale.
Financial risk profile: Aggressive
Highly leveraged due to high capital expenditures and
weak operating cash flow. We assess Yangming's leverage as
high because of its aggressive capital outlay on fleet expansion
over the next two to three years. We expect Yangming's ratio of
funds from operations to debt to remain weak at about 10% during
2014-2015. However, we believe that Yangming's higher interest
coverage than its peers' and good access to the banking market as
a result of its position as a government related entity will partly
offset the risk. We expect the company's FFO cash interest
coverage will increase to about 10x during 2014-2015, despite high
capital expenditures on new vessels.
Volatile cash flow protection due to volatile profitability.
Yangming's cash flow protection remains volatile due to the
volatile nature of its profitability amid intense competition and
oversupply. Nonetheless, we expect the company's cash flow ratios
to improve slightly because of the likelihood of reduced
oversupply and better pricing discipline among major container
shipping companies in 2014-2015.
(Mil. NT$) 2013 2012 2011
Revenues 118,874.0 131,724.2 118,555.0
EBITDA 13,456.4 15,187.2 8,911.5
Funds from operations (FFO) 7,568.9 9,570.2 3,054.3
Net income from continuing operations (2,909.9) 65.2 (9,295.0)
Cash flow from operations 7,673.3 10,639.6 2,810.1
Capital expenditures 9,716.7 17,705.7 12,969.0
Free operating cash flow (2,043.4) (7,066.1) (10,158.9)
Discretionary cash flow (2,043.4) (7,113.2) (13,482.9)
Cash and short-term investments 15,570.2 13,378.9 12,860.0
Debt 143,999.0 141,312.9 138,246.3
Equity 29,159.2 32,283.5 30,405.0
Adjusted rat ios
EBITDA margin (%) 11.3 11.5 7.5
Return on capital (%) 1.4 3.1 (2.4)
EBITDA interest coverage (x) 2.4 2.8 1.5
FFO cash interest coverage (x) 7.4 8.9 4.0
Debt/EBITDA (x) 10.7 9.3 15.5
FFO/debt (%) 5.3 6.8 2.2
Cash flow from operations/debt (%) 5.3 7.5 2.0
Free operating cash flow/debt (%) (1.4) (5.0) (7.3)
Discretionary cash flow/debt (%) (1.4) (5.0) (9.8)
NT$--New Taiwan dollar. Note: Data are fully adjusted.
--Fiscal year ended Dec. 31--
Yang Ming Marine Transport Corp. -- Financia l Summary
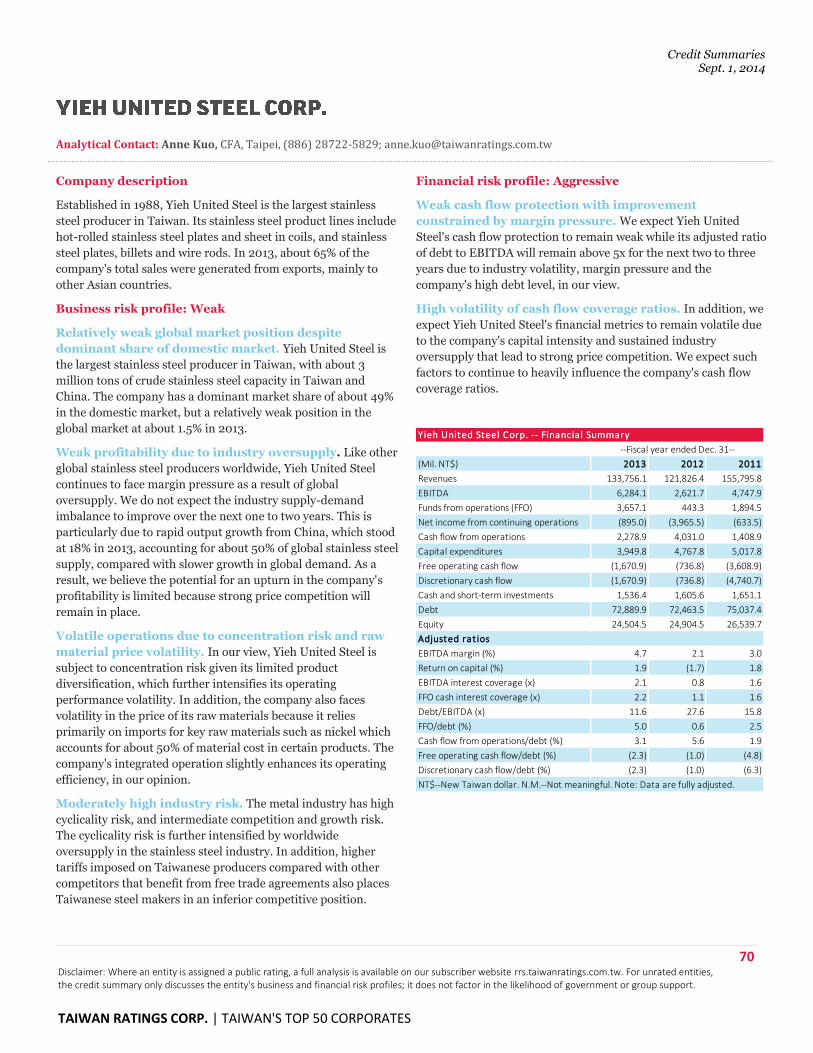
Credit Summaries Sept. 1, 2014
70 Disclaimer: Where an entity is assigned a public rating, a full analysis is available on our subscriber website rrs.taiwanratings.com.tw. For unrated entities, the credit summary only discusses the entity's business and financial risk profiles; it does not factor in the likelihood of government or group support.
TAIWAN RATINGS CORP. | TAIWAN'S TOP 50 CORPORATES
Analytical Contact: Anne Kuo, CFA, Taipei, (886) 28722-5829; [email protected]
Company description
Established in 1988, Yieh United Steel is the largest stainless
steel producer in Taiwan. Its stainless steel product lines include
hot-rolled stainless steel plates and sheet in coils, and stainless
steel plates, billets and wire rods. In 2013, about 65% of the
company's total sales were generated from exports, mainly to
other Asian countries.
Business risk profile: Weak
Relatively weak global market position despite
dominant share of domestic market. Yieh United Steel is
the largest stainless steel producer in Taiwan, with about 3
million tons of crude stainless steel capacity in Taiwan and
China. The company has a dominant market share of about 49%
in the domestic market, but a relatively weak position in the
global market at about 1.5% in 2013.
Weak profitability due to industry oversupply. Like other
global stainless steel producers worldwide, Yieh United Steel
continues to face margin pressure as a result of global
oversupply. We do not expect the industry supply-demand
imbalance to improve over the next one to two years. This is
particularly due to rapid output growth from China, which stood
at 18% in 2013, accounting for about 50% of global stainless steel
supply, compared with slower growth in global demand. As a
result, we believe the potential for an upturn in the company's
profitability is limited because strong price competition will
remain in place.
Volatile operations due to concentration risk and raw
material price volatility. In our view, Yieh United Steel is
subject to concentration risk given its limited product
diversification, which further intensifies its operating
performance volatility. In addition, the company also faces
volatility in the price of its raw materials because it relies
primarily on imports for key raw materials such as nickel which
accounts for about 50% of material cost in certain products. The
company's integrated operation slightly enhances its operating
efficiency, in our opinion.
Moderately high industry risk. The metal industry has high
cyclicality risk, and intermediate competition and growth risk.
The cyclicality risk is further intensified by worldwide
oversupply in the stainless steel industry. In addition, higher
tariffs imposed on Taiwanese producers compared with other
competitors that benefit from free trade agreements also places
Taiwanese steel makers in an inferior competitive position.
Financial risk profile: Aggressive
Weak cash flow protection with improvement
constrained by margin pressure. We expect Yieh United
Steel's cash flow protection to remain weak while its adjusted ratio
of debt to EBITDA will remain above 5x for the next two to three
years due to industry volatility, margin pressure and the
company's high debt level, in our view.
High volatility of cash flow coverage ratios. In addition, we
expect Yieh United Steel's financial metrics to remain volatile due
to the company's capital intensity and sustained industry
oversupply that lead to strong price competition. We expect such
factors to continue to heavily influence the company's cash flow
coverage ratios.
(Mil. NT$) 2013 2012 2011
Revenues 133,756.1 121,826.4 155,795.8
EBITDA 6,284.1 2,621.7 4,747.9
Funds from operations (FFO) 3,657.1 443.3 1,894.5
Net income from continuing operations (895.0) (3,965.5) (633.5)
Cash flow from operations 2,278.9 4,031.0 1,408.9
Capital expenditures 3,949.8 4,767.8 5,017.8
Free operating cash flow (1,670.9) (736.8) (3,608.9)
Discretionary cash flow (1,670.9) (736.8) (4,740.7)
Cash and short-term investments 1,536.4 1,605.6 1,651.1
Debt 72,889.9 72,463.5 75,037.4
Equity 24,504.5 24,904.5 26,539.7
Adjusted rat ios
EBITDA margin (%) 4.7 2.1 3.0
Return on capital (%) 1.9 (1.7) 1.8
EBITDA interest coverage (x) 2.1 0.8 1.6
FFO cash interest coverage (x) 2.2 1.1 1.6
Debt/EBITDA (x) 11.6 27.6 15.8
FFO/debt (%) 5.0 0.6 2.5
Cash flow from operations/debt (%) 3.1 5.6 1.9
Free operating cash flow/debt (%) (2.3) (1.0) (4.8)
Discretionary cash flow/debt (%) (2.3) (1.0) (6.3)
NT$--New Taiwan dollar. N.M.--Not meaningful. Note: Data are fully adjusted.
Y ieh United Steel Corp. -- Financia l Summary
--Fiscal year ended Dec. 31--
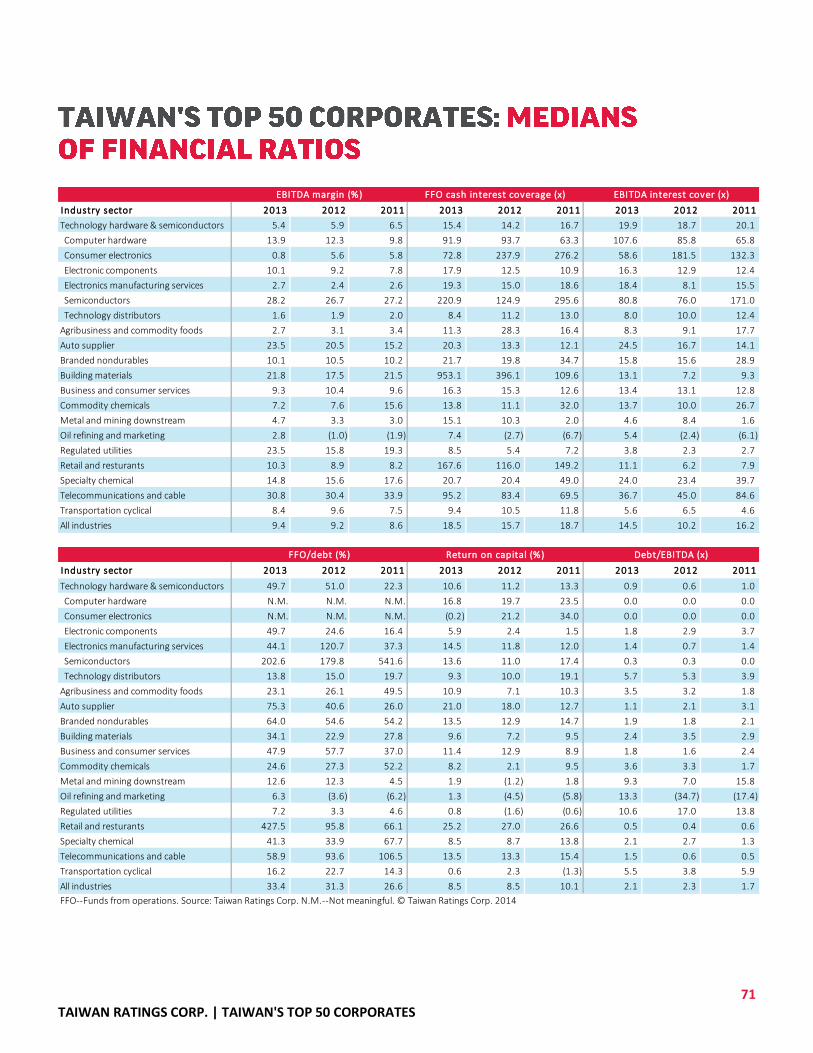
71 TAIWAN RATINGS CORP. | TAIWAN'S TOP 50 CORPORATES
Industry sector 2013 2012 2011 2013 2012 2011 2013 2012 2011
Technology hardware & semiconductors 5.4 5.9 6.5 15.4 14.2 16.7 19.9 18.7 20.1
Computer hardware 13.9 12.3 9.8 91.9 93.7 63.3 107.6 85.8 65.8
Consumer electronics 0.8 5.6 5.8 72.8 237.9 276.2 58.6 181.5 132.3
Electronic components 10.1 9.2 7.8 17.9 12.5 10.9 16.3 12.9 12.4
Electronics manufacturing services 2.7 2.4 2.6 19.3 15.0 18.6 18.4 8.1 15.5
Semiconductors 28.2 26.7 27.2 220.9 124.9 295.6 80.8 76.0 171.0
Technology distributors 1.6 1.9 2.0 8.4 11.2 13.0 8.0 10.0 12.4
Agribusiness and commodity foods 2.7 3.1 3.4 11.3 28.3 16.4 8.3 9.1 17.7
Auto supplier 23.5 20.5 15.2 20.3 13.3 12.1 24.5 16.7 14.1
Branded nondurables 10.1 10.5 10.2 21.7 19.8 34.7 15.8 15.6 28.9
Building materials 21.8 17.5 21.5 953.1 396.1 109.6 13.1 7.2 9.3
Business and consumer services 9.3 10.4 9.6 16.3 15.3 12.6 13.4 13.1 12.8
Commodity chemicals 7.2 7.6 15.6 13.8 11.1 32.0 13.7 10.0 26.7
Metal and mining downstream 4.7 3.3 3.0 15.1 10.3 2.0 4.6 8.4 1.6
Oil refining and marketing 2.8 (1.0) (1.9) 7.4 (2.7) (6.7) 5.4 (2.4) (6.1)
Regulated utilities 23.5 15.8 19.3 8.5 5.4 7.2 3.8 2.3 2.7
Retail and resturants 10.3 8.9 8.2 167.6 116.0 149.2 11.1 6.2 7.9
Specialty chemical 14.8 15.6 17.6 20.7 20.4 49.0 24.0 23.4 39.7
Telecommunications and cable 30.8 30.4 33.9 95.2 83.4 69.5 36.7 45.0 84.6
Transportation cyclical 8.4 9.6 7.5 9.4 10.5 11.8 5.6 6.5 4.6
All industries 9.4 9.2 8.6 18.5 15.7 18.7 14.5 10.2 16.2
Industry sector 2013 2012 2011 2013 2012 2011 2013 2012 2011
Technology hardware & semiconductors 49.7 51.0 22.3 10.6 11.2 13.3 0.9 0.6 1.0
Computer hardware N.M. N.M. N.M. 16.8 19.7 23.5 0.0 0.0 0.0
Consumer electronics N.M. N.M. N.M. (0.2) 21.2 34.0 0.0 0.0 0.0
Electronic components 49.7 24.6 16.4 5.9 2.4 1.5 1.8 2.9 3.7
Electronics manufacturing services 44.1 120.7 37.3 14.5 11.8 12.0 1.4 0.7 1.4
Semiconductors 202.6 179.8 541.6 13.6 11.0 17.4 0.3 0.3 0.0
Technology distributors 13.8 15.0 19.7 9.3 10.0 19.1 5.7 5.3 3.9
Agribusiness and commodity foods 23.1 26.1 49.5 10.9 7.1 10.3 3.5 3.2 1.8
Auto supplier 75.3 40.6 26.0 21.0 18.0 12.7 1.1 2.1 3.1
Branded nondurables 64.0 54.6 54.2 13.5 12.9 14.7 1.9 1.8 2.1
Building materials 34.1 22.9 27.8 9.6 7.2 9.5 2.4 3.5 2.9
Business and consumer services 47.9 57.7 37.0 11.4 12.9 8.9 1.8 1.6 2.4
Commodity chemicals 24.6 27.3 52.2 8.2 2.1 9.5 3.6 3.3 1.7
Metal and mining downstream 12.6 12.3 4.5 1.9 (1.2) 1.8 9.3 7.0 15.8
Oil refining and marketing 6.3 (3.6) (6.2) 1.3 (4.5) (5.8) 13.3 (34.7) (17.4)
Regulated utilities 7.2 3.3 4.6 0.8 (1.6) (0.6) 10.6 17.0 13.8
Retail and resturants 427.5 95.8 66.1 25.2 27.0 26.6 0.5 0.4 0.6
Specialty chemical 41.3 33.9 67.7 8.5 8.7 13.8 2.1 2.7 1.3
Telecommunications and cable 58.9 93.6 106.5 13.5 13.3 15.4 1.5 0.6 0.5
Transportation cyclical 16.2 22.7 14.3 0.6 2.3 (1.3) 5.5 3.8 5.9
All industries 33.4 31.3 26.6 8.5 8.5 10.1 2.1 2.3 1.7
FFO--Funds from operations. Source: Taiwan Ratings Corp. N.M.--Not meaningful. © Taiwan Ratings Corp. 2014
EBITDA margin (%) FFO cash interest coverage (x) EBITDA interest cover (x)
FFO/debt (%) Return on capital (%) Debt/EBITDA (x)
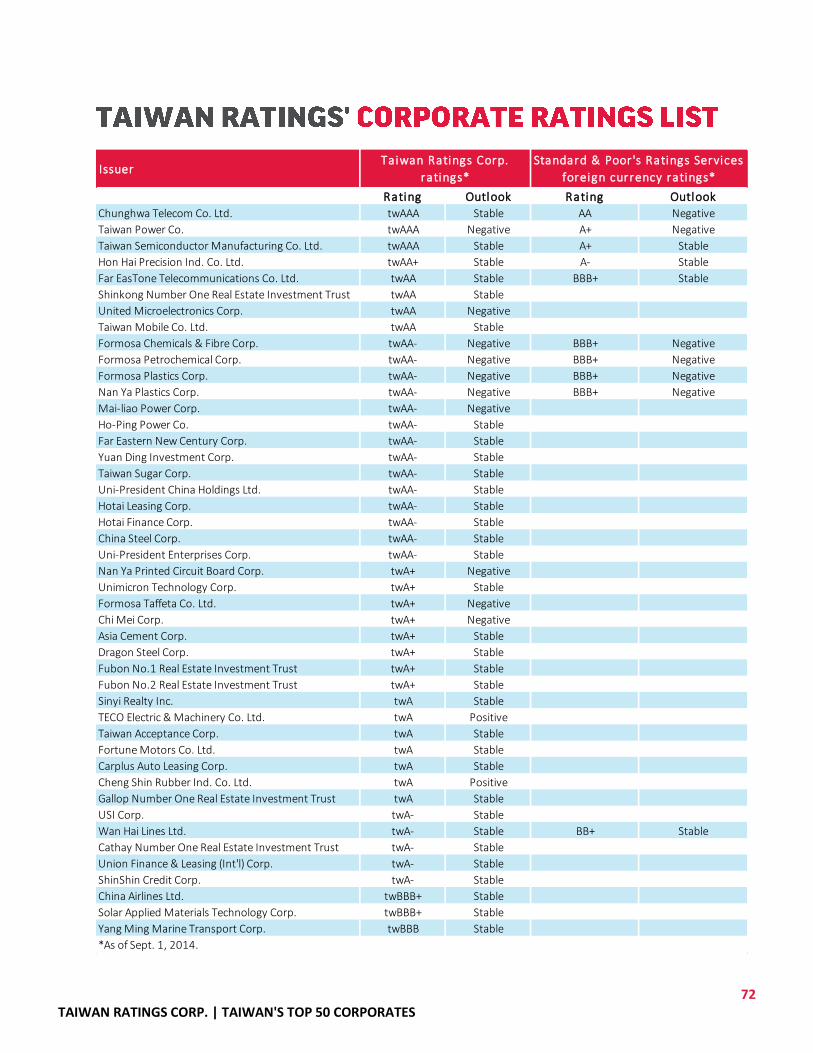
72 TAIWAN RATINGS CORP. | TAIWAN'S TOP 50 CORPORATES
Issuer
Rating Outlook Rating Outlook
Chunghwa Telecom Co. Ltd. twAAA Stable AA Negative
Taiwan Power Co. twAAA Negative A+ Negative
Taiwan Semiconductor Manufacturing Co. Ltd. twAAA Stable A+ Stable
Hon Hai Precision Ind. Co. Ltd. twAA+ Stable A- Stable
Far EasTone Telecommunications Co. Ltd. twAA Stable BBB+ Stable
Shinkong Number One Real Estate Investment Trust twAA Stable
United Microelectronics Corp. twAA Negative
Taiwan Mobile Co. Ltd. twAA Stable
Formosa Chemicals & Fibre Corp. twAA- Negative BBB+ Negative
Formosa Petrochemical Corp. twAA- Negative BBB+ Negative
Formosa Plastics Corp. twAA- Negative BBB+ Negative
Nan Ya Plastics Corp. twAA- Negative BBB+ Negative
Mai-liao Power Corp. twAA- Negative
Ho-Ping Power Co. twAA- Stable
Far Eastern New Century Corp. twAA- Stable
Yuan Ding Investment Corp. twAA- Stable
Taiwan Sugar Corp. twAA- Stable
Uni-President China Holdings Ltd. twAA- Stable
Hotai Leasing Corp. twAA- Stable
Hotai Finance Corp. twAA- Stable
China Steel Corp. twAA- Stable
Uni-President Enterprises Corp. twAA- Stable
Nan Ya Printed Circuit Board Corp. twA+ Negative
Unimicron Technology Corp. twA+ Stable
Formosa Taffeta Co. Ltd. twA+ Negative
Chi Mei Corp. twA+ Negative
Asia Cement Corp. twA+ Stable
Dragon Steel Corp. twA+ Stable
Fubon No.1 Real Estate Investment Trust twA+ Stable
Fubon No.2 Real Estate Investment Trust twA+ Stable
Sinyi Realty Inc. twA Stable
TECO Electric & Machinery Co. Ltd. twA Positive
Taiwan Acceptance Corp. twA Stable
Fortune Motors Co. Ltd. twA Stable
Carplus Auto Leasing Corp. twA Stable
Cheng Shin Rubber Ind. Co. Ltd. twA Positive
Gallop Number One Real Estate Investment Trust twA Stable
USI Corp. twA- Stable
Wan Hai Lines Ltd. twA- Stable BB+ Stable
Cathay Number One Real Estate Investment Trust twA- Stable
Union Finance & Leasing (Int'l) Corp. twA- Stable
ShinShin Credit Corp. twA- Stable
China Airlines Ltd. twBBB+ Stable
Solar Applied Materials Technology Corp. twBBB+ Stable
Yang Ming Marine Transport Corp. twBBB Stable
*As of Sept. 1, 2014.
Taiwan Ratings Corp.
ratings*
Standard & Poor's Ratings Services
foreign currency ratings*
73 TAIWAN RATINGS CORP. | TAIWAN'S TOP 50 CORPORATES
Key Ratios Core debt-payback ratios:
Funds from operations (FFO)/debt
Debt/EBITDA
Supplemental debt-payback and debt-service ratios:
Cash flow from operations (CFO)/debt
Free operating cash flow (FOCF)/debt
Discretionary cash flow (DCF)/debt
(FFO + interest)/cash interest (FFO cash interest cover)
EBITDA/interest
Profitability ratios:
EBIT/revenues (EBIT margin)
EBITDA/revenues (EBITDA margin)
EBIT/average beginning-of-year and end-of-year capital (return on capital)
Glossary Capital: Debt plus noncurrent deferred taxes plus equity (plus or minus all applicable adjustments).
Capital expenditures: Funds spent to acquire or develop tangible and certain intangible assets (plus or
minus all applicable adjustments).
Cash interest: For the purposes of calculating the FFO cash-interest-cover ratio, "cash interest" includes
only cash interest payments on gross financial debt (including bank loans, debt capital market
instruments, finance leases, and capitalized interest). Cash interest does not include any Standard &
Poor's-adjusted interest on debt-like obligations, such as postretirement benefit obligations or operating
leases.
CFO (cash flow from operations): CFO is also referred to as operating cash flow. This measure reflects
cash flows from operating activities (as opposed to investing and financing activities), including all
interest received and paid, dividends received, and taxes paid in the period (plus or minus all applicable
adjustments). For companies that do not use U.S. GAAP, we reclassify as CFO any dividends received, or
interest paid or received, that a company reports as investing or financing cash flows.
Current tax expense: This is the amount of income taxes payable on taxable profit, or income tax
recoverable from tax losses, in an accounting period (plus or minus all applicable adjustments). Current
tax expense is to be distinguished from deferred tax expense.
74 TAIWAN RATINGS CORP. | TAIWAN'S TOP 50 CORPORATES
DCF (discretionary cash flow): FOCF minus cash dividends paid on common stock and preferred stock
(plus or minus all applicable adjustments).
Debt: Gross financial debt (including items such as bank loans, debt capital market instruments, and
finance leases) minus surplus cash (plus or minus all applicable adjustments).
Dividends: Dividends paid to common and preferred shareholders and to minority interest shareholders
of consolidated subsidiaries (plus or minus all applicable adjustments).
EBIT: A traditional view of profit that factors in capital intensity, but also includes interest income, the
company's share of equity earnings of associates and joint ventures, and other recurring, nonoperating
items (plus or minus all applicable adjustments).
EBITDA: A company's revenue minus operating expenses, plus depreciation and amortization expenses,
including impairments on noncurrent assets and impairment reversals (plus or minus all applicable
adjustments). Dividends (cash) received from affiliates, associates, and joint ventures accounted for
under the equity method are added, while the company's share of profits and losses from these
affiliates is excluded.
Equity: Common equity and equity hybrids and minority interests (plus or minus all applicable
adjustments).
FFO (funds from operations): EBITDA, minus net interest expense minus current tax expense (plus or
minus all applicable adjustments).
FOCF (free operating cash flow): CFO minus capital expenditures (plus or minus all applicable
adjustments).
Interest: This is the reported interest expense figure, including noncash interest on conventional debt
instruments (such as payment-in-kind, zero-coupon, and inflation-linked debt), minus any interest
income derived from assets structurally linked to a debt instrument (plus or minus all applicable
adjustments).
Net interest expense: This is the reported interest expense figure, including noncash interest on
conventional debt instruments (such as payment-in-kind, zero-coupon, and inflation-linked debt), minus
the sum of interest income and dividend income (plus or minus all applicable adjustments).
Revenues: Total sales and other revenues we consider to be operating (plus or minus all applicable
adjustments).
Source: Corporate Methodology: Ratios And Adjustments, published Nov. 19, 2013.
Taiwan Ratings' Rating Definitions
75 TAIWAN RATINGS CORP. | TAIWAN'S TOP 50 CORPORATES
A Taiwan Ratings issuer credit rating is a forward-looking opinion about the overall creditworthiness of a debt issuer, guarantor, insurer, or other provider of credit enhancement ("obligor") to meet its financial obligations as they come due, relative to other Taiwanese obligors. Such Taiwanese obligors include all active borrowers, guarantors, insurers, and other providers of credit enhancement residing in Taiwan, as well as foreign obligors active in Taiwan's financial markets. Issuer credit ratings do not apply to specific obligations, as they do not take into account the nature and provisions of the obligation, its standing in bankruptcy or liquidation, statutory preferences, or the legality and enforceability of the obligation. In addition, they do not take into account the creditworthiness of the guarantors, insurers, or other forms of credit enhancement on the obligation. Counterparty credit ratings and corporate credit ratings are all forms of issuer credit ratings.
*The credit ratings from 'twAA' to 'twCCC' may be modified by the addition of a plus (+) or minus (-) to show relative strength with the rating category.
Long-Term Issuer Credit
Ratings Category*Definition
twAAAAn obligor rated 'twAAA' has an extremely strong capacity to meet its financial commitments relative to that of other Taiwanese obligors. 'twAAA' is the highest
issuer credit rating assigned according to Taiwan Ratings national scale.
twAAAn obligor rated 'twAA' differs from the highest-rated obligors only to a small degree, and has a very strong capacity to meet its financial commitments relative
to that of other Taiwanese obligors.
twAAn obligor rated 'twA' is somewhat more susceptible to the adverse effects of changes in circumstances and economic conditions than higher-rated obligors.
Still, the obligor has a strong capacity to meet its financial commitments relative to that of other Taiwanese obligors.
twBBBAn obligor rated 'twBBB' has an adequate capacity to meet its financial commitments relative to that of other Taiwanese obligors. However, adverse economic
conditions or changing circumstances are more likely to lead to a weakened capacity of the obligor to meet its financial commitments.
twBB; twB; twCCC; and twCC
Obligors rated 'twBB', 'twB', 'twCCC', and 'twCC' on the Taiwan Ratings credit rating scale are regarded as having high risk relative to other Taiwanese obligors.
While such obligors will likely have some quality and protective characteristics, these may be outweighed by large uncertainties or major exposure to adverse
conditions relative to other Taiwanese obligors.
twBB
An obligor rated 'twBB' denotes somewhat weak capacity to meet its financial commitments, although it is less vulnerable than other lower-rated Taiwanese
obligors. However, it faces ongoing uncertainties or exposure to adverse business, financial, or economic conditions, which could result in an inadequate
capacity on the part of the obligor to meet its financial commitments.
twB
An obligor rated 'twB' is more vulnerable than obligors rated 'twBB'. The obligor currently has a weak capacity to meet its financial commitments relative to
other Taiwanese obligors. Adverse business, financial, or economic conditions would likely impair the obligor's capacity or willingness to meet its financial
commitments.
twCCCAn obligor rated 'twCCC' is currently vulnerable relative to other Taiwanese obligors and is dependent upon favorable business and financial conditions to meet
its financial commitments.
twCCAn obligor rated 'twCC' is currently highly vulnerable to defaulting on its financial commitments relative to other Taiwanese obligors. The ‘twCC’ rating is used
when a default has not yet occurred, but Taiwan Ratings expects default to be a virtual certainty, regardless of the anticipated time to default.
twRAn obligor rated 'twR' is under regulatory supervision owing to its financial condition. During the pendency of the regulatory supervision, the regulators may
have the power to favor one class of obligations over others or pay some obligations and not others.
SD and D
An obligor rated 'SD' (selective default) or 'D' is in default on one or more of its financial obligations including rated and unrated financial obligations but
excluding hybrid instruments classified as regulatory capital or in non-payment according to terms. An obligor is considered in default unless Taiwan Ratings
believes that such payments will be made within five business days, or within the earlier of the stated grace period or thirty calendar days. A 'D' rating is assigned
when Taiwan Ratings believes that the default will be a general default and that the obligor will fail to pay all or substantially all of its obligations as they come
due. A 'SD' rating is assigned when Taiwan Ratings believes that the obligor has selectively defaulted on a specific issue or class of obligations but it will
continue to meet its payment obligations on other issues or classes of obligations in a timely manner. An obligor’s rating is lowered to 'D' or 'SD' if it is
conducting a distressed exchange offer.
NR An issuer designated 'NR' is not rated.
Taiwan Ratings' Rating Definitions
76 TAIWAN RATINGS CORP. | TAIWAN'S TOP 50 CORPORATES
*Apply to an obligor's capacity to meet financial commitments over a time horizon of less than one year.
CreditWatch highlights our opinion regarding the potential direction of a short-term or long-term rating. It can be applied to issuer ratings and issue ratings, as well as insurer financial strength ratings and fund credit quality ratings. It focuses on identifiable events and short-term trends that cause ratings to be placed under special surveillance by Taiwan Ratings' analytical staff. Ratings may be placed on CreditWatch under the following circumstances: When an event has occurred or, in our view, a deviation from an expected trend has occurred or is expected and
when additional information is necessary to evaluate the current rating. Events and short-term trends may include mergers, recapitalizations, voter referendums, regulatory actions, performance deterioration of securitized assets, or anticipated operating developments.
When we believe there has been a material change in performance of an issue or issuer, but the magnitude of the rating impact has not been fully determined, and we believe that a rating change is likely in the short-term.
A change in criteria has been adopted that necessitates a review of an entire sector or multiple transactions and we believe that a rating change is likely in the short-term.
A CreditWatch listing, however, does not mean a rating change is inevitable, and when appropriate, a range of potential alternative ratings will be shown. CreditWatch is not intended to include all ratings under review, and rating changes may occur without the ratings having first appeared on CreditWatch. The "positive" designation means that a rating may be raised; "negative" means a rating may be lowered; and "developing" means that a rating may be raised, lowered, or affirmed.
A Taiwan Ratings' rating outlook assesses the potential direction of a long-term credit rating over the intermediate term (typically six months to two years). It can be applied to issuer ratings and issue ratings, as well as insurer financial strength ratings. In determining a rating outlook, consideration is given to any changes in the economic and/or fundamental business conditions. An outlook is not necessarily a precursor of a rating change or future CreditWatch action. Positive means that a rating may be raised.
Negative means that a rating may be lowered.
Stable means that a rating is not likely to change.
Developing means a rating may be raised or lowered.
N.M. means not meaningful.
Short-Term Issuer Credit
Ratings Category*Definition
twA-1
An obligor with a 'twA-1' short-term credit rating has a strong capacity to meet financial commitments relative to that of other Taiwanese obligors. Within this
category, certain obligors are designated with a plus sign (+). This indicates that the obligor's capacity to meet its financial commitment on these obligations,
relative to that of other obligors in the Taiwanese market, is extremely strong.
twA-2 An obligor with a 'twA-2' short-term credit rating has a satisfactory capacity to meet financial obligations relative to that of other Taiwanese obligors.
twA-3An obligor with a 'twA-3' short-term credit rating has an adequate capacity to meet financial commitments relative to that of other Taiwanese obligors. However,
the obligor is more vulnerable to adverse changes in business circumstances or economic conditions than higher-rated obligors.
twBAn obligor with a 'twB' short-term credit rating has a weak capacity to meet financial commitments, relative to that of other Taiwanese obligors, and is
vulnerable to adverse business, financial, or economic conditions.
twC An obligor with a 'twC' short-term credit rating has a doubtful capacity to meet financial commitments.
SD and D
An obligor rated 'SD' (selective default) or 'D' has failed to pay one or more of its financial obligations (rated or unrated), excluding hybrid instruments classified
as regulatory capital or in nonpayment according to terms, when it came due. An obligor is considered in default unless Taiwan Ratings believes that such
payments will be made within any stated grace period. However, any stated grace period longer than five business days will be treated as five business days. A
'D' credit rating is assigned when Taiwan Ratings believes that the default will be a general default and that the obligor will fail to pay all or substantially all of its
obligations as they come due. A 'SD' credit rating is assigned when Taiwan Ratings believes that the obligor has selectively defaulted on a specific issue or class
of obligations, excluding hybrid instruments classified as regulatory capital, but it will continue to meet its payment obligations on other issues or classes of
obligations in a timely manner. An obligor's rating is lowered to 'D' or 'SD' if it is conducting a distressed exchange offer.
NR An issuer designated 'NR' is not rated.
77 TAIWAN RATINGS CORP. | TAIWAN'S TOP 50 CORPORATES
Please find below a selected list of published criteria by Taiwan Ratings Corp. and Standard & Poor's Ratings Services. Ratings information can be found at Standard & Poor's public Web site at www.standardandpoors.com unless otherwise stated.
Methodology And Assumptions: Liquidity Descriptors For Global Corporate Issuers, Jan. 2, 2014
Corporate Methodology, Nov. 19, 2013
Methodology: Industry Risk, Nov. 19, 2013
Group Rating Methodology, Nov. 19, 2013
Corporate Methodology: Ratios And Adjustments, Nov. 19, 2013
Country Risk Assessment Methodology And Assumptions, Nov. 19, 2013
Understanding TRC Rating Definitions, www.taiwanratings.com, Oct. 29, 2013
Management And Governance Credit Factors For Corporate Entities And Insurers, Nov. 13, 2012
Rating Government-Related Entities: Methodology And Assumptions, Dec. 9, 2010
78 TAIWAN RATINGS CORP. | TAIWAN'S TOP 50 CORPORATES
Suite 1601, 16/F Tower D, Level 23,
Beijing CITC Marina Bay Financial PT. Pefindo (Indonesia)
A6 Jianguo Menwai Avenue Centre Tower 3, Panin Tower Senayan City
Chaoyang District 12 Marina Boulevard, 17th Floor
Beijing 100022, P.R. China Singapore 018982 Jl. Asia Afrika Lot.19
Tel: (86) 10-6569-2909 Tel: (65) 6438-2881 Jakarta 10270, Indonesia
Tel: (6221) 7278-2380
Unit 1, Level 69 Level 22, 400 George Street RAM Rating Services Berhad
International Commerce Centre Sydney NSW 2000, Australia Suite 20.01, Level 20,
1 Austin Road West, Kowloon Tel: (61) 2-9255-9800 The Gardens South Tower
Hong Kong Mid Valley City,
Tel: (852) 2533-3500 Lingkaran Syed Putra
28F Marunouchi Kitaguchi Building Kuala Lumpur 59200
1-6-5 Marunouchi Chiyoda-ku Malaysia
Level 45, 120 Collins Street Tokyo, Japan, 100-0005 Tel: (603) 7628-1000 / 2299-1000
Melbourne Vic 3000 Tel: (81) 3-4550-8000 (General Line)
Australia
Tel: (61) 3-9631-2000 TRIS Rating Co., Ltd.
Level 24
Mumbai Silom Complex Building
Cts Number 15 D CRISIL Limited 191 Silom Road, Bangrak,
Central Avenue, 8th Floor CRISIL House, Central Avenue Bangkok 10500
Hiranandani Business Park Hiranandani Business Park Thailand
CRISIL House Powai, Mumbai 400 076 India Tel: (66) 2231-3011
Powai, Mumbai 400 076 India Tel: (91) 22-3342-3000
Tel: (91) 22-3342-3000
Taipei
Taiwan Ratings Corp. (TRC)
6F Seoul Finance Center, 49th Floor, Taipei 101 Tower
#84, Taepyungro 1-ga, Joong-gu, No. 7, Xinyi Road, Section 5
Seoul 100-768, Korea Taipei 11049, Taiwan R.O.C.
Tel: (82) 2-2022-2300 Tel: (88) 62-8722-5800
23/F, 1000 Lujiazui Ring Road
Hang Seng Bank Tower
Pudong New Area
Shanghai, 200120, P.R. China
Tel: (86) 21-2208-0880
79 TAIWAN RATINGS CORP. | TAIWAN'S TOP 50 CORPORATES
Copyright © 2014 by Taiwan Ratings Corporation (TRC). All rights reserved. No content (including ratings, credit-related analyses and data, valuations, model, software or other application or output therefrom) or any part thereof (Content) may be modified, reverse engineered, reproduced or distributed in any form by any means, or stored in a database or retrieval system, without the prior written permission of TRC. The Content shall not be used for any unlawful or unauthorized purposes. TRC and any third-party providers, as well as their directors, officers, shareholders, employees or agents (collectively TRC Parties) do not guarantee the accuracy, completeness, timeliness or availability of the Content. TRC Parties are not responsible for any errors or omissions (negligent or otherwise), regardless of the cause, for the results obtained from the use of the Content, or for the security or maintenance of any data input by the user. The Content is provided on an "as is" basis. TRC DISCLAIMS ANY AND ALL EXPRESS OR IMPLIED WARRANTIES, INCLUDING, BUT NOT LIMITED TO, ANY WARRANTIES OF MERCHANTABILITY OR FITNESS FOR A PARTICULAR PURPOSE OR USE, FREEDOM FROM BUGS, SOFTWARE ERRORS OR DEFECTS, THAT THE CONTENT'S FUNCTIONING WILL BE UNINTERRUPTED OR THAT THE CONTENT WILL OPERATE WITH ANY SOFTWARE OR HARDWARE CONFIGURATION. In no event shall TRC be liable to any party for any direct, indirect, incidental, exemplary, compensatory, punitive, special or consequential damages, costs, expenses, legal fees, or losses (including, without limitation, lost income or lost profits and opportunity costs or losses caused by negligence) in connection with any use of the Content even if advised of the possibility of such damages. Credit-related and other analyses, including ratings, and statements in the Content are statements of opinion as of the date they are expressed and not statements of fact. TRC credit ratings are opinions about relative credit risk. TRC's opinions, analyses and rating acknowledgment decisions (described below) are not recommendations to purchase, hold, or sell any securities or to make any investment decisions, and do not address the suitability of any security. TRC assumes no obligation to update the Content following publication in any form or format. The Content should not be relied on and is not a substitute for the skill, judgment and experience of the user, its management, employees, advisors and/or clients when making investment and other business decisions. TRC does not act as a fiduciary or an investment advisor except where registered as such. While TRC has obtained information from sources it believes to be reliable, TRC does not perform an audit and undertakes no duty of due diligence or independent verification of any information it receives. TRC cannot guarantee the accuracy, completeness, or timeliness of the information relied on in connection with a rating or the results obtained from the use of such information. To the extent that regulatory authorities allow a rating agency to acknowledge in one jurisdiction a rating issued in another jurisdiction for certain regulatory purposes, TRC reserves the right to assign, withdraw or suspend such acknowledgement at any time and in its sole discretion. TRC disclaims any duty whatsoever arising out of the assignment, withdrawal or suspension of an acknowledgment as well as any liability for any damage alleged to have been suffered on account thereof. TRC keeps certain activities of its business units separate from each other in order to preserve the independence and objectivity of their respective activities. As a result, certain business units of TRC may have information that is not available to other TRC business units. TRC has established policies and procedures to maintain the confidentiality of certain non-public information received in connection with each analytical process. TRC may receive compensation for its ratings and certain analyses, normally from issuers or underwriters of securities or from obligors. TRC reserves the right to disseminate its opinions and analyses. TRC's public ratings and analyses are made available on its Web sites, www.taiwanratings.com (free of charge), and rrs.taiwanratings.com.tw (subscription), and may be distributed through other means, including via TRC publications and third-party redistributors.
80 TAIWAN RATINGS CORP. | TAIWAN'S TOP 50 CORPORATES
Training Features
Direct Access with Analysts: Our courses provide you with
the opportunity to interact with our senior analysts, work
through live case studies from your local market and
discuss current market developments first hand.
A workshop approach: The high degree of interaction
allows participants to immediately apply their learning to
real credits, cementing their understanding of these
concepts. Case studies for the workshop are selected from
the local market, allowing attendees to leverage our
knowledge of the local market and current credit issues.
Understand your rating: Whether you are a client of Taiwan
Ratings or you deal with our credit ratings in your work,
attendees will gain an in-depth understanding of what
drives our ratings.
Provide clients with flexible training options: Except for
public training courses held by Taiwan Ratings and our
third-party Business partners, we also offer an in-house,
custom-made training program. Please contact our training
consultants to design the right program for your
organization.
Taiwan Ratings Corp. has opened up a "Credit and Risk Training" series in order to facilitate Taiwan's
financial industry in enhancing its financial supervision mechanism and to assist financial institutions and
corporations, domestic and abroad, to better understand TRC's rating criteria and rating methodology. The
training program is conducted in a variety of formats, which include lectures, case studies, and group
discussions. Participants will be provided with a comprehensive curriculum that combines academic
theories and their real-world applications
The training will allow trainees to:
Understand TRC’s rating criteria and methodology
thoroughly.
Get in touch with TRC’s senior credit analysts and
professionals in the credit rating industry.
Learn the required skills to develop their own analytical
criteria.
Gain an insight on current and significant credit-related
issues.
Training given solely by TRC or through cooperation with a third-party vendor:
Credit and Risk Training Series—Financial Institution
Credit Risk Analysis
Credit and Risk Training Series—Insurance Credit Risk
Analysis
Credit and Risk Training Series—Corporate Credit Risk
Analysis
Credit and Risk Training Series—Structured Finance
Credit Risk Analysis
Other customized training based on individual needs (not
including consulting service)
Course Consultants
Iris Chu (886) 2 8722-5870; [email protected]
Jenny Wu (886) 2 8722-5873; [email protected].
tw