Embed Size (px)
Citation preview
DASD I/O Performance Management Is
Easy? Actually, Performed Well, It’s
Not Necessarily That Easy!
Michael W. Moss
Value-4IT
mossmw(at)value-4it.com
Date of presentation (02/11/2016)
Session <LJ>
Agenda
2 November 2016 2
The Data In Memory Storage Hierarchy
DASD I/O Analysis Process & Basics
DASD I/O Operation Breakdown
DASD I/O Workload Analysis Overview
DASD I/O Workload Analysis via RMF
Advanced DASD Functions Overview
The Disk Tuning Expert Demise?
Collaboration With The Disk IHV
DASD I/O Analysis Recommendations
Real-Life z/OS DASD Case Studies
Questions & Session Feedback
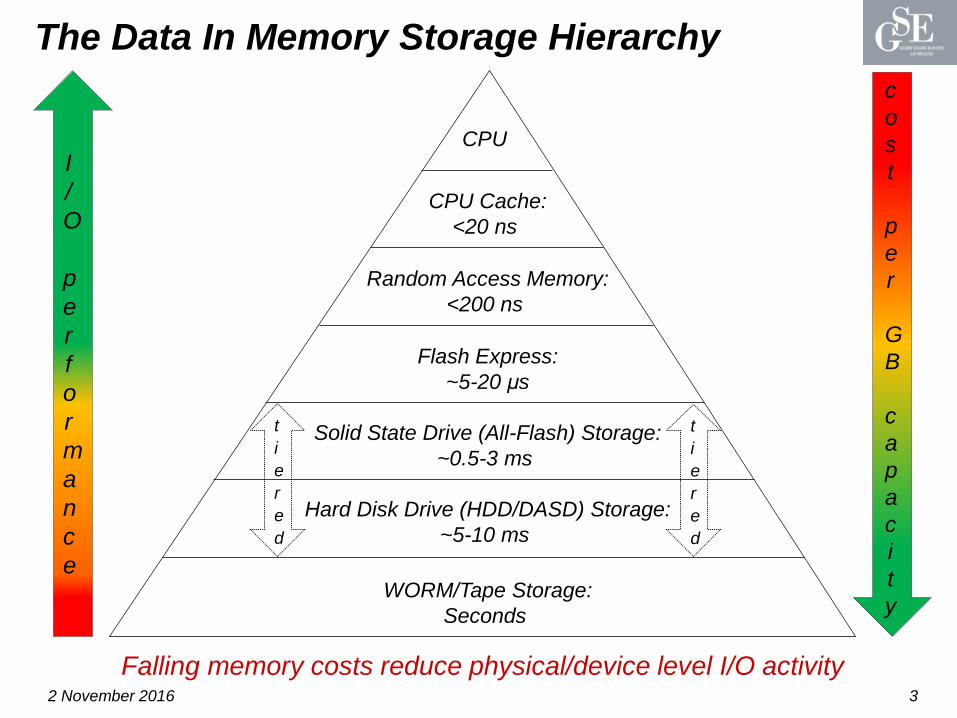
The Data In Memory Storage Hierarchy
2 November 2016 3
CPU
CPU Cache:
<20 ns
Random Access Memory:
<200 ns
Flash Express:
~5-20 μs
Solid State Drive (All-Flash) Storage:
~0.5-3 ms
Hard Disk Drive (HDD/DASD) Storage:
~5-10 ms
WORM/Tape Storage:
Seconds
I
/
O
p
e
r
f
o
r
m
a
n
c
e
c
o
s
t
p
e
r
G
B
c
a
p
a
c
i
t
y
Falling memory costs reduce physical/device level I/O activity
t
i
e
r
e
d
t
i
e
r
e
d
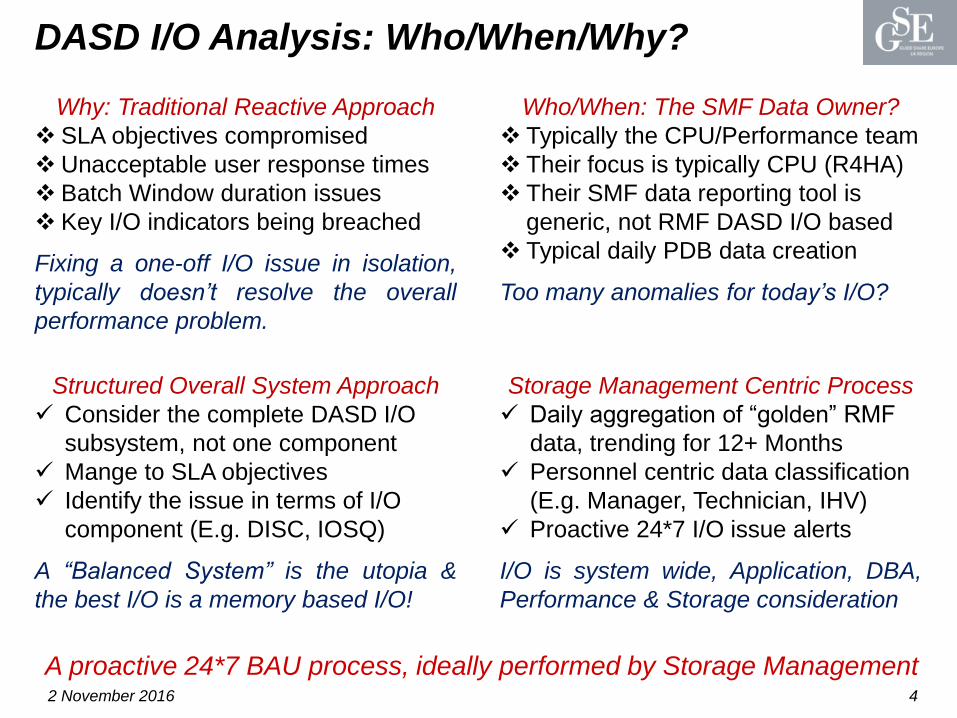
DASD I/O Analysis: Who/When/Why?
2 November 2016 4
A proactive 24*7 BAU process, ideally performed by Storage Management
Why: Traditional Reactive Approach
SLA objectives compromised
Unacceptable user response times
Batch Window duration issues
Key I/O indicators being breached
Fixing a one-off I/O issue in isolation,
typically doesn’t resolve the overall
performance problem.
Structured Overall System Approach
Consider the complete DASD I/O
subsystem, not one component
Mange to SLA objectives
Identify the issue in terms of I/O
component (E.g. DISC, IOSQ)
A “Balanced System” is the utopia &
the best I/O is a memory based I/O!
Who/When: The SMF Data Owner?
Typically the CPU/Performance team
Their focus is typically CPU (R4HA)
Their SMF data reporting tool is
generic, not RMF DASD I/O based
Typical daily PDB data creation
Too many anomalies for today’s I/O?
Storage Management Centric Process
Daily aggregation of “golden” RMF
data, trending for 12+ Months
Personnel centric data classification
(E.g. Manager, Technician, IHV)
Proactive 24*7 I/O issue alerts
I/O is system wide, Application, DBA,
Performance & Storage consideration
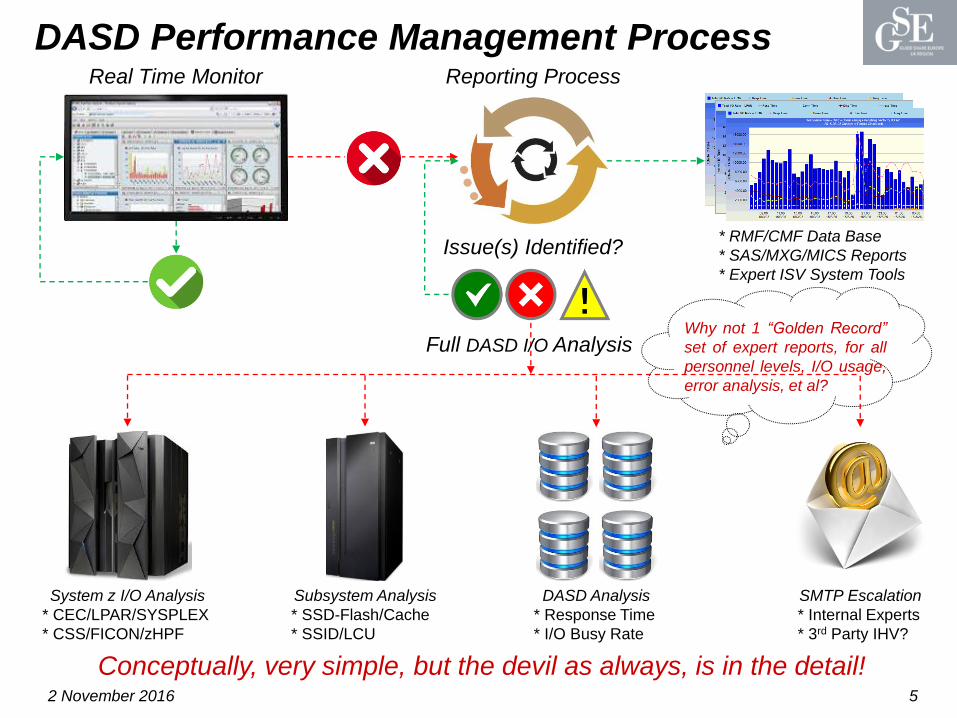
DASD Performance Management Process
2 November 2016 5
Real Time Monitor Reporting Process
Issue(s) Identified?* RMF/CMF Data Base
* SAS/MXG/MICS Reports
* Expert ISV System Tools
System z I/O Analysis
* CEC/LPAR/SYSPLEX
* CSS/FICON/zHPF
Subsystem Analysis
* SSD-Flash/Cache
* SSID/LCU
DASD Analysis
* Response Time
* I/O Busy Rate
SMTP Escalation
* Internal Experts
* 3rd Party IHV?
Full DASD I/O AnalysisWhy not 1 “Golden Record”
set of expert reports, for all
personnel levels, I/O usage,
error analysis, et al?
Conceptually, very simple, but the devil as always, is in the detail!
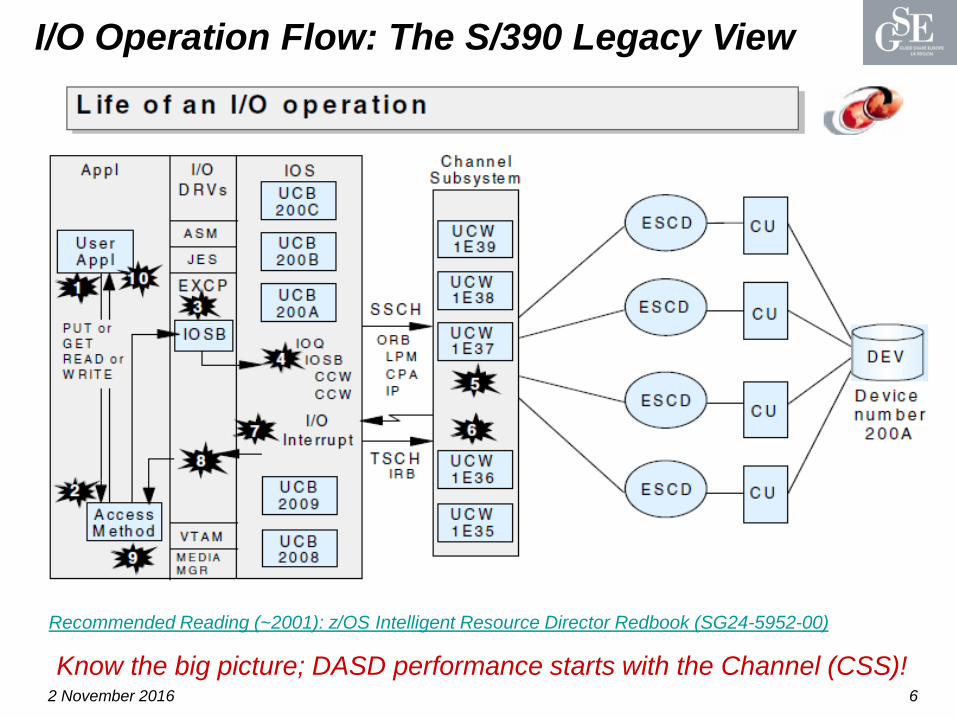
I/O Operation Flow: The S/390 Legacy View
2 November 2016 6
Know the big picture; DASD performance starts with the Channel (CSS)!
Recommended Reading (~2001): z/OS Intelligent Resource Director Redbook (SG24-5952-00)
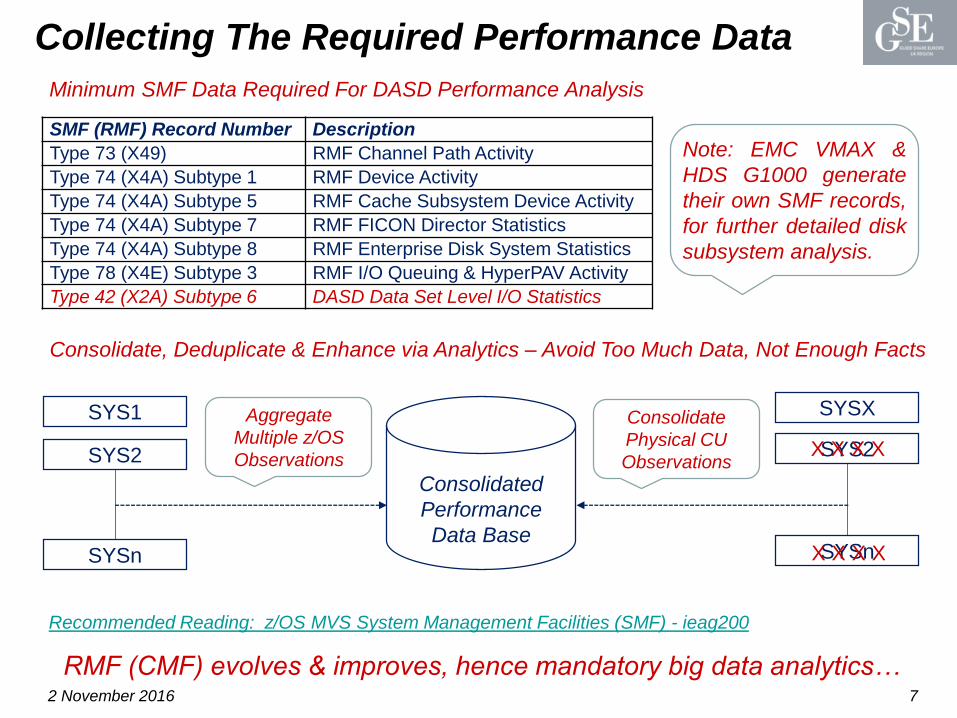
Collecting The Required Performance Data
2 November 2016 7
RMF (CMF) evolves & improves, hence mandatory big data analytics…
Recommended Reading: z/OS MVS System Management Facilities (SMF) - ieag200
SMF (RMF) Record Number Description
Type 73 (X49) RMF Channel Path Activity
Type 74 (X4A) Subtype 1 RMF Device Activity
Type 74 (X4A) Subtype 5 RMF Cache Subsystem Device Activity
Type 74 (X4A) Subtype 7 RMF FICON Director Statistics
Type 74 (X4A) Subtype 8 RMF Enterprise Disk System Statistics
Type 78 (X4E) Subtype 3 RMF I/O Queuing & HyperPAV Activity
Type 42 (X2A) Subtype 6 DASD Data Set Level I/O Statistics
Note: EMC VMAX &
HDS G1000 generate
their own SMF records,
for further detailed disk
subsystem analysis.
Minimum SMF Data Required For DASD Performance Analysis
Consolidated
Performance
Data Base
SYS1
SYS2
SYSn
SYSX
SYS2
SYSn
X X X X
X X X X
Consolidate, Deduplicate & Enhance via Analytics – Avoid Too Much Data, Not Enough Facts
Aggregate
Multiple z/OS
Observations
Consolidate
Physical CU
Observations
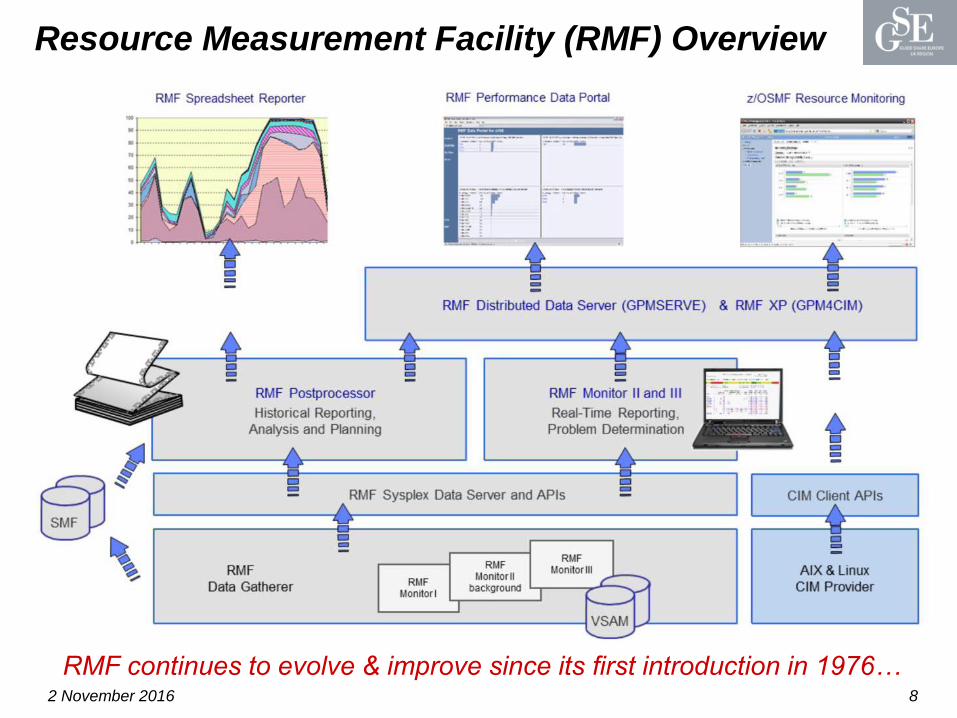
Resource Measurement Facility (RMF) Overview
2 November 2016 8
RMF continues to evolve & improve since its first introduction in 1976…
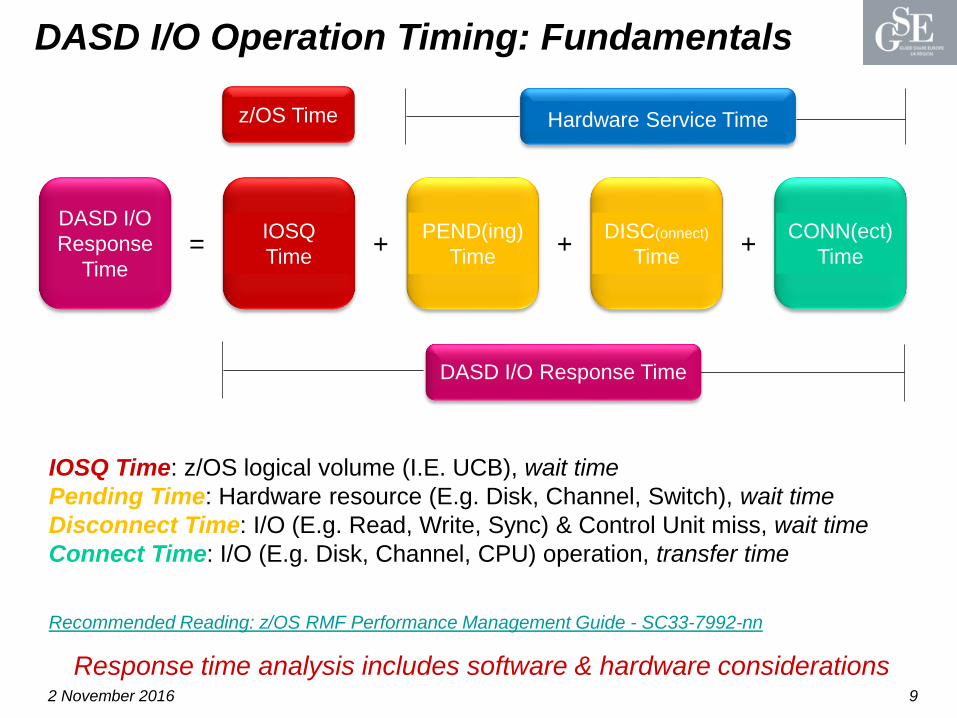
DASD I/O Operation Timing: Fundamentals
2 November 2016 9
Response time analysis includes software & hardware considerations
DASD I/O
Response
Time
IOSQ
Time
PEND(ing)
Time
DISC(onnect)
Time
CONN(ect)
Time= + + +
Hardware Service Timez/OS Time
DASD I/O Response Time
IOSQ Time: z/OS logical volume (I.E. UCB), wait time
Pending Time: Hardware resource (E.g. Disk, Channel, Switch), wait time
Disconnect Time: I/O (E.g. Read, Write, Sync) & Control Unit miss, wait time
Connect Time: I/O (E.g. Disk, Channel, CPU) operation, transfer time
Recommended Reading: z/OS RMF Performance Management Guide - SC33-7992-nn
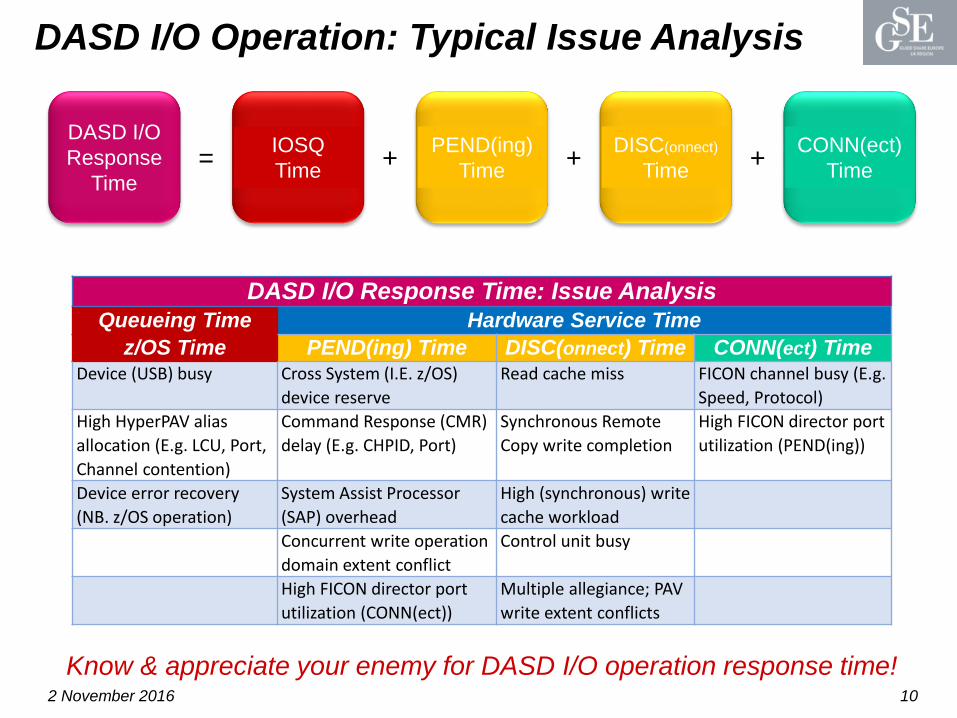
DASD I/O Operation: Typical Issue Analysis
2 November 2016 10
Know & appreciate your enemy for DASD I/O operation response time!
DASD I/O
Response
Time
IOSQ
Time
PEND(ing)
Time
DISC(onnect)
Time
CONN(ect)
Time= + + +
DASD I/O Response Time: Issue Analysis
Queueing Time Hardware Service Time
z/OS Time PEND(ing) Time DISC(onnect) Time CONN(ect) TimeDevice (USB) busy Cross System (I.E. z/OS)
device reserve
Read cache miss FICON channel busy (E.g.
Speed, Protocol)
High HyperPAV alias
allocation (E.g. LCU, Port,
Channel contention)
Command Response (CMR)
delay (E.g. CHPID, Port)
Synchronous Remote
Copy write completion
High FICON director port
utilization (PEND(ing))
Device error recovery
(NB. z/OS operation)
System Assist Processor
(SAP) overhead
High (synchronous) write
cache workload
Concurrent write operation
domain extent conflict
Control unit busy
High FICON director port
utilization (CONN(ect))
Multiple allegiance; PAV
write extent conflicts
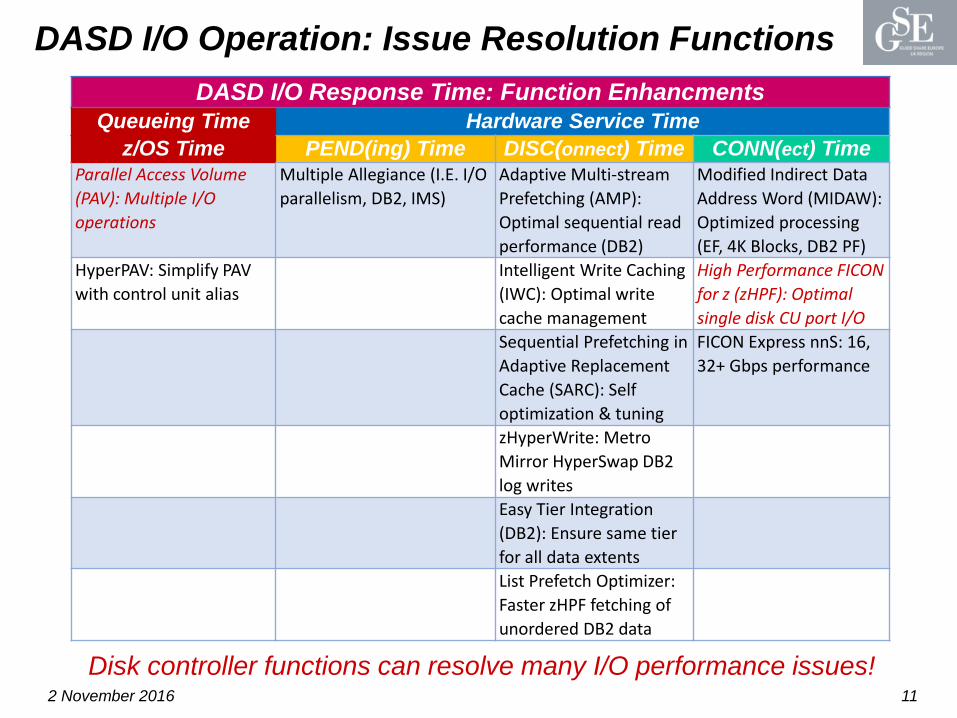
DASD I/O Operation: Issue Resolution Functions
2 November 2016 11
Disk controller functions can resolve many I/O performance issues!
DASD I/O Response Time: Function Enhancments
Queueing Time Hardware Service Time
z/OS Time PEND(ing) Time DISC(onnect) Time CONN(ect) TimeParallel Access Volume
(PAV): Multiple I/O
operations
Multiple Allegiance (I.E. I/O
parallelism, DB2, IMS)
Adaptive Multi-stream
Prefetching (AMP):
Optimal sequential read
performance (DB2)
Modified Indirect Data
Address Word (MIDAW):
Optimized processing
(EF, 4K Blocks, DB2 PF)
HyperPAV: Simplify PAV
with control unit alias
Intelligent Write Caching
(IWC): Optimal write
cache management
High Performance FICON
for z (zHPF): Optimal
single disk CU port I/O
Sequential Prefetching in
Adaptive Replacement
Cache (SARC): Self
optimization & tuning
FICON Express nnS: 16,
32+ Gbps performance
zHyperWrite: Metro
Mirror HyperSwap DB2
log writes
Easy Tier Integration
(DB2): Ensure same tier
for all data extents
List Prefetch Optimizer:
Faster zHPF fetching of
unordered DB2 data
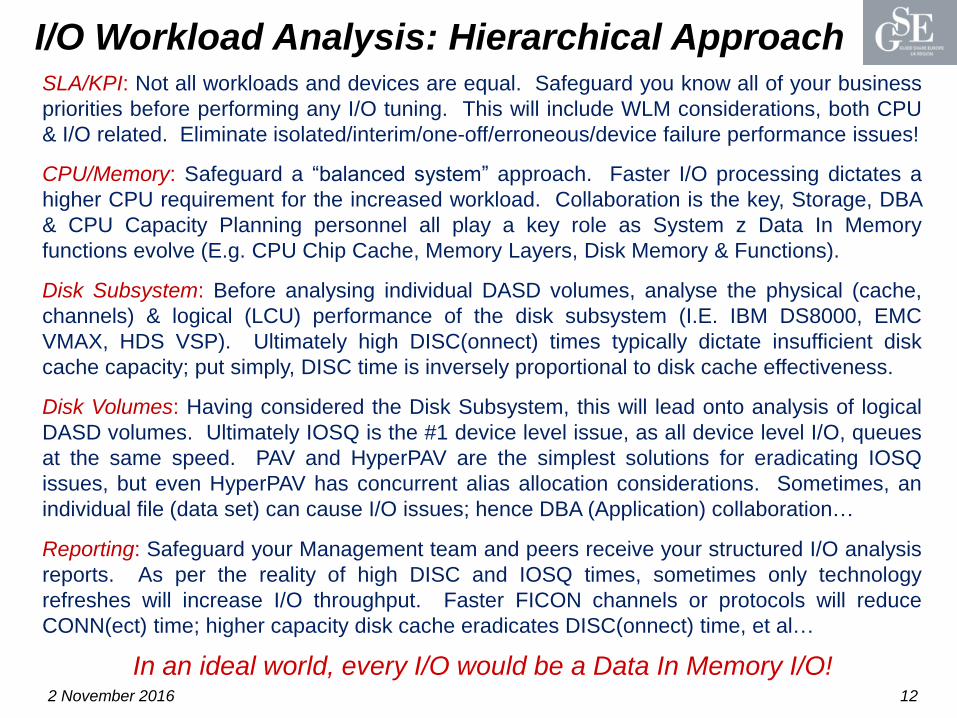
I/O Workload Analysis: Hierarchical Approach
2 November 2016 12
In an ideal world, every I/O would be a Data In Memory I/O!
SLA/KPI: Not all workloads and devices are equal. Safeguard you know all of your business
priorities before performing any I/O tuning. This will include WLM considerations, both CPU
& I/O related. Eliminate isolated/interim/one-off/erroneous/device failure performance issues!
CPU/Memory: Safeguard a “balanced system” approach. Faster I/O processing dictates a
higher CPU requirement for the increased workload. Collaboration is the key, Storage, DBA
& CPU Capacity Planning personnel all play a key role as System z Data In Memory
functions evolve (E.g. CPU Chip Cache, Memory Layers, Disk Memory & Functions).
Disk Subsystem: Before analysing individual DASD volumes, analyse the physical (cache,
channels) & logical (LCU) performance of the disk subsystem (I.E. IBM DS8000, EMC
VMAX, HDS VSP). Ultimately high DISC(onnect) times typically dictate insufficient disk
cache capacity; put simply, DISC time is inversely proportional to disk cache effectiveness.
Disk Volumes: Having considered the Disk Subsystem, this will lead onto analysis of logical
DASD volumes. Ultimately IOSQ is the #1 device level issue, as all device level I/O, queues
at the same speed. PAV and HyperPAV are the simplest solutions for eradicating IOSQ
issues, but even HyperPAV has concurrent alias allocation considerations. Sometimes, an
individual file (data set) can cause I/O issues; hence DBA (Application) collaboration…
Reporting: Safeguard your Management team and peers receive your structured I/O analysis
reports. As per the reality of high DISC and IOSQ times, sometimes only technology
refreshes will increase I/O throughput. Faster FICON channels or protocols will reduce
CONN(ect) time; higher capacity disk cache eradicates DISC(onnect) time, et al…
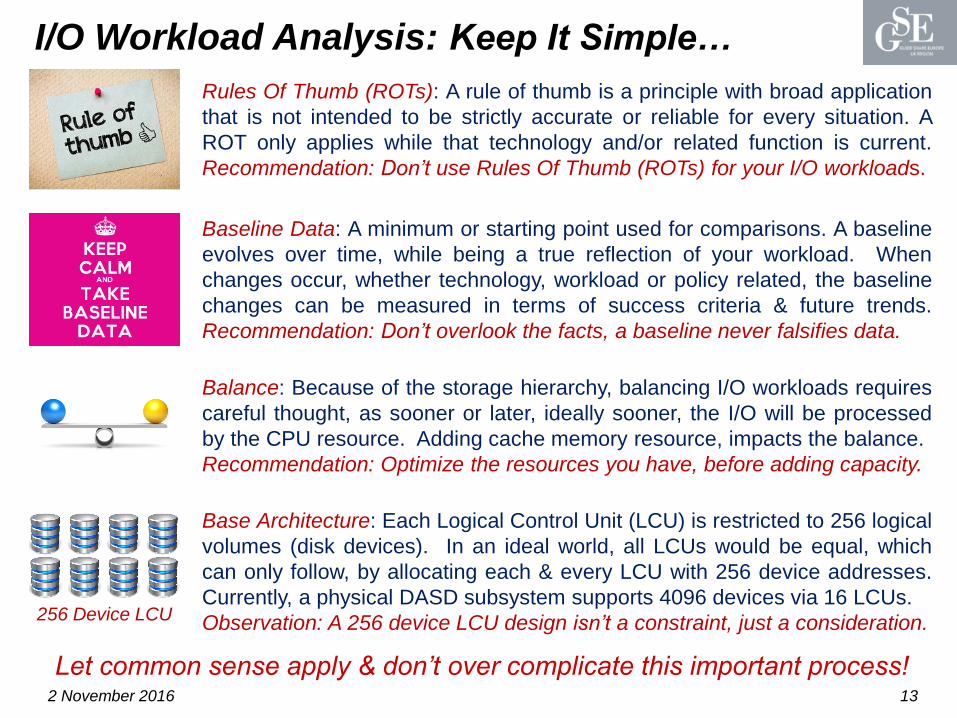
I/O Workload Analysis: Keep It Simple…
2 November 2016 13
Let common sense apply & don’t over complicate this important process!
Rules Of Thumb (ROTs): A rule of thumb is a principle with broad application
that is not intended to be strictly accurate or reliable for every situation. A
ROT only applies while that technology and/or related function is current.
Recommendation: Don’t use Rules Of Thumb (ROTs) for your I/O workloads.
Baseline Data: A minimum or starting point used for comparisons. A baseline
evolves over time, while being a true reflection of your workload. When
changes occur, whether technology, workload or policy related, the baseline
changes can be measured in terms of success criteria & future trends.
Recommendation: Don’t overlook the facts, a baseline never falsifies data.
Balance: Because of the storage hierarchy, balancing I/O workloads requires
careful thought, as sooner or later, ideally sooner, the I/O will be processed
by the CPU resource. Adding cache memory resource, impacts the balance.
Recommendation: Optimize the resources you have, before adding capacity.
256 Device LCU
Base Architecture: Each Logical Control Unit (LCU) is restricted to 256 logical
volumes (disk devices). In an ideal world, all LCUs would be equal, which
can only follow, by allocating each & every LCU with 256 device addresses.
Currently, a physical DASD subsystem supports 4096 devices via 16 LCUs.
Observation: A 256 device LCU design isn’t a constraint, just a consideration.
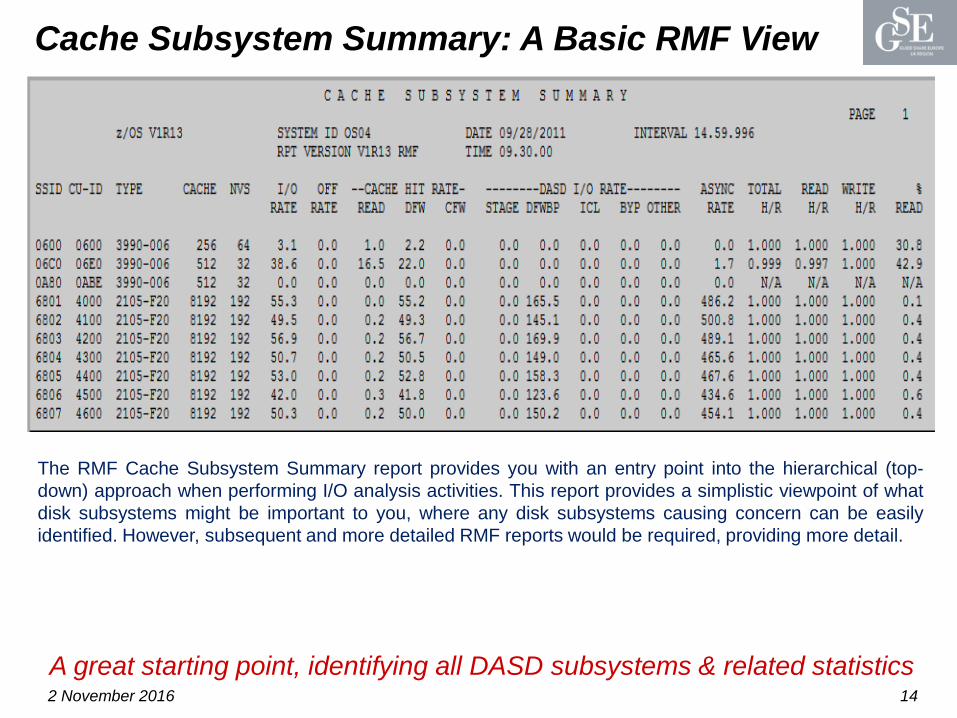
Cache Subsystem Summary: A Basic RMF View
2 November 2016 14
A great starting point, identifying all DASD subsystems & related statistics
The RMF Cache Subsystem Summary report provides you with an entry point into the hierarchical (top-
down) approach when performing I/O analysis activities. This report provides a simplistic viewpoint of what
disk subsystems might be important to you, where any disk subsystems causing concern can be easily
identified. However, subsequent and more detailed RMF reports would be required, providing more detail.
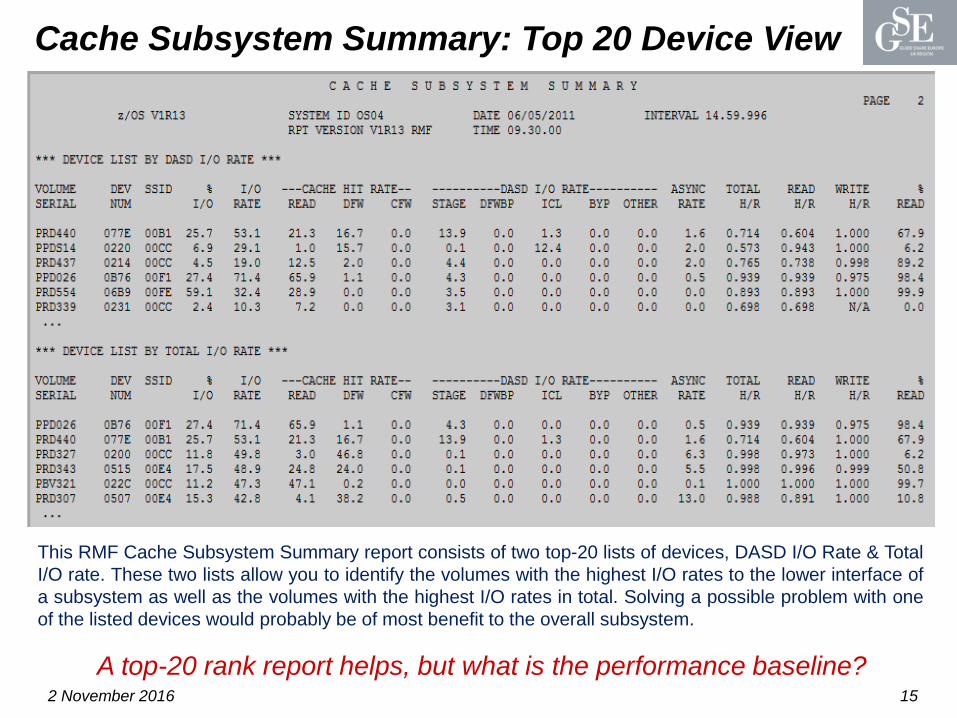
Cache Subsystem Summary: Top 20 Device View
2 November 2016 15
A top-20 rank report helps, but what is the performance baseline?
This RMF Cache Subsystem Summary report consists of two top-20 lists of devices, DASD I/O Rate & Total
I/O rate. These two lists allow you to identify the volumes with the highest I/O rates to the lower interface of
a subsystem as well as the volumes with the highest I/O rates in total. Solving a possible problem with one
of the listed devices would probably be of most benefit to the overall subsystem.
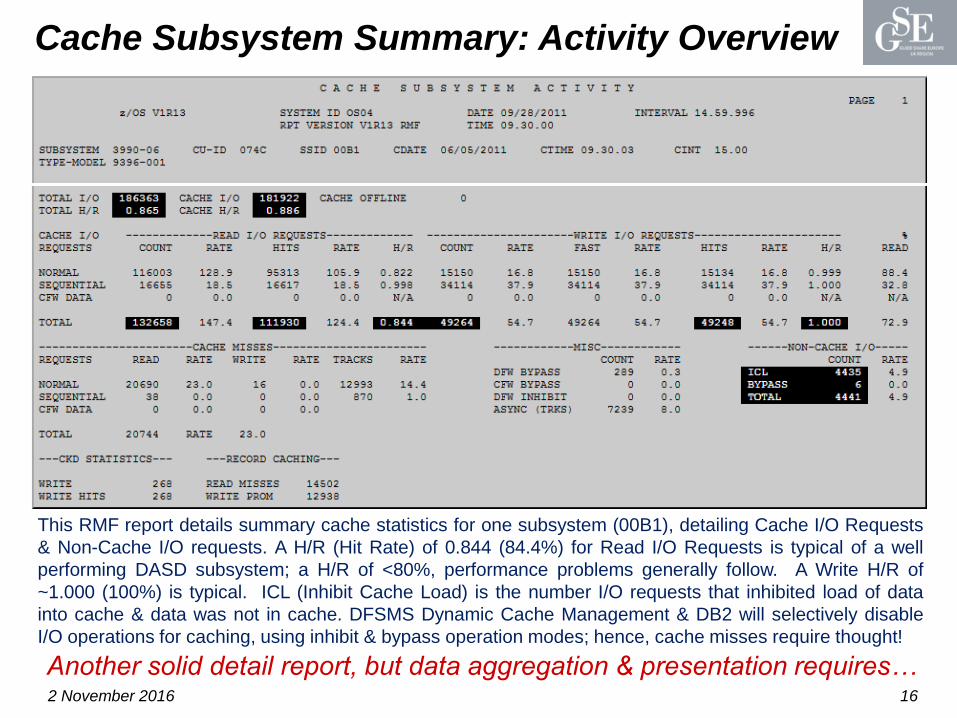
Cache Subsystem Summary: Activity Overview
2 November 2016 16
Another solid detail report, but data aggregation & presentation requires…
This RMF report details summary cache statistics for one subsystem (00B1), detailing Cache I/O Requests
& Non-Cache I/O requests. A H/R (Hit Rate) of 0.844 (84.4%) for Read I/O Requests is typical of a well
performing DASD subsystem; a H/R of <80%, performance problems generally follow. A Write H/R of
~1.000 (100%) is typical. ICL (Inhibit Cache Load) is the number I/O requests that inhibited load of data
into cache & data was not in cache. DFSMS Dynamic Cache Management & DB2 will selectively disable
I/O operations for caching, using inhibit & bypass operation modes; hence, cache misses require thought!
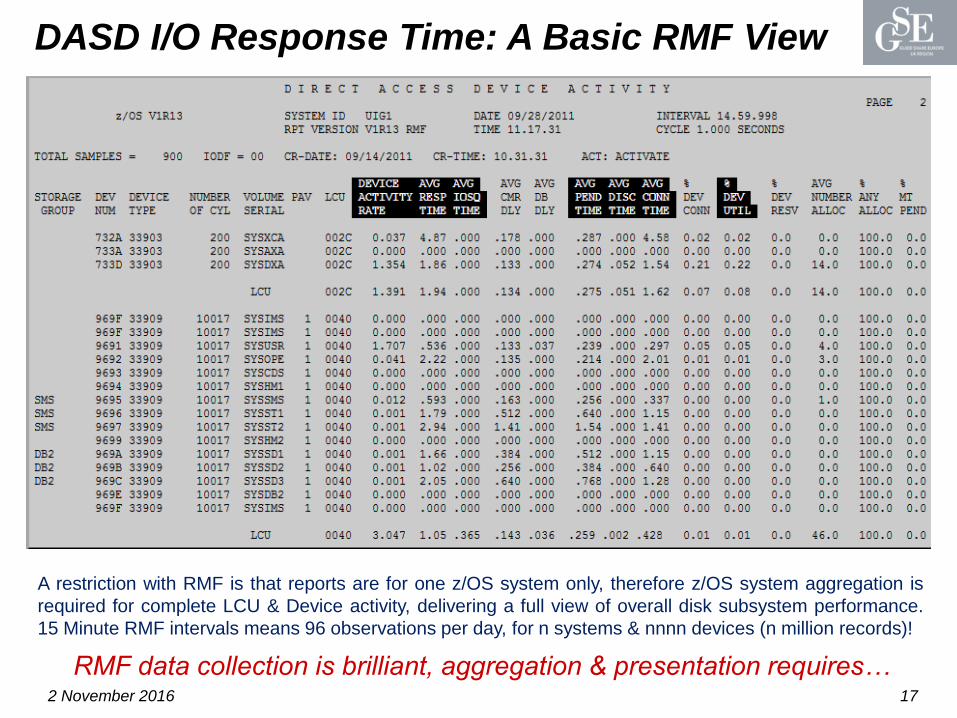
DASD I/O Response Time: A Basic RMF View
2 November 2016 17
RMF data collection is brilliant, aggregation & presentation requires…
A restriction with RMF is that reports are for one z/OS system only, therefore z/OS system aggregation is
required for complete LCU & Device activity, delivering a full view of overall disk subsystem performance.
15 Minute RMF intervals means 96 observations per day, for n systems & nnnn devices (n million records)!
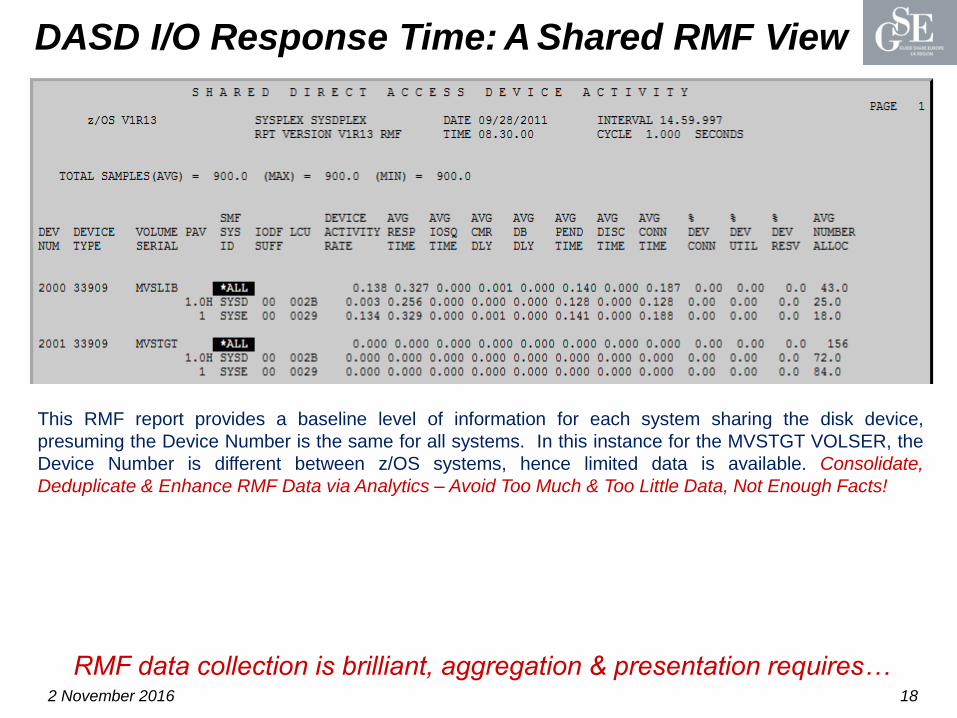
DASD I/O Response Time: A Shared RMF View
2 November 2016 18
RMF data collection is brilliant, aggregation & presentation requires…
This RMF report provides a baseline level of information for each system sharing the disk device,
presuming the Device Number is the same for all systems. In this instance for the MVSTGT VOLSER, the
Device Number is different between z/OS systems, hence limited data is available. Consolidate,
Deduplicate & Enhance RMF Data via Analytics – Avoid Too Much & Too Little Data, Not Enough Facts!
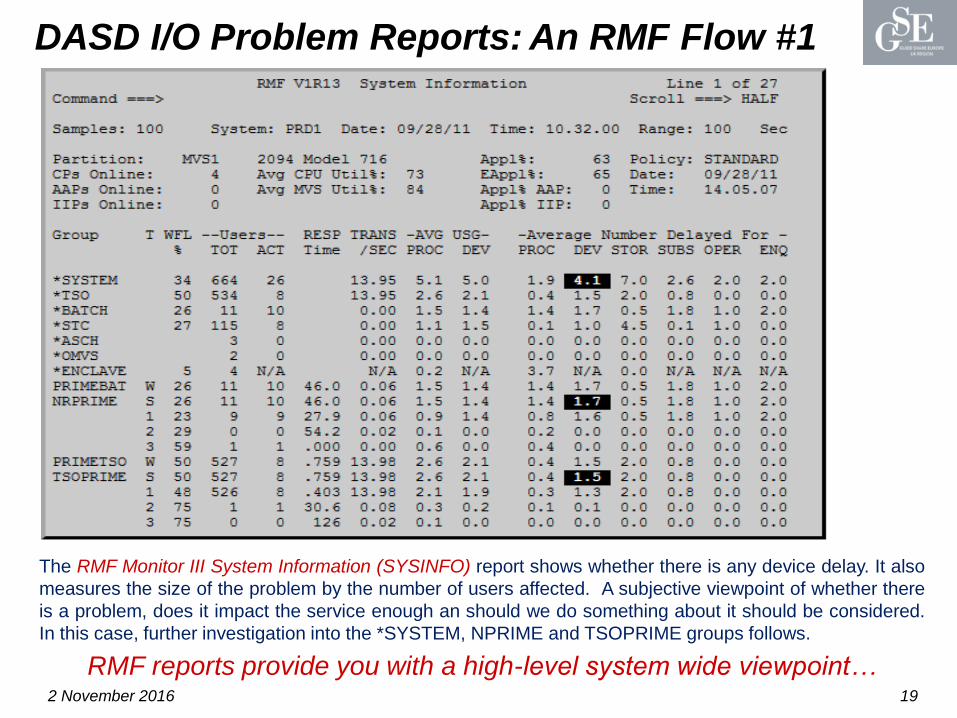
DASD I/O Problem Reports: An RMF Flow #1
2 November 2016 19
RMF reports provide you with a high-level system wide viewpoint…
The RMF Monitor III System Information (SYSINFO) report shows whether there is any device delay. It also
measures the size of the problem by the number of users affected. A subjective viewpoint of whether there
is a problem, does it impact the service enough an should we do something about it should be considered.
In this case, further investigation into the *SYSTEM, NPRIME and TSOPRIME groups follows.
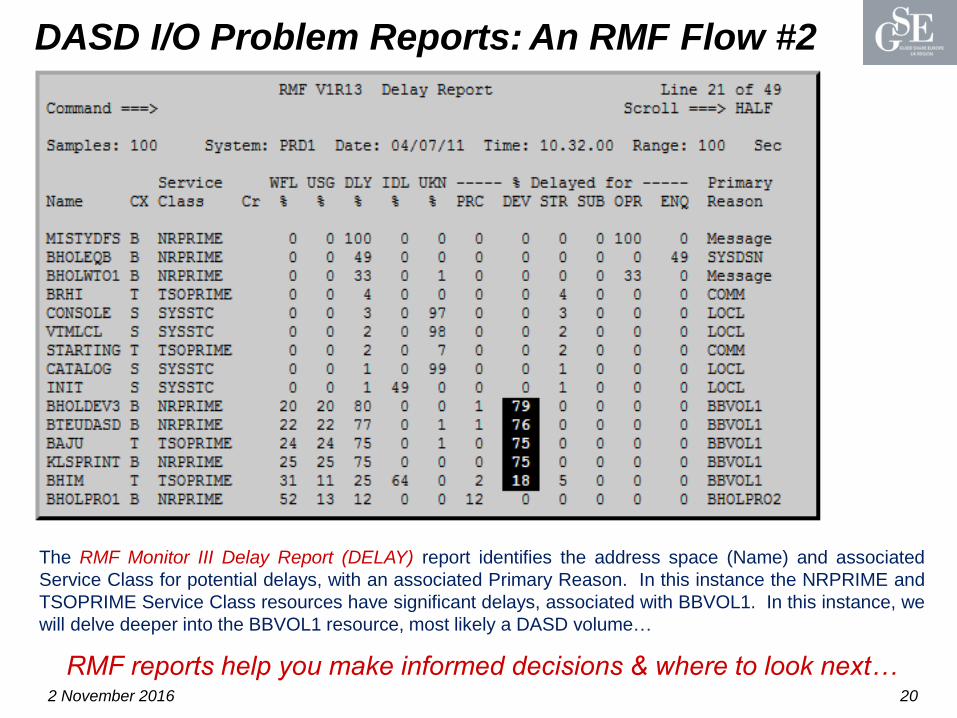
DASD I/O Problem Reports: An RMF Flow #2
2 November 2016 20
RMF reports help you make informed decisions & where to look next…
The RMF Monitor III Delay Report (DELAY) report identifies the address space (Name) and associated
Service Class for potential delays, with an associated Primary Reason. In this instance the NRPRIME and
TSOPRIME Service Class resources have significant delays, associated with BBVOL1. In this instance, we
will delve deeper into the BBVOL1 resource, most likely a DASD volume…
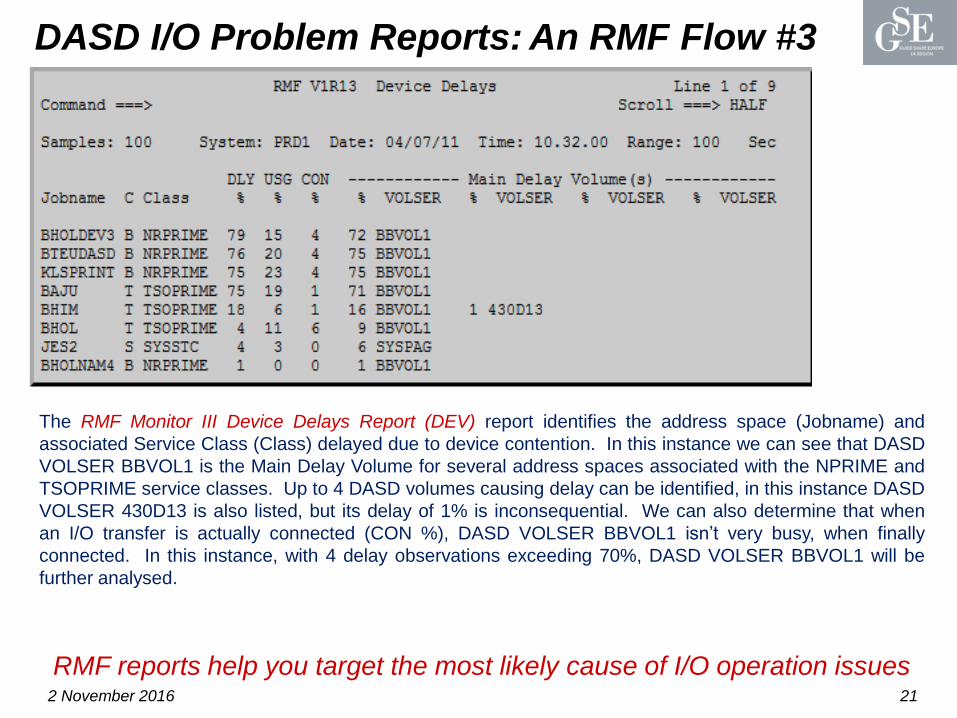
DASD I/O Problem Reports: An RMF Flow #3
2 November 2016 21
RMF reports help you target the most likely cause of I/O operation issues
The RMF Monitor III Device Delays Report (DEV) report identifies the address space (Jobname) and
associated Service Class (Class) delayed due to device contention. In this instance we can see that DASD
VOLSER BBVOL1 is the Main Delay Volume for several address spaces associated with the NPRIME and
TSOPRIME service classes. Up to 4 DASD volumes causing delay can be identified, in this instance DASD
VOLSER 430D13 is also listed, but its delay of 1% is inconsequential. We can also determine that when
an I/O transfer is actually connected (CON %), DASD VOLSER BBVOL1 isn’t very busy, when finally
connected. In this instance, with 4 delay observations exceeding 70%, DASD VOLSER BBVOL1 will be
further analysed.
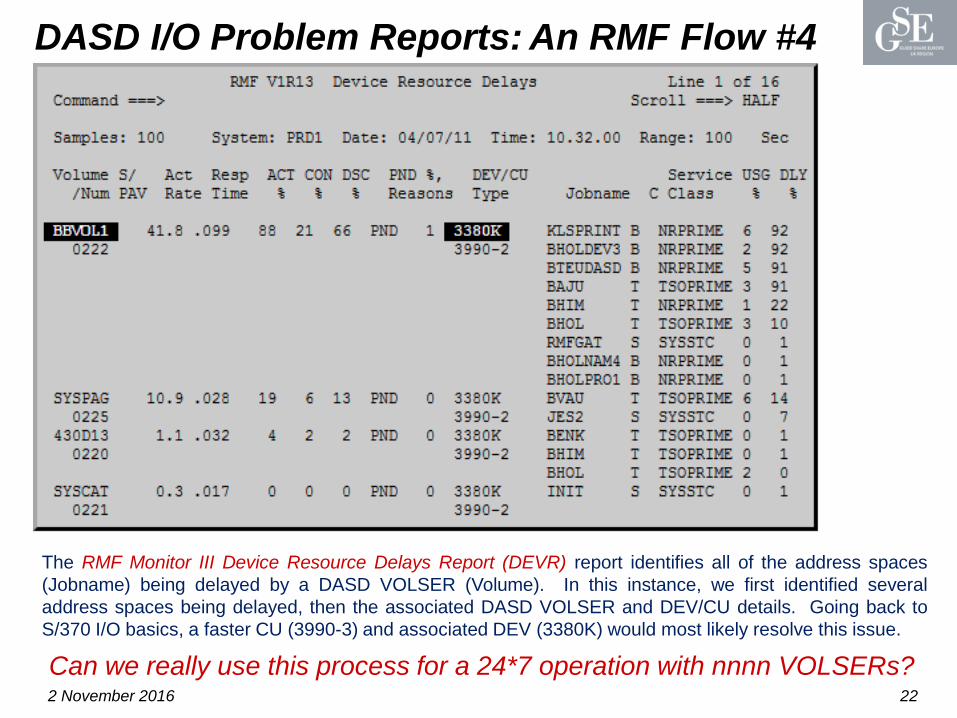
DASD I/O Problem Reports: An RMF Flow #4
2 November 2016 22
Can we really use this process for a 24*7 operation with nnnn VOLSERs?
The RMF Monitor III Device Resource Delays Report (DEVR) report identifies all of the address spaces
(Jobname) being delayed by a DASD VOLSER (Volume). In this instance, we first identified several
address spaces being delayed, then the associated DASD VOLSER and DEV/CU details. Going back to
S/370 I/O basics, a faster CU (3990-3) and associated DEV (3380K) would most likely resolve this issue.
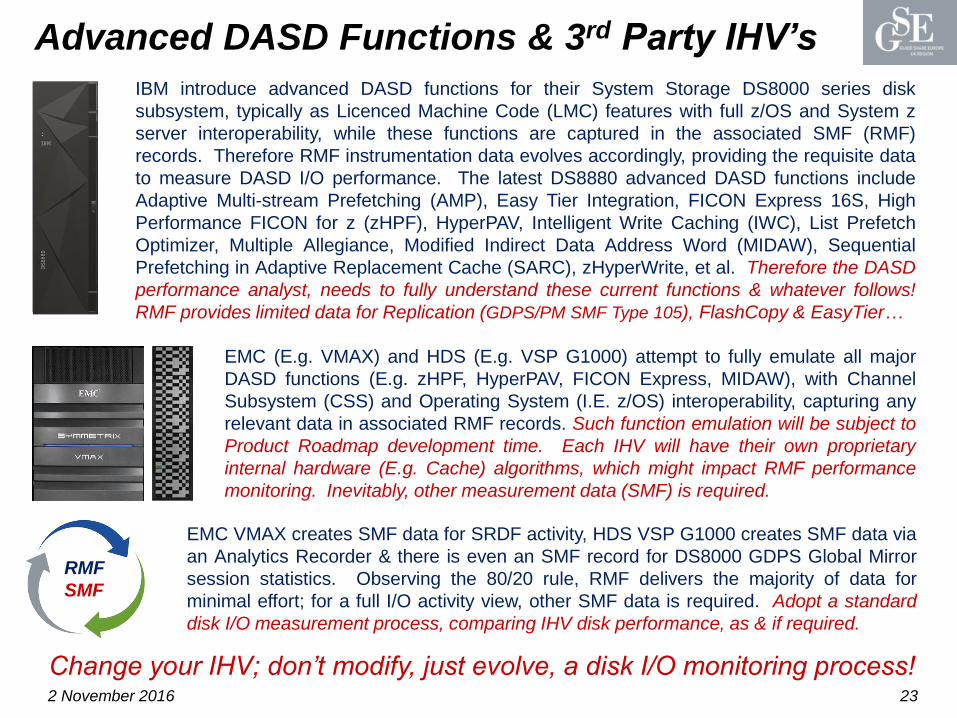
Advanced DASD Functions & 3rd Party IHV’s
2 November 2016 23
Change your IHV; don’t modify, just evolve, a disk I/O monitoring process!
IBM introduce advanced DASD functions for their System Storage DS8000 series disk
subsystem, typically as Licenced Machine Code (LMC) features with full z/OS and System z
server interoperability, while these functions are captured in the associated SMF (RMF)
records. Therefore RMF instrumentation data evolves accordingly, providing the requisite data
to measure DASD I/O performance. The latest DS8880 advanced DASD functions include
Adaptive Multi-stream Prefetching (AMP), Easy Tier Integration, FICON Express 16S, High
Performance FICON for z (zHPF), HyperPAV, Intelligent Write Caching (IWC), List Prefetch
Optimizer, Multiple Allegiance, Modified Indirect Data Address Word (MIDAW), Sequential
Prefetching in Adaptive Replacement Cache (SARC), zHyperWrite, et al. Therefore the DASD
performance analyst, needs to fully understand these current functions & whatever follows!
RMF provides limited data for Replication (GDPS/PM SMF Type 105), FlashCopy & EasyTier…
EMC (E.g. VMAX) and HDS (E.g. VSP G1000) attempt to fully emulate all major
DASD functions (E.g. zHPF, HyperPAV, FICON Express, MIDAW), with Channel
Subsystem (CSS) and Operating System (I.E. z/OS) interoperability, capturing any
relevant data in associated RMF records. Such function emulation will be subject to
Product Roadmap development time. Each IHV will have their own proprietary
internal hardware (E.g. Cache) algorithms, which might impact RMF performance
monitoring. Inevitably, other measurement data (SMF) is required.
EMC VMAX creates SMF data for SRDF activity, HDS VSP G1000 creates SMF data via
an Analytics Recorder & there is even an SMF record for DS8000 GDPS Global Mirror
session statistics. Observing the 80/20 rule, RMF delivers the majority of data for
minimal effort; for a full I/O activity view, other SMF data is required. Adopt a standard
disk I/O measurement process, comparing IHV disk performance, as & if required.
RMF
SMF
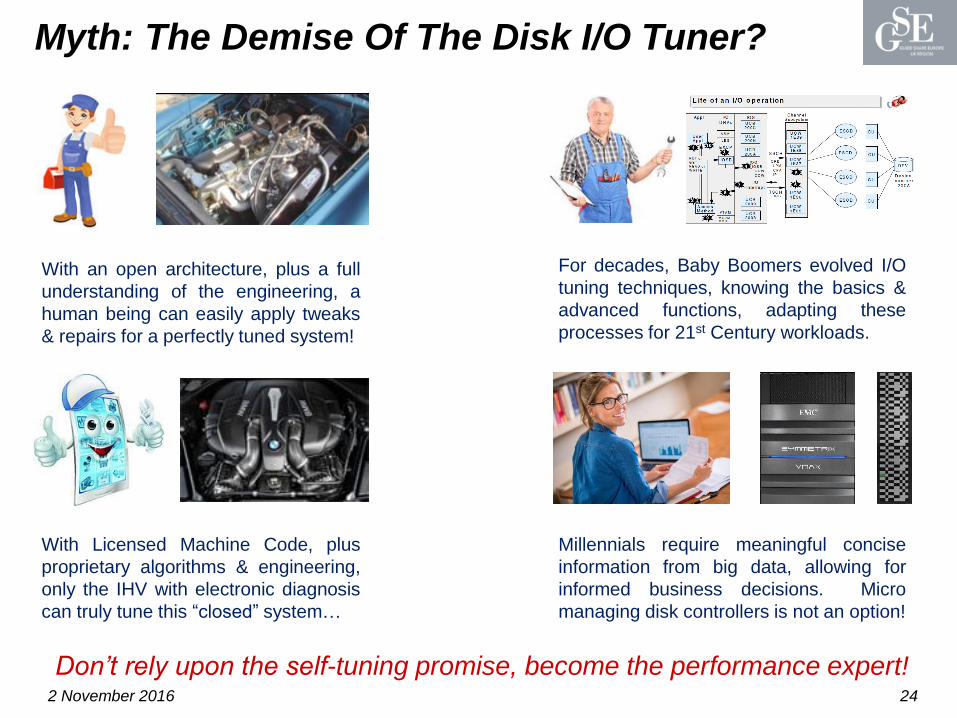
Myth: The Demise Of The Disk I/O Tuner?
2 November 2016 24
Don’t rely upon the self-tuning promise, become the performance expert!
With an open architecture, plus a full
understanding of the engineering, a
human being can easily apply tweaks
& repairs for a perfectly tuned system!
With Licensed Machine Code, plus
proprietary algorithms & engineering,
only the IHV with electronic diagnosis
can truly tune this “closed” system…
For decades, Baby Boomers evolved I/O
tuning techniques, knowing the basics &
advanced functions, adapting these
processes for 21st Century workloads.
Millennials require meaningful concise
information from big data, allowing for
informed business decisions. Micro
managing disk controllers is not an option!
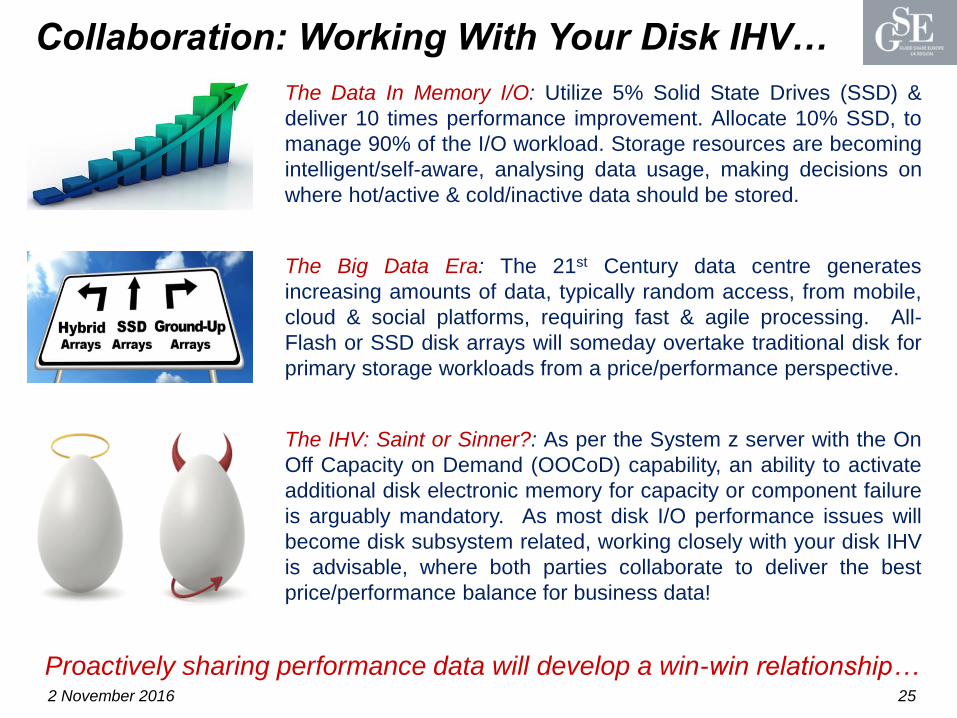
Collaboration: Working With Your Disk IHV…
2 November 2016 25
Proactively sharing performance data will develop a win-win relationship…
The Data In Memory I/O: Utilize 5% Solid State Drives (SSD) &
deliver 10 times performance improvement. Allocate 10% SSD, to
manage 90% of the I/O workload. Storage resources are becoming
intelligent/self-aware, analysing data usage, making decisions on
where hot/active & cold/inactive data should be stored.
The Big Data Era: The 21st Century data centre generates
increasing amounts of data, typically random access, from mobile,
cloud & social platforms, requiring fast & agile processing. All-
Flash or SSD disk arrays will someday overtake traditional disk for
primary storage workloads from a price/performance perspective.
The IHV: Saint or Sinner?: As per the System z server with the On
Off Capacity on Demand (OOCoD) capability, an ability to activate
additional disk electronic memory for capacity or component failure
is arguably mandatory. As most disk I/O performance issues will
become disk subsystem related, working closely with your disk IHV
is advisable, where both parties collaborate to deliver the best
price/performance balance for business data!
DASD I/O Performance: Recommendations
2 November 2016 26
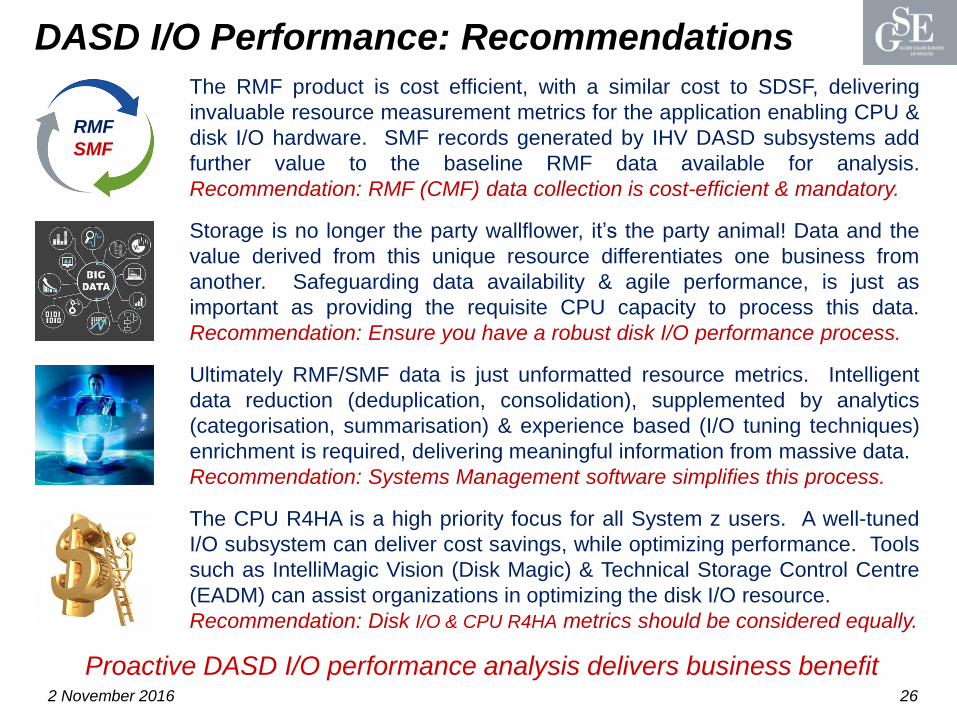
Proactive DASD I/O performance analysis delivers business benefit
The RMF product is cost efficient, with a similar cost to SDSF, delivering
invaluable resource measurement metrics for the application enabling CPU &
disk I/O hardware. SMF records generated by IHV DASD subsystems add
further value to the baseline RMF data available for analysis.
Recommendation: RMF (CMF) data collection is cost-efficient & mandatory.
RMF
SMF
Storage is no longer the party wallflower, it’s the party animal! Data and the
value derived from this unique resource differentiates one business from
another. Safeguarding data availability & agile performance, is just as
important as providing the requisite CPU capacity to process this data.
Recommendation: Ensure you have a robust disk I/O performance process.
Ultimately RMF/SMF data is just unformatted resource metrics. Intelligent
data reduction (deduplication, consolidation), supplemented by analytics
(categorisation, summarisation) & experience based (I/O tuning techniques)
enrichment is required, delivering meaningful information from massive data.
Recommendation: Systems Management software simplifies this process.
The CPU R4HA is a high priority focus for all System z users. A well-tuned
I/O subsystem can deliver cost savings, while optimizing performance. Tools
such as IntelliMagic Vision (Disk Magic) & Technical Storage Control Centre
(EADM) can assist organizations in optimizing the disk I/O resource.
Recommendation: Disk I/O & CPU R4HA metrics should be considered equally.
Case Study 1: z13 Server Memory Upgrade
2 November 2016 27
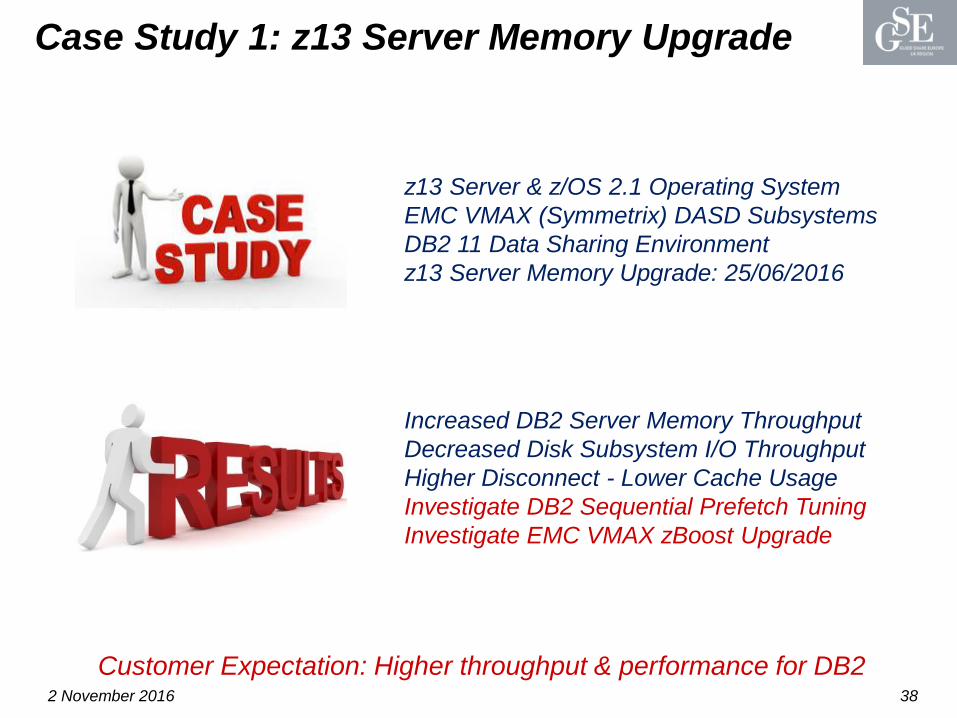
Customer Expectation: Higher throughput & performance for DB2
z13 Server & z/OS 2.1 Operating System
EMC VMAX (Symmetrix) DASD Subsystems
DB2 11 Data Sharing Environment
z13 Server Memory Upgrade: 25/06/2016
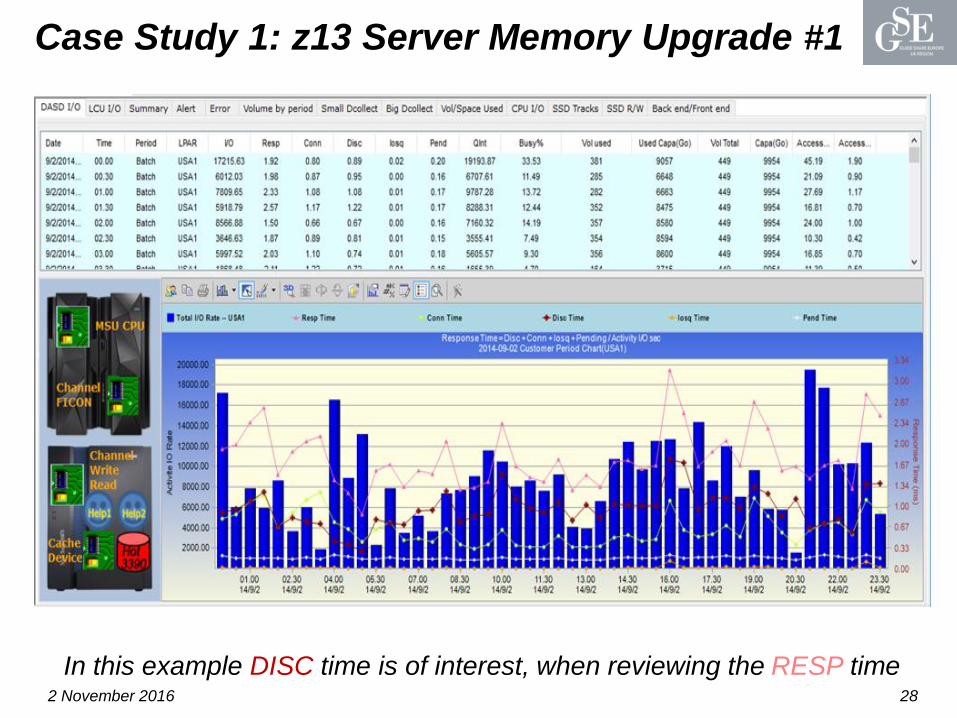
Case Study 1: z13 Server Memory Upgrade #1
2 November 2016 28
In this example DISC time is of interest, when reviewing the RESP time
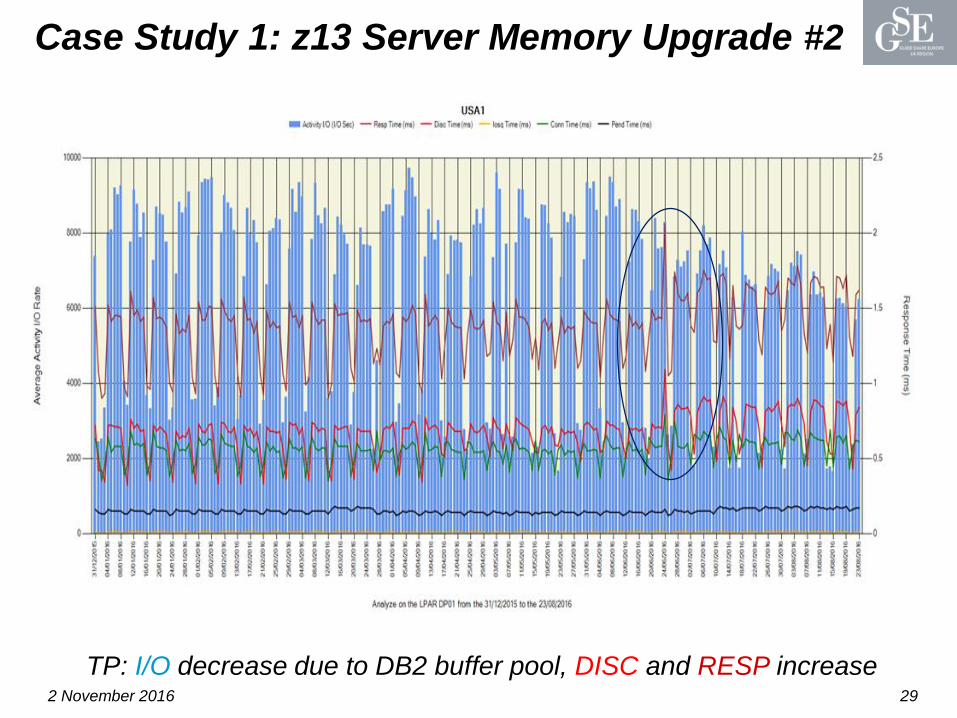
Case Study 1: z13 Server Memory Upgrade #2
2 November 2016 29
TP: I/O decrease due to DB2 buffer pool, DISC and RESP increase
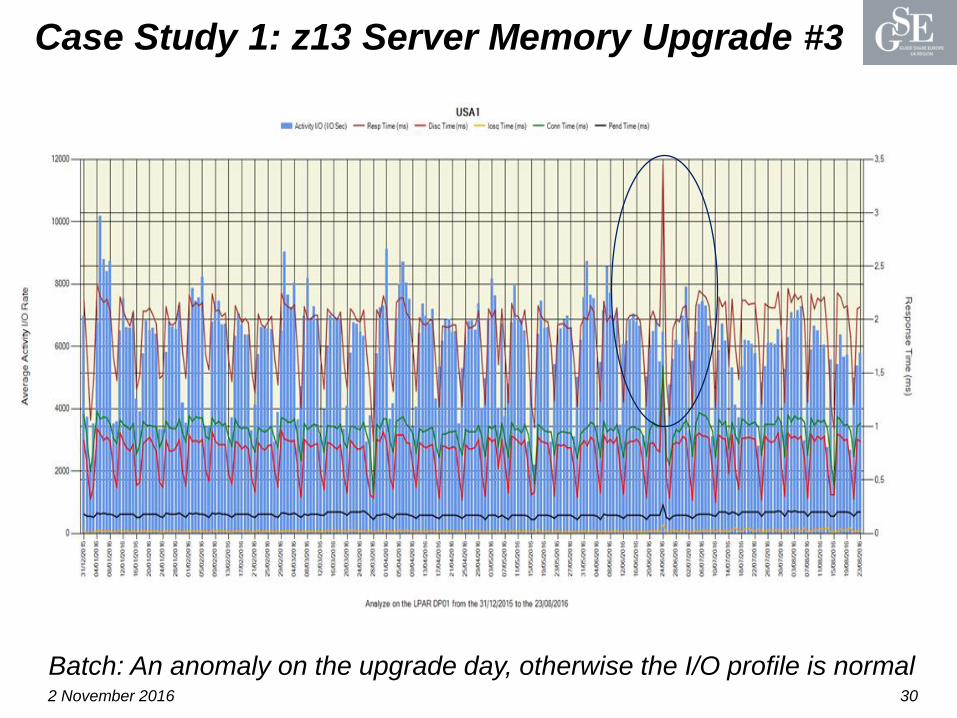
Case Study 1: z13 Server Memory Upgrade #3
2 November 2016 30
Batch: An anomaly on the upgrade day, otherwise the I/O profile is normal
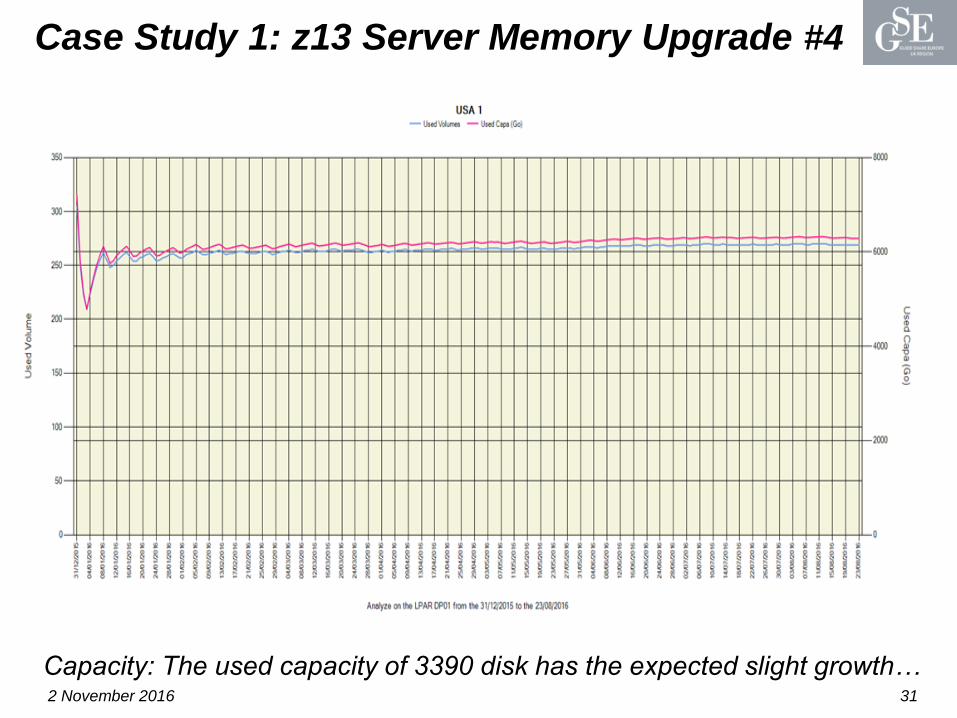
Case Study 1: z13 Server Memory Upgrade #4
2 November 2016 31
Capacity: The used capacity of 3390 disk has the expected slight growth…
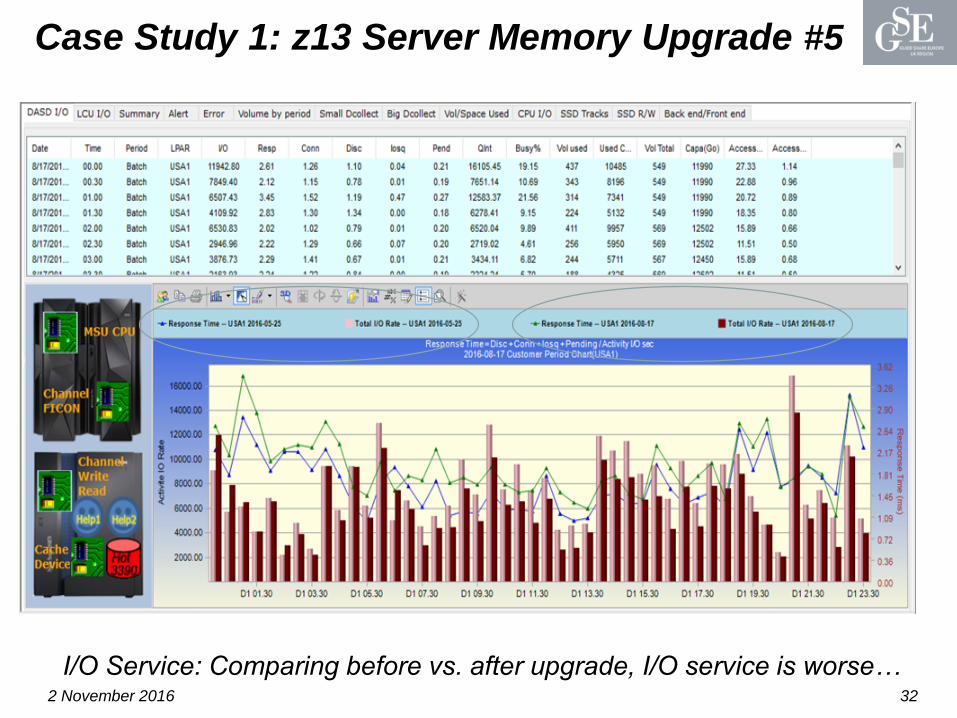
Case Study 1: z13 Server Memory Upgrade #5
2 November 2016 32
I/O Service: Comparing before vs. after upgrade, I/O service is worse…
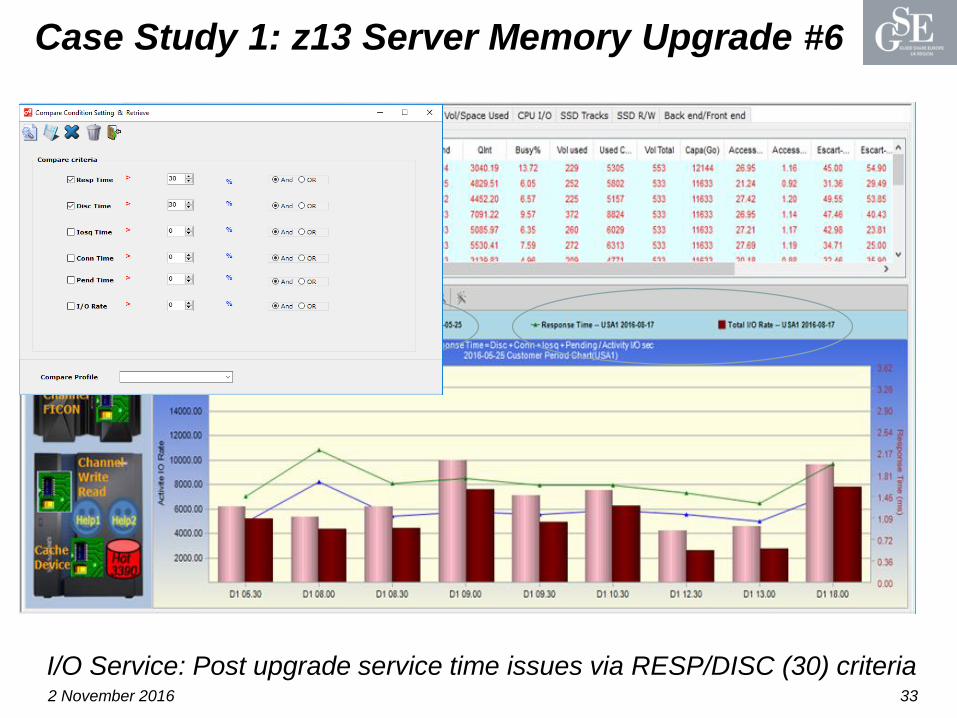
Case Study 1: z13 Server Memory Upgrade #6
2 November 2016 33
I/O Service: Post upgrade service time issues via RESP/DISC (30) criteria
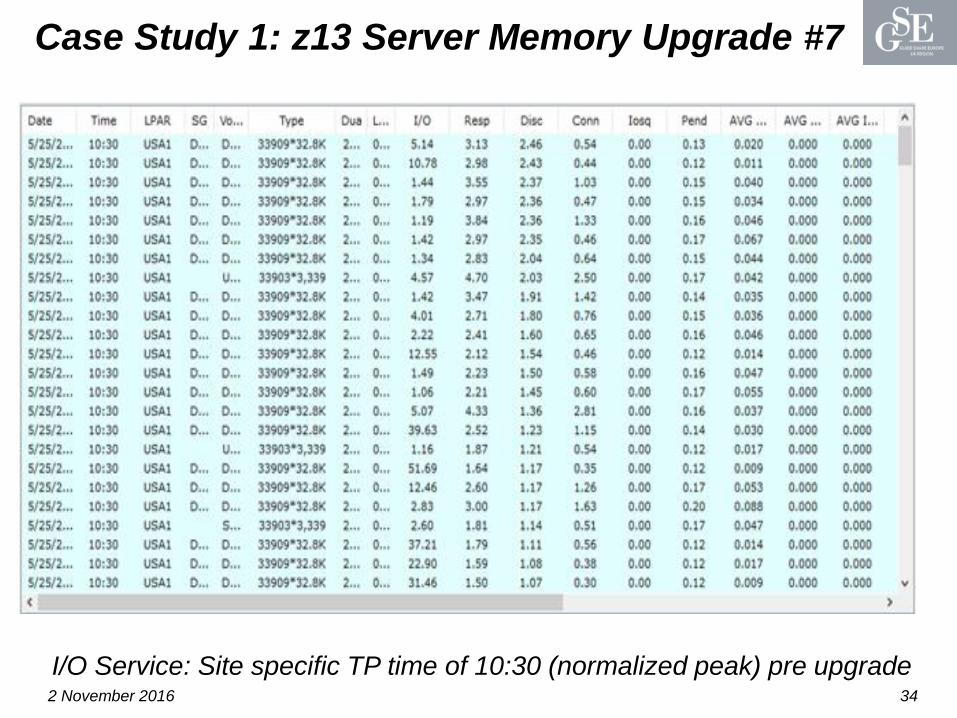
Case Study 1: z13 Server Memory Upgrade #7
2 November 2016 34
I/O Service: Site specific TP time of 10:30 (normalized peak) pre upgrade
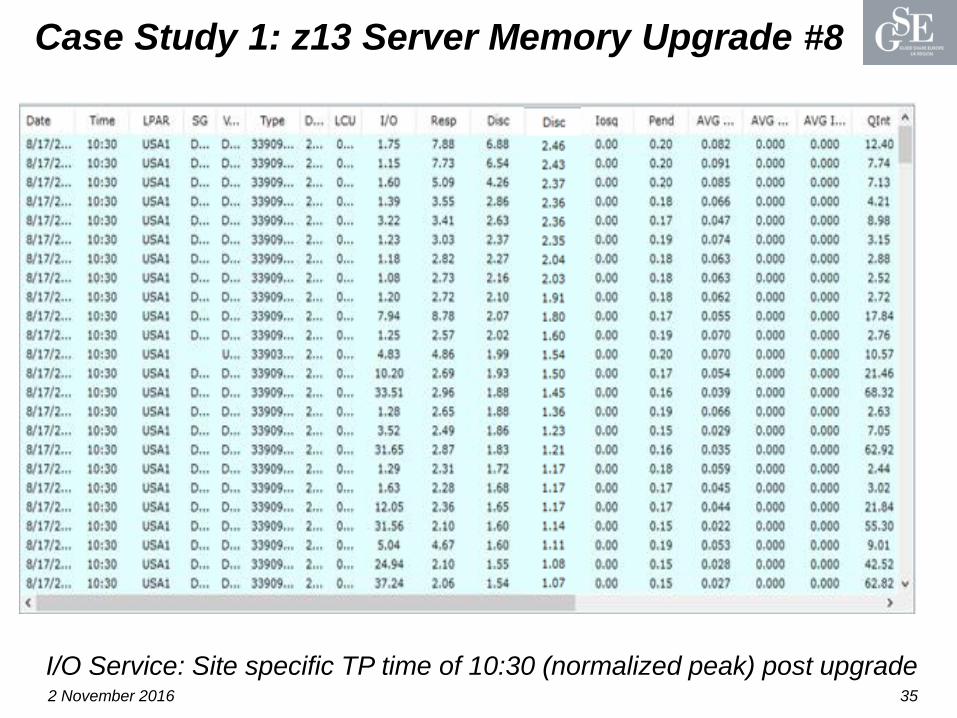
Case Study 1: z13 Server Memory Upgrade #8
2 November 2016 35
I/O Service: Site specific TP time of 10:30 (normalized peak) post upgrade
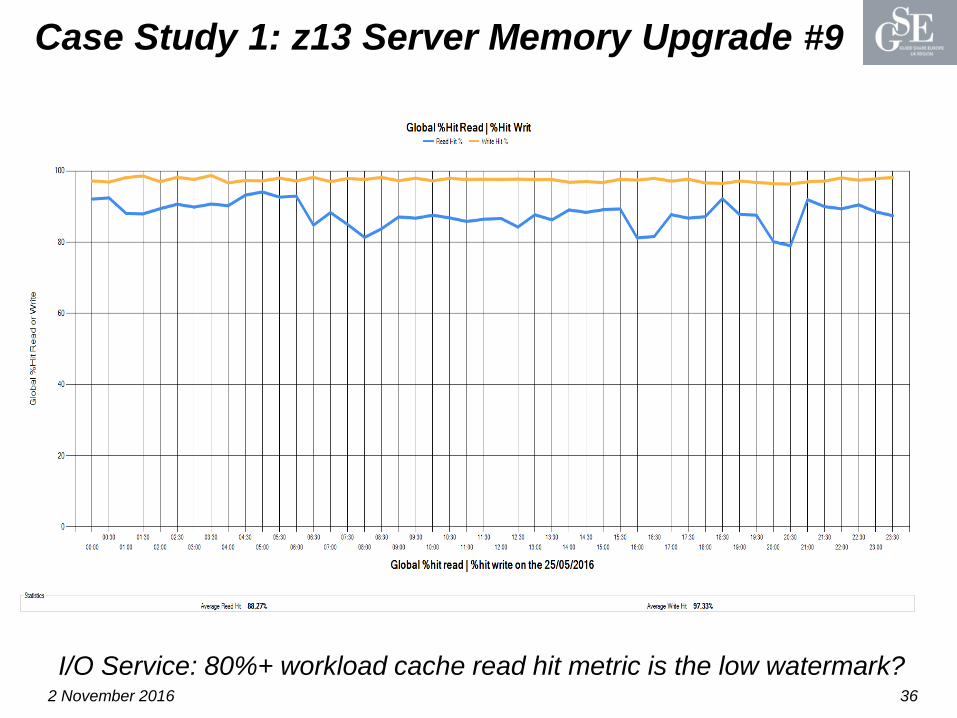
Case Study 1: z13 Server Memory Upgrade #9
2 November 2016 36
I/O Service: 80%+ workload cache read hit metric is the low watermark?
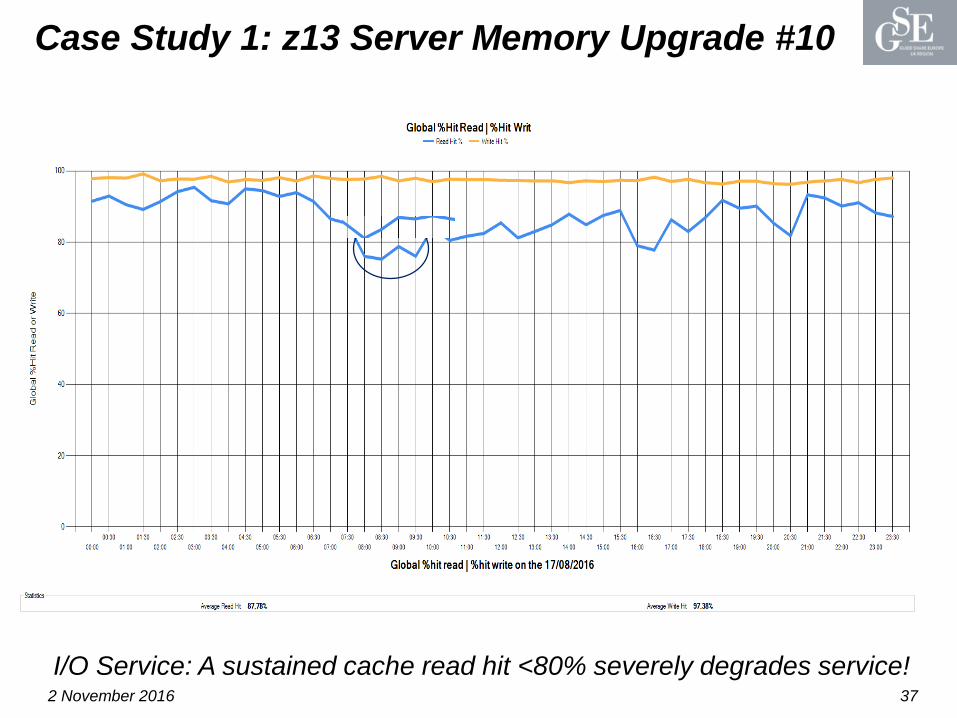
Case Study 1: z13 Server Memory Upgrade #10
2 November 2016 37
I/O Service: A sustained cache read hit <80% severely degrades service!
Case Study 1: z13 Server Memory Upgrade
2 November 2016 38
Customer Expectation: Higher throughput & performance for DB2
z13 Server & z/OS 2.1 Operating System
EMC VMAX (Symmetrix) DASD Subsystems
DB2 11 Data Sharing Environment
z13 Server Memory Upgrade: 25/06/2016
Increased DB2 Server Memory Throughput
Decreased Disk Subsystem I/O Throughput
Higher Disconnect - Lower Cache Usage
Investigate DB2 Sequential Prefetch Tuning
Investigate EMC VMAX zBoost Upgrade
Case Study 2: DB2 Performance Problems
2 November 2016 39
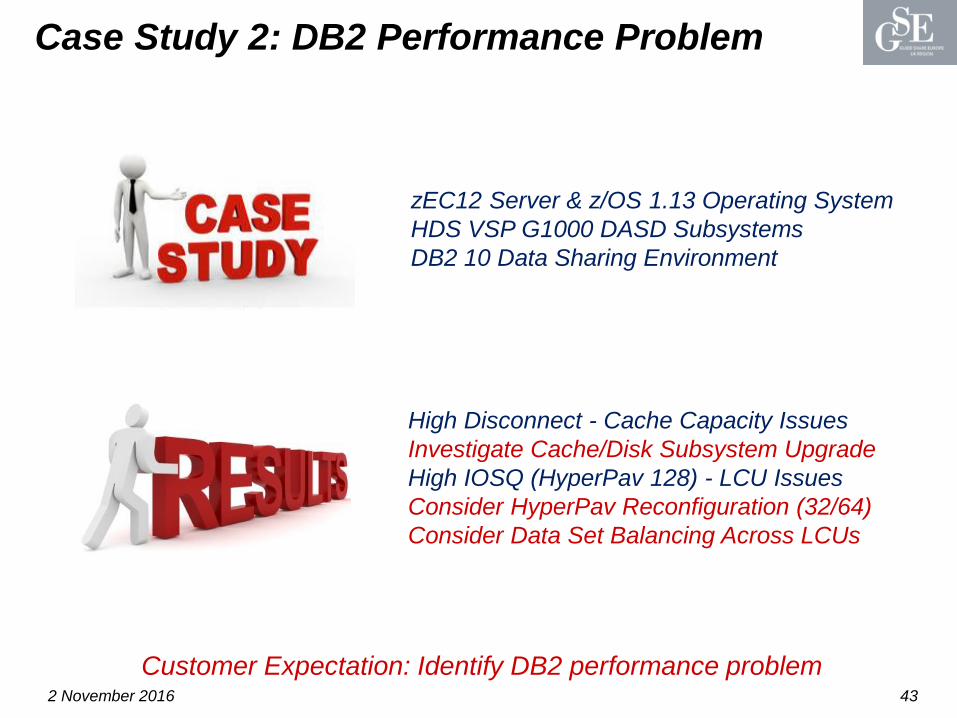
Customer Expectation: Identify DB2 performance problem
zEC12 Server & z/OS 1.13 Operating System
HDS VSP G1000 DASD Subsystems
DB2 10 Data Sharing Environment
Case Study 2: DB2 Performance Problem #1
2 November 2016 40
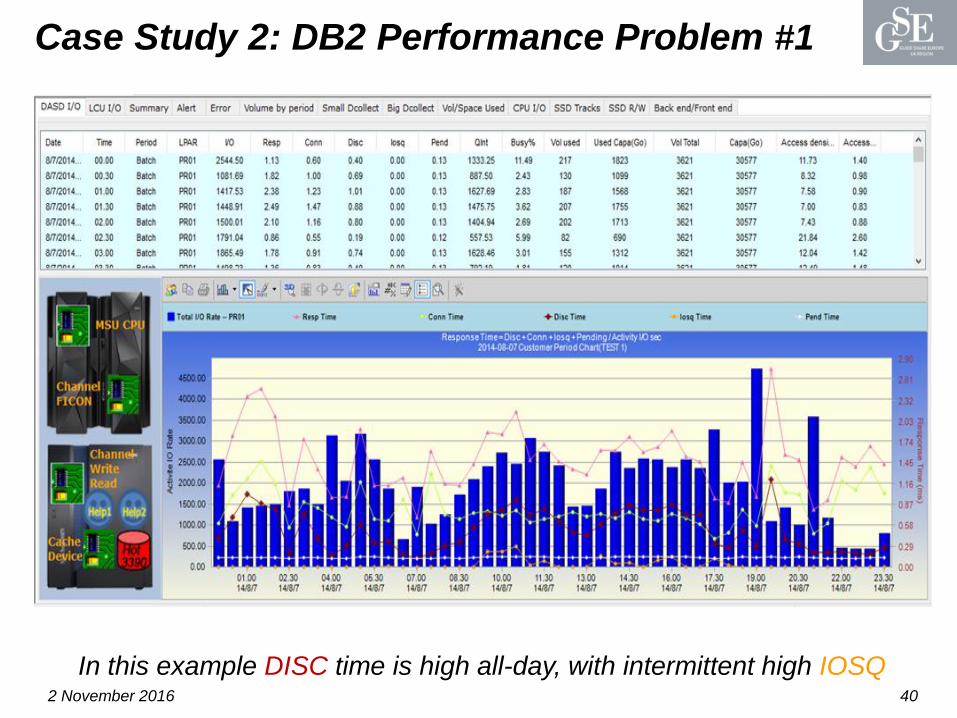
In this example DISC time is high all-day, with intermittent high IOSQ
Case Study 2: DB2 Performance Problem #2
2 November 2016 41
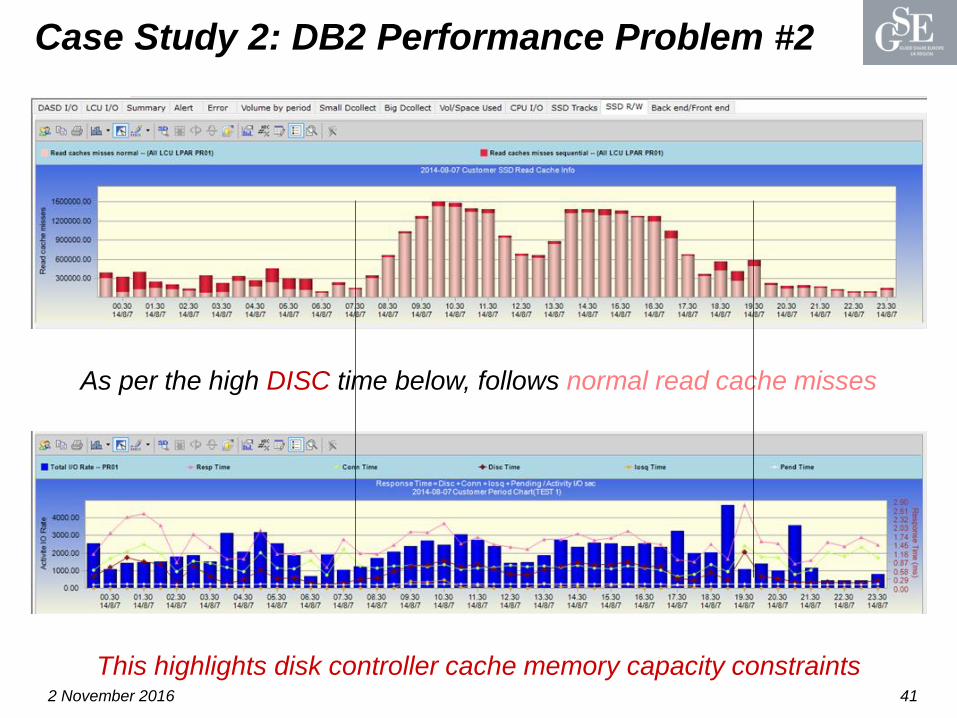
This highlights disk controller cache memory capacity constraints
As per the high DISC time below, follows normal read cache misses
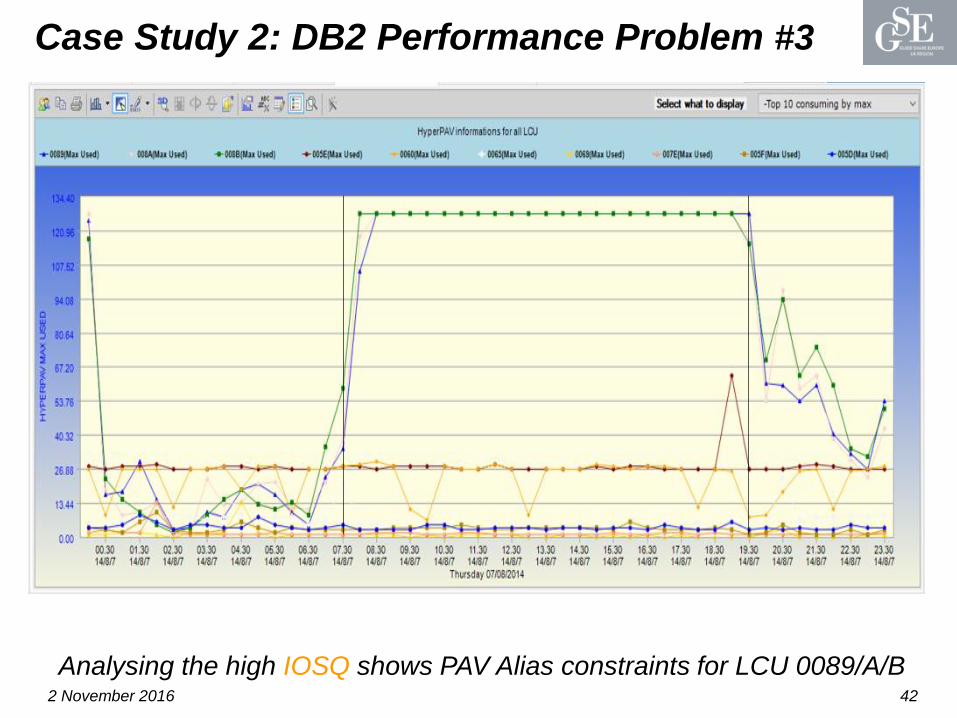
Case Study 2: DB2 Performance Problem #3
2 November 2016 42
Analysing the high IOSQ shows PAV Alias constraints for LCU 0089/A/B
2 November 2016 43
Case Study 2: DB2 Performance Problem
High Disconnect - Cache Capacity Issues
Investigate Cache/Disk Subsystem Upgrade
High IOSQ (HyperPav 128) - LCU Issues
Consider HyperPav Reconfiguration (32/64)
Consider Data Set Balancing Across LCUs
zEC12 Server & z/OS 1.13 Operating System
HDS VSP G1000 DASD Subsystems
DB2 10 Data Sharing Environment
Customer Expectation: Identify DB2 performance problem
2 November 2016 44
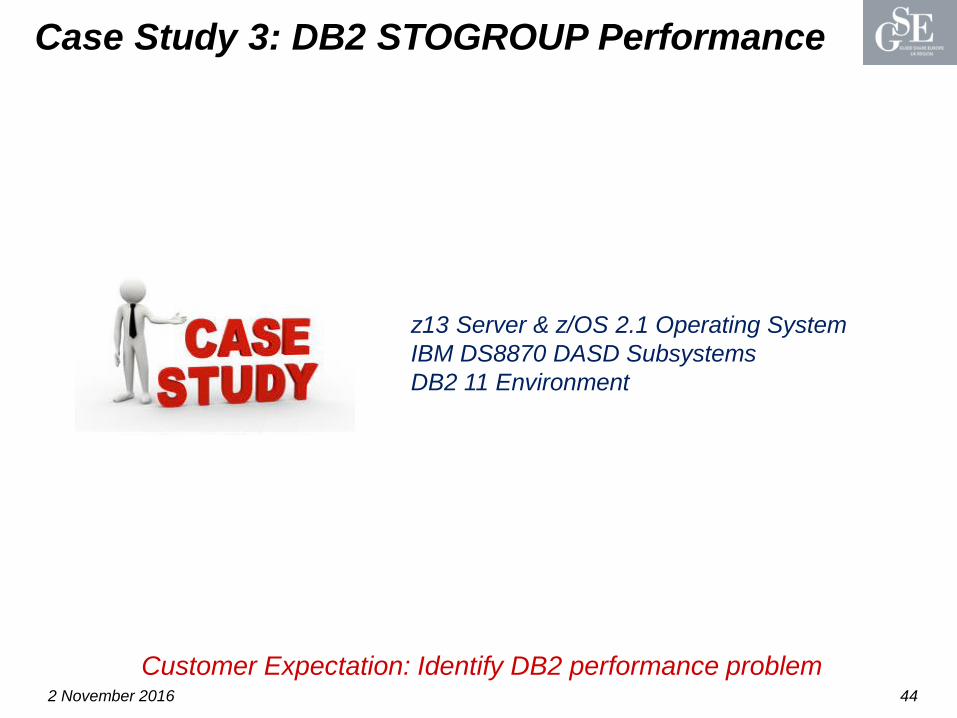
Case Study 3: DB2 STOGROUP Performance
Customer Expectation: Identify DB2 performance problem
z13 Server & z/OS 2.1 Operating System
IBM DS8870 DASD Subsystems
DB2 11 Environment
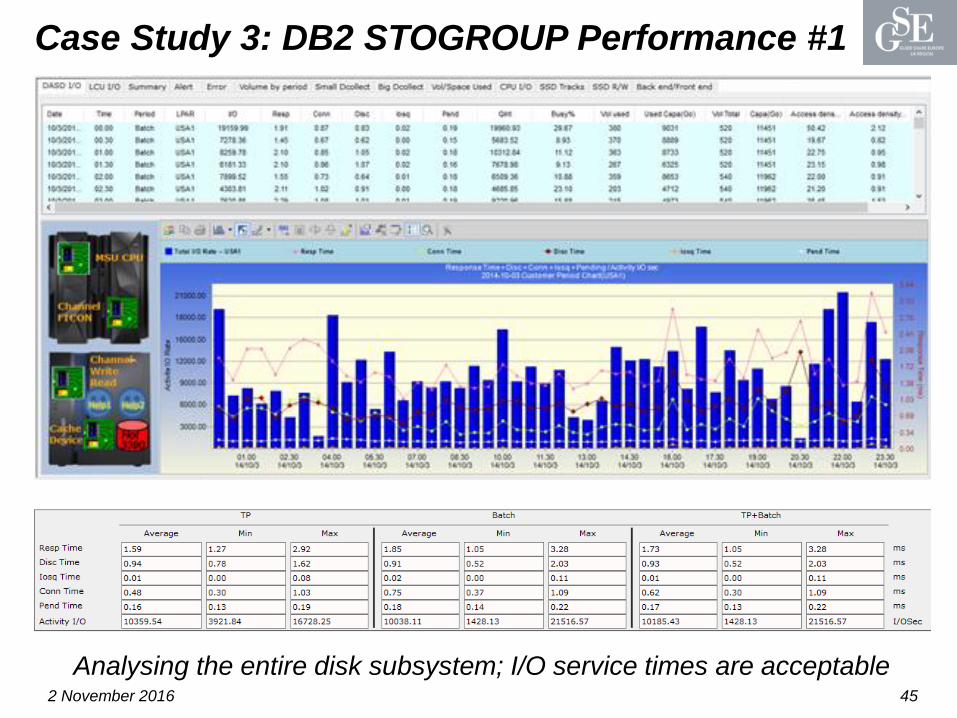
Case Study 3: DB2 STOGROUP Performance #1
2 November 2016 45
Analysing the entire disk subsystem; I/O service times are acceptable
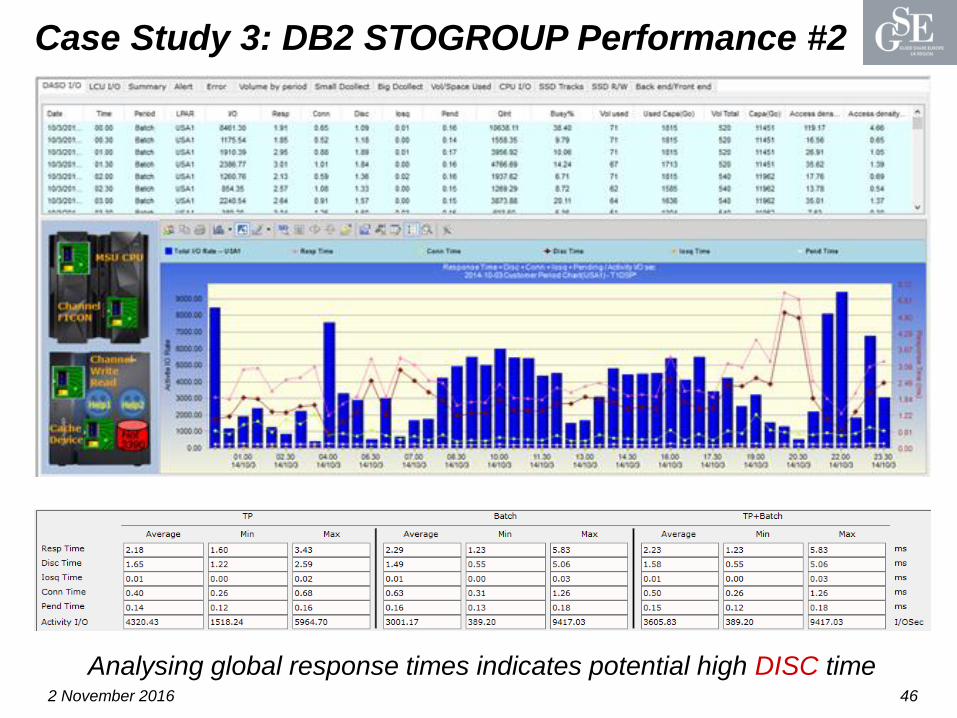
Case Study 3: DB2 STOGROUP Performance #2
2 November 2016 46
Analysing global response times indicates potential high DISC time
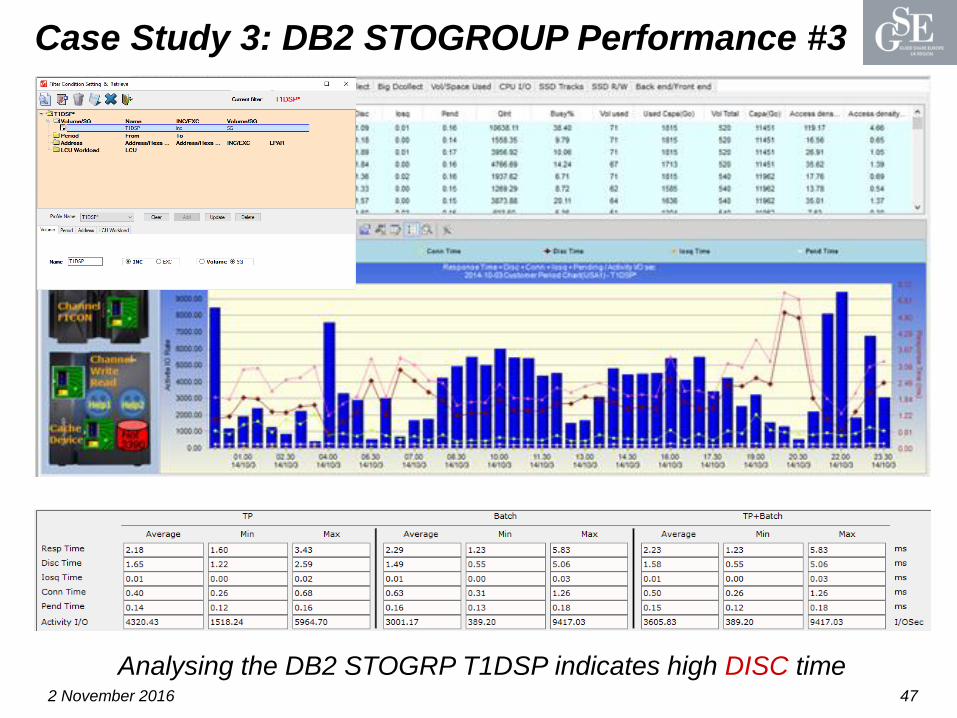
Case Study 3: DB2 STOGROUP Performance #3
2 November 2016 47
Analysing the DB2 STOGRP T1DSP indicates high DISC time
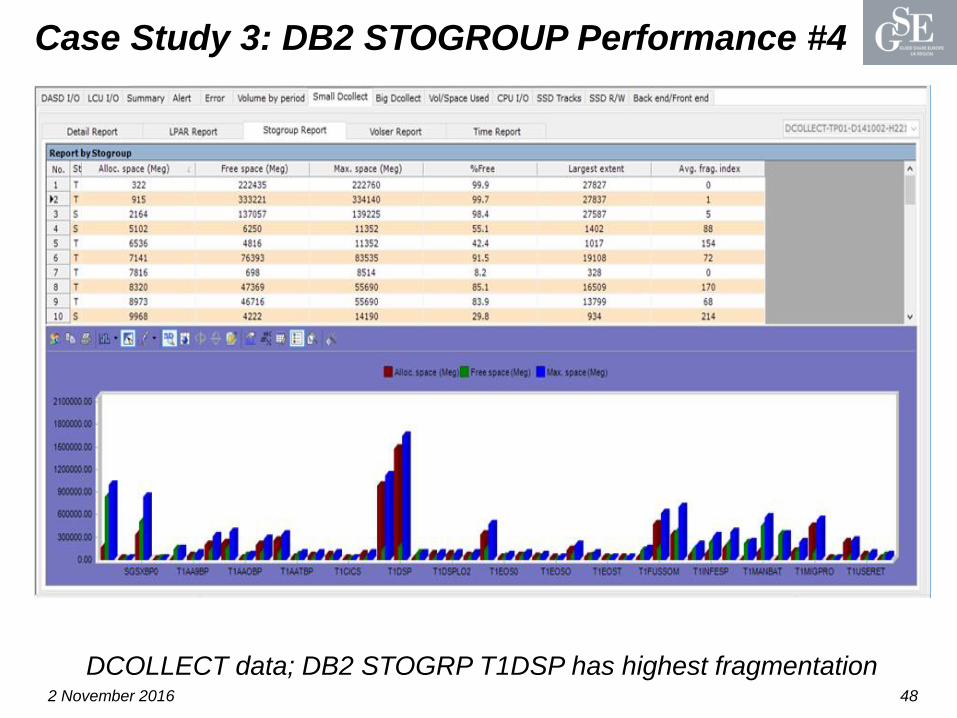
Case Study 3: DB2 STOGROUP Performance #4
2 November 2016 48
DCOLLECT data; DB2 STOGRP T1DSP has highest fragmentation
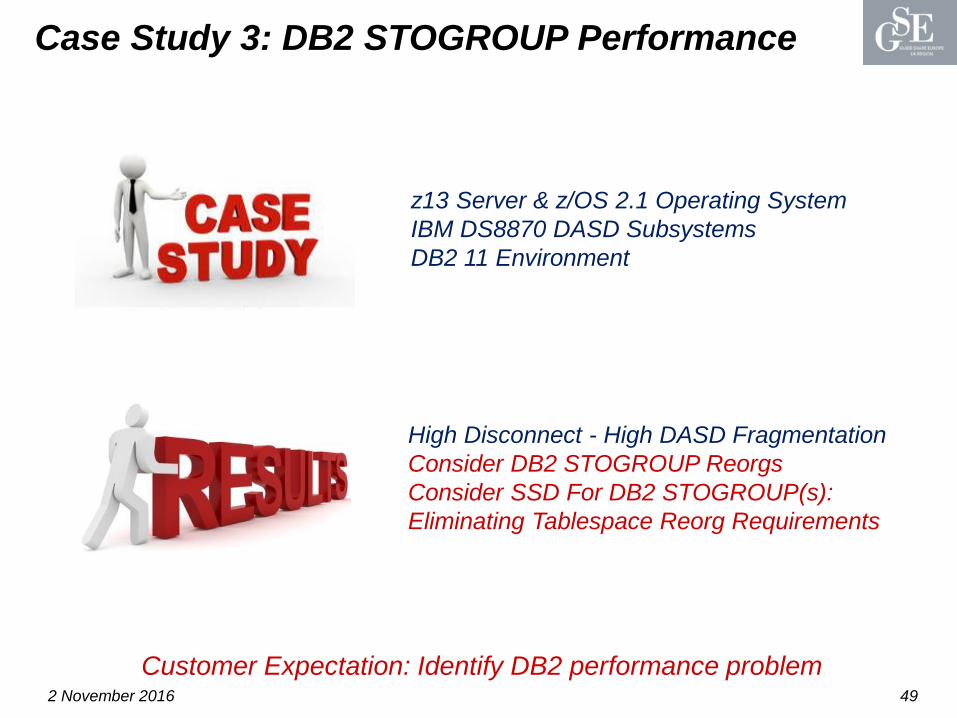
Case Study 3: DB2 STOGROUP Performance
2 November 2016 49
High Disconnect - High DASD Fragmentation
Consider DB2 STOGROUP Reorgs
Consider SSD For DB2 STOGROUP(s):
Eliminating Tablespace Reorg Requirements
z13 Server & z/OS 2.1 Operating System
IBM DS8870 DASD Subsystems
DB2 11 Environment
Customer Expectation: Identify DB2 performance problem

Questions & Session feedback
• Please submit your feedback at
http://conferences.gse.org.uk/2016/feedback/lj
• Session is LJ