Embed Size (px)
DESCRIPTION
Advanced Placement Enrollments & Exam Results 2012-13. DATA & ACCOUNTABILITY DEPARTMENT January , 2014. Advanced Placement (AP) Courses. Developed by College Board College-level content Students can earn college credit Provides exposure to challenging curriculum Generally grades 11-12 - PowerPoint PPT Presentation
Citation preview

DATA & ACCOUNTABILITY DEPARTMENT January, 2014
Advanced Placement Enrollments & Exam Results2012-13

Advanced Placement (AP) Courses
• Developed by College Board• College-level content
– Students can earn college credit– Provides exposure to challenging curriculum
• Generally grades 11-12• 34 different courses & associated exams• Offerings vary by high school• Extra GPA points• Exams are optional

Big Ideas
• AP participation is increasing• AP exam scores remain well above state
and national averages• Offerings and participation vary by:
– Student subgroups– School

AP Exam Score Levels
Score Description5 Extremely Well Qualified4 Well Qualified3 Qualified2 Possibly Qualified1 No Recommendation
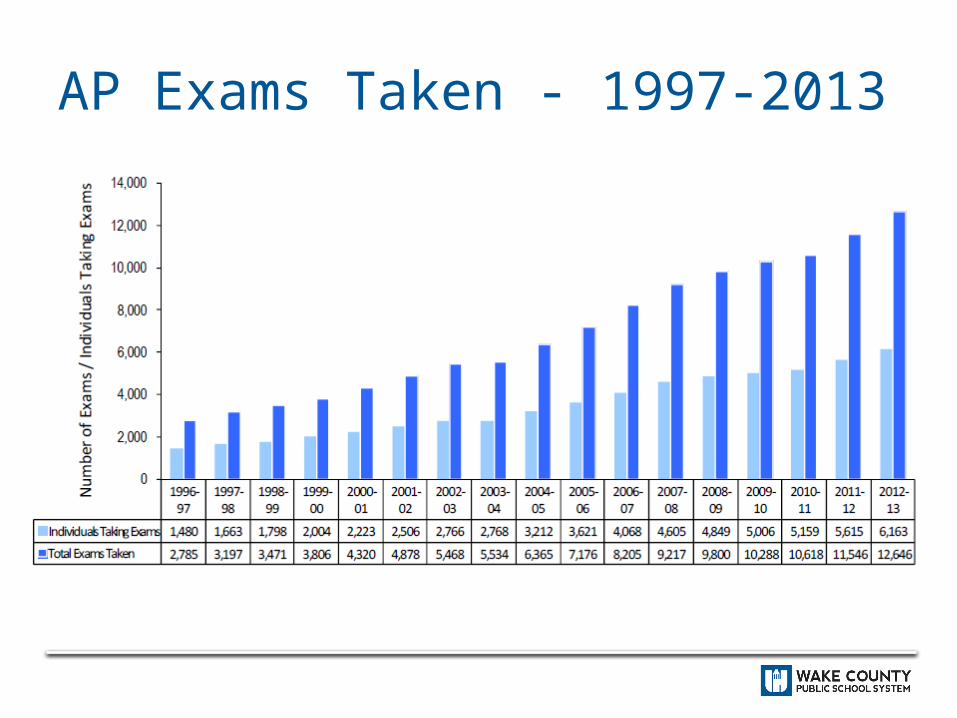
AP Exams Taken - 1997-2013

AP Trends
1996
-97
1997
-98
1998
-99
1999
-00
2000
-01
2001
-02
2002
-03
2003
-04
2004
-05
2005
-06
2006
-07
2007
-08
2008
-09
2009
-10
2010
-11
2011
-12
2012
-13
0
2,000
4,000
6,000
8,000
10,000
12,000
Took AP Exam Took AP Course

AP Trends
1996
-97
1997
-98
1998
-99
1999
-00
2000
-01
2001
-02
2002
-03
2003
-04
2004
-05
2005
-06
2006
-07
2007
-08
2008
-09
2009
-10
2010
-11
2011
-12
2012
-13
0
2,000
4,000
6,000
8,000
10,000
12,000
Took AP Test Took AP Course
7% of HS Students
14%

AP Trends
1996
-97
1997
-98
1998
-99
1999
-00
2000
-01
2001
-02
2002
-03
2003
-04
2004
-05
2005
-06
2006
-07
2007
-08
2008
-09
2009
-10
2010
-11
2011
-12
2012
-13
0
2,000
4,000
6,000
8,000
10,000
12,000
Took AP Test Took AP Course
7% of HS Students
14%
19% of HS Students
23%

% Exams 3 or Higher, 1997-2013

% Exams 3 or Higher, 1997-2013
75-80%
~60%

AP Enrollments by EthnicityAll HS
Students
2012-13
Native American <1%
Asian 6%
Black 26%
Hispanic/Latino 13%
HI/Pac. Islander <1%
Multiracial 4%
White 50%

AP Enrollments by EthnicityAll HS
StudentsAP Course
Enrollments
2012-13 2012-13
Native American <1% <1%
Asian 6% 17%
Black 26% 8%
Hispanic/Latino 13% 6%
HI/Pac. Islander <1% <1%
Multiracial 4% 4%
White 50% 64%

AP Enrollments by EthnicityAll HS
Students AP Course Enrollments
2012-13 2012-13 2011-12 2010-11 2009-10
Native American <1% <1% <1% <1% <1%
Asian 6% 17% 17% 15% 16%
Black 26% 8% 8% 8% 8%
Hispanic/Latino 13% 6% 6% 6% 3%
HI/Pac. Islander <1% <1% <1% 0% ---
Multiracial 4% 4% 4% 4% 3%
White 50% 64% 65% 67% 70%

AP Enrollments by GenderAll HS
Students AP Course Enrollments
2012-13 2012-13 2011-12 2010-11 2009-10
Female 49% 54% 53% 52% 54%
Male 51% 44% 47% 48% 46%

AP Offerings and Participation, 2012-13

AP Offerings and Participation, 2012-13

AP Offerings and Participation, 2012-13

Summary
• AP participation is increasing• AP exam scores remain well above state
and national averages• Offerings and participation vary by:
– Student subgroups– School

Implications
• Course placement guidelines– Need consistent criteria– Role of middle school– Need to study more in depth
• Participation vs. exam performance– What is most important?– Role of student choice
• AP is one of many options for rigor– IB, dual enrollment, etc.