Embed Size (px)
Citation preview
Assessment OfficeUniversity of Hawaiʻi at Mānoa
[email protected]/assessment
1You may use these materials only for nonprofit educational purposes. Please give credit/cite appropriately.
Data Analysis, Presentation, and Reporting
2014 Assessment Leadership Institute
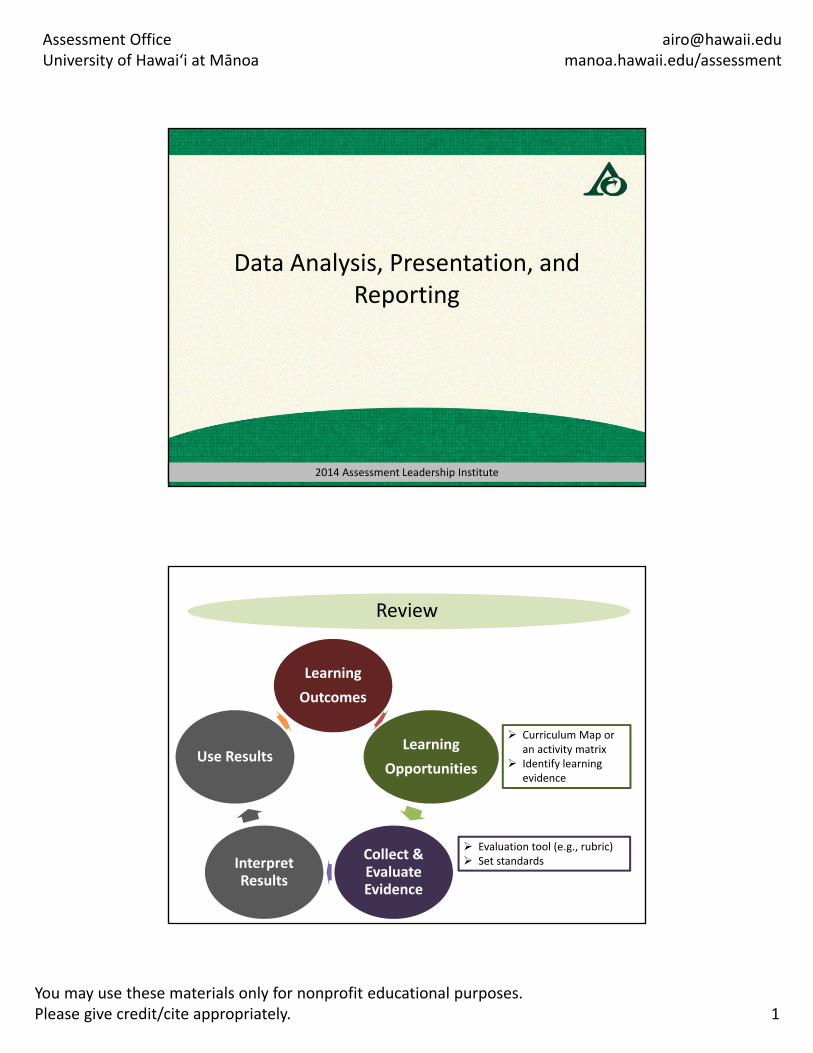
Review
Learning
Outcomes
Learning
Opportunities
Collect & Evaluate Evidence
Interpret Results
Use Results
Curriculum Map or an activity matrix
Identify learning evidence
Evaluation tool (e.g., rubric) Set standards
Assessment OfficeUniversity of Hawaiʻi at Mānoa
[email protected]/assessment
2You may use these materials only for nonprofit educational purposes. Please give credit/cite appropriately.
New Topics
Learning
Outcomes
Learning
Opportunities
Collect & Evaluate Evidence
Interpret Results
Use Results
Evaluation tool (e.g., rubric) Set standards Collect evidence
(sampling) Interrater consistency Analyze results
Data Collection: Sampling
• Why sampling:
– Manageable to collect and evaluate
– Robust sampling stronger conclusions
• Considerations
– What is the tolerable margin of error
– How many work can faculty handle
Assessment OfficeUniversity of Hawaiʻi at Mānoa
[email protected]/assessment
3You may use these materials only for nonprofit educational purposes. Please give credit/cite appropriately.
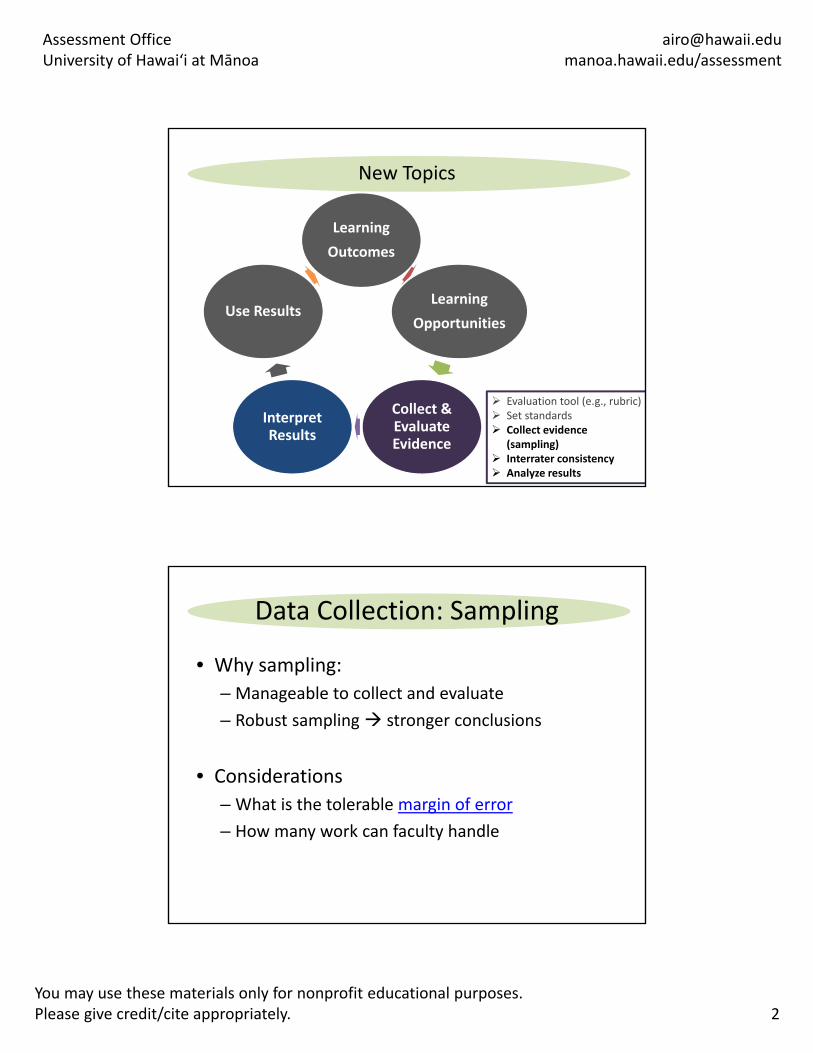
Random Sampling
Scenario: Collect 200 student papers from 8 senior writing courses randomly select 50 (25%) to evaluate
Cluster Sampling
Research Class 705 Research Class 716 Research Class 720
Research Class 726 Research Class 738 Research Class 738
Scenario: Collect all student research papers from several randomly selected research classes
Assessment OfficeUniversity of Hawaiʻi at Mānoa
[email protected]/assessment
4You may use these materials only for nonprofit educational purposes. Please give credit/cite appropriately.
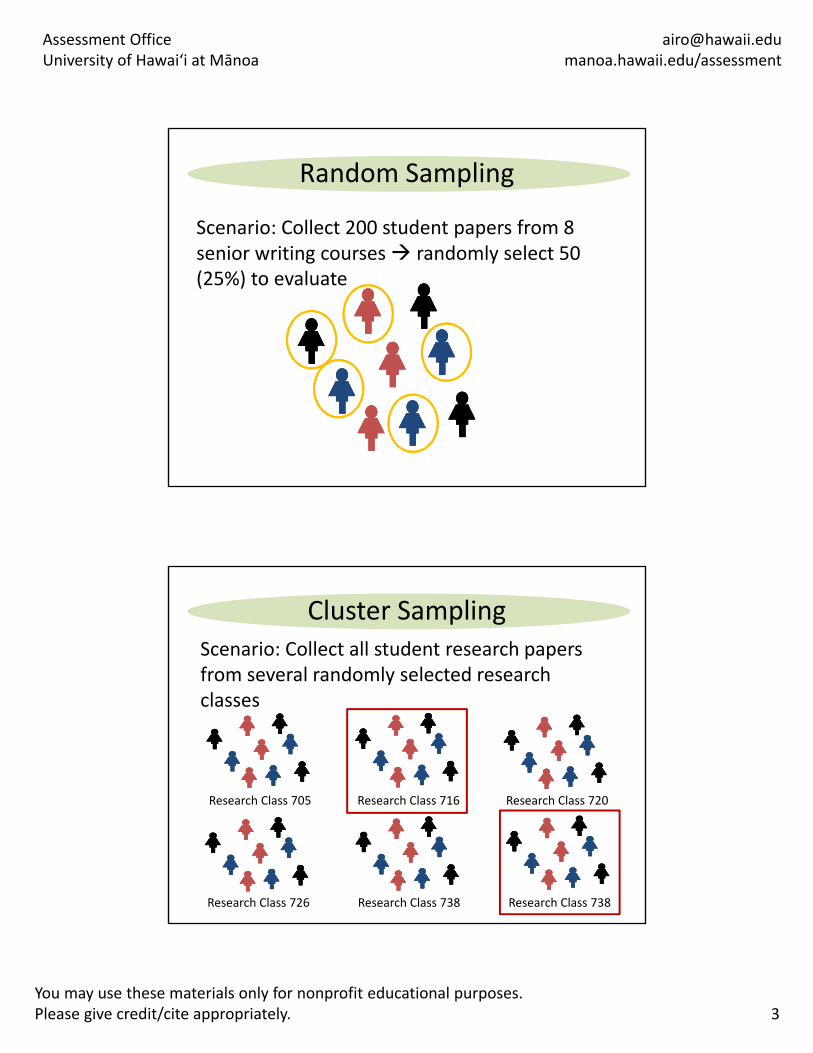
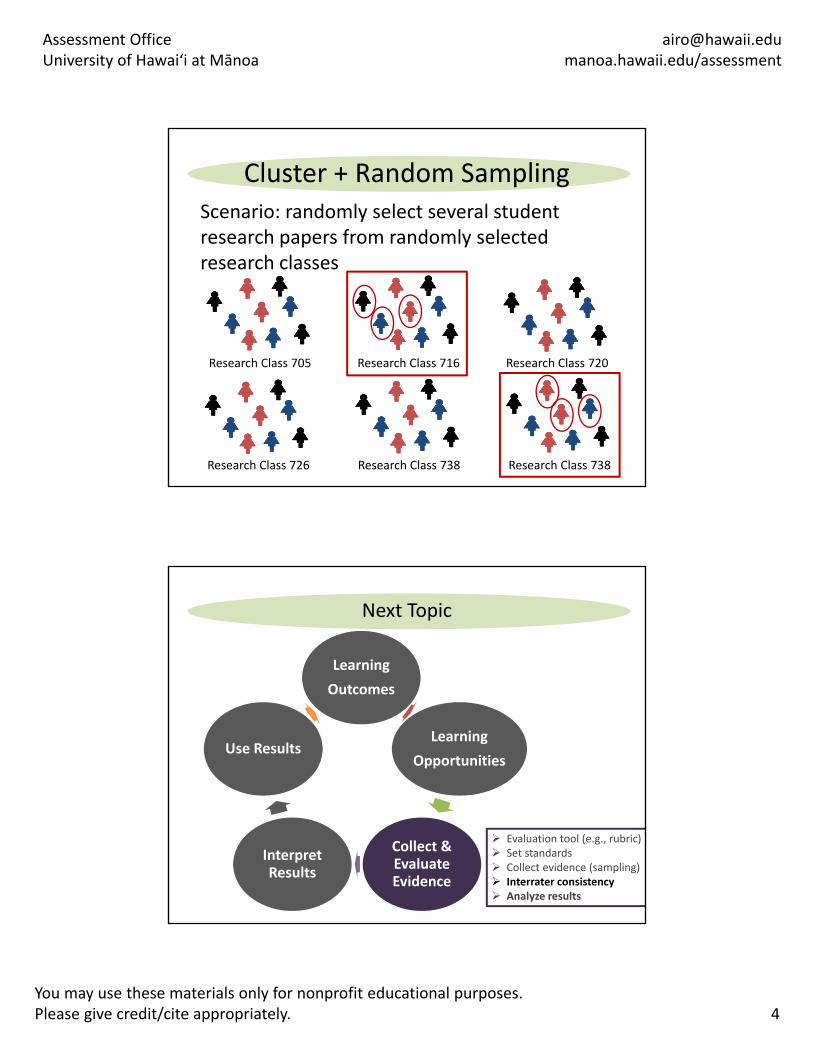
Cluster + Random Sampling
Research Class 705 Research Class 716 Research Class 720
Research Class 726 Research Class 738 Research Class 738
Scenario: randomly select several student research papers from randomly selected research classes
Next Topic
Learning
Outcomes
Learning
Opportunities
Collect & Evaluate Evidence
Interpret Results
Use Results
Evaluation tool (e.g., rubric) Set standards Collect evidence (sampling) Interrater consistency Analyze results
Assessment OfficeUniversity of Hawaiʻi at Mānoa
[email protected]/assessment
5You may use these materials only for nonprofit educational purposes. Please give credit/cite appropriately.
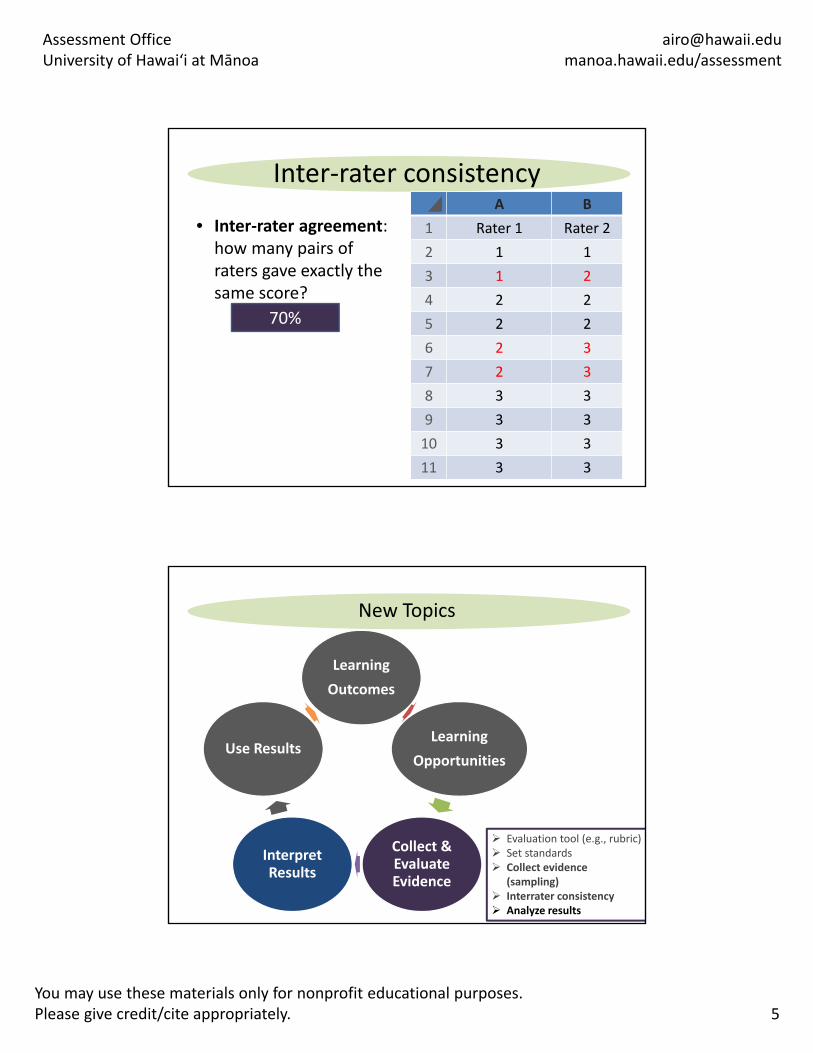
Inter‐rater consistency
• Inter‐rater agreement: how many pairs of raters gave exactly the same score?
A B
1 Rater 1 Rater 2
2 1 1
3 1 2
4 2 2
5 2 2
6 2 3
7 2 3
8 3 3
9 3 3
10 3 3
11 3 3
70%
New Topics
Learning
Outcomes
Learning
Opportunities
Collect & Evaluate Evidence
Interpret Results
Use Results
Evaluation tool (e.g., rubric) Set standards Collect evidence
(sampling) Interrater consistency Analyze results
Assessment OfficeUniversity of Hawaiʻi at Mānoa
[email protected]/assessment
6You may use these materials only for nonprofit educational purposes. Please give credit/cite appropriately.
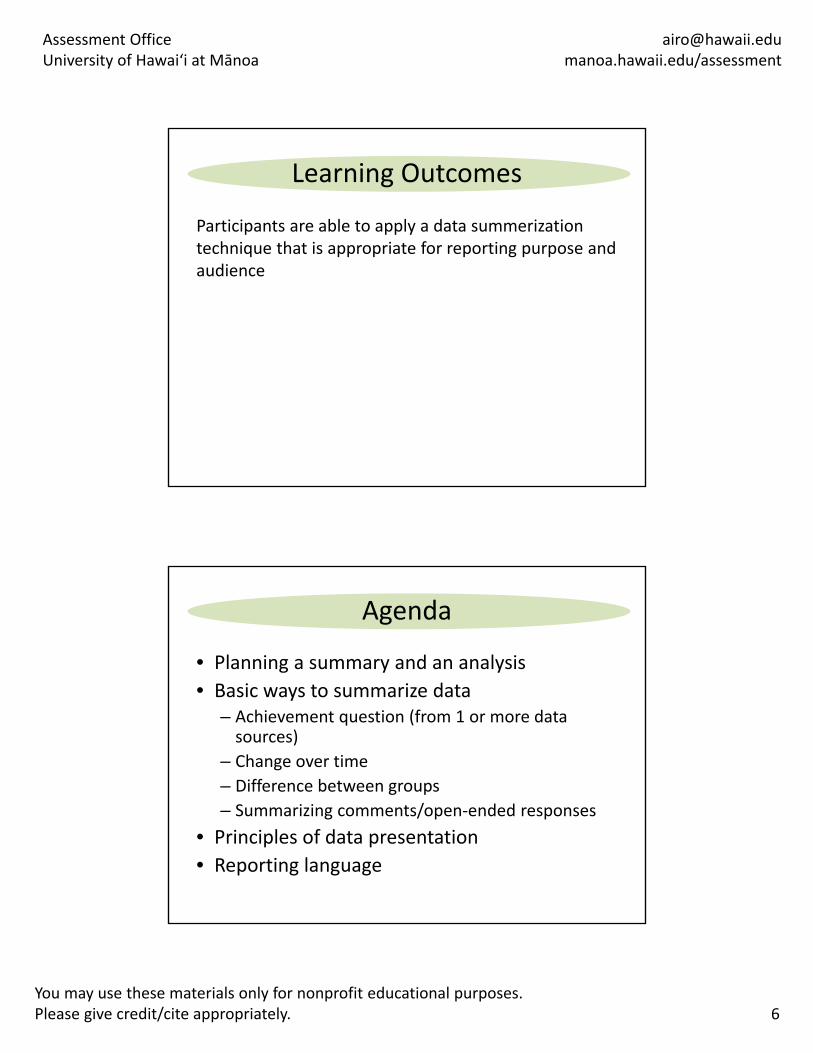
Learning Outcomes
Participants are able to apply a data summerizationtechnique that is appropriate for reporting purpose and audience
Agenda
• Planning a summary and an analysis
• Basic ways to summarize data– Achievement question (from 1 or more data sources)
– Change over time
– Difference between groups
– Summarizing comments/open‐ended responses
• Principles of data presentation
• Reporting language
Assessment OfficeUniversity of Hawaiʻi at Mānoa
[email protected]/assessment
7You may use these materials only for nonprofit educational purposes. Please give credit/cite appropriately.
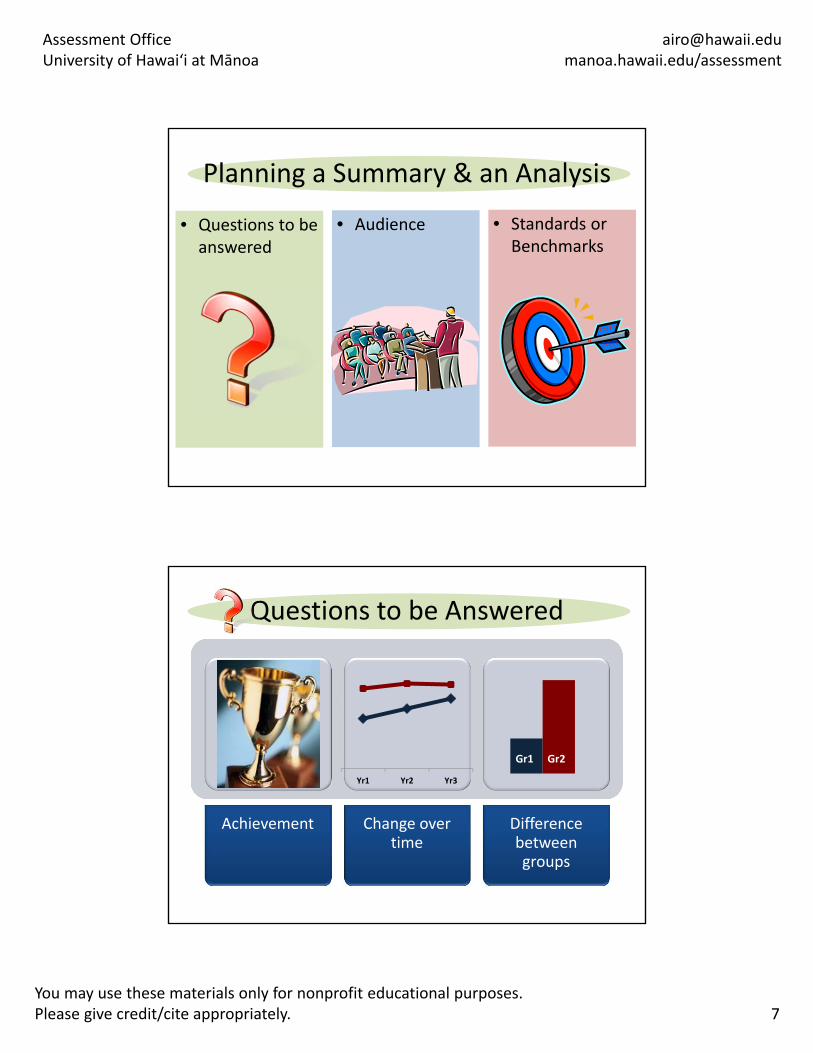
Planning a Summary & an Analysis
• Questions to be answered
• Audience • Standards or Benchmarks
Questions to be Answered
Achievement Change over time
Difference between groups
Yr1 Yr2 Yr3
Gr1 Gr2
Assessment OfficeUniversity of Hawaiʻi at Mānoa
[email protected]/assessment
8You may use these materials only for nonprofit educational purposes. Please give credit/cite appropriately.
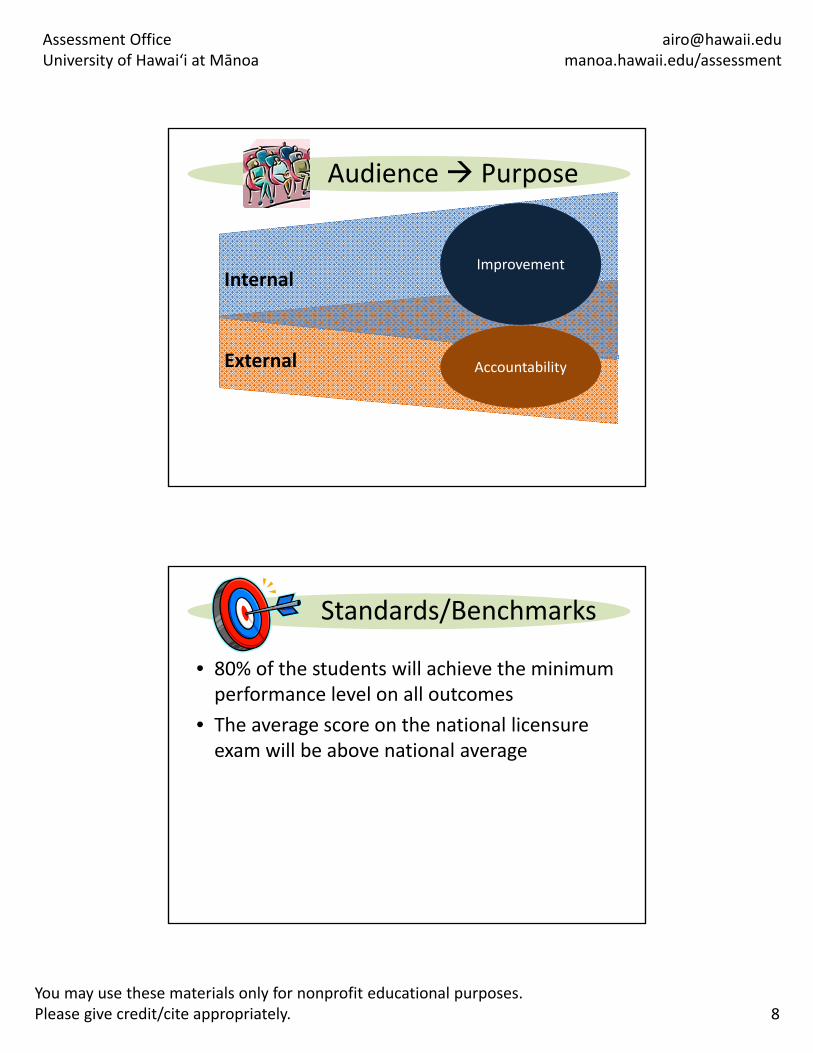
Audience Purpose
Internal
External
Improvement
Accountability
Standards/Benchmarks
• 80% of the students will achieve the minimum performance level on all outcomes
• The average score on the national licensure exam will be above national average
Assessment OfficeUniversity of Hawaiʻi at Mānoa
[email protected]/assessment
9You may use these materials only for nonprofit educational purposes. Please give credit/cite appropriately.
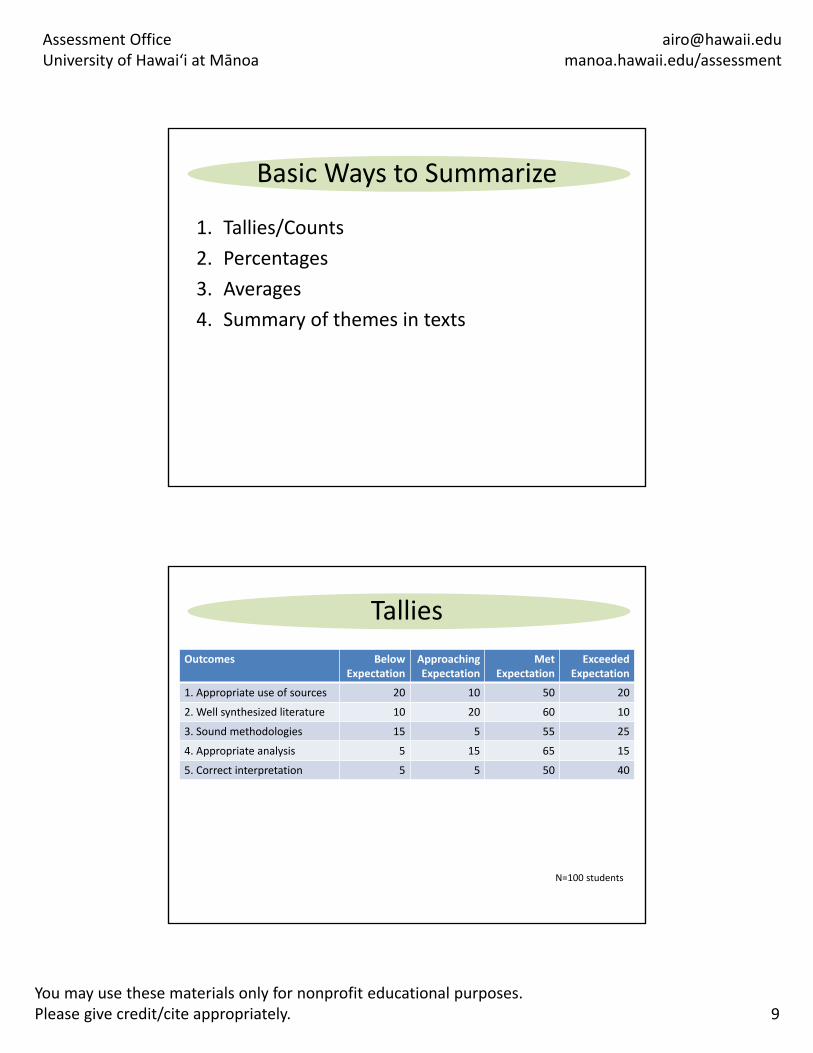
Basic Ways to Summarize
1. Tallies/Counts
2. Percentages
3. Averages
4. Summary of themes in texts
Tallies
Outcomes BelowExpectation
ApproachingExpectation
Met Expectation
Exceeded Expectation
1. Appropriate use of sources 20 10 50 20
2. Well synthesized literature 10 20 60 10
3. Sound methodologies 15 5 55 25
4. Appropriate analysis 5 15 65 15
5. Correct interpretation 5 5 50 40
N=100 students
Assessment OfficeUniversity of Hawaiʻi at Mānoa
[email protected]/assessment
10You may use these materials only for nonprofit educational purposes. Please give credit/cite appropriately.
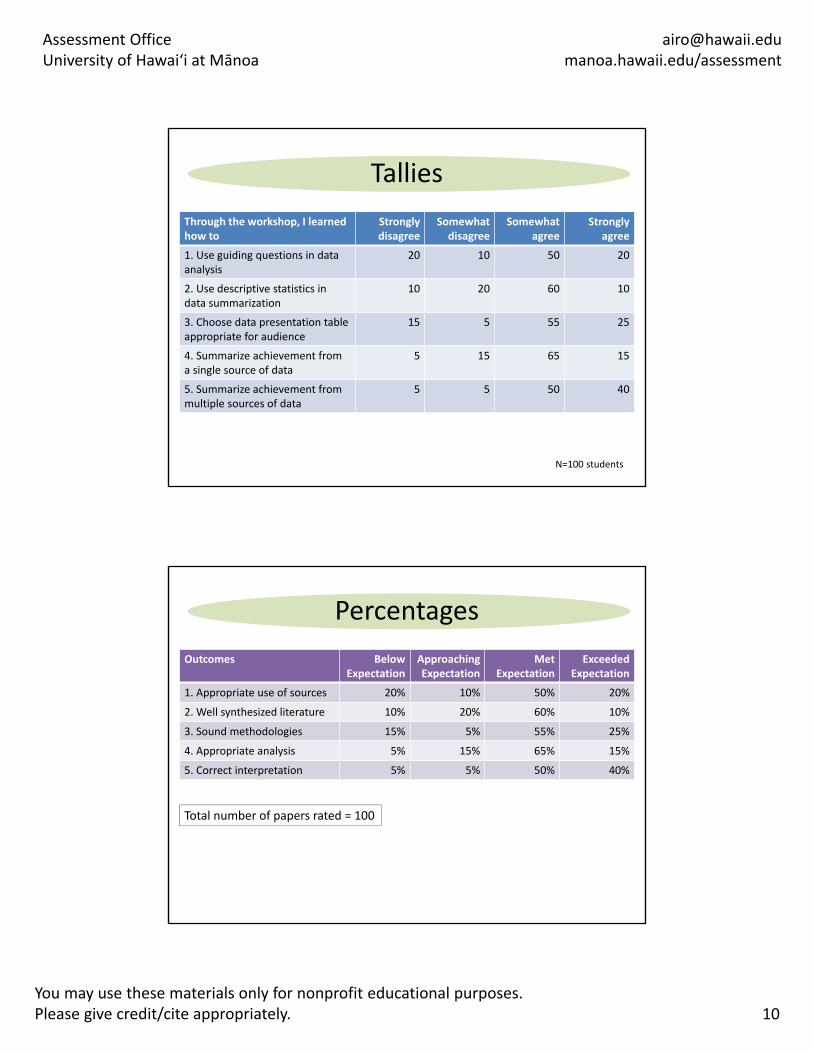
Tallies
Through the workshop, I learned how to
Strongly disagree
Somewhat disagree
Somewhatagree
Stronglyagree
1. Use guiding questions in data analysis
20 10 50 20
2. Use descriptive statistics in data summarization
10 20 60 10
3. Choose data presentation table appropriate for audience
15 5 55 25
4. Summarize achievement from a single source of data
5 15 65 15
5. Summarize achievement frommultiple sources of data
5 5 50 40
N=100 students
Percentages
Outcomes BelowExpectation
ApproachingExpectation
Met Expectation
Exceeded Expectation
1. Appropriate use of sources 20% 10% 50% 20%
2. Well synthesized literature 10% 20% 60% 10%
3. Sound methodologies 15% 5% 55% 25%
4. Appropriate analysis 5% 15% 65% 15%
5. Correct interpretation 5% 5% 50% 40%
Total number of papers rated = 100
Assessment OfficeUniversity of Hawaiʻi at Mānoa
[email protected]/assessment
11You may use these materials only for nonprofit educational purposes. Please give credit/cite appropriately.
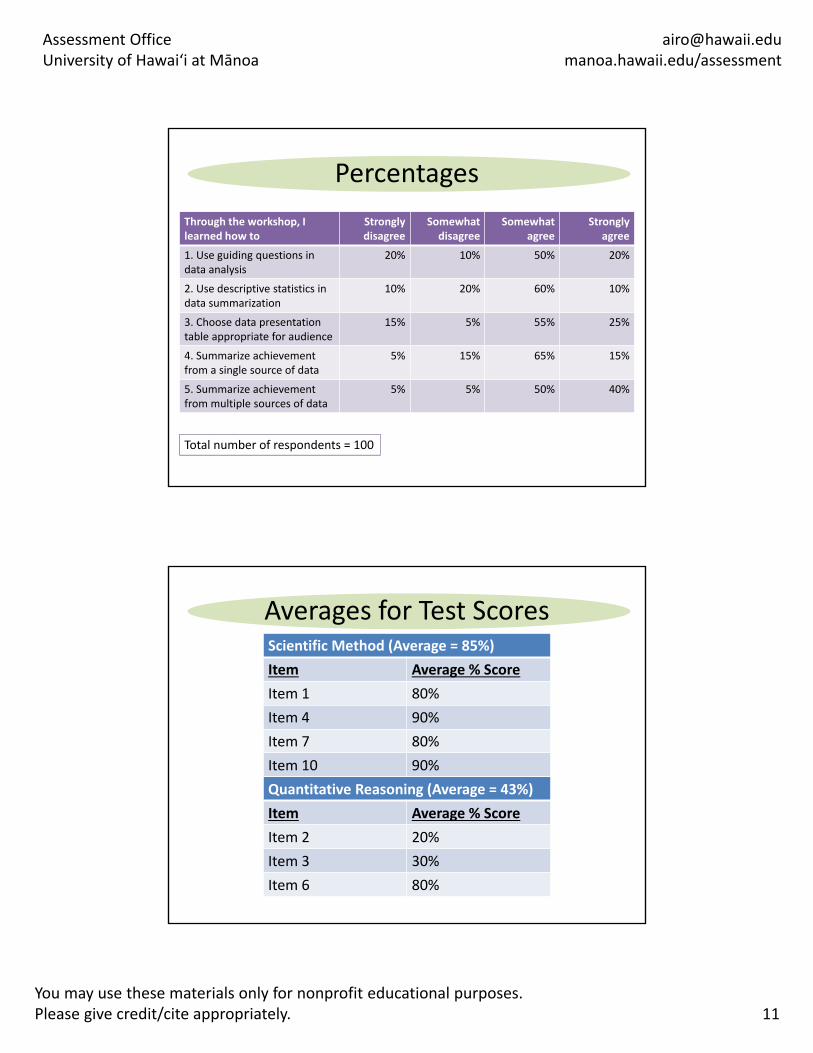
Percentages
Through the workshop, I learned how to
Strongly disagree
Somewhat disagree
Somewhatagree
Stronglyagree
1. Use guiding questions in data analysis
20% 10% 50% 20%
2. Use descriptive statistics in data summarization
10% 20% 60% 10%
3. Choose data presentation table appropriate for audience
15% 5% 55% 25%
4. Summarize achievement from a single source of data
5% 15% 65% 15%
5. Summarize achievement from multiple sources of data
5% 5% 50% 40%
Total number of respondents = 100
Averages for Test ScoresScientific Method (Average = 85%)
Item Average % Score
Item 1 80%
Item 4 90%
Item 7 80%
Item 10 90%
Quantitative Reasoning (Average = 43%)
Item Average % Score
Item 2 20%
Item 3 30%
Item 6 80%
Assessment OfficeUniversity of Hawaiʻi at Mānoa
[email protected]/assessment
12You may use these materials only for nonprofit educational purposes. Please give credit/cite appropriately.
SUMMARIZING ACHIEVEMENT WITH A SINGLE DATA SOURCE(TASK A & B ON HANDOUT)
SUMMARIZING ACHIEVEMENT WITH MULTIPLE DATA SOURCES(TASK C ON HANDOUT)
Assessment OfficeUniversity of Hawaiʻi at Mānoa
[email protected]/assessment
13You may use these materials only for nonprofit educational purposes. Please give credit/cite appropriately.
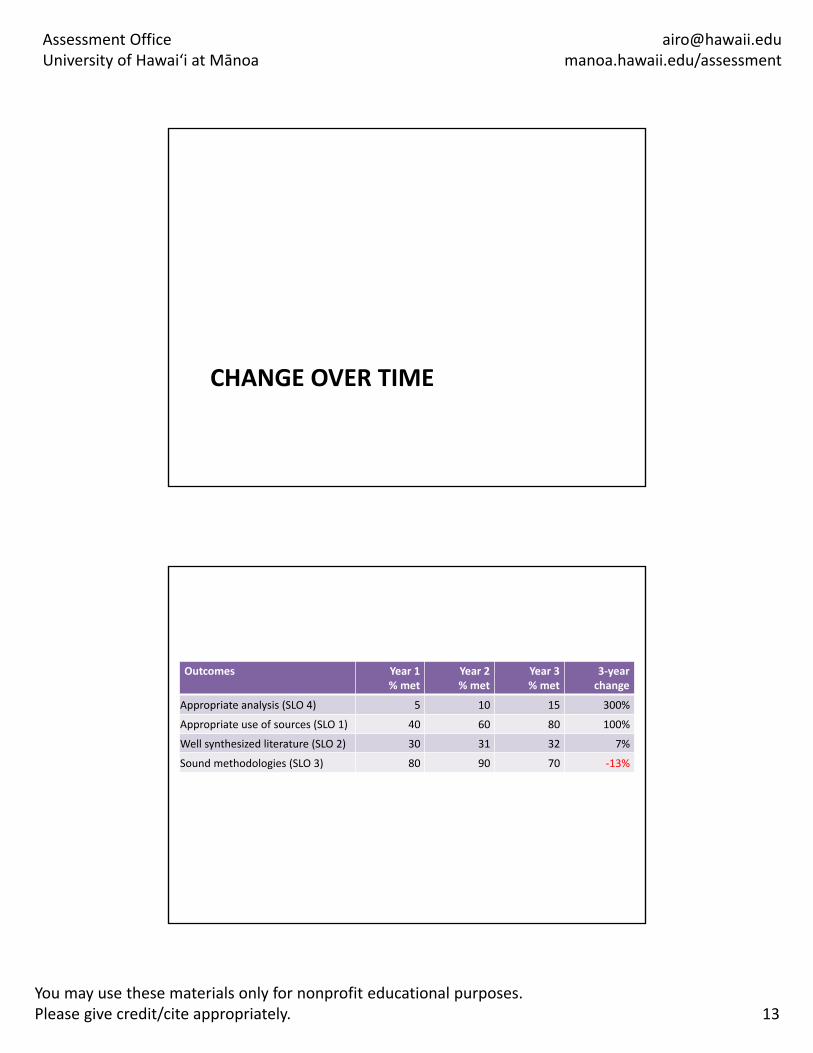
CHANGE OVER TIME
Outcomes Year 1% met
Year 2% met
Year 3% met
3‐yearchange
Appropriate analysis (SLO 4) 5 10 15 300%
Appropriate use of sources (SLO 1) 40 60 80 100%
Well synthesized literature (SLO 2) 30 31 32 7%
Sound methodologies (SLO 3) 80 90 70 ‐13%
Assessment OfficeUniversity of Hawaiʻi at Mānoa
[email protected]/assessment
14You may use these materials only for nonprofit educational purposes. Please give credit/cite appropriately.
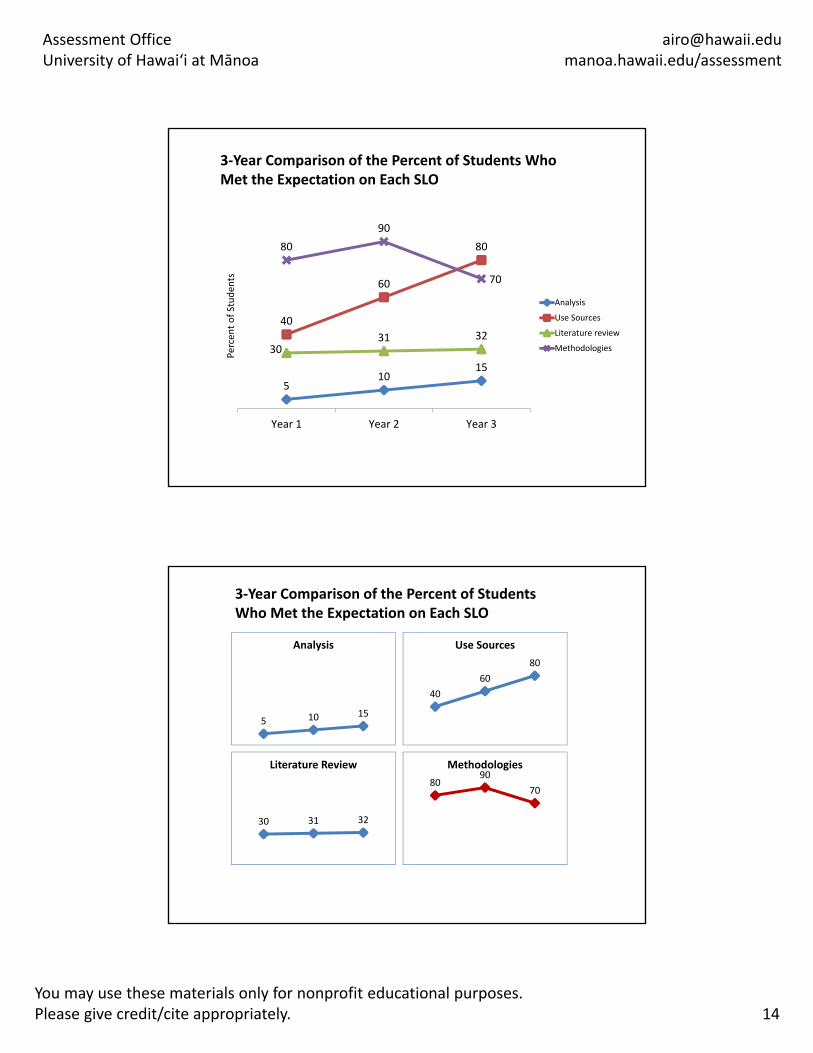
510
15
40
60
80
3031 32
80
90
70
Year 1 Year 2 Year 3
Percen
t of Studen
ts
Analysis
Use Sources
Literature review
Methodologies
3‐Year Comparison of the Percent of Students Who Met the Expectation on Each SLO
5 10 15
Analysis
40
60
80
Use Sources
8090
70
Methodologies
30 31 32
Literature Review
3‐Year Comparison of the Percent of Students Who Met the Expectation on Each SLO
Assessment OfficeUniversity of Hawaiʻi at Mānoa
[email protected]/assessment
15You may use these materials only for nonprofit educational purposes. Please give credit/cite appropriately.
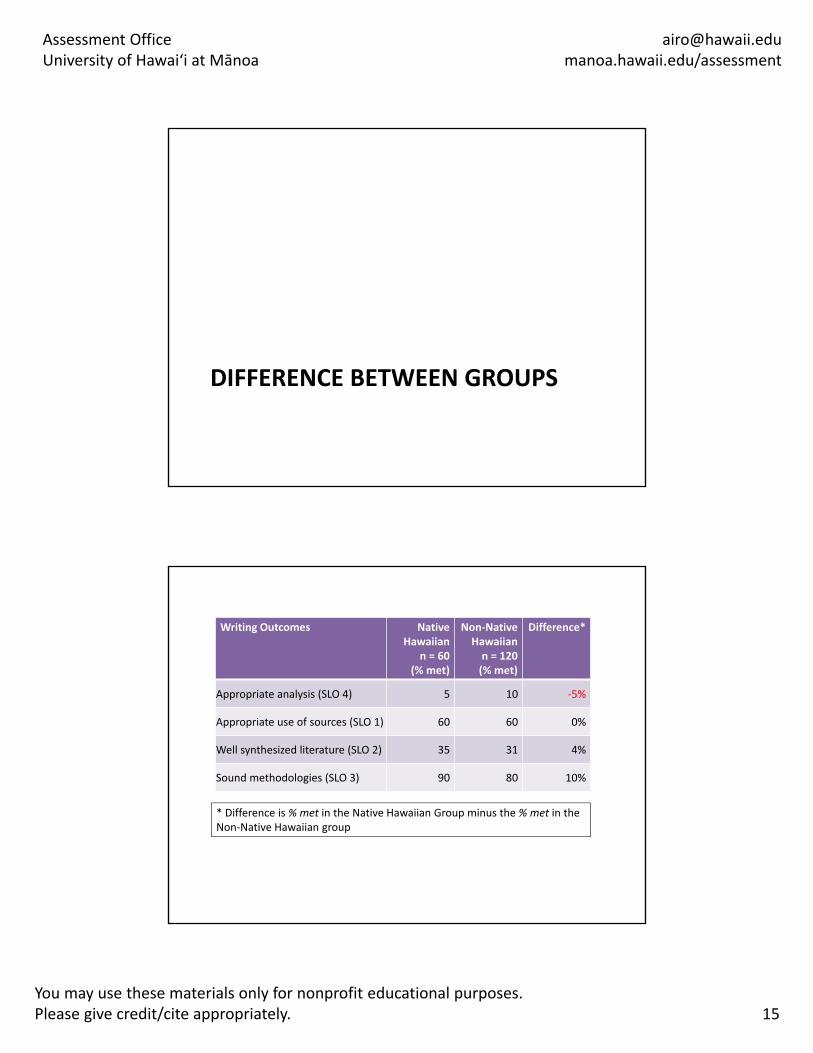
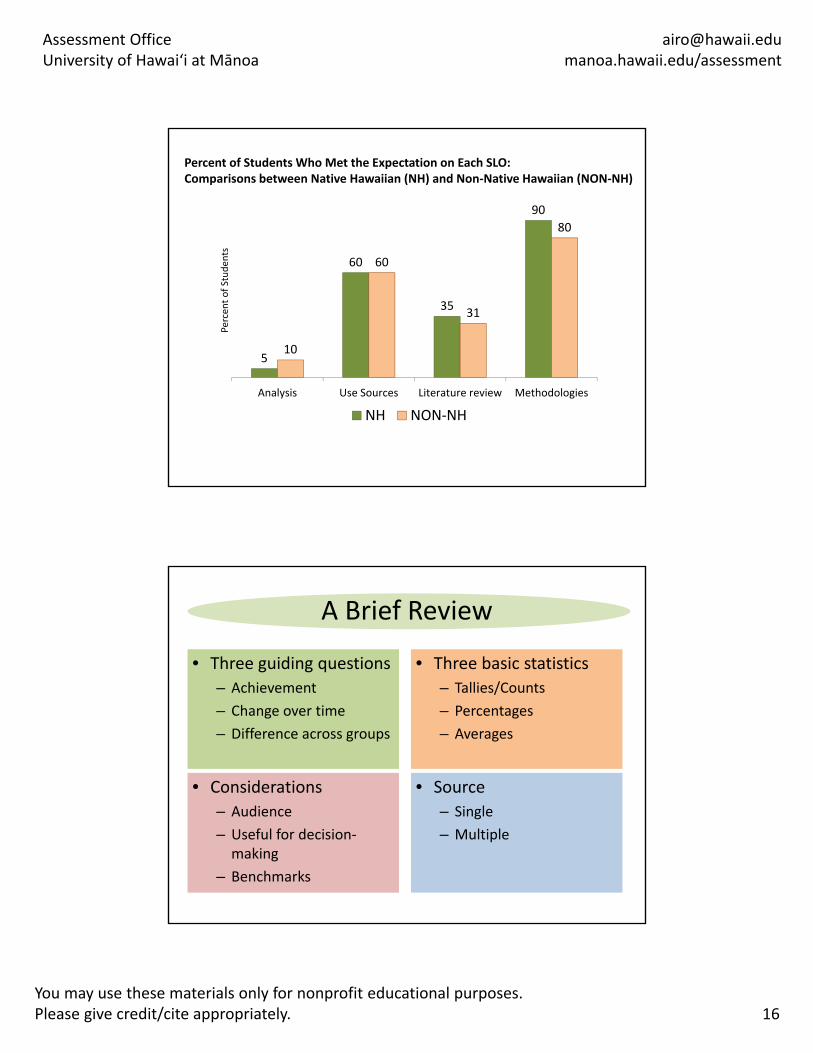
DIFFERENCE BETWEEN GROUPS
Writing Outcomes Native Hawaiian
n = 60 (% met)
Non‐Native Hawaiiann = 120(% met)
Difference*
Appropriate analysis (SLO 4) 5 10 ‐5%
Appropriate use of sources (SLO 1) 60 60 0%
Well synthesized literature (SLO 2) 35 31 4%
Sound methodologies (SLO 3) 90 80 10%
* Difference is % met in the Native Hawaiian Group minus the % met in the Non‐Native Hawaiian group
Assessment OfficeUniversity of Hawaiʻi at Mānoa
[email protected]/assessment
16You may use these materials only for nonprofit educational purposes. Please give credit/cite appropriately.
5
60
35
90
10
60
31
80
Analysis Use Sources Literature review Methodologies
Percen
t of Studen
ts
NH NON‐NH
Percent of Students Who Met the Expectation on Each SLO:Comparisons between Native Hawaiian (NH) and Non‐Native Hawaiian (NON‐NH)
A Brief Review
• Three guiding questions
– Achievement
– Change over time
– Difference across groups
• Three basic statistics
– Tallies/Counts
– Percentages
– Averages
• Considerations
– Audience
– Useful for decision‐making
– Benchmarks
• Source
– Single
– Multiple
Assessment OfficeUniversity of Hawaiʻi at Mānoa
[email protected]/assessment
17You may use these materials only for nonprofit educational purposes. Please give credit/cite appropriately.
SUMMARY OF THEMES
Text Data
• Open‐ended survey questions
• Focus group records
• Reflection papers
• Student feedback minute papers
Assessment OfficeUniversity of Hawaiʻi at Mānoa
[email protected]/assessment
18You may use these materials only for nonprofit educational purposes. Please give credit/cite appropriately.
Theme Summary Strategies
• Narrative of trends and patterns
• Grouped listings
• Theme and category counts + quotes
Narrative of Trends and Patterns
Example
“The most prominent suggestion raised by the participants is to increase the length of the workshop, followed by the suggestion to post the material online. A few participants mentioned the following . . . ”
Assessment OfficeUniversity of Hawaiʻi at Mānoa
[email protected]/assessment
19You may use these materials only for nonprofit educational purposes. Please give credit/cite appropriately.
Narrative of Trends and Patterns
Useful phrases to use in a report:
• “The greatest strength of the department recognized by the respondents is . . .”
• “XXX is another common theme raised by the students.”
• “The main issues mentioned are . . .”
• “The most prevalent theme/factors are . . .”
• “To a lesser extent, X and Y are mentioned.”
Narrative of Trends and Patterns
Analysis Strategies
• Quick read‐throughs
– Random sampling to make it manageable
– Find a peer to do it too – member check
• Thematic analysis
– Refer to the resource list
Assessment OfficeUniversity of Hawaiʻi at Mānoa
[email protected]/assessment
20You may use these materials only for nonprofit educational purposes. Please give credit/cite appropriately.
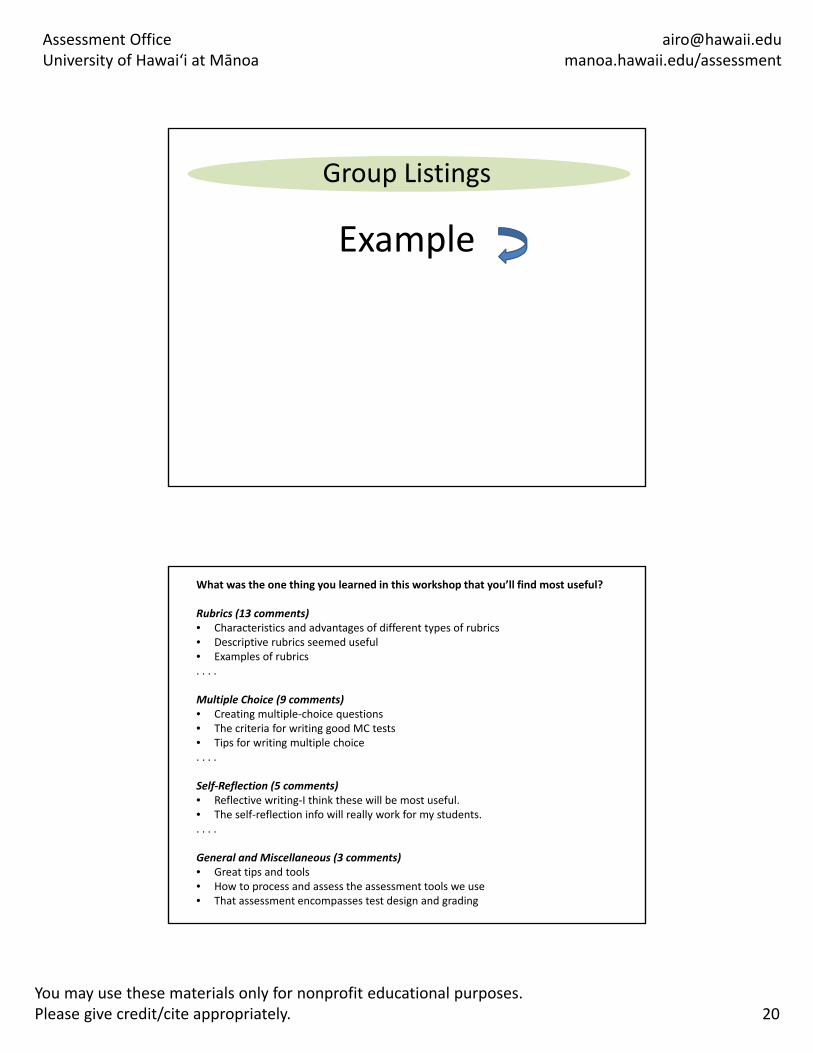
Group Listings
Example
What was the one thing you learned in this workshop that you’ll find most useful?
Rubrics (13 comments)• Characteristics and advantages of different types of rubrics• Descriptive rubrics seemed useful• Examples of rubrics. . . .
Multiple Choice (9 comments)• Creating multiple‐choice questions• The criteria for writing good MC tests• Tips for writing multiple choice. . . .
Self‐Reflection (5 comments)• Reflective writing‐I think these will be most useful.• The self‐reflection info will really work for my students.. . . .
General and Miscellaneous (3 comments)• Great tips and tools• How to process and assess the assessment tools we use• That assessment encompasses test design and grading
Assessment OfficeUniversity of Hawaiʻi at Mānoa
[email protected]/assessment
21You may use these materials only for nonprofit educational purposes. Please give credit/cite appropriately.
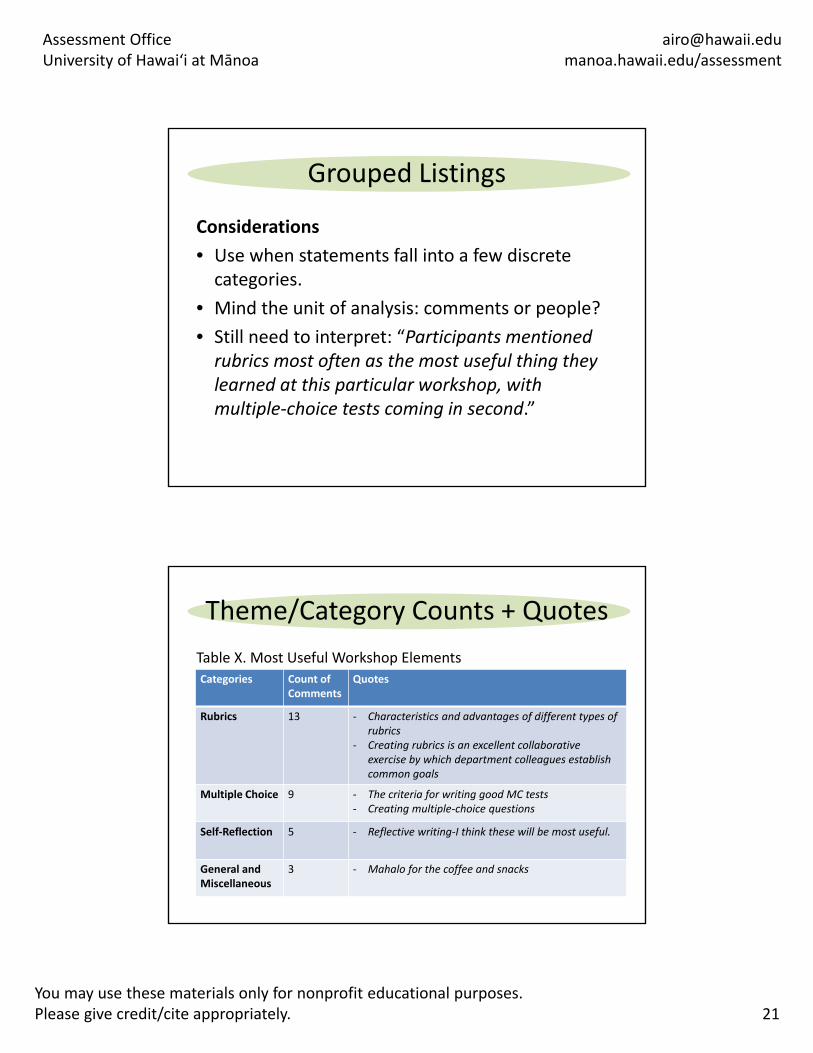
Grouped Listings
Considerations
• Use when statements fall into a few discrete categories.
• Mind the unit of analysis: comments or people?
• Still need to interpret: “Participants mentioned rubrics most often as the most useful thing they learned at this particular workshop, with multiple‐choice tests coming in second.”
Theme/Category Counts + Quotes
Table X. Most Useful Workshop Elements
Categories Count of Comments
Quotes
Rubrics 13 ‐ Characteristics and advantages of different types of rubrics
‐ Creating rubrics is an excellent collaborativeexercise by which department colleagues establish common goals
Multiple Choice 9 ‐ The criteria for writing good MC tests‐ Creating multiple‐choice questions
Self‐Reflection 5 ‐ Reflective writing‐I think these will be most useful.
General and Miscellaneous
3 ‐ Mahalo for the coffee and snacks
Assessment OfficeUniversity of Hawaiʻi at Mānoa
[email protected]/assessment
22You may use these materials only for nonprofit educational purposes. Please give credit/cite appropriately.
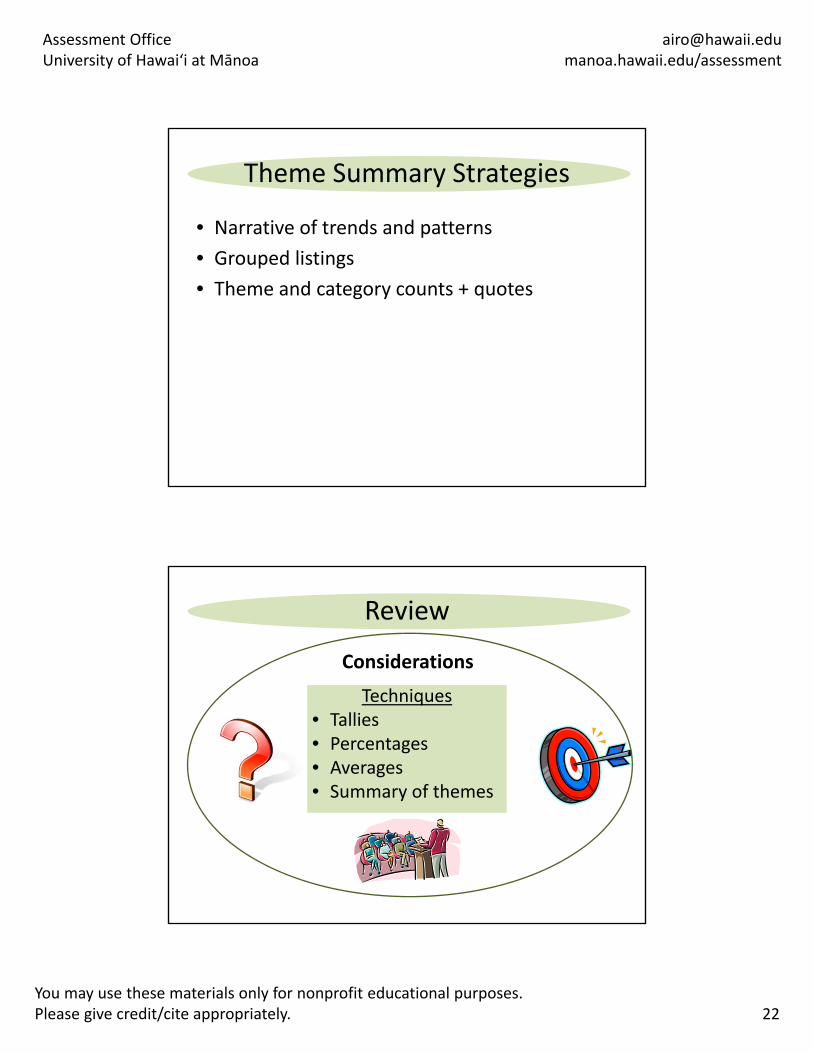
Theme Summary Strategies
• Narrative of trends and patterns
• Grouped listings
• Theme and category counts + quotes
Review
Techniques• Tallies• Percentages• Averages• Summary of themes
Considerations
Assessment OfficeUniversity of Hawaiʻi at Mānoa
[email protected]/assessment
23You may use these materials only for nonprofit educational purposes. Please give credit/cite appropriately.
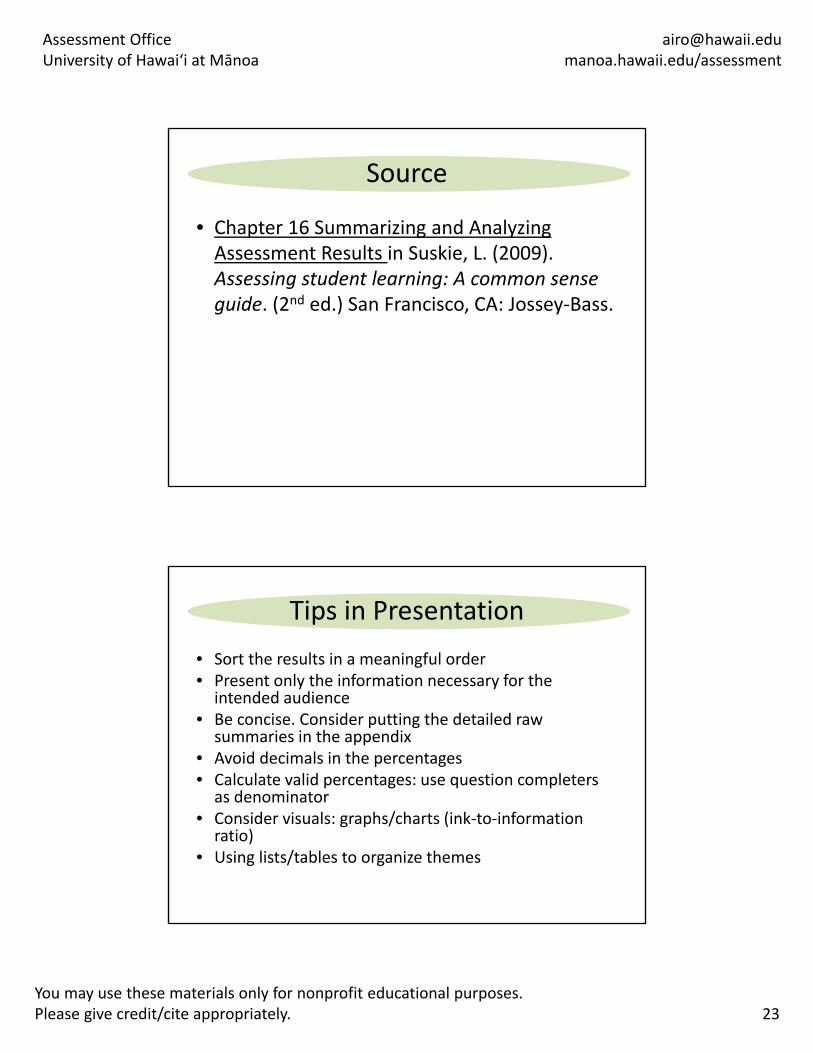
Source
• Chapter 16 Summarizing and Analyzing Assessment Results in Suskie, L. (2009). Assessing student learning: A common sense guide. (2nd ed.) San Francisco, CA: Jossey‐Bass.
Tips in Presentation
• Sort the results in a meaningful order• Present only the information necessary for the intended audience
• Be concise. Consider putting the detailed raw summaries in the appendix
• Avoid decimals in the percentages• Calculate valid percentages: use question completers as denominator
• Consider visuals: graphs/charts (ink‐to‐information ratio)
• Using lists/tables to organize themes
Assessment OfficeUniversity of Hawaiʻi at Mānoa
[email protected]/assessment
24You may use these materials only for nonprofit educational purposes. Please give credit/cite appropriately.
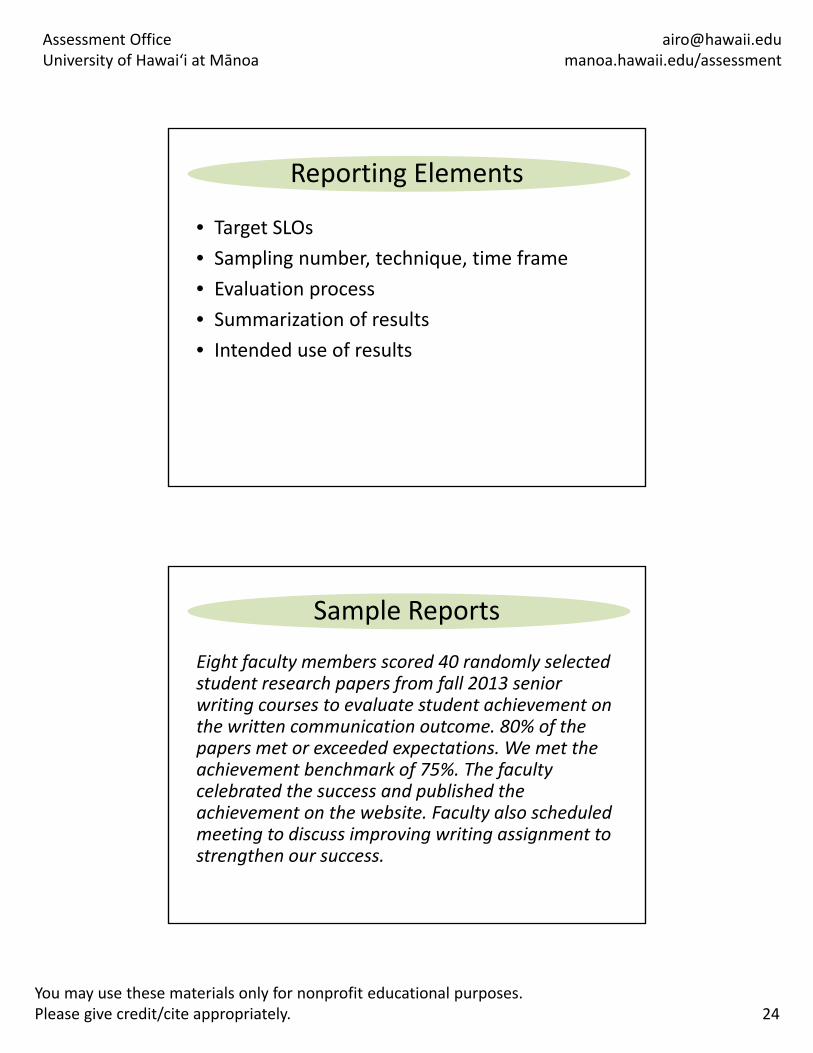
Reporting Elements
• Target SLOs
• Sampling number, technique, time frame
• Evaluation process
• Summarization of results
• Intended use of results
Sample Reports
Eight faculty members scored 40 randomly selected student research papers from fall 2013 senior writing courses to evaluate student achievement on the written communication outcome. 80% of the papers met or exceeded expectations. We met the achievement benchmark of 75%. The faculty celebrated the success and published the achievement on the website. Faculty also scheduled meeting to discuss improving writing assignment to strengthen our success.
Assessment OfficeUniversity of Hawaiʻi at Mānoa
[email protected]/assessment
25You may use these materials only for nonprofit educational purposes. Please give credit/cite appropriately.
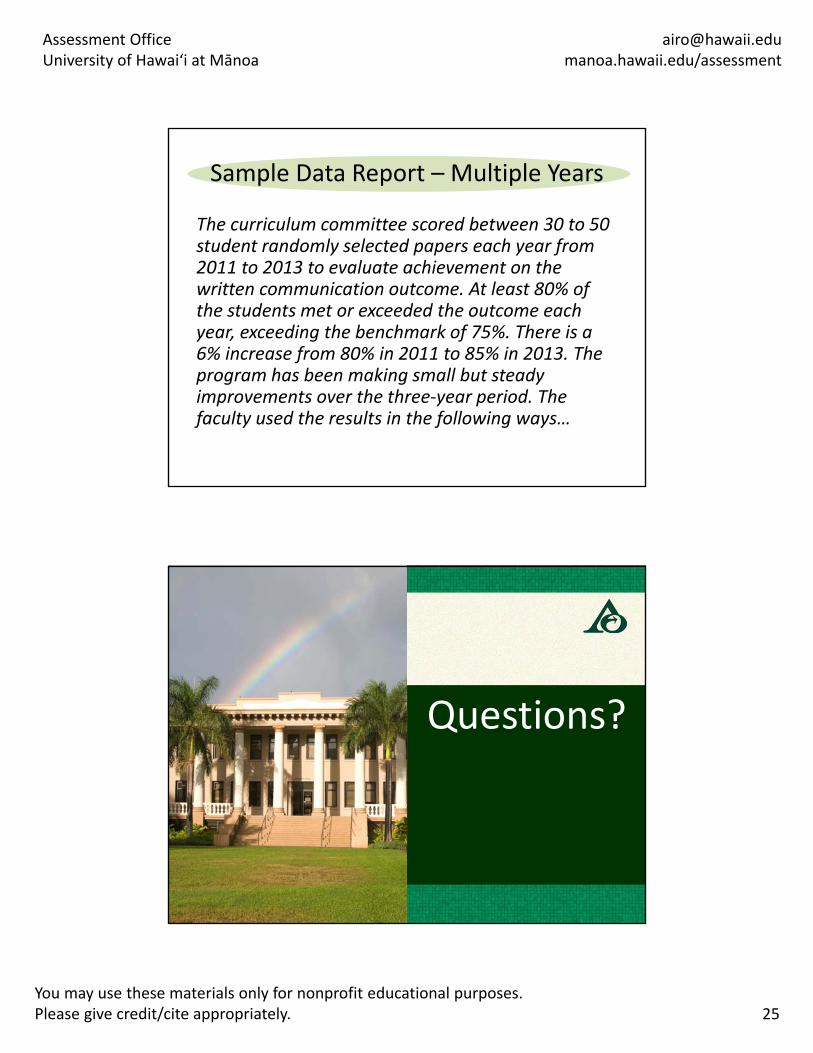
Sample Data Report – Multiple Years
The curriculum committee scored between 30 to 50 student randomly selected papers each year from 2011 to 2013 to evaluate achievement on the written communication outcome. At least 80% of the students met or exceeded the outcome each year, exceeding the benchmark of 75%. There is a 6% increase from 80% in 2011 to 85% in 2013. The program has been making small but steady improvements over the three‐year period. The faculty used the results in the following ways…
Questions?
Assessment Leadership Institute 2014 Hawai‘i Hall 107 Assessment Office, University of Hawai‘i at Mānoa manoa.hawaii.edu/assessment
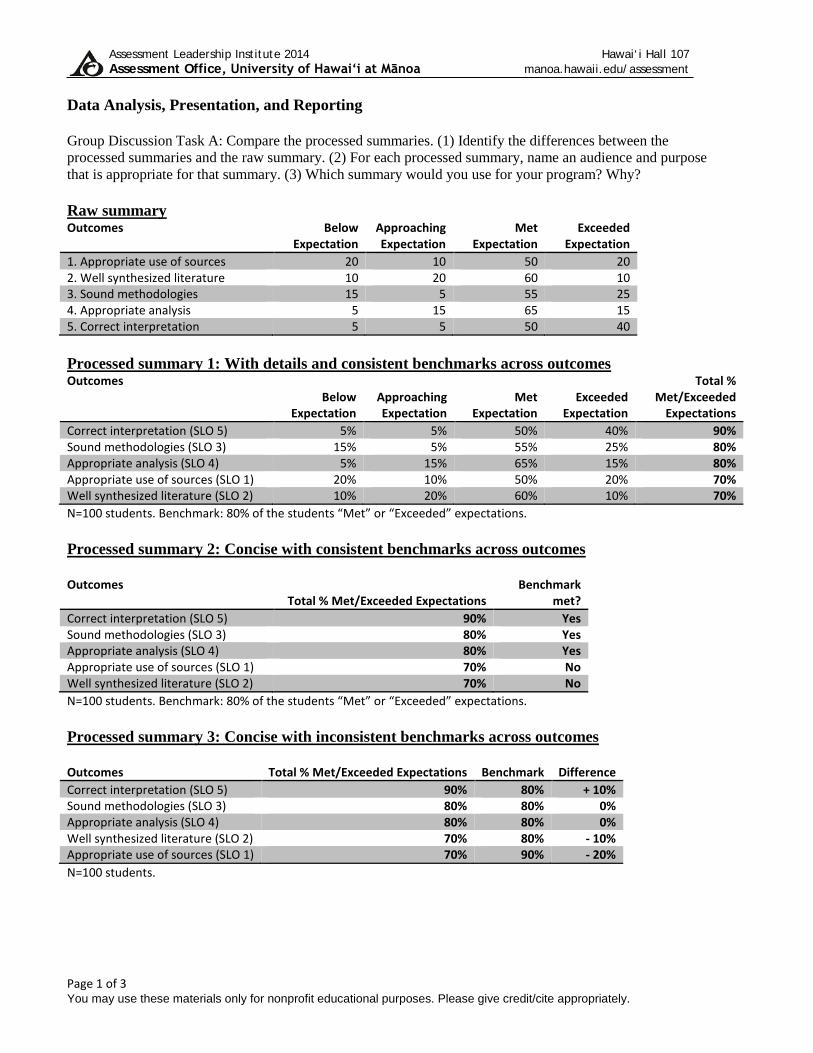
Data Analysis, Presentation, and Reporting Group Discussion Task A: Compare the processed summaries. (1) Identify the differences between the processed summaries and the raw summary. (2) For each processed summary, name an audience and purpose that is appropriate for that summary. (3) Which summary would you use for your program? Why? Raw summary Outcomes Below
Expectation Approaching Expectation
Met Expectation
Exceeded Expectation
1. Appropriate use of sources 20 10 50 20 2. Well synthesized literature 10 20 60 10 3. Sound methodologies 15 5 55 25 4. Appropriate analysis 5 15 65 15 5. Correct interpretation 5 5 50 40 Processed summary 1: With details and consistent benchmarks across outcomes Outcomes
Below Expectation
Approaching Expectation
Met Expectation
Exceeded Expectation
Total % Met/Exceeded
Expectations Correct interpretation (SLO 5) 5% 5% 50% 40% 90% Sound methodologies (SLO 3) 15% 5% 55% 25% 80% Appropriate analysis (SLO 4) 5% 15% 65% 15% 80% Appropriate use of sources (SLO 1) 20% 10% 50% 20% 70% Well synthesized literature (SLO 2) 10% 20% 60% 10% 70% N=100 students. Benchmark: 80% of the students “Met” or “Exceeded” expectations. Processed summary 2: Concise with consistent benchmarks across outcomes Outcomes
Total % Met/Exceeded Expectations Benchmark
met? Correct interpretation (SLO 5) 90% Yes Sound methodologies (SLO 3) 80% Yes Appropriate analysis (SLO 4) 80% Yes Appropriate use of sources (SLO 1) 70% No Well synthesized literature (SLO 2) 70% No N=100 students. Benchmark: 80% of the students “Met” or “Exceeded” expectations. Processed summary 3: Concise with inconsistent benchmarks across outcomes Outcomes Total % Met/Exceeded Expectations Benchmark Difference Correct interpretation (SLO 5) 90% 80% + 10% Sound methodologies (SLO 3) 80% 80% 0% Appropriate analysis (SLO 4) 80% 80% 0% Well synthesized literature (SLO 2) 70% 80% - 10% Appropriate use of sources (SLO 1) 70% 90% - 20% N=100 students.
Page 1 of 3 You may use these materials only for nonprofit educational purposes. Please give credit/cite appropriately.
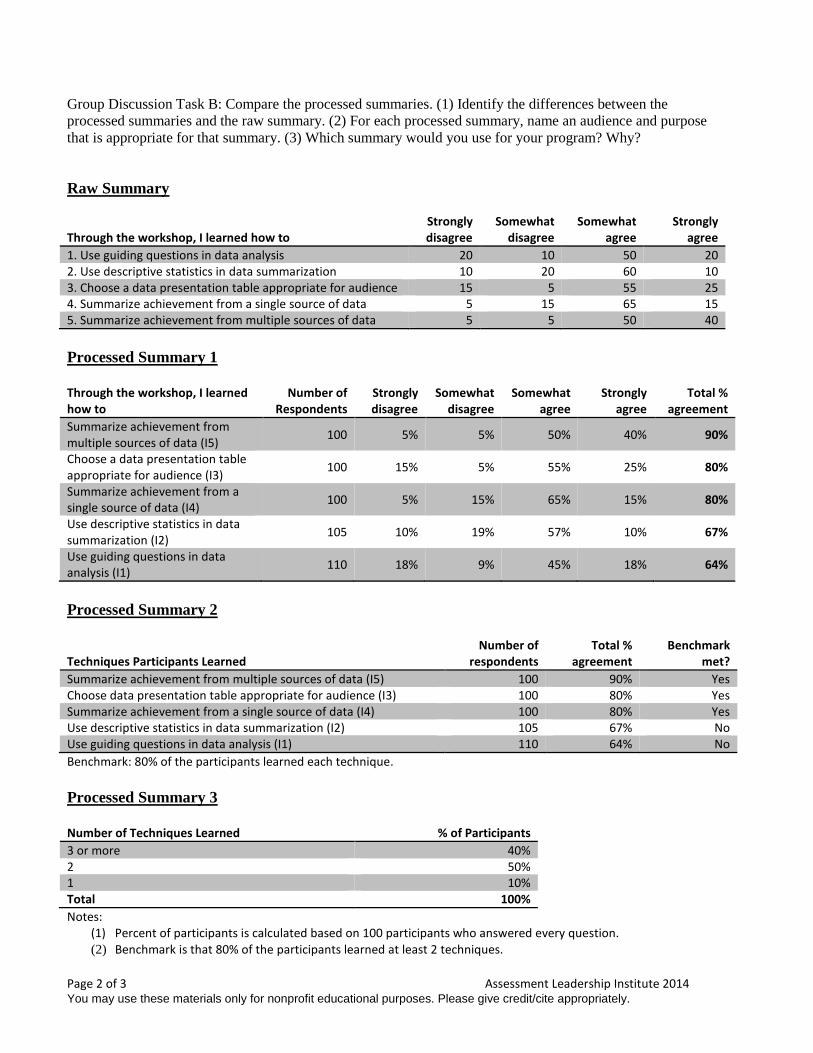
Group Discussion Task B: Compare the processed summaries. (1) Identify the differences between the processed summaries and the raw summary. (2) For each processed summary, name an audience and purpose that is appropriate for that summary. (3) Which summary would you use for your program? Why?
Raw Summary
Through the workshop, I learned how to Strongly disagree
Somewhat disagree
Somewhat agree
Strongly agree
1. Use guiding questions in data analysis 20 10 50 20 2. Use descriptive statistics in data summarization 10 20 60 10 3. Choose a data presentation table appropriate for audience 15 5 55 25 4. Summarize achievement from a single source of data 5 15 65 15 5. Summarize achievement from multiple sources of data 5 5 50 40 Processed Summary 1 Through the workshop, I learned how to
Number of Respondents
Strongly disagree
Somewhat disagree
Somewhat agree
Strongly agree
Total % agreement
Summarize achievement from multiple sources of data (I5) 100 5% 5% 50% 40% 90%
Choose a data presentation table appropriate for audience (I3) 100 15% 5% 55% 25% 80%
Summarize achievement from a single source of data (I4) 100 5% 15% 65% 15% 80%
Use descriptive statistics in data summarization (I2) 105 10% 19% 57% 10% 67%
Use guiding questions in data analysis (I1) 110 18% 9% 45% 18% 64%
Processed Summary 2
Techniques Participants Learned Number of
respondents Total %
agreement Benchmark
met? Summarize achievement from multiple sources of data (I5) 100 90% Yes Choose data presentation table appropriate for audience (I3) 100 80% Yes Summarize achievement from a single source of data (I4) 100 80% Yes Use descriptive statistics in data summarization (I2) 105 67% No Use guiding questions in data analysis (I1) 110 64% No Benchmark: 80% of the participants learned each technique. Processed Summary 3 Number of Techniques Learned % of Participants 3 or more 40% 2 50% 1 10% Total 100% Notes:
(1) Percent of participants is calculated based on 100 participants who answered every question. (2) Benchmark is that 80% of the participants learned at least 2 techniques.
Page 2 of 3 Assessment Leadership Institute 2014 You may use these materials only for nonprofit educational purposes. Please give credit/cite appropriately.
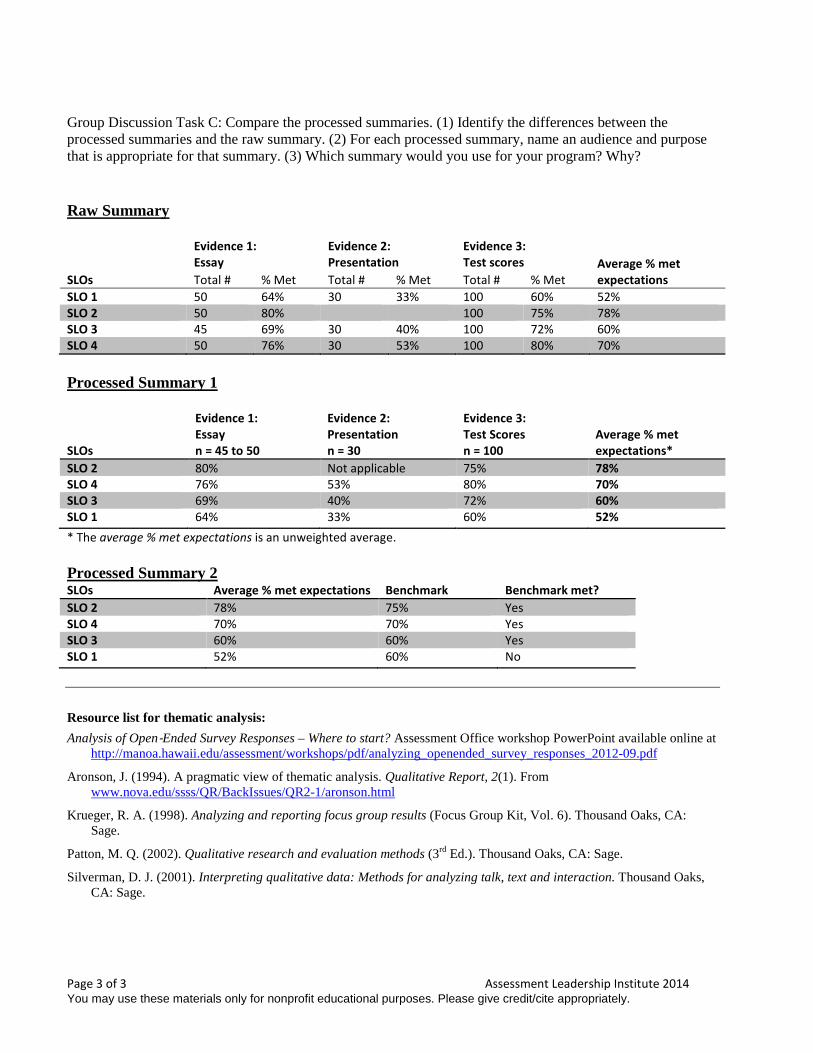
Group Discussion Task C: Compare the processed summaries. (1) Identify the differences between the processed summaries and the raw summary. (2) For each processed summary, name an audience and purpose that is appropriate for that summary. (3) Which summary would you use for your program? Why? Raw Summary
SLOs
Evidence 1: Essay
Evidence 2: Presentation
Evidence 3: Test scores Average % met
expectations Total # % Met Total # % Met Total # % Met SLO 1 50 64% 30 33% 100 60% 52% SLO 2 50 80% 100 75% 78% SLO 3 45 69% 30 40% 100 72% 60% SLO 4 50 76% 30 53% 100 80% 70% Processed Summary 1
SLOs
Evidence 1: Essay n = 45 to 50
Evidence 2: Presentation n = 30
Evidence 3: Test Scores n = 100
Average % met expectations*
SLO 2 80% Not applicable 75% 78% SLO 4 76% 53% 80% 70% SLO 3 69% 40% 72% 60% SLO 1 64% 33% 60% 52% * The average % met expectations is an unweighted average. Processed Summary 2 SLOs Average % met expectations Benchmark Benchmark met? SLO 2 78% 75% Yes SLO 4 70% 70% Yes SLO 3 60% 60% Yes SLO 1 52% 60% No
Resource list for thematic analysis: Analysis of Open‐Ended Survey Responses – Where to start? Assessment Office workshop PowerPoint available online at
http://manoa.hawaii.edu/assessment/workshops/pdf/analyzing_openended_survey_responses_2012-09.pdf
Aronson, J. (1994). A pragmatic view of thematic analysis. Qualitative Report, 2(1). From www.nova.edu/ssss/QR/BackIssues/QR2-1/aronson.html
Krueger, R. A. (1998). Analyzing and reporting focus group results (Focus Group Kit, Vol. 6). Thousand Oaks, CA: Sage.
Patton, M. Q. (2002). Qualitative research and evaluation methods (3rd Ed.). Thousand Oaks, CA: Sage.
Silverman, D. J. (2001). Interpreting qualitative data: Methods for analyzing talk, text and interaction. Thousand Oaks, CA: Sage.
Page 3 of 3 Assessment Leadership Institute 2014 You may use these materials only for nonprofit educational purposes. Please give credit/cite appropriately.