Embed Size (px)
Citation preview
Data analysis – Spearman’s Rank
1. Know what Spearman’s rank is and how to use it
2. Be able to produce a Spearman’s rank correlation graph for your results.
The Spearman's Rank CorrelationCoefficient is used to discover the strengthof a link between two sets of data.
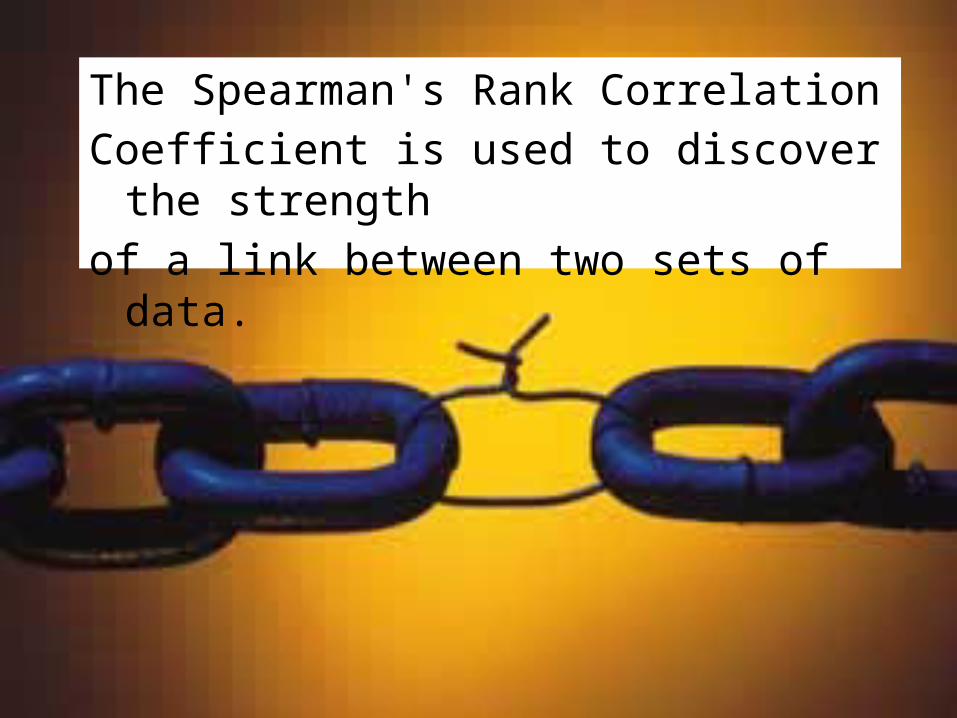
This example looks at the strength of the link between the price of a convenience item (a 50cl bottle of water) and distance from the Contemporary Art Museum in El Ravel, Barcelona
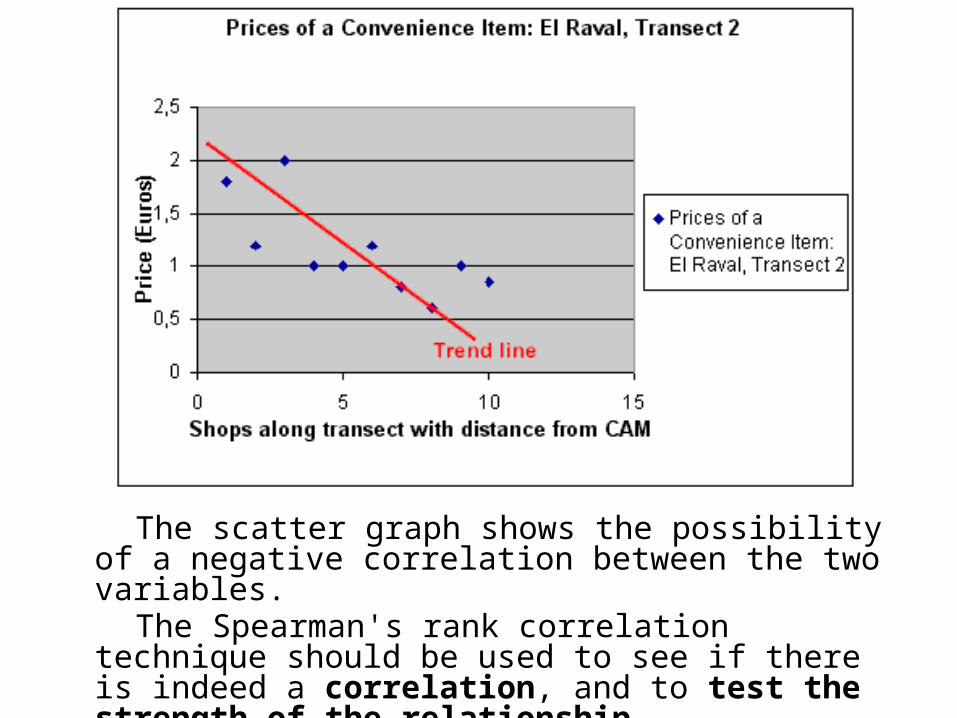
The scatter graph shows the possibility of a negative correlation between the two variables.
The Spearman's rank correlation technique should be used to see if there is indeed a correlation, and to test the strength of the relationship.
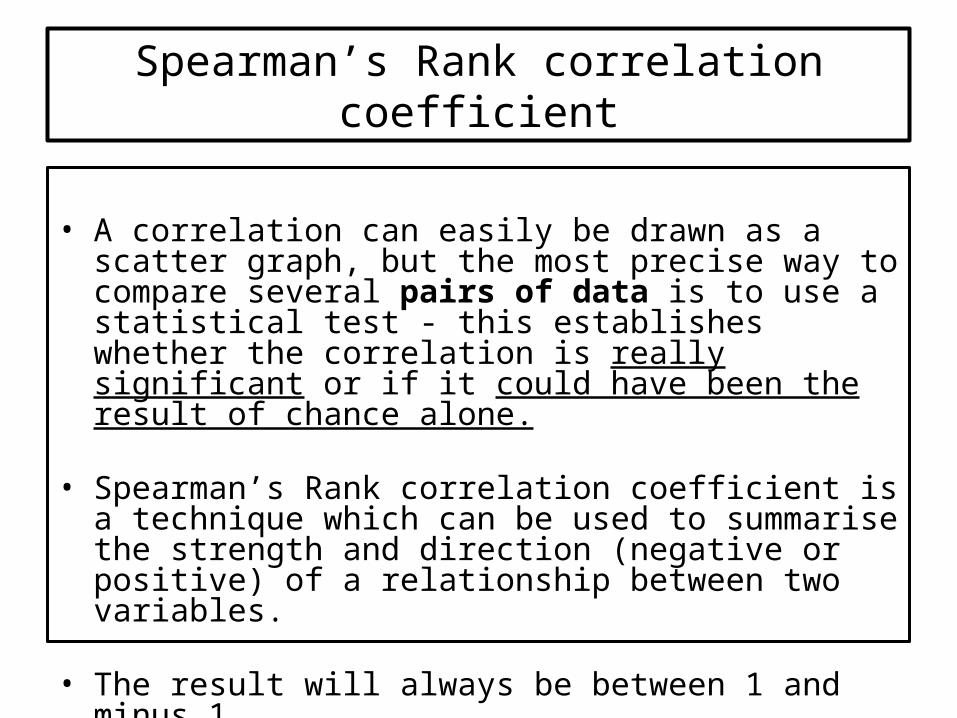
Spearman’s Rank correlation coefficient
• A correlation can easily be drawn as a scatter graph, but the most precise way to compare several pairs of data is to use a statistical test - this establishes whether the correlation is really significant or if it could have been the result of chance alone.
• Spearman’s Rank correlation coefficient is a technique which can be used to summarise the strength and direction (negative or positive) of a relationship between two variables.
• The result will always be between 1 and minus 1.
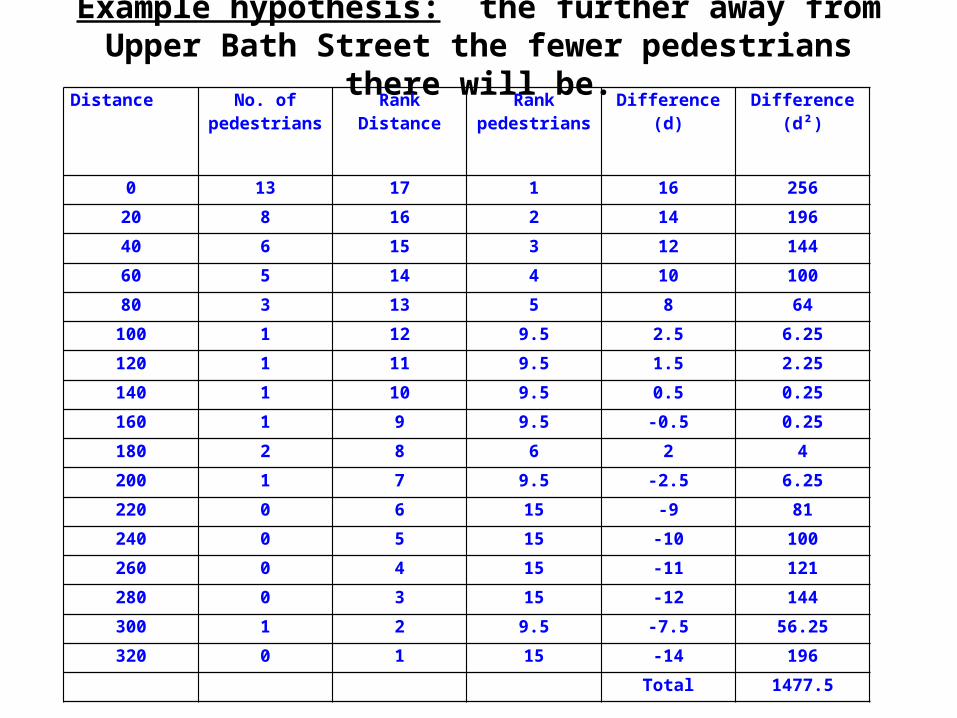
Example hypothesis: the further away from Upper Bath Street the fewer pedestrians
there will be.Distance No. of pedestrians
Rank Distance Rank pedestrians
Difference(d)
Difference(d²)
0 13 17 1 16 256
20 8 16 2 14 196
40 6 15 3 12 144
60 5 14 4 10 100
80 3 13 5 8 64
100 1 12 9.5 2.5 6.25
120 1 11 9.5 1.5 2.25
140 1 10 9.5 0.5 0.25
160 1 9 9.5 -0.5 0.25
180 2 8 6 2 4
200 1 7 9.5 -2.5 6.25
220 0 6 15 -9 81
240 0 5 15 -10 100
260 0 4 15 -11 121
280 0 3 15 -12 144
300 1 2 9.5 -7.5 56.25
320 0 1 15 -14 196
Total 1477.5
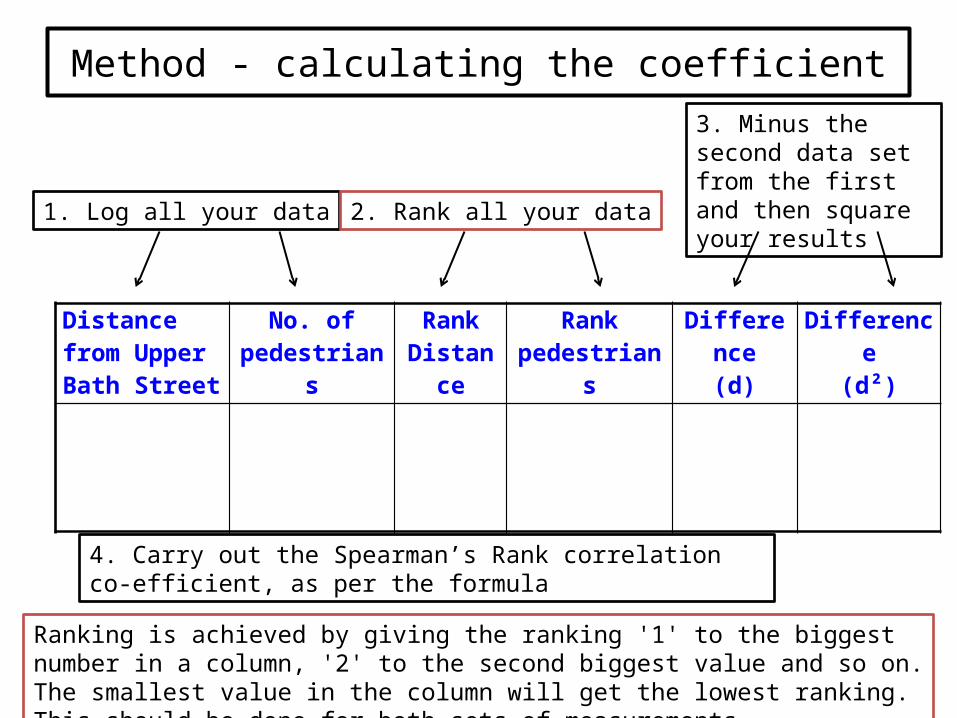
Method - calculating the coefficient
Distance from Upper Bath Street
No. of pedestrians
Rank Distance
Rank pedestrians
Difference(d)
Difference(d²)
1. Log all your data 2. Rank all your data
3. Minus the second data set from the first and then square your results
4. Carry out the Spearman’s Rank correlation co-efficient, as per the formula
Ranking is achieved by giving the ranking '1' to the biggest number in a column, '2' to the second biggest value and so on. The smallest value in the column will get the lowest ranking. This should be done for both sets of measurements.
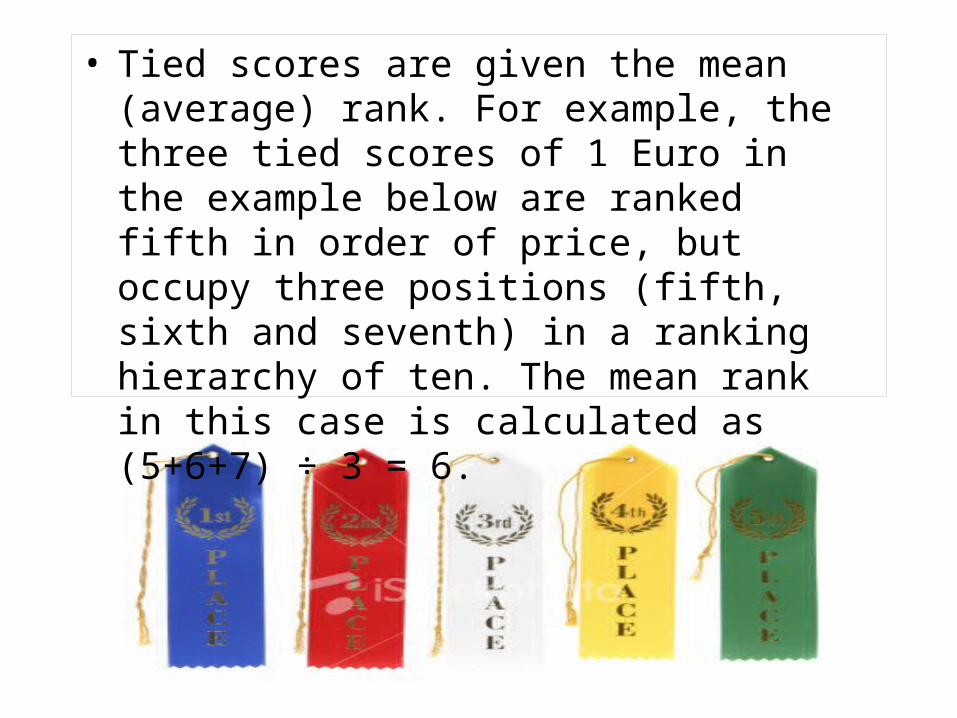
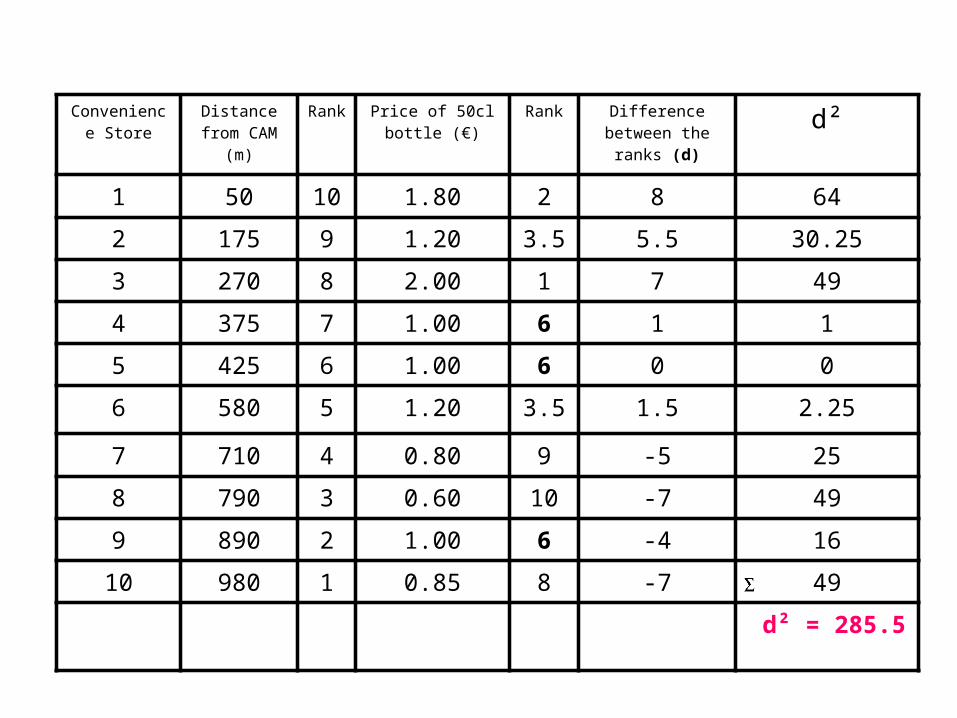
• Tied scores are given the mean (average) rank. For example, the three tied scores of 1 Euro in the example below are ranked fifth in order of price, but occupy three positions (fifth, sixth and seventh) in a ranking hierarchy of ten. The mean rank in this case is calculated as (5+6+7) ÷ 3 = 6.
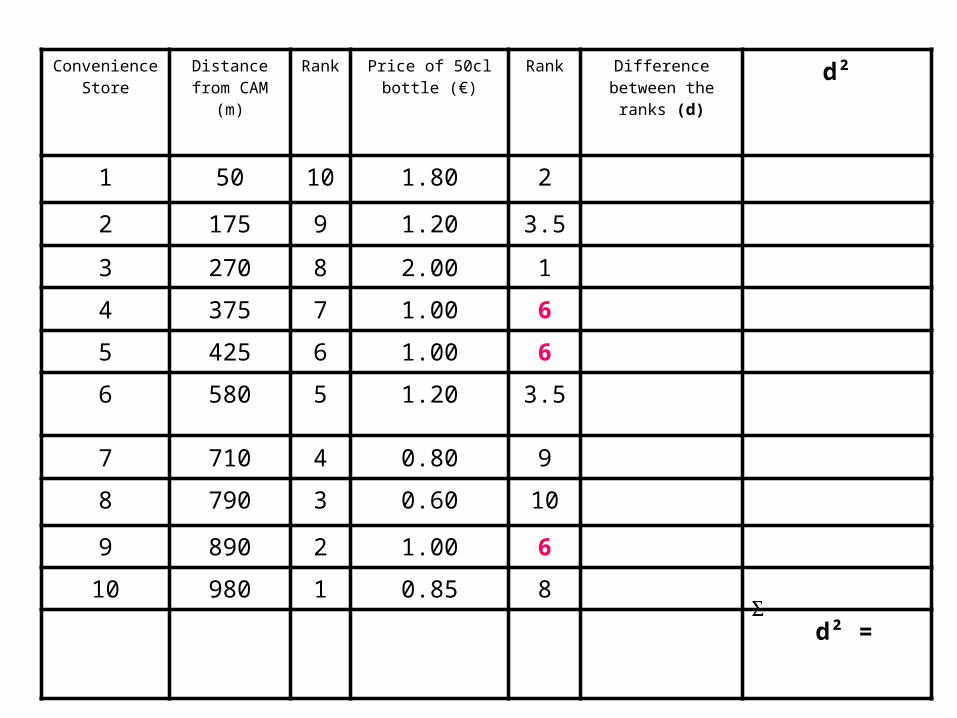
Convenience Store
Distance from CAM
(m)
Rank Price of 50cl bottle (€)
Rank Difference between the
ranks (d)
d²
1 50 10 1.80 2
2 175 9 1.20 3.5
3 270 8 2.00 1
4 375 7 1.00 6
5 425 6 1.00 6
6 580 5 1.20 3.5
7 710 4 0.80 9
8 790 3 0.60 10
9 890 2 1.00 6
10 980 1 0.85 8
d² =
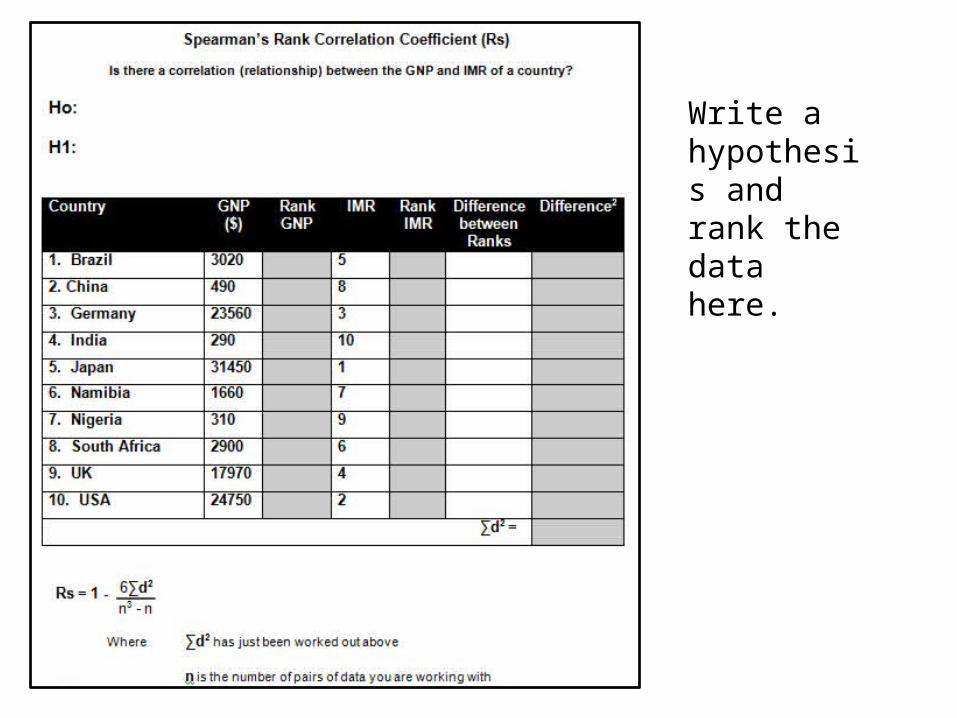
Write a hypothesis and rank the data here.
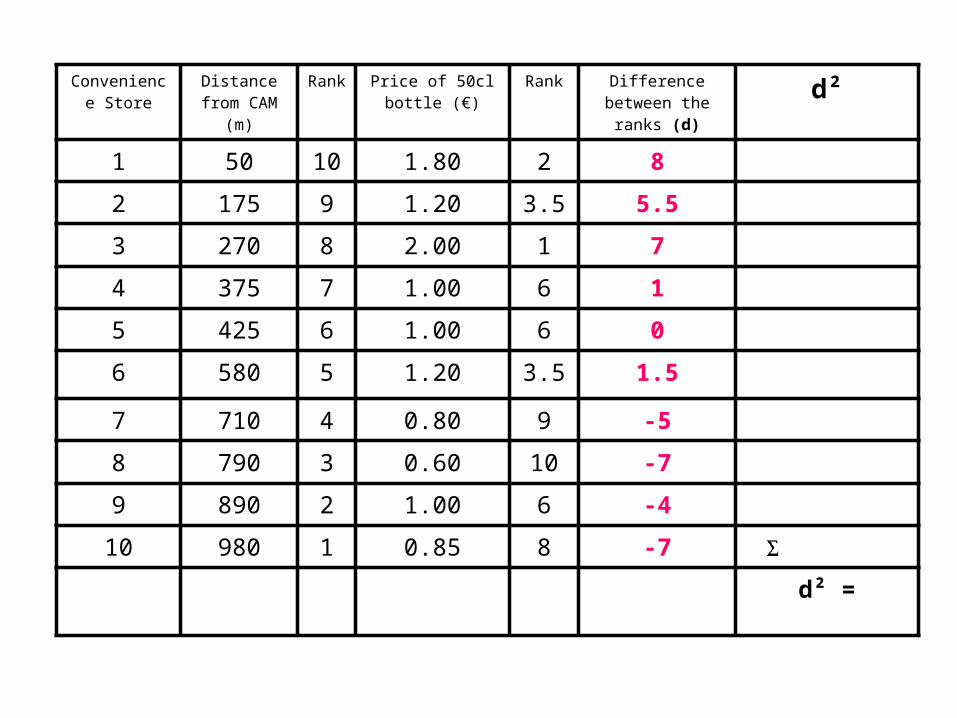
• Find the difference in the ranks (d): This is the difference between the ranks of the two values on each row of the table. The rank of the second value (price) is subtracted from the rank of the first (distance from the museum).
Convenience Store
Distance from CAM
(m)
Rank
Price of 50cl bottle (€)
Rank Difference between the
ranks (d)
d²
1 50 10 1.80 2 8
2 175 9 1.20 3.5 5.5
3 270 8 2.00 1 7
4 375 7 1.00 6 1
5 425 6 1.00 6 0
6 580 5 1.20 3.5 1.5
7 710 4 0.80 9 -5
8 790 3 0.60 10 -7
9 890 2 1.00 6 -4
10 980 1 0.85 8 -7
d² =
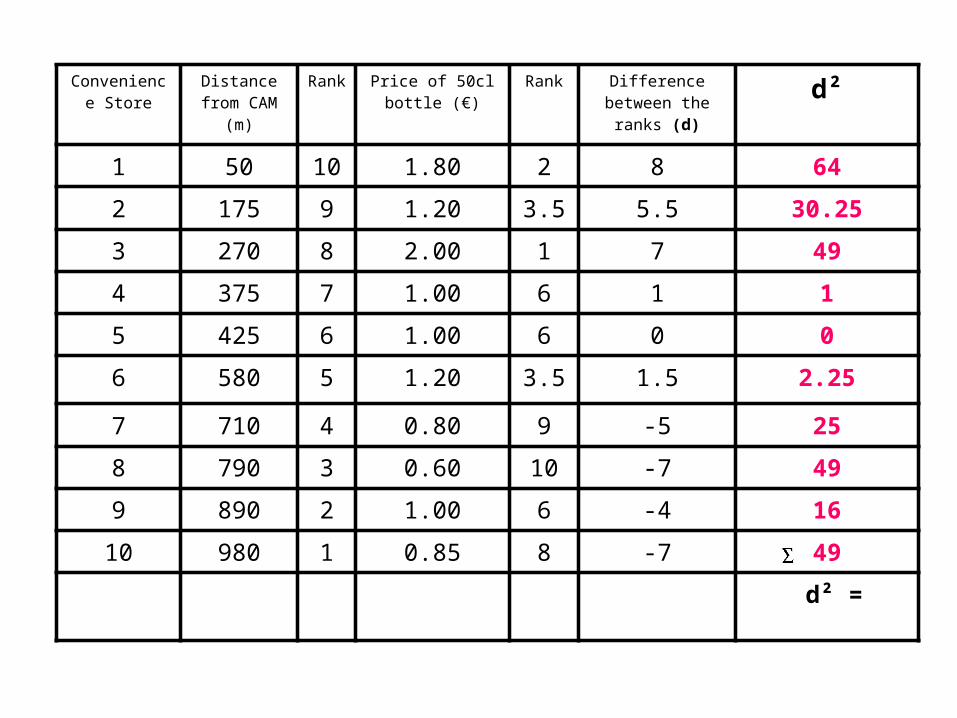
• Square the differences (d²) to remove negative values.
Convenience Store
Distance from CAM
(m)
Rank
Price of 50cl bottle (€)
Rank Difference between the
ranks (d)
d²
1 50 10 1.80 2 8 64
2 175 9 1.20 3.5 5.5 30.25
3 270 8 2.00 1 7 49
4 375 7 1.00 6 1 1
5 425 6 1.00 6 0 0
6 580 5 1.20 3.5 1.5 2.25
7 710 4 0.80 9 -5 25
8 790 3 0.60 10 -7 49
9 890 2 1.00 6 -4 16
10 980 1 0.85 8 -7 49
d² =
• and then sum them ( d²).
Convenience Store
Distance from CAM
(m)
Rank
Price of 50cl bottle (€)
Rank Difference between the
ranks (d)
d²
1 50 10 1.80 2 8 64
2 175 9 1.20 3.5 5.5 30.25
3 270 8 2.00 1 7 49
4 375 7 1.00 6 1 1
5 425 6 1.00 6 0 0
6 580 5 1.20 3.5 1.5 2.25
7 710 4 0.80 9 -5 25
8 790 3 0.60 10 -7 49
9 890 2 1.00 6 -4 16
10 980 1 0.85 8 -7 49
d² = 285.5
• When written in mathematical notation the Spearman Rank formula looks like this :
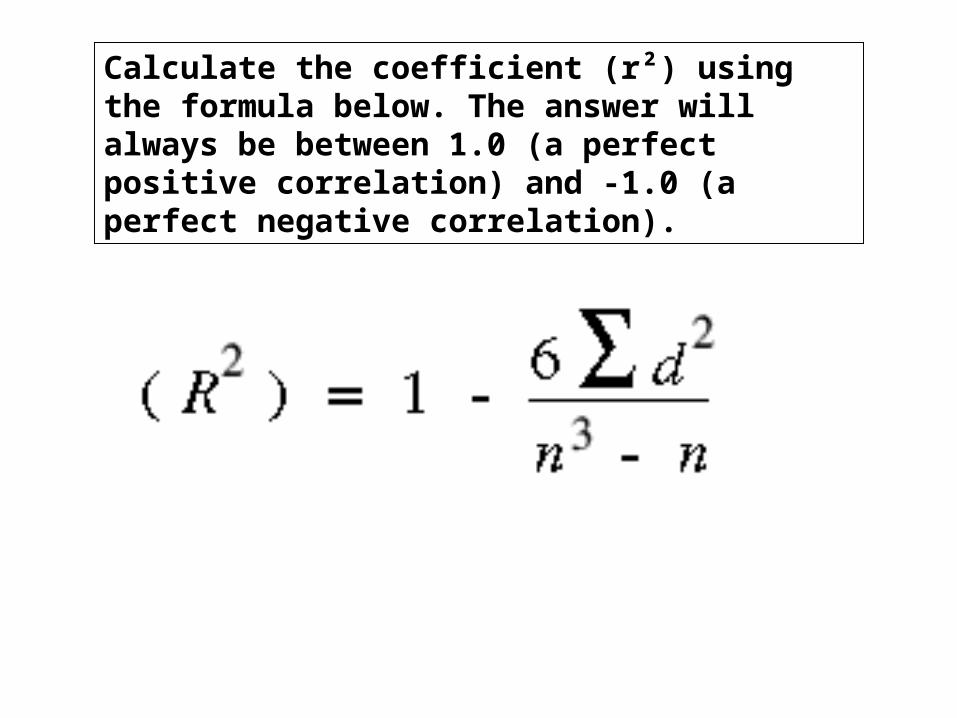
Calculate the coefficient (r²) using the formula below. The answer will always be between 1.0 (a perfect positive correlation) and -1.0 (a perfect negative correlation).
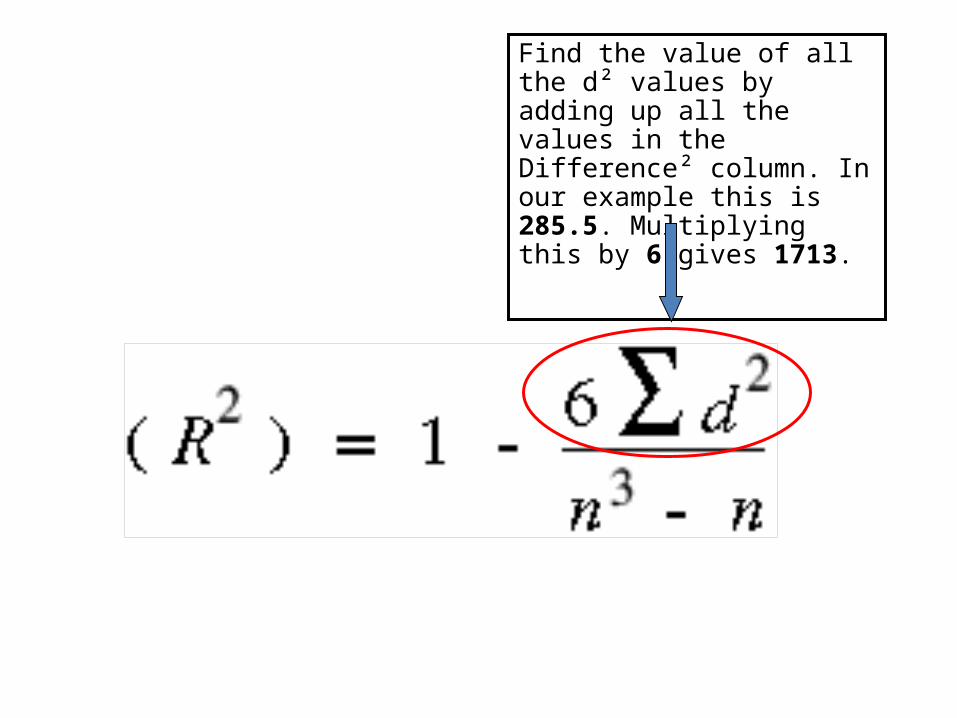
Find the value of all the d² values by adding up all the values in the Difference² column. In our example this is 285.5. Multiplying this by 6 gives 1713.

The value n is the number of sites at which you took measurements. This, in our example is 10. Substituting these values into n³ - n we get 1000 - 10
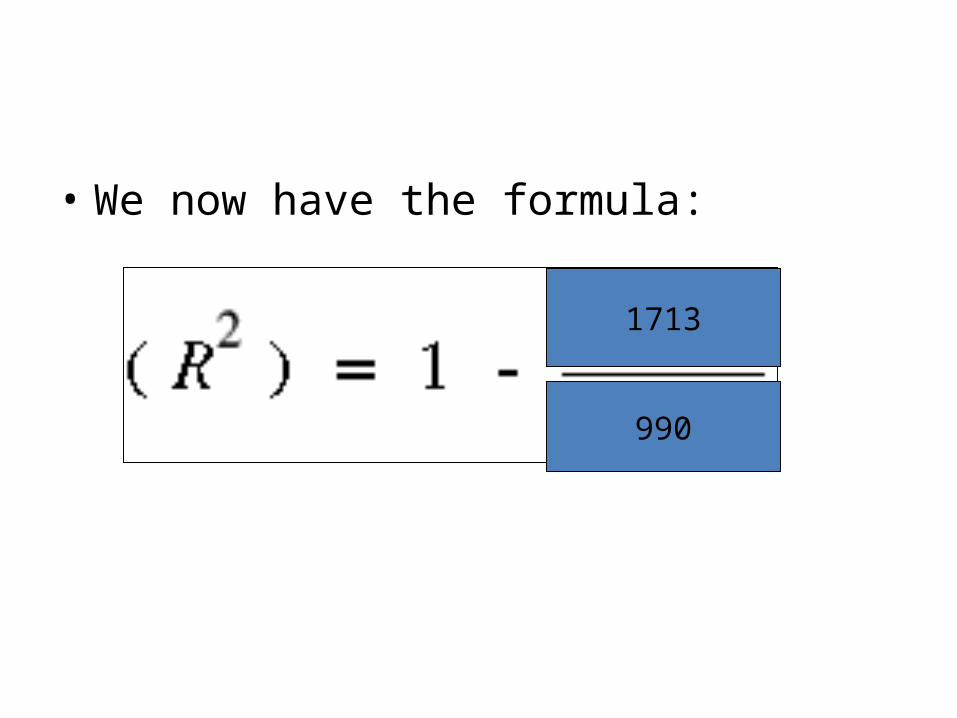
• We now have the formula:
1713
990
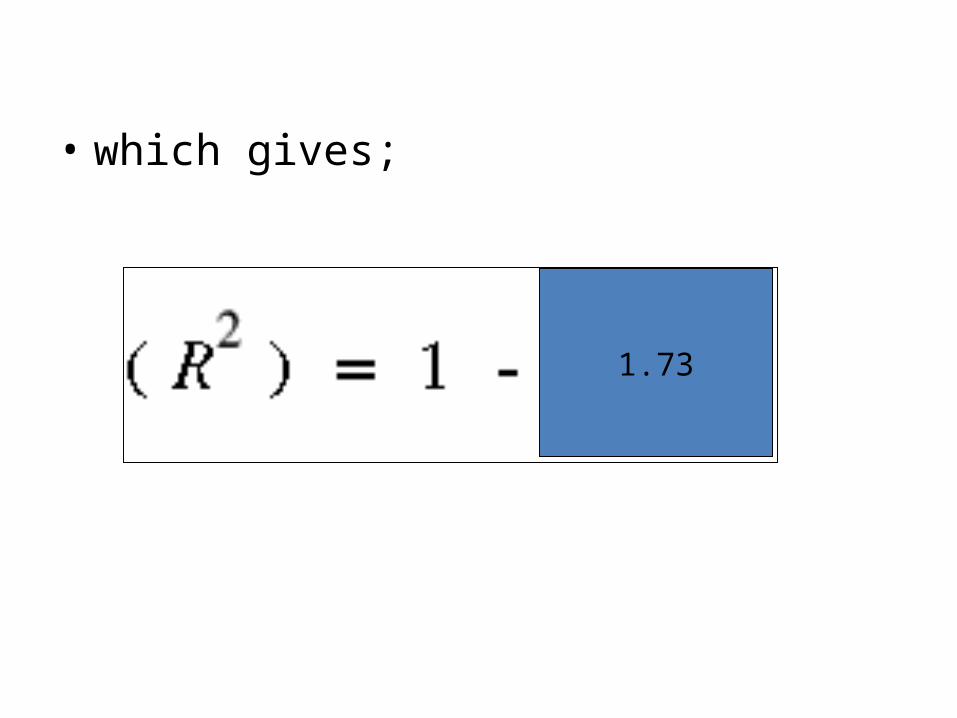
• which gives;
1.73
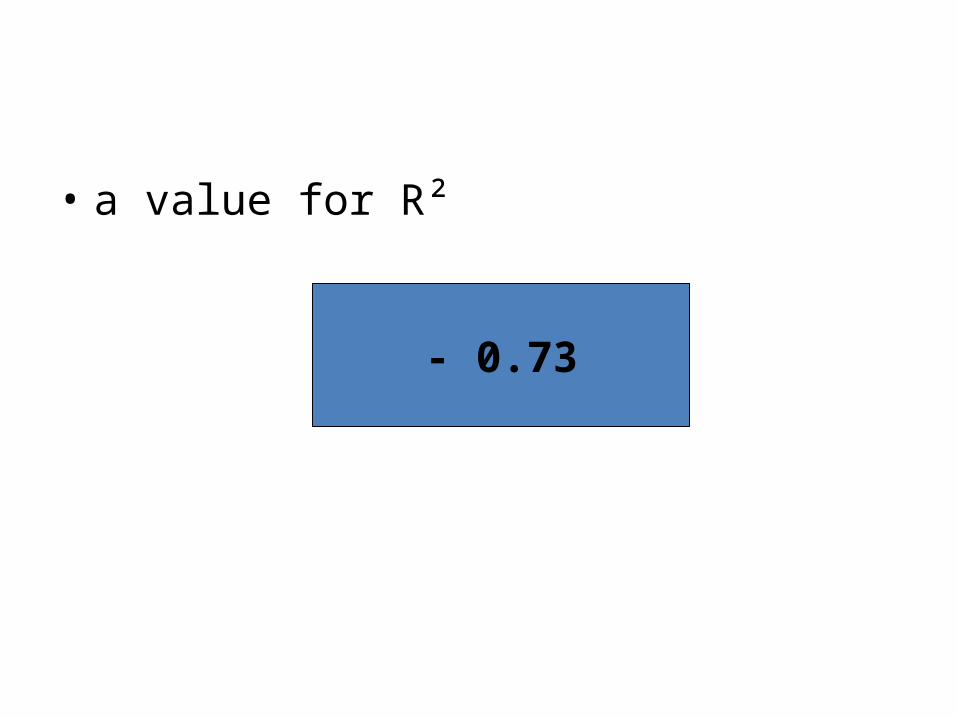
• a value for R²
- 0.73
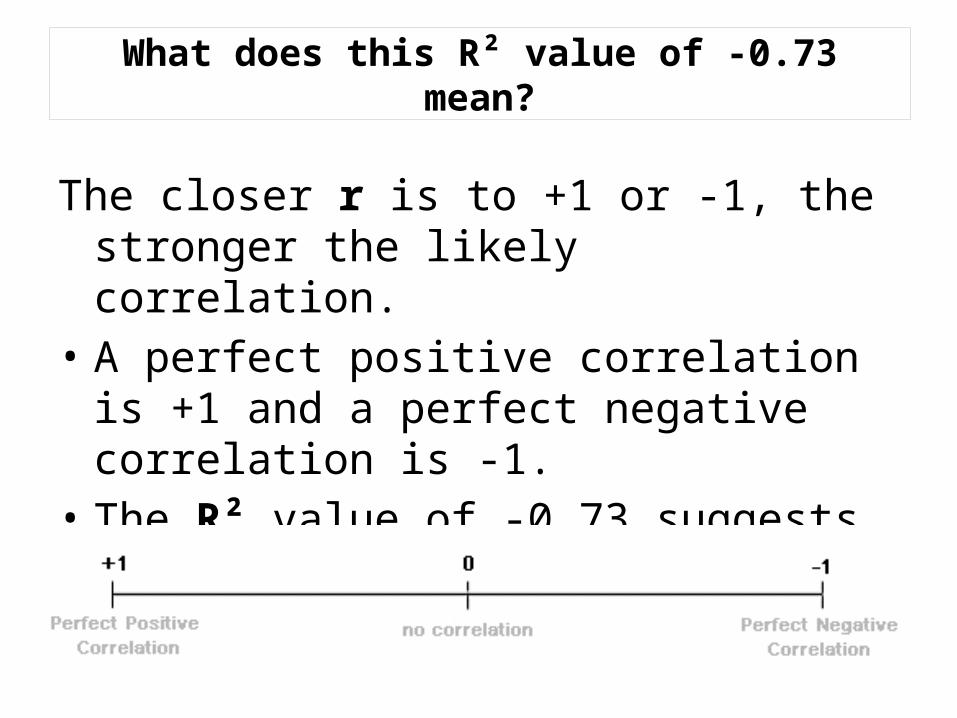
What does this R² value of -0.73 mean?
The closer r is to +1 or -1, the stronger the likely correlation.
• A perfect positive correlation is +1 and a perfect negative correlation is -1.
• The R² value of -0.73 suggests a fairly strong negative relationship.

• A further technique is now required to test the significance of the relationship.
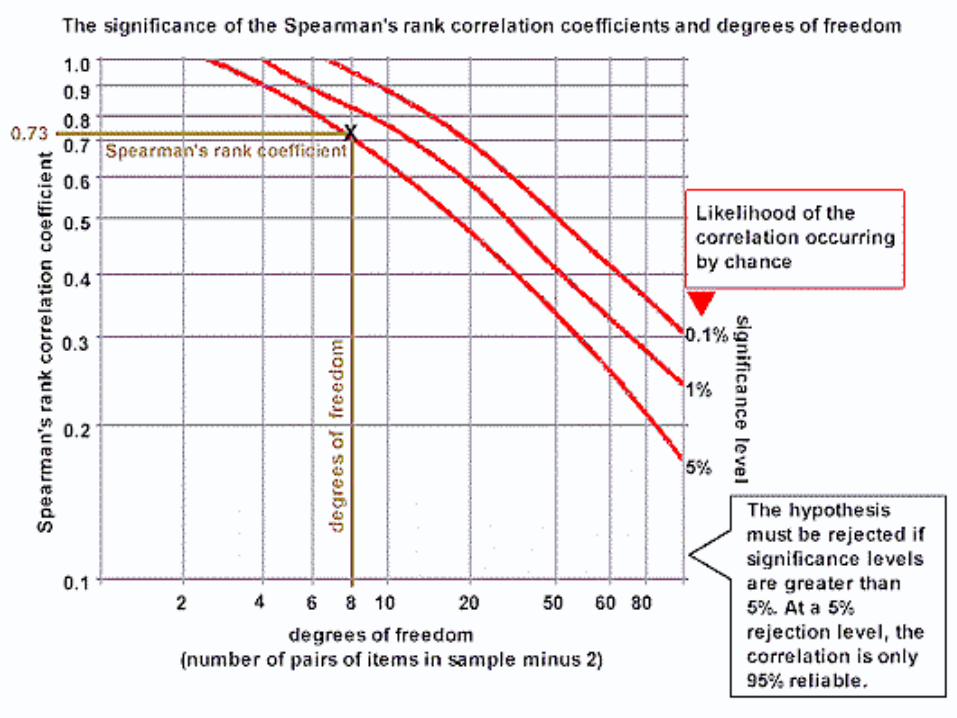
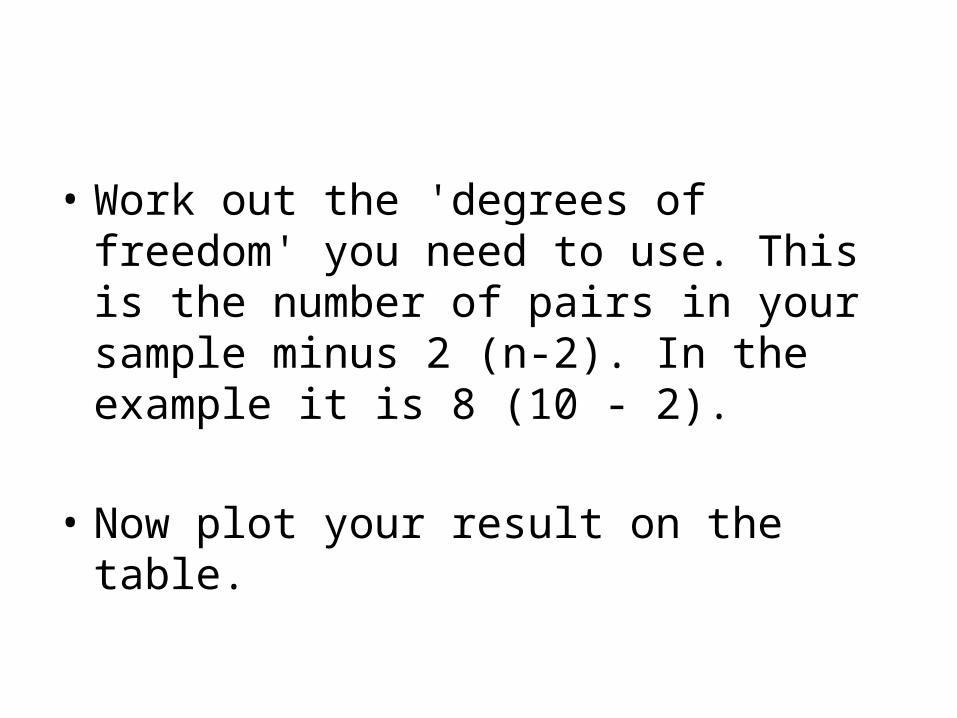
• Work out the 'degrees of freedom' you need to use. This is the number of pairs in your sample minus 2 (n-2). In the example it is 8 (10 - 2).
• Now plot your result on the table.
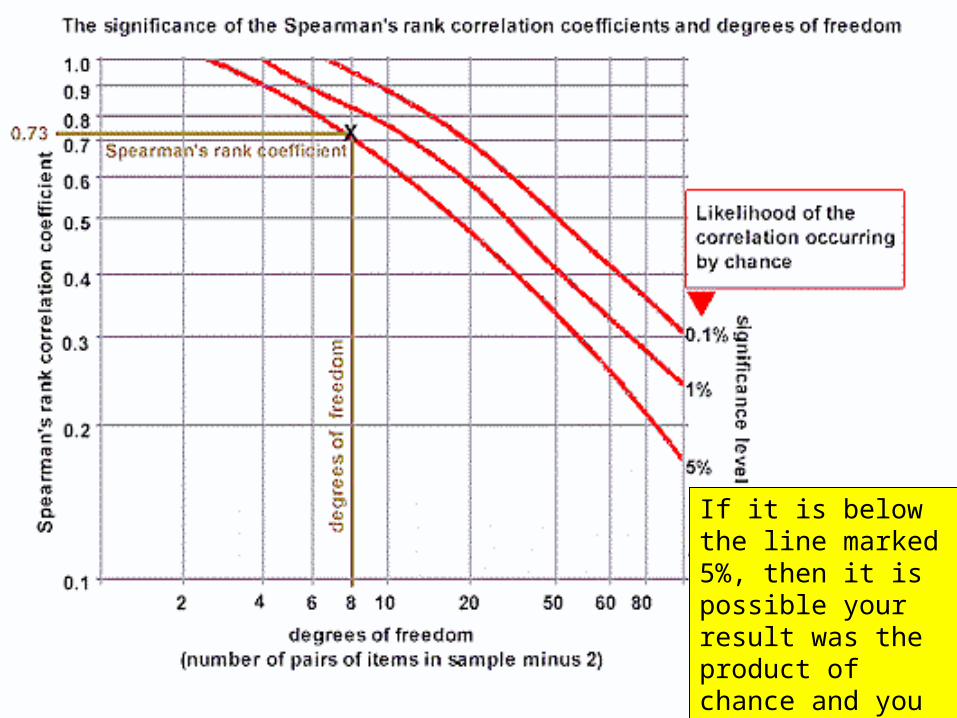
If it is below the line marked 5%, then it is possible your result was the product of chance and you must reject the hypothesis.
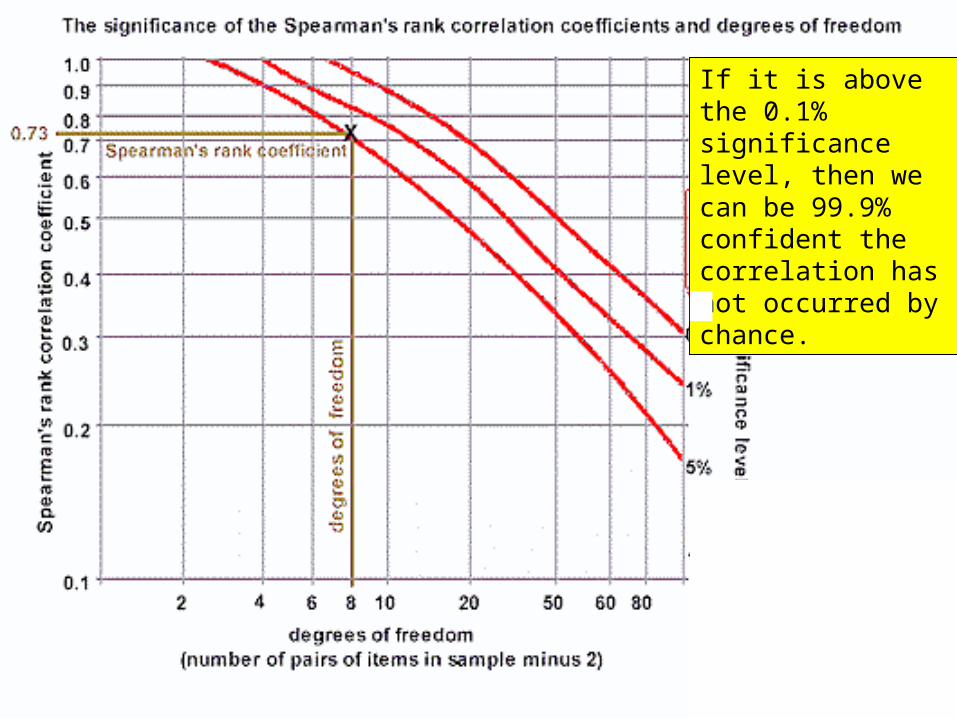
If it is above the 0.1% significance level, then we can be 99.9% confident the correlation has not occurred by chance.

If it is above 1%, but below 0.1%, you can say you are 99% confident.
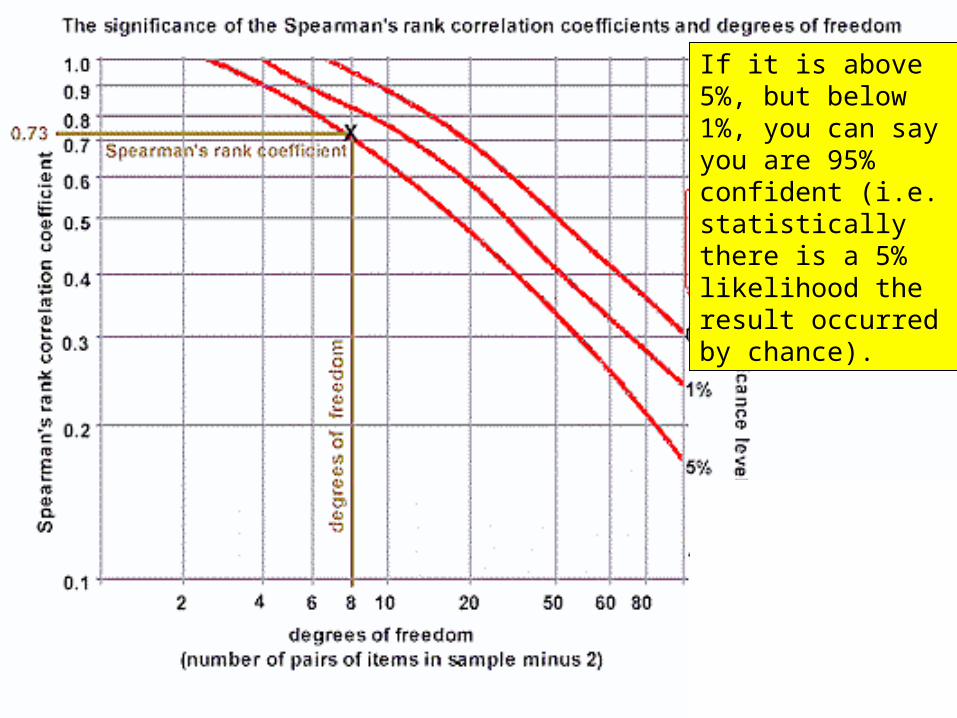
If it is above 5%, but below 1%, you can say you are 95% confident (i.e. statistically there is a 5% likelihood the result occurred by chance).
• In the example, the value 0.73 gives a significance level of slightly less than 5%.
• That means that the probability of the relationship you have found being a chance event is about 5 in a 100.
• You are 95% certain that your hypothesis is correct.
• The fact two variables correlate cannot prove anything - only further research can actually prove that one thing affects the other.
• Data reliability is related to the size of the sample. The more data you collect, the more reliable your result.
Your IA
• You will now need to create a new hypothesis to include within the results section of your IA to show how 2 pieces of data might be linked.
• Which ones would you expect there to be a correlation with?
Example of student’s work…
Your IA
• I cannot help you do the Spearman’s Correlation calculations on your own data set.
• There are the handouts and the notes you have from today’s lesson…if you follow these closely you should be able to work it out.