Embed Size (px)
Citation preview
T E C H N I C A L M E M O R A N D U M CH2IVIHILL
SFUND RECORDS CTRData Evaluation Report 2069716Existing Conditions at Iron Mountain MineMatheson SitePREPARED FOR: Rick Sugarek/EPA
PREPARED BY: john Spitzley/CH2M HILLJack Woo/CH2M HILLDale Cannon/CH2M HILL
056-RDRD-0917DATE: July 3,2001
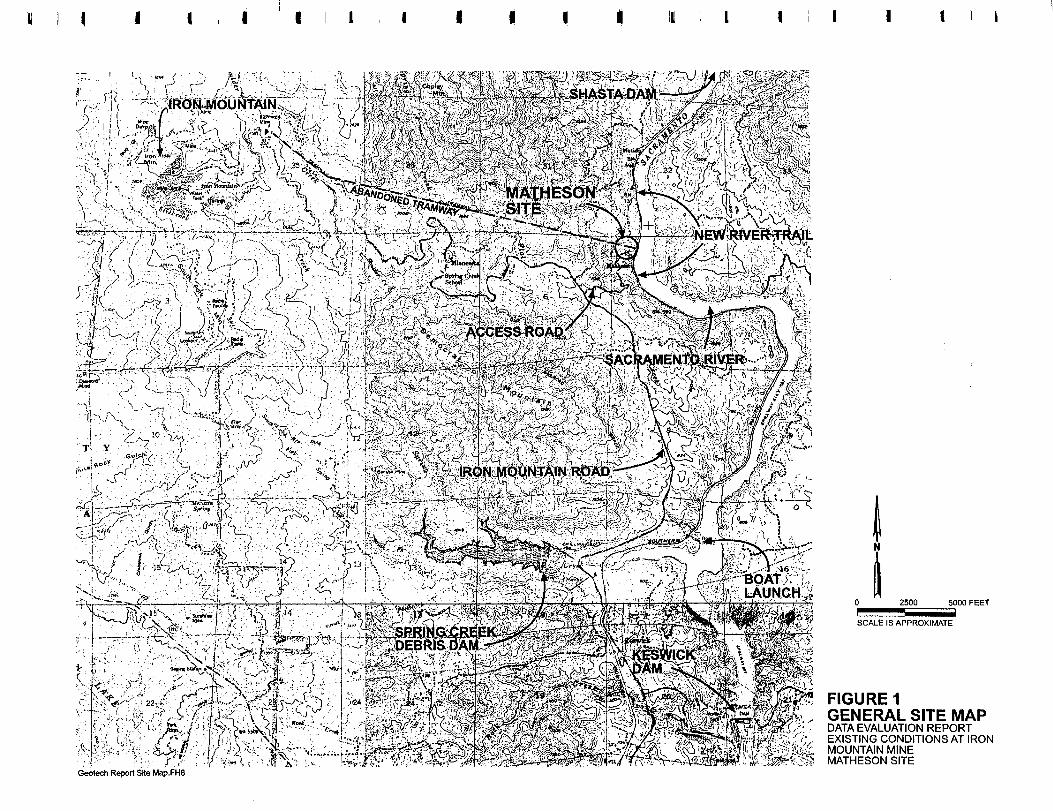
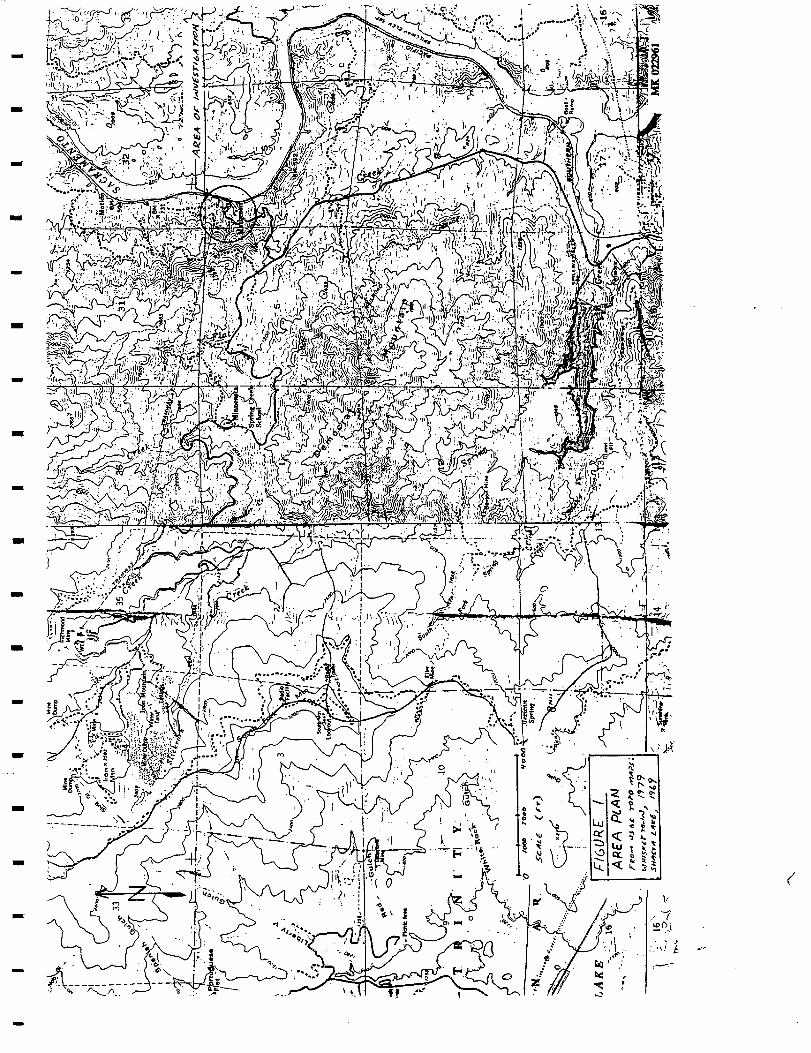
1.0 Project DescriptionThis technical memorandum presents the Data Evaluation Report for existing site conditionsat the Matheson Site near the Iron Mountain Mine (IMM) Superfund Site northwest ofRedding, California. The site is located adjacent to the Sacramento River at a locationdesignated by the U.S. Bureau of Land Management (BLM) for public access to theSacramento River and a new river trail that will extend from Keswick Dam to Shasta Dam.Figure 1 shows the location of the Matheson Site.
CH2M HILL completed this Work for the U.S. Environmental Protection Agency (USEPA)under the EPA RAC VI contract, Work Assignment 056.
2.0 IntroductionThis Data Evaluation Report summarizes field investigations and laboratory analyses con-ducted to determine the extent and character of the pyritic waste material, concretestructures and trash, debris, and other characteristics of the Matheson Site. This reportsummarizes the data that will be the basis for the subsequent Preliminary Design Report.
3.0 BackgroundMountain Copper Company constructed facilities on the Matheson Site between 1920 and1923 to store and transfer pyrite ore from IMM to Southern Pacific Railroad rail cars. Anaerial tramway conveyed the ore a distance of approximately 4 miles from Iron Mountain tothe Matheson Site (Figure 1). The rail cars transported the ore to processing plants inCalifornia and Washington. The Matheson Site included ore bunkers, a tram terminal, main-line railroad sidings, a stockpile area, and warehouses. Historical documents show that thesite was used through the 1950s, except during construction of a new railroad line after
RDD/011770002.DOC (CAH979.DOC) 1 161151.DE.DE
V^X-VO-TO;.;;*:' • <f*~ *K\ TC>"-S"'- ••-
<•.. I'l -| (^E ''.'^(itf'J^ 3?1'
•>... :- ..i?»'j. -jt. . . •• . . •/ \- '" •• . .. ' - - ~ J - -0______2500_____5000 FEET
SCALE IS APPROXIMATE
FIGURE 1GENERAL SITE MAPDATA EVALUATION REPORTEXISTING CONDITIONS AT IRONMOUNTAIN MINEMATHESON SITE
DATA EVALUATION REPORTEXISTING CONDITIONS AT IRON MOUNTAIN MINE
MATHESON SITE
operation of Keswick Dam flooded the original line. The available documents do notconfirm that the site was used through the early 1960s when open-pit mining at IronMountain was halted. The rail line has since been replaced by BLM's river trail system(referred to hereafter as the river trail).
4.0 Field InvestigationsPrevious site investigations were conducted by Morrison Knudsen Corporation (MK) forStauffer Management Company (SMC) in 1994, and by the U.S. Bureau of Reclamation(USBR) in 1995. The existing site conditions were interpreted from data collected during afield investigation conducted by CH2M HILL between April 24 and 27, 2001. These existingdata will be used to supplement data from previous investigations.
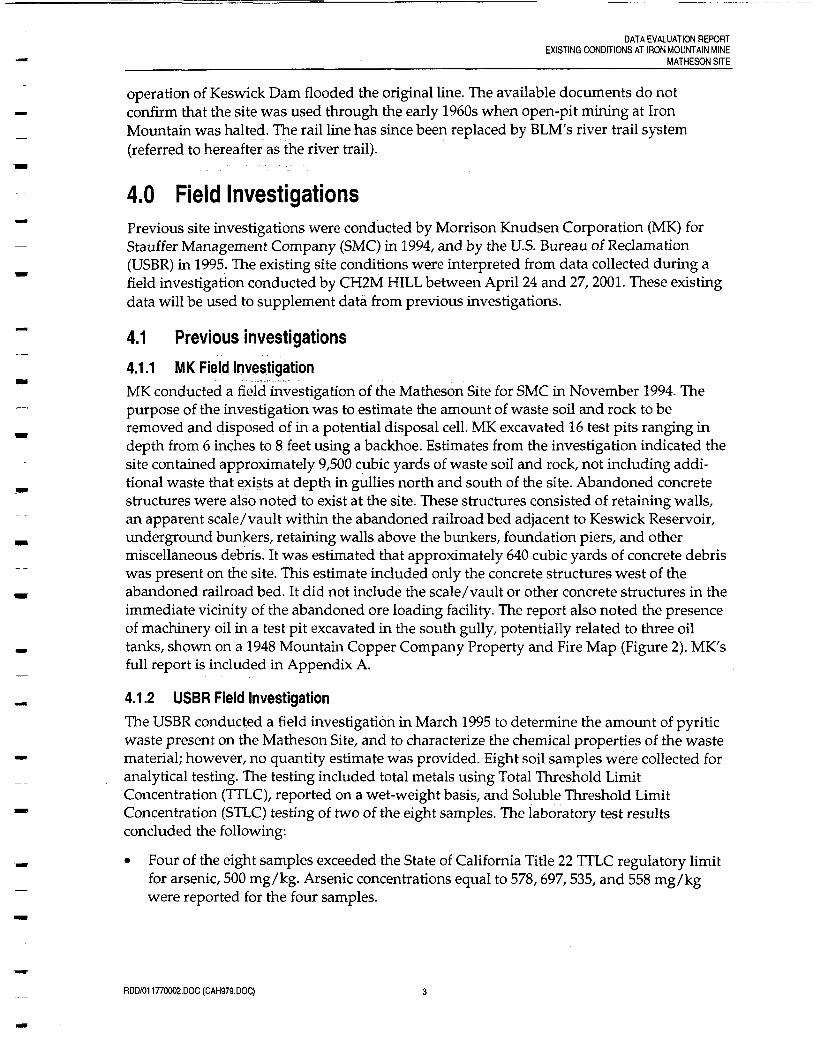
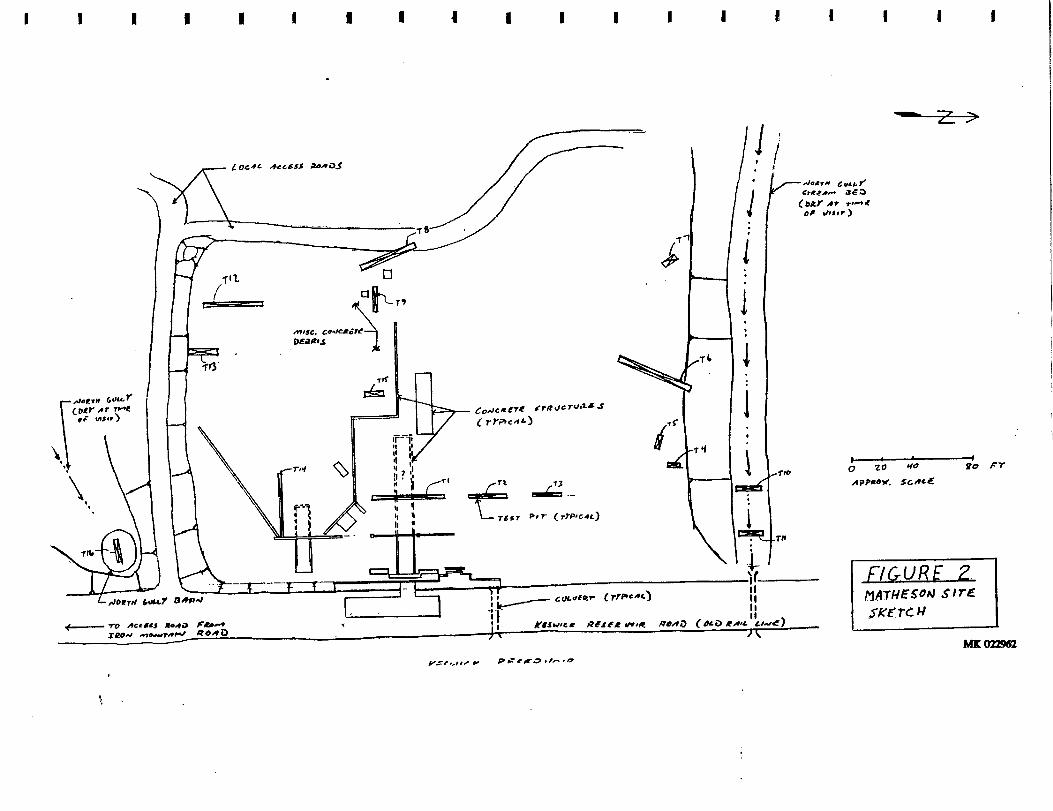
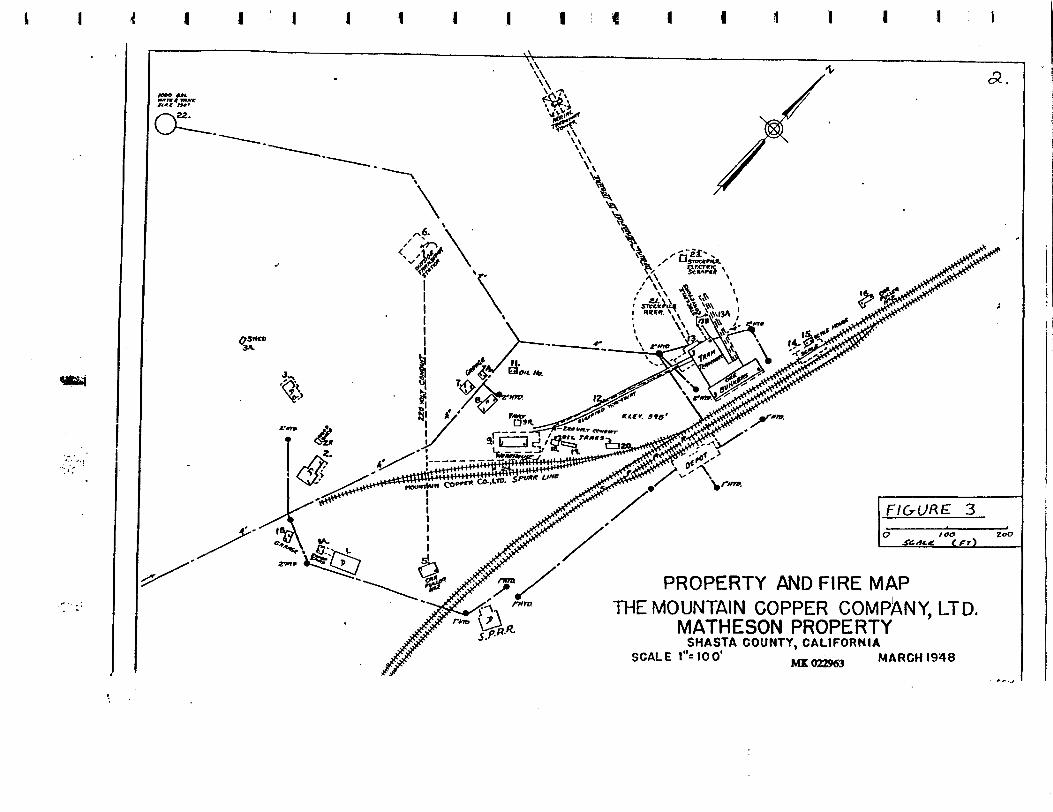
4.1 Previous investigations4.1.1 MK Field InvestigationMK conducted a field investigation of the Matheson Site for SMC in November 1994. Thepurpose of the investigation was to estimate the amount of waste soil and rock to beremoved and disposed of in a potential disposal cell. MK excavated 16 test pits ranging indepth from 6 inches to 8 feet using a backhoe. Estimates from the investigation indicated thesite contained approximately 9,500 cubic yards of waste soil and rock, not including addi-tional waste that exists at depth in gullies north and south of the site. Abandoned concretestructures were also noted to exist at the site. These structures consisted of retaining walls,an apparent scale/vault within the abandoned railroad bed adjacent to Keswick Reservoir,underground bunkers, retaining walls above the bunkers, foundation piers, and othermiscellaneous debris. It was estimated that approximately 640 cubic yards of concrete debriswas present on the site. This estimate included only the concrete structures west of theabandoned railroad bed. It did not include the scale/vault or other concrete structures in theimmediate vicinity of the abandoned ore loading facility. The report also noted the presenceof machinery oil in a test pit excavated in the south gully, potentially related to three oiltanks, shown on a 1948 Mountain Copper Company Property and Fire Map (Figure 2). MK'sfull report is included in Appendix A.
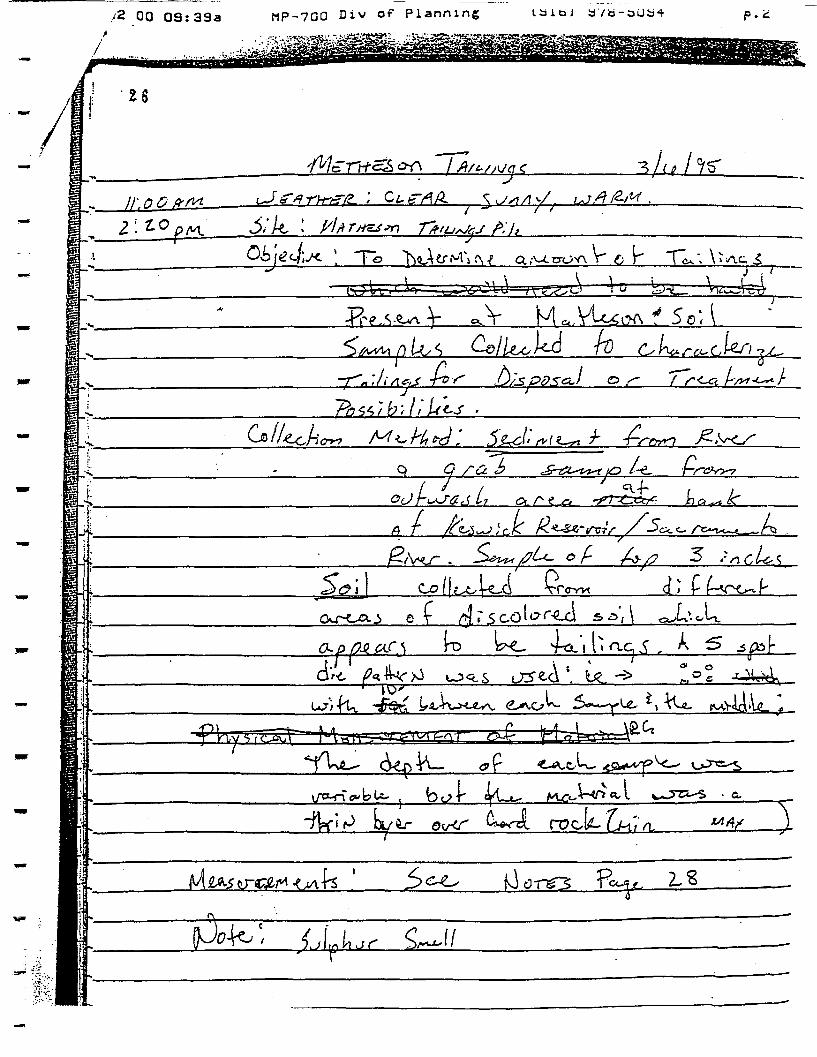
4.1.2 USBR Field InvestigationThe USBR conducted a field investigation in March 1995 to determine the amount of pyriticwaste present on the Matheson Site, and to characterize the chemical properties of the wastematerial; however, no quantity estimate was provided. Eight soil samples were collected foranalytical testing. The testing included total metals using Total Threshold LimitConcentration (TTLC), reported on a wet-weight basis, and Soluble Threshold LimitConcentration (STLC) testing of two of the eight samples. The laboratory test resultsconcluded the following:
• Four of the eight samples exceeded the State of California Title 22 TTLC regulatory limitfor arsenic, 500 mg/kg. Arsenic concentrations equal to 578,697,535, and 558 mg/kgwere reported for the four samples.
RDD/011770002.DOC (CAH979.DOC)
II! ! I I 1 1
& \ I*, <£
FIGURE 2
PROPERTY AND FIRE MAP
DATA EVALUATION REPORTEXISTING CONDITIONS AT IRON MOUNTAIN MINE
MATHESON SITE
• One of the two samples exceeded the State of California Title 22 STLC regulatory limitfor lead, 5 mg/L. A lead concentration equal to 46.2 mg/L was reported for that onesample.
The analytical results from USSR's samples are included in Appendix B.
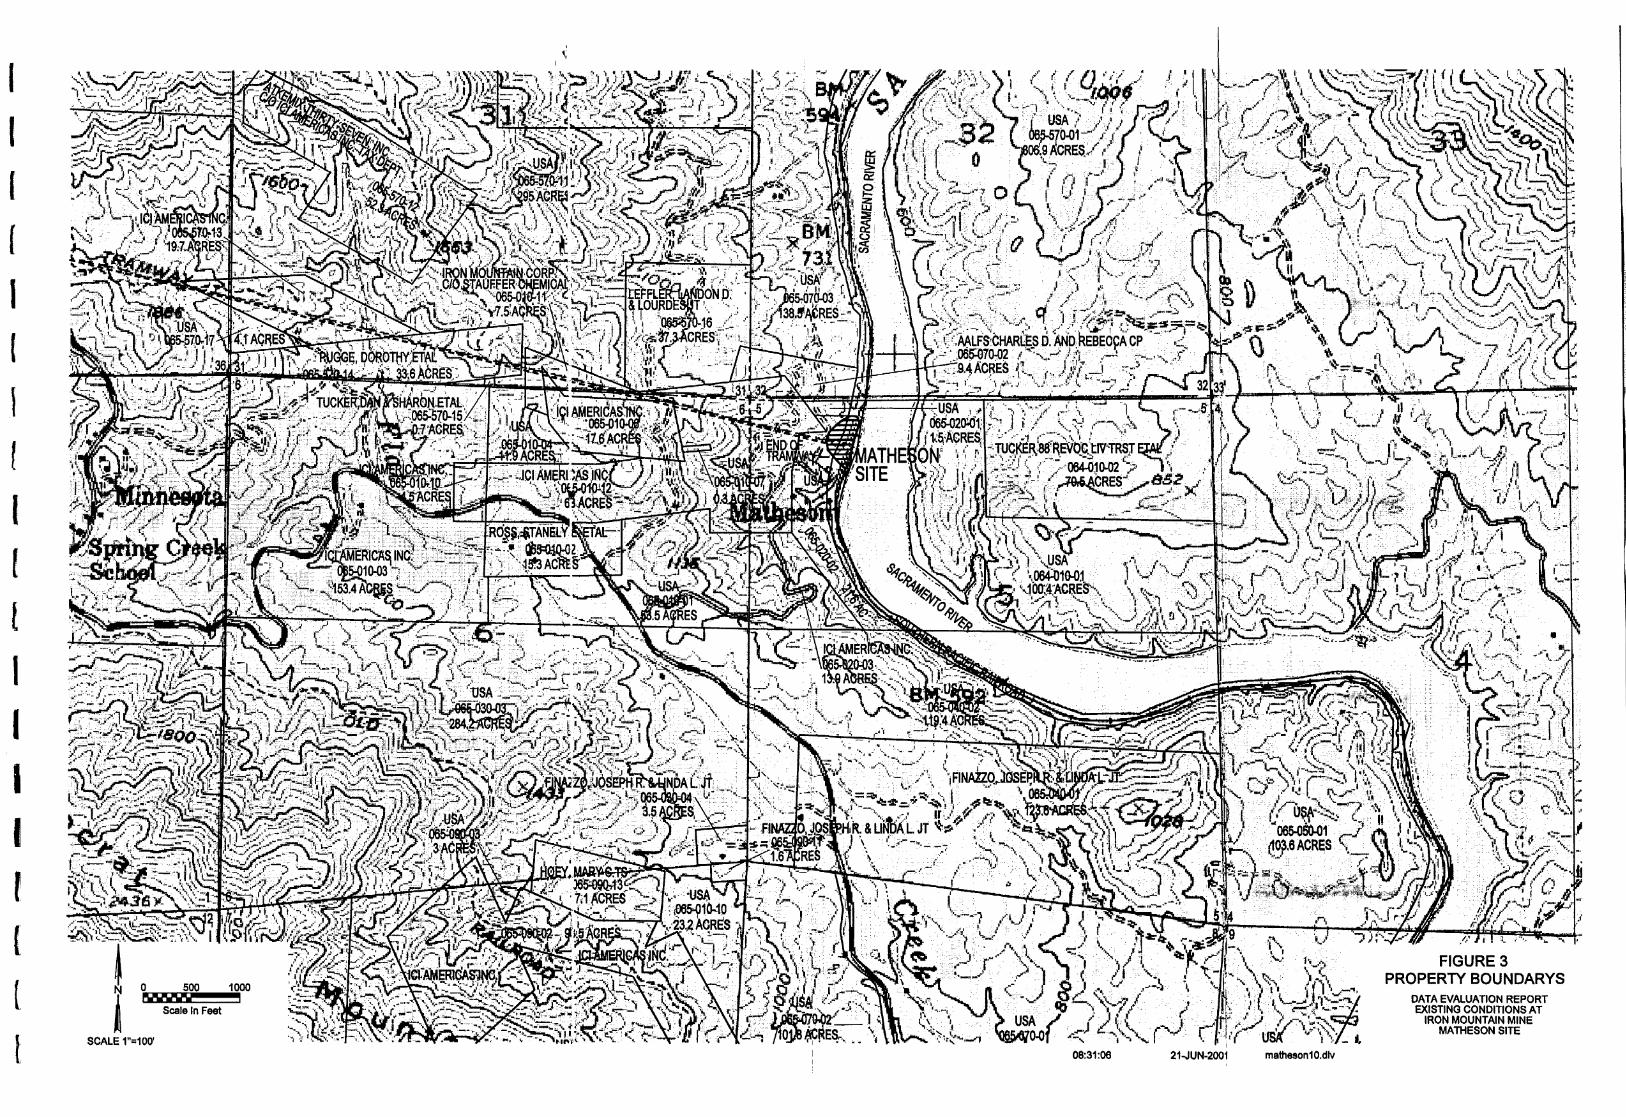
4.2 CH2M HILL Site Investigations4.2.1 Site SurveysCH2M HILL conducted field surveys to obtain data and to review the accuracy of theprevious information for the remedial design. The site surveys of the Matheson Siteobtained current property boundaries, utility rights-of-way, and topographic information.
The property boundary data were obtained from the Shasta County Assessor's Office.Figure 3 shows the property owners in the vicinity of the Matheson site. The site is locatedin Township 33N, Range 5W, Section 5 on property owned by USER, parcel number 065-020-02, and is on a Southern Pacific Railroad right-of-way.
There were no utility rights-of-way found on the site.
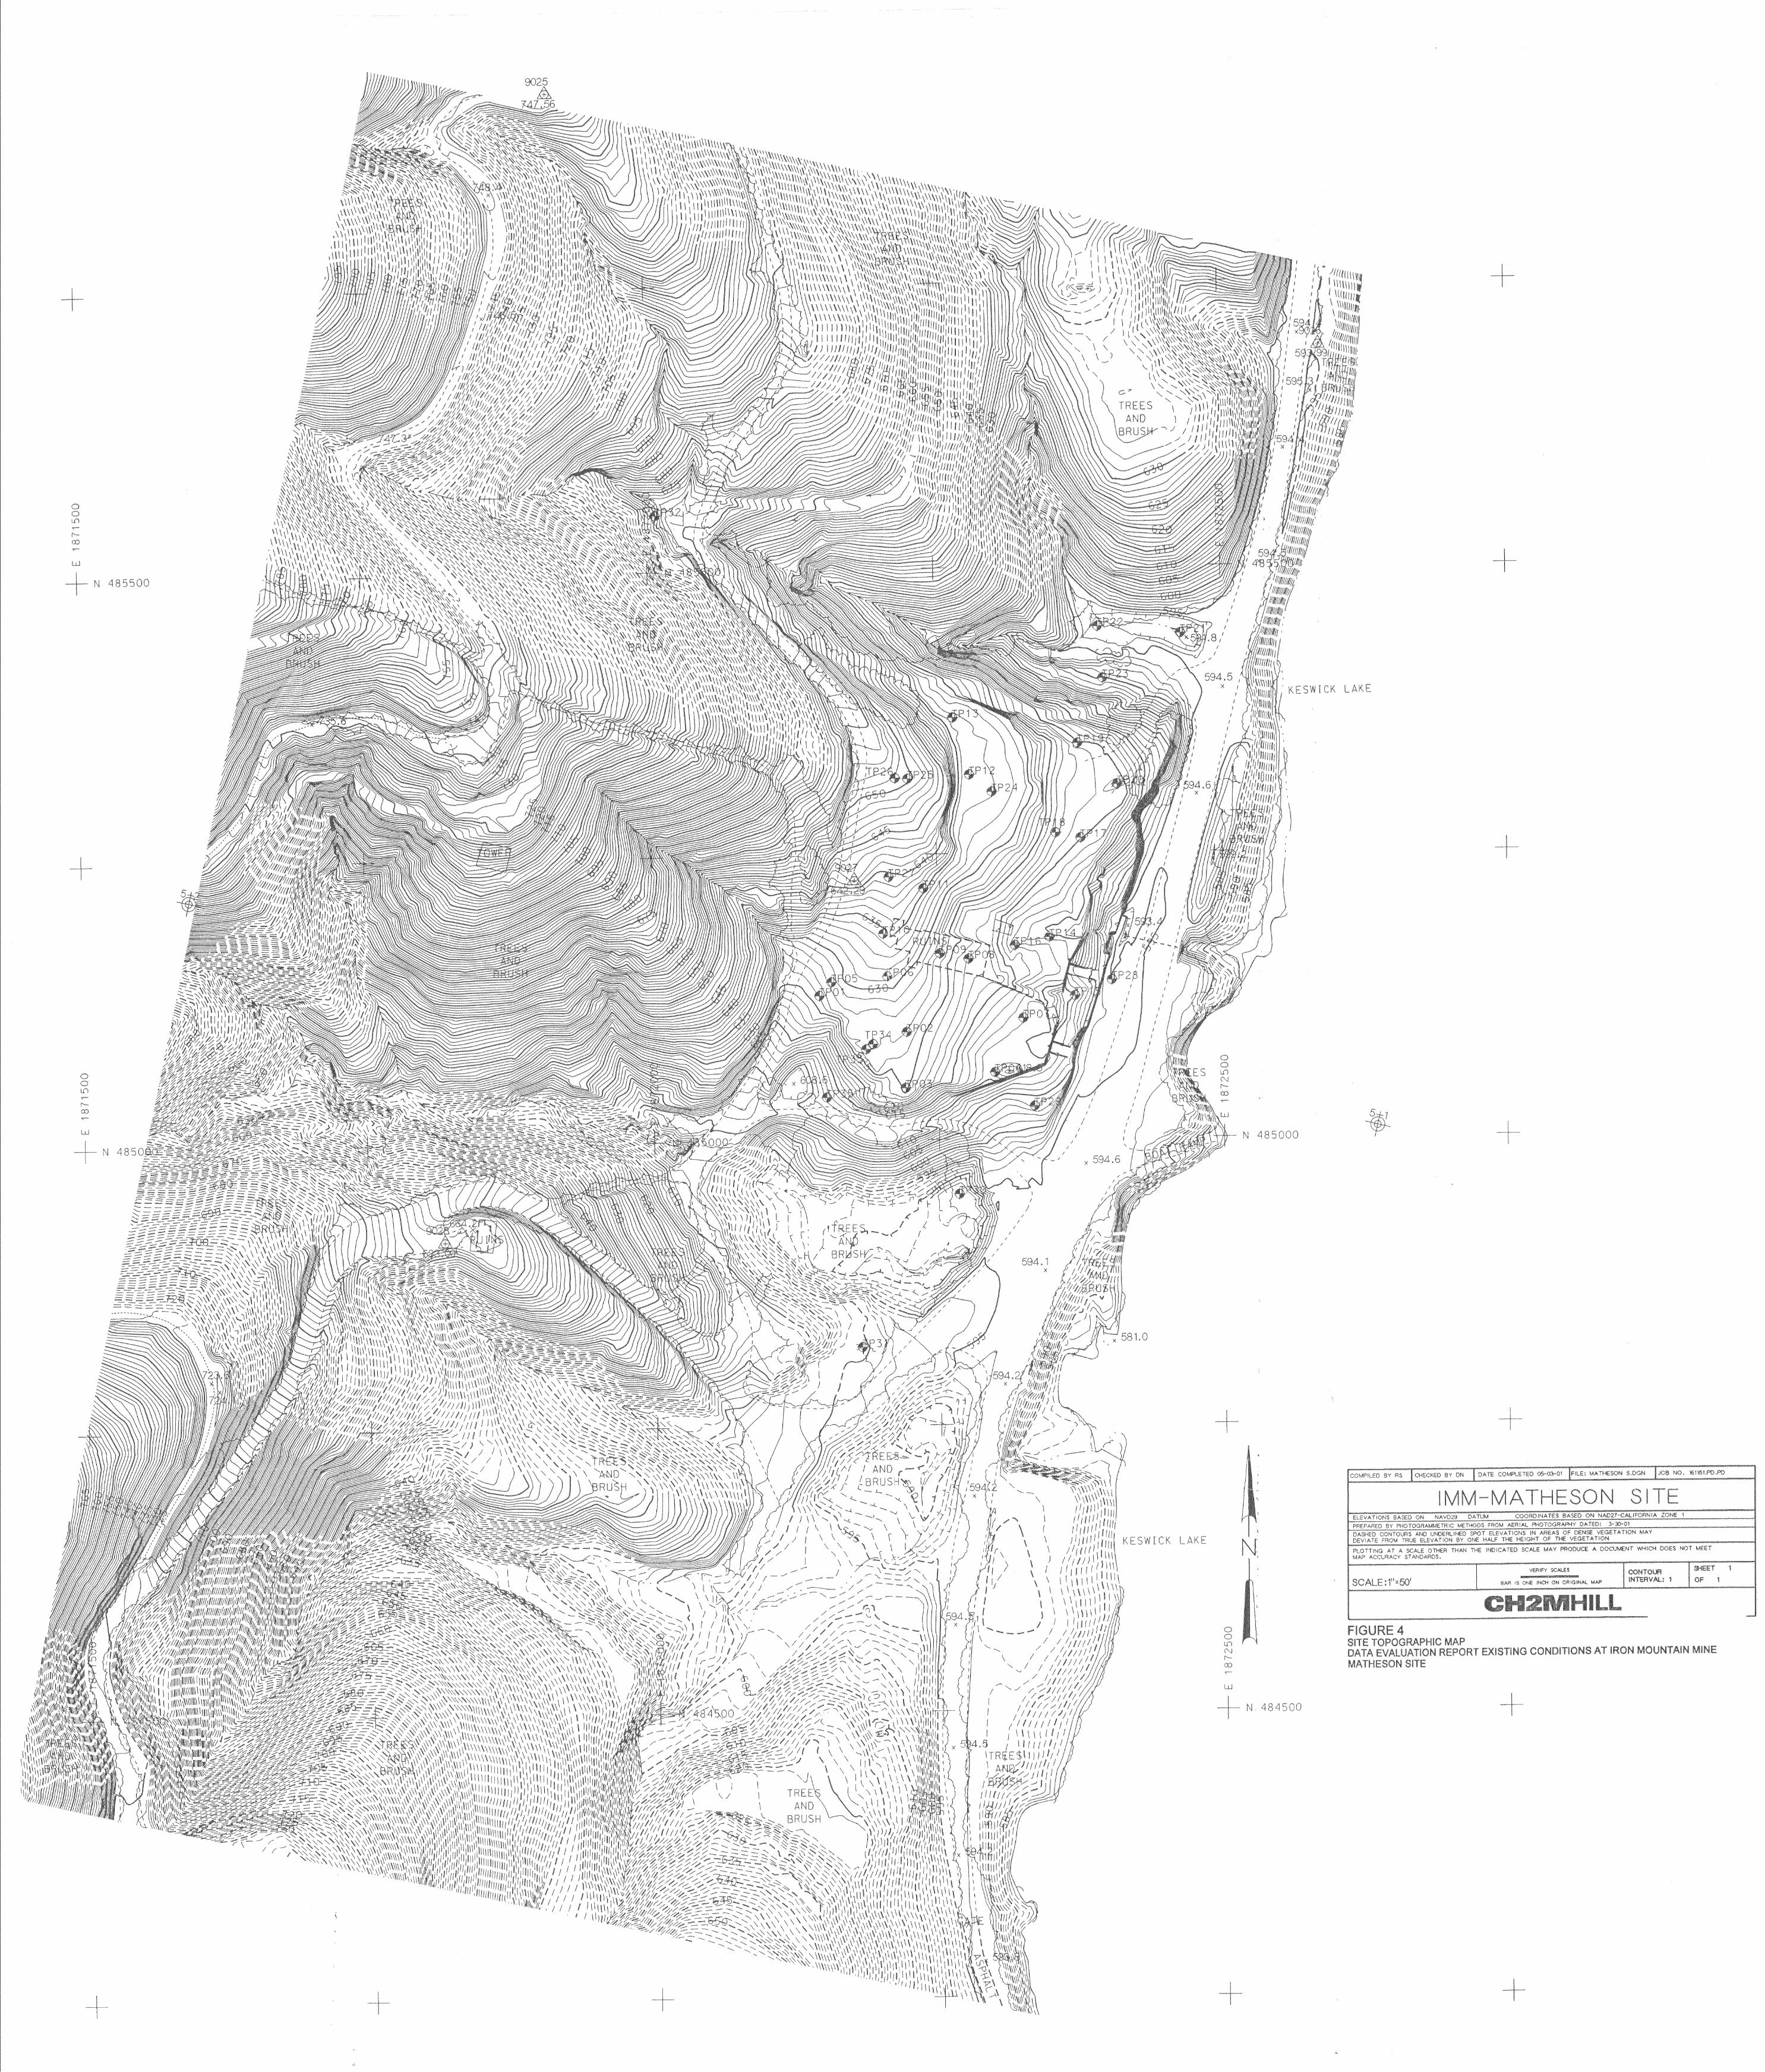
The topographic mapping, Figure 4, was prepared from aerial photography and site-specificground control surveys. (Figure 4 is located in a plastic pocket at the back of this report.)U.S. Geological Survey (USGS) maps were used to extend the topographic mapping to theentire watershed. These combined maps will be used for determining the volume of runoffduring storm events and for sizing drainage facilities.
4.2.2 Land SurveyThe purpose of the land survey was to establish current topographic contours and surveycontrol. The survey control was used to position locations of surface and subsurface samplesand test pits, and for calculating quantities and locations of potential hazardous substancesand debris at the Matheson Site. The purpose also was to identify the original topography ofthe Matheson Site.
The topographic map was produced from aerial photography with 1-foot contour lines.Contour lines in heavily vegetated areas where the ground was not visible were estimatedin accordance with standard mapping procedures.
4.3 Geotechnical Exploration4.3.1 IntroductionA geotechnical exploration was performed for the Matheson Site to determine the lateraland vertical extent of the pyritic material at the site for input to the remedial design.
ROD/011770002.DOC (CAH979.DOC)
!- i ; ' / r*1 ''-7vY,j>:".':'*" t__ X,'v i"' ""X.'i"1-
SCALE 1"=100'
FIGURE 3PROPERTY BOUNDARYS
DATA EVALUATION REPORTEXISTING CONDITIONS AT
IRON MOUNTAIN MINEMATHESON SITE
mathesonlO.dlv
DATA EVALUATION REPORTEXISTING CONDITIONS AT IRON MOUNTAIN MINE
_______________________________________________________________MATHESONSITE
The purpose of the exploration was to evaluate surface and subsurface conditions at the siteand to provide recommendations for remedial design activities. To accomplish this, thescope of work included the following:
1. Evaluation of previous investigations by MK for SMC in 1994, USBR in 1995, andhistorical records of the site.
2. Field exploration including a site reconnaissance and a subsurface investigation.
3. Preparation of a report summarizing the investigation and the resultingrecommendations.
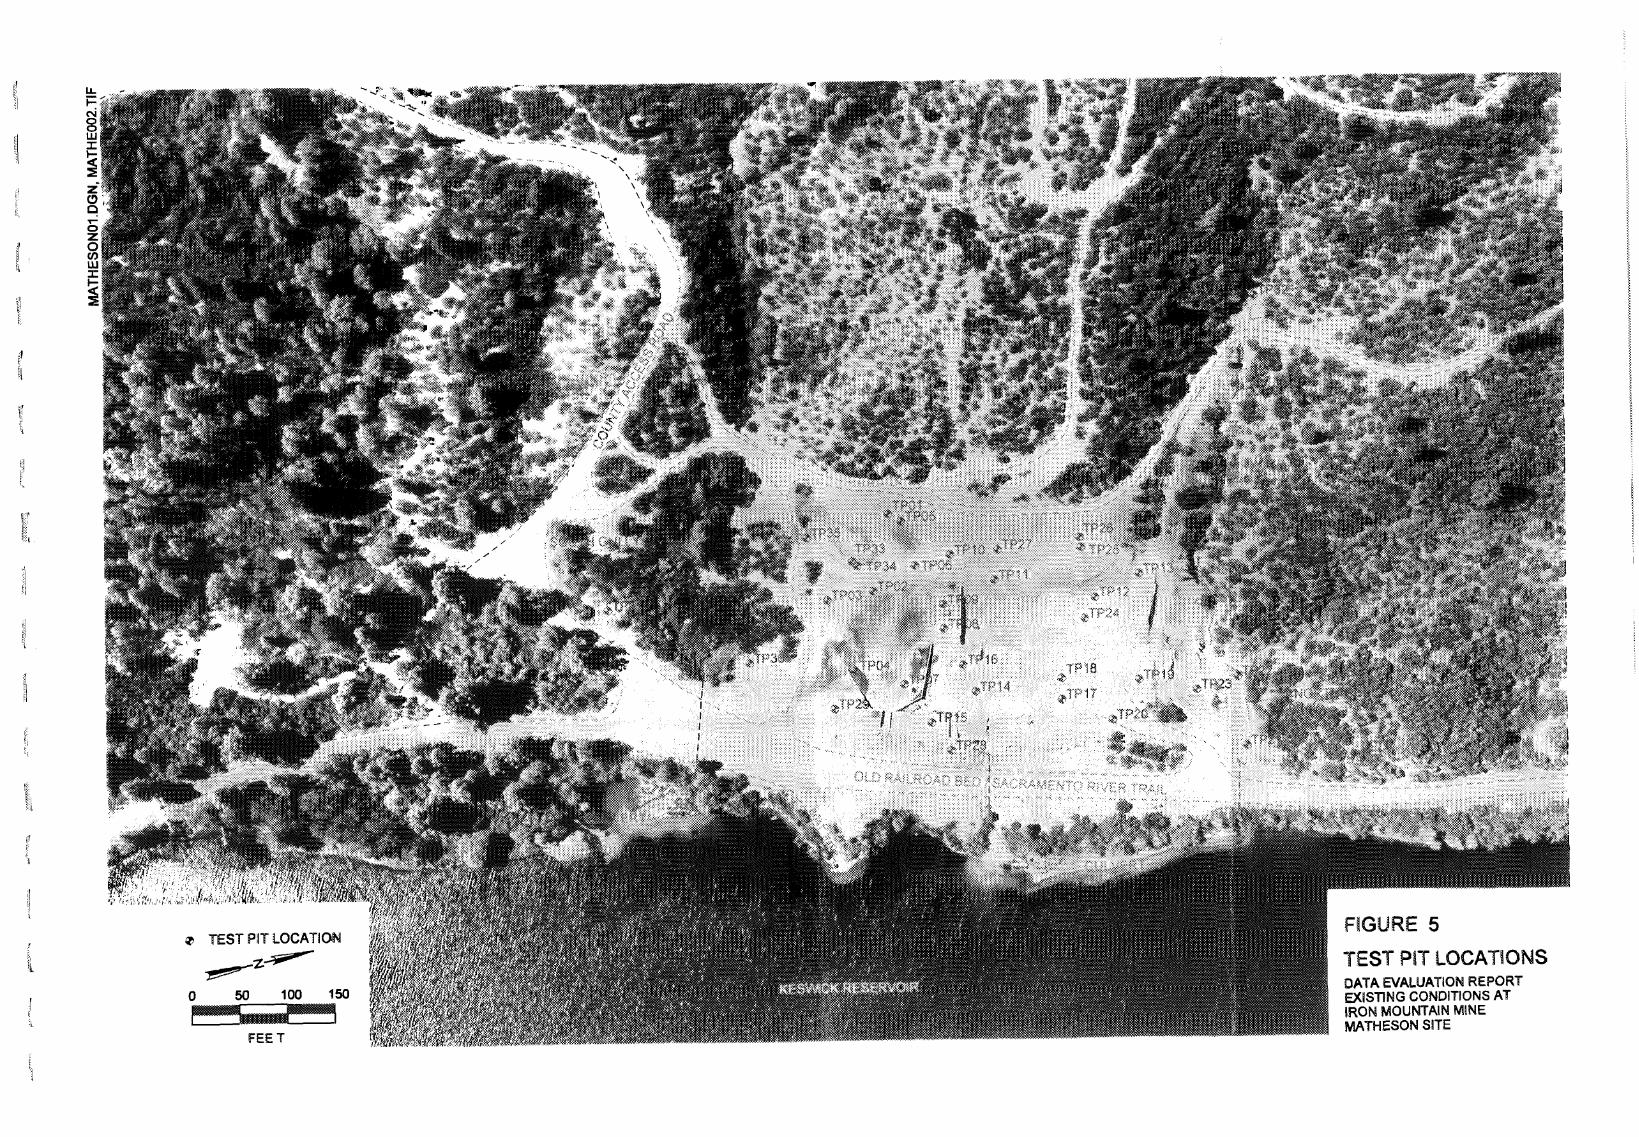
4.3.2 Field InvestigationBetween April 24 and April 27,2001, CH2M HILL excavated 35 test pits throughout theMatheson Site to assist in characterizing the location, extent, and variation of pyritic wastematerials at the site. The test pits ranged in depth from 0.5 foot to 14 feet and were exca-vated with a Daewoo DH180 hydraulic excavator capable of excavating to a depth of 20 feetand fitted with a 2-foot-wide bucket. The test pit locations are shown on Figure 5.
Grab samples of the soil along the sidewalls of the test pits were collected at selected depthsfor use in laboratory testing. Typically, one soil sample was collected from each test pit. Ifthe test pit was shallow or if the excavated spoil material appeared to contain no pyriticwaste, a sample was not collected. In test pits where two distinct stratigraphic layers wereobserved, one sample was collected from each layer.
The purpose of the field investigation was to characterize the existing location, extent, andvariation of the pyritic waste materials on the site and supplement the information fromprevious investigations. The field investigation was supervised by CH2M HILL staffengineers who selected test pit and sampling locations, logged the test pits, and collectedsoil samples. Once soil samples were collected and the test pit was logged and photo-graphed, the test pit was backfilled with the excavated material. Test pit locations werestaked and surveyed using the Global Positioning System (GPS) according to the NAD27coordinate system. A table presenting the Northings, Eastings, and elevations for the centerof each test pit is included with the test pit logs in Appendix C.
4.3.3 Observed Soil and Groundwater ConditionsThe ore bunkers, tram terminal, and conveyance structures form the loading area andoccupy an area of approximately 400 by 300 feet (nearly 3 acres in area). Historical propertymaps show that other structures existed south of the loading area. Most of these structureshave been removed, except for the remains of concrete debris, and vegetation has over-grown these areas. Most of the Matheson Site is devoid of vegetation and contrasts sharplywith the surrounding area (Figure 6). The terraced appearance of exposed bedrock suggeststhat the topography is the result of earthwork rather than original topography. Roundedcobbles in the southwestern portion of the site suggest a small creek originally flowedthrough the site.
RDD/011770002.DOC (CAH979.DOC)
9 TEST PIT LOCATION
2
FEET
TEST PIT LOCATIONSDATA EVALUATION REPORTEXISTING CONDITIONS ATIRON MOUNTAIN MINEMATHESON SITE
DATA EVALUATION REPORTEXISTING CONDITIONS AT IRON MOUNTAIN MINE
MATHESON SITE
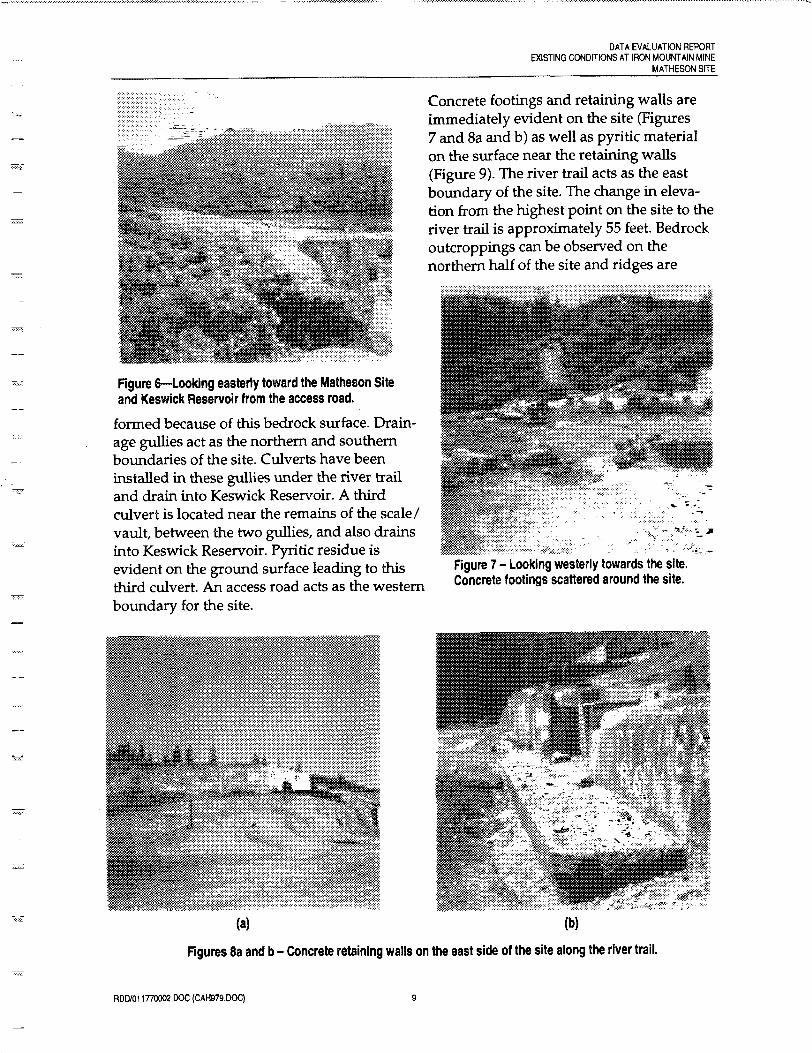
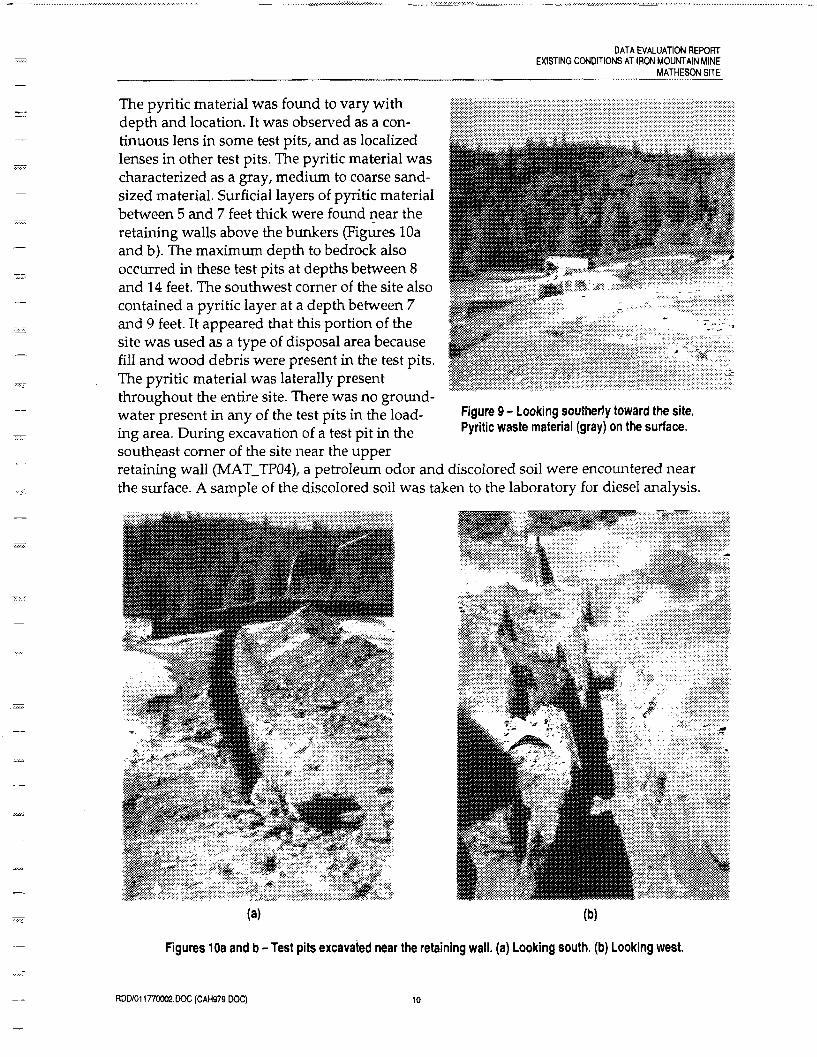
Concrete footings and retaining walls areimmediately evident on the site (Figures7 and 8a and b) as well as pyritic materialon the surface near the retaining walls(Figure 9). The river trail acts as the eastboundary of the site. The change in eleva-tion from the highest point on the site to theriver trail is approximately 55 feet. Bedrockoutcroppings can be observed on thenorthern half of the site and ridges are
Figure 6—Looking easterly toward the Matheson Siteand Keswick Reservoir from the access road.
formed because of this bedrock surface. Drain-age gullies act as the northern and southernboundaries of the site. Culverts have beeninstalled in these gullies under the river trailand drain into Keswick Reservoir. A thirdculvert is located near the remains of the scale/vault, between the two gullies, and also drainsinto Keswick Reservoir. Pyritic residue isevident on the ground surface leading to thisthird culvert. An access road acts as the westernboundary for the site.
Figure 7 - Looking westerly towards the site.Concrete footings scattered around the site.
Figures 8a and b - Concrete retaining walls on the east side of the site along the river trail.
RDD/011770002 DOC (CAH979.DOC)
DATA EVALUATION REPORTEXISTING CONDITIONS AT IRON MOUNTAIN MINE
MATHESON SITE
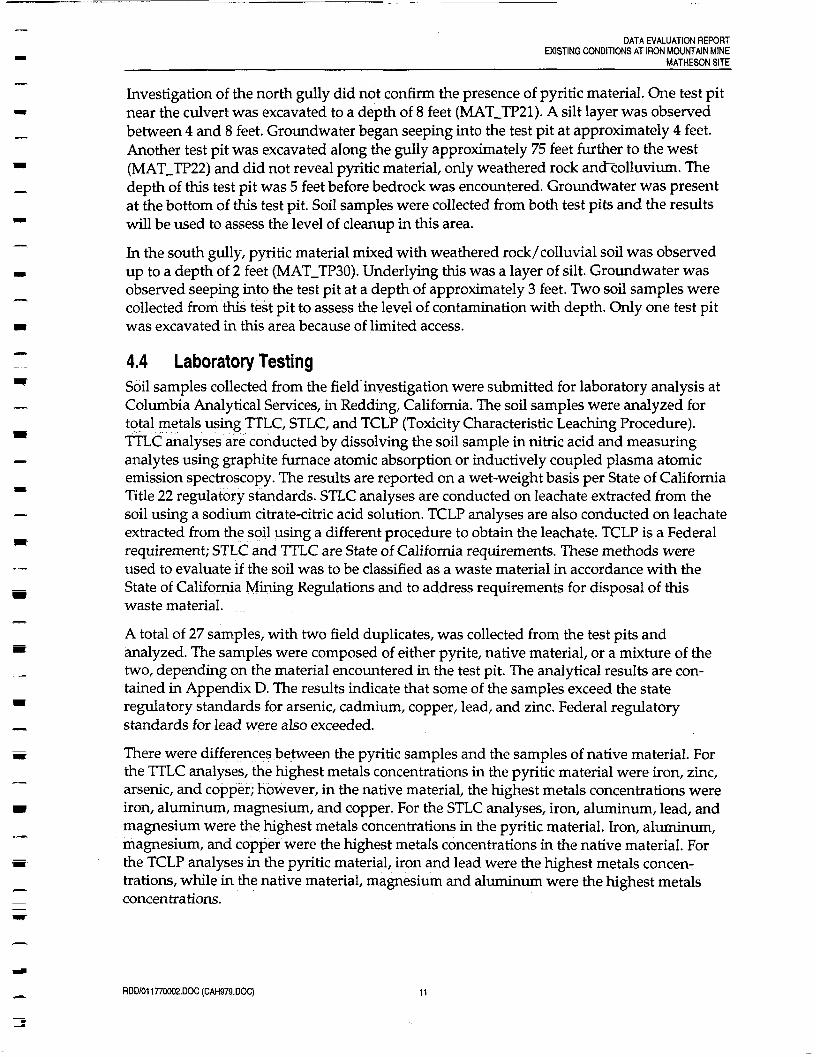
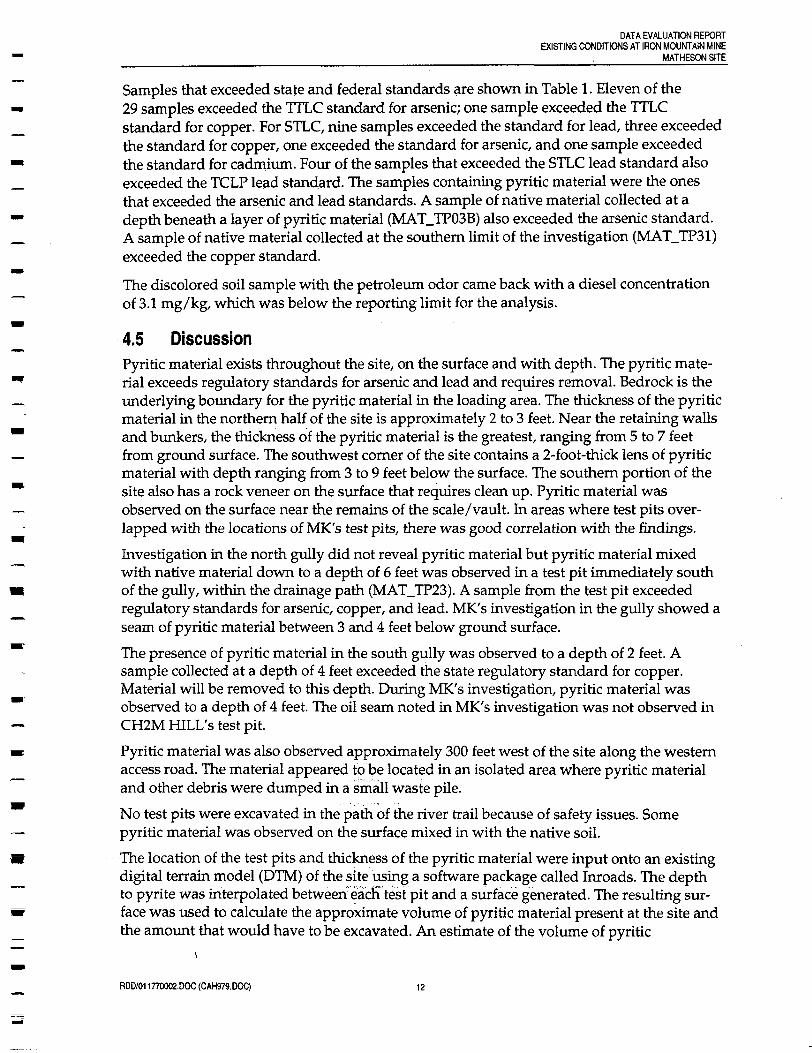
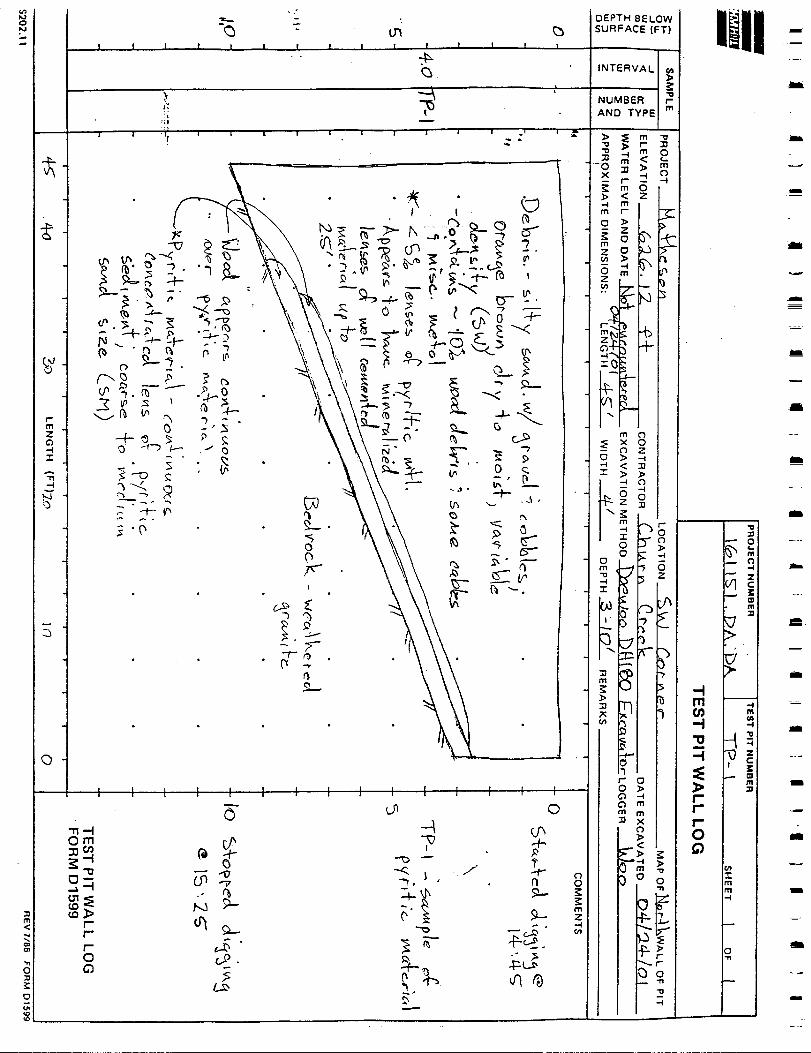
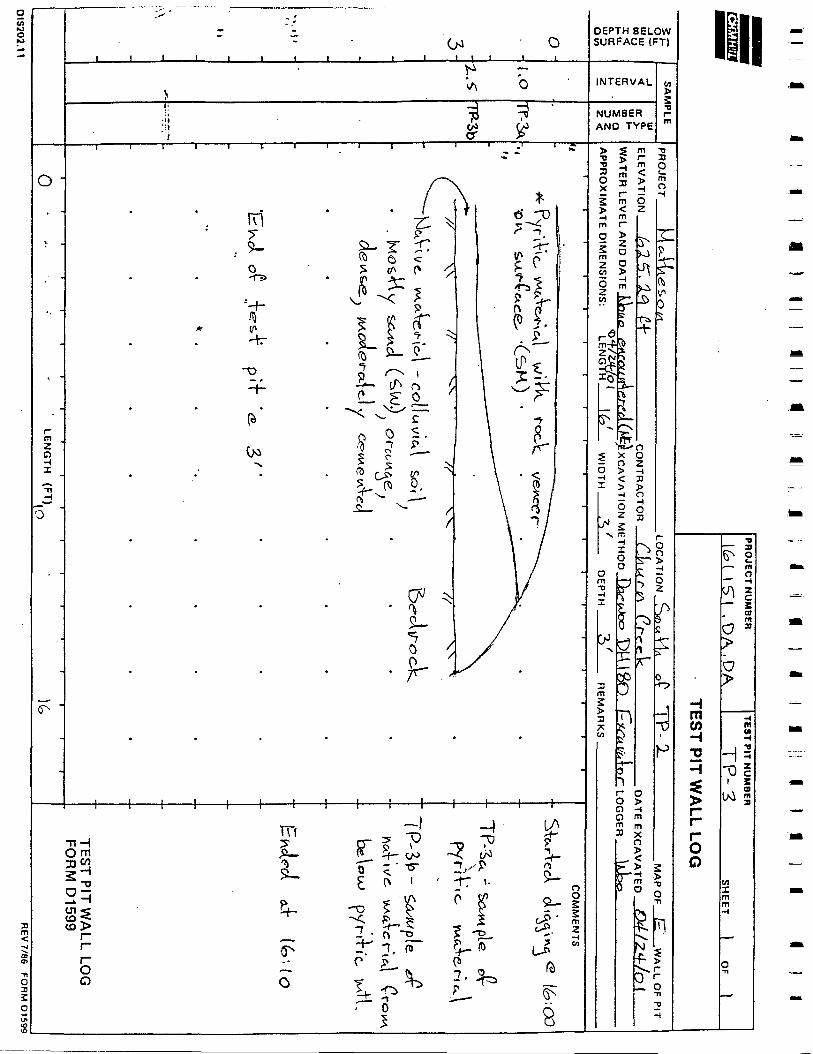
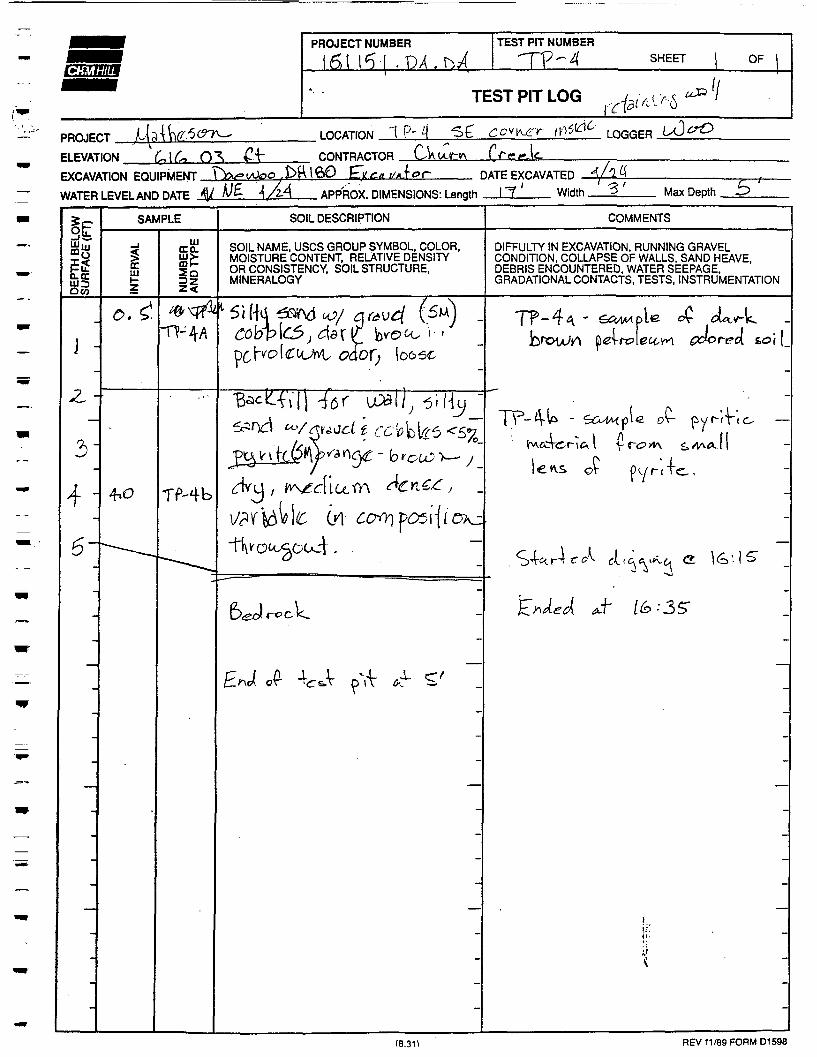
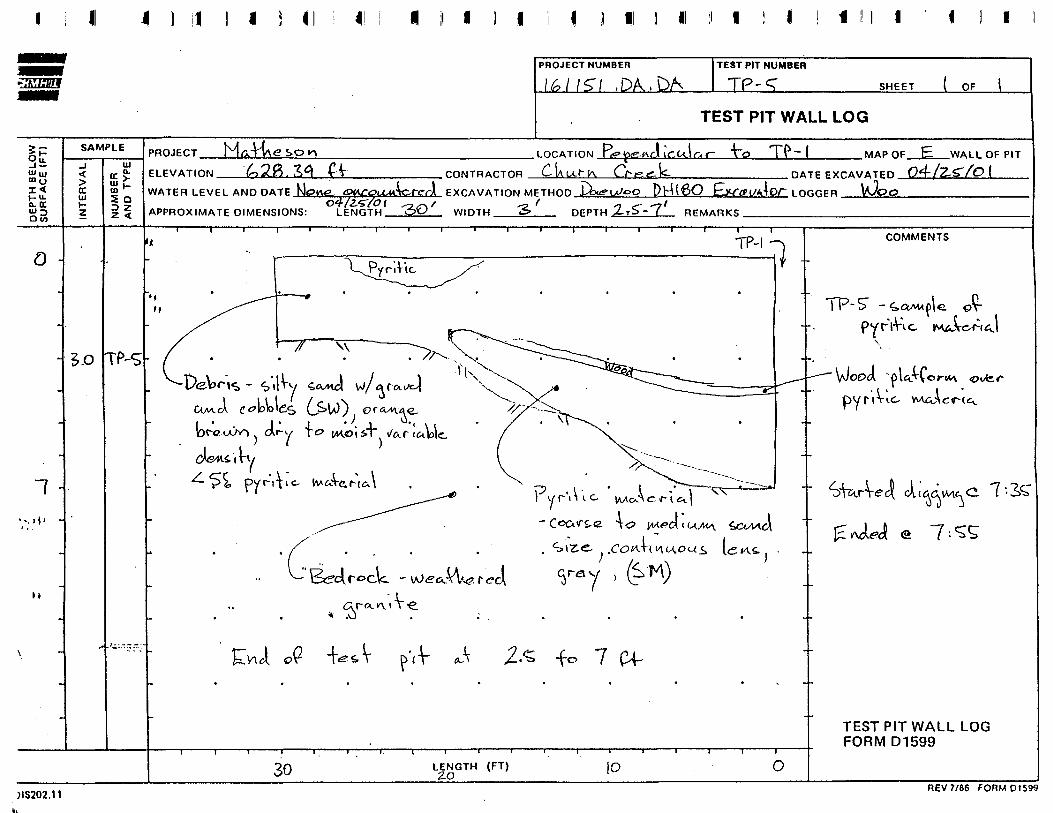
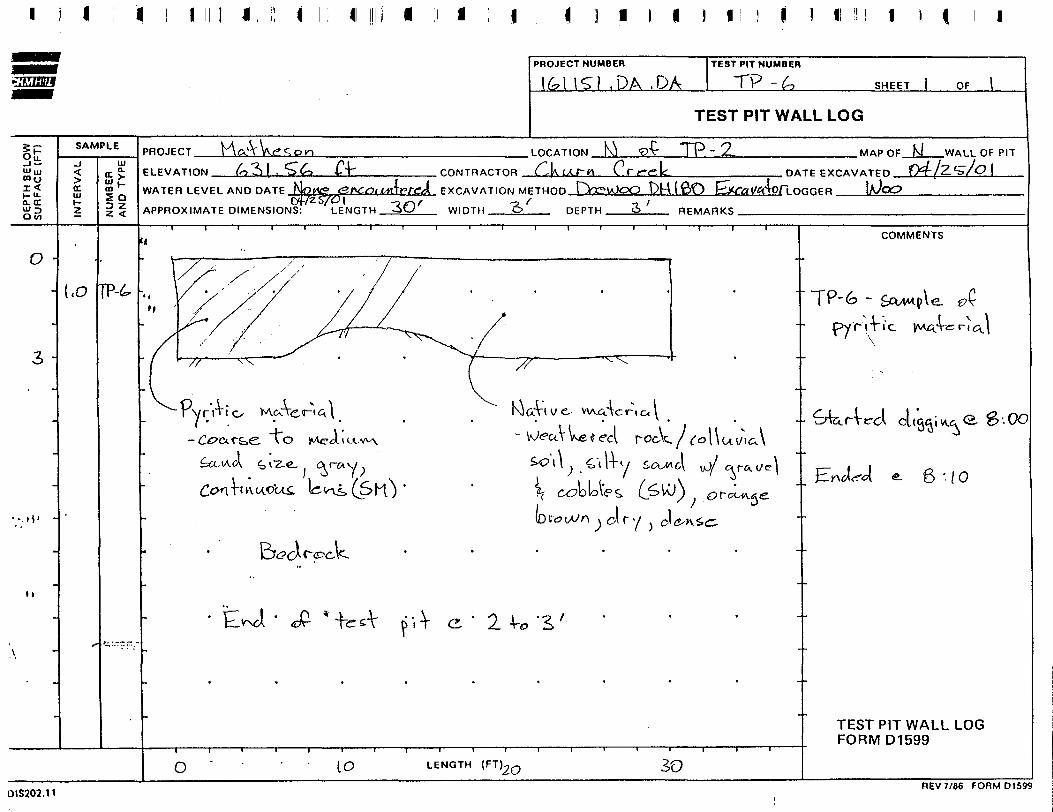
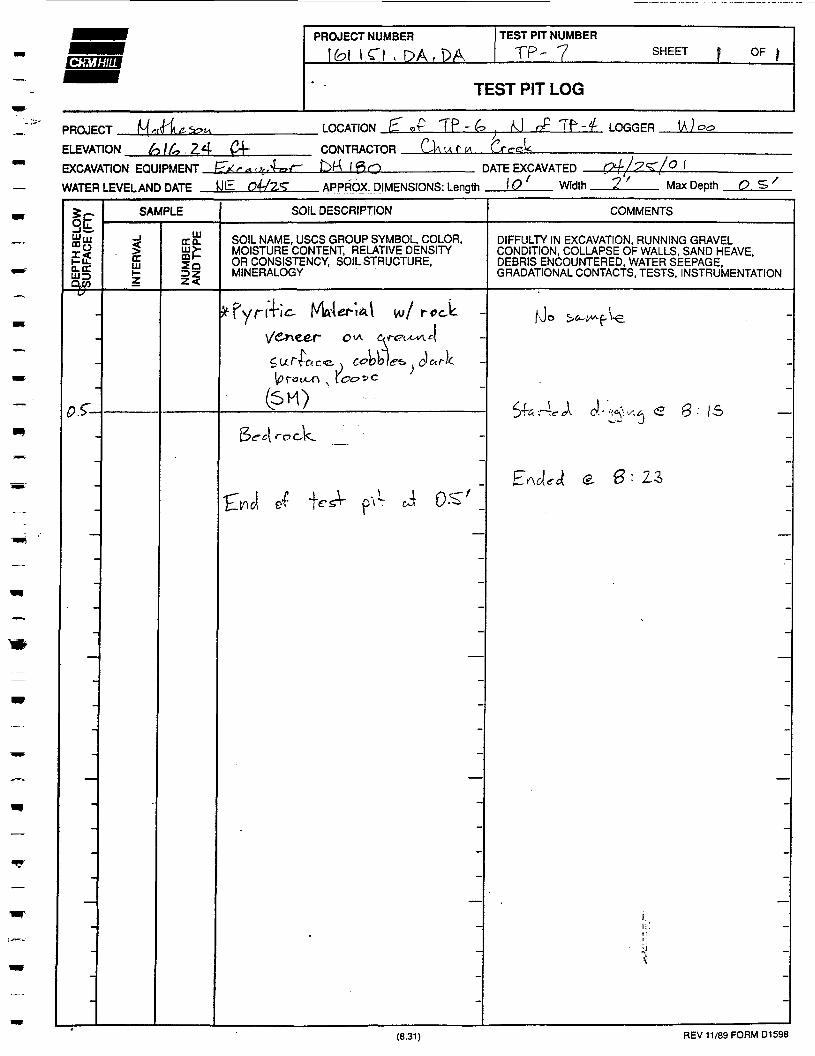
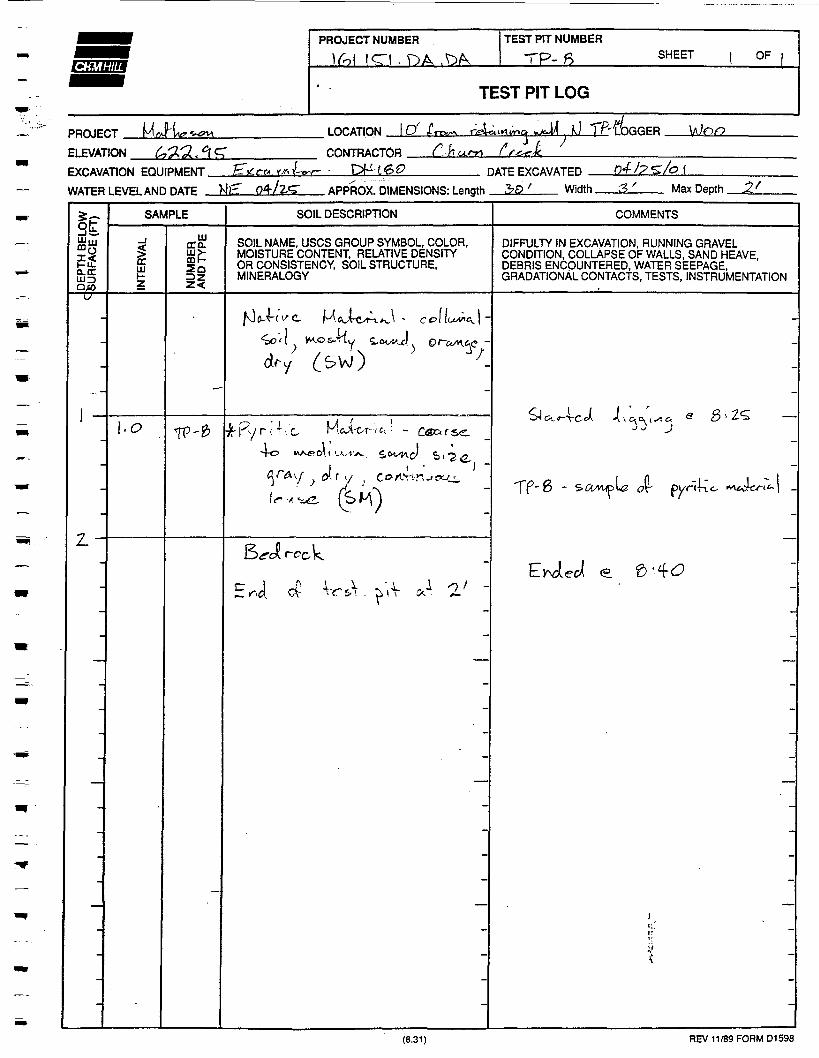
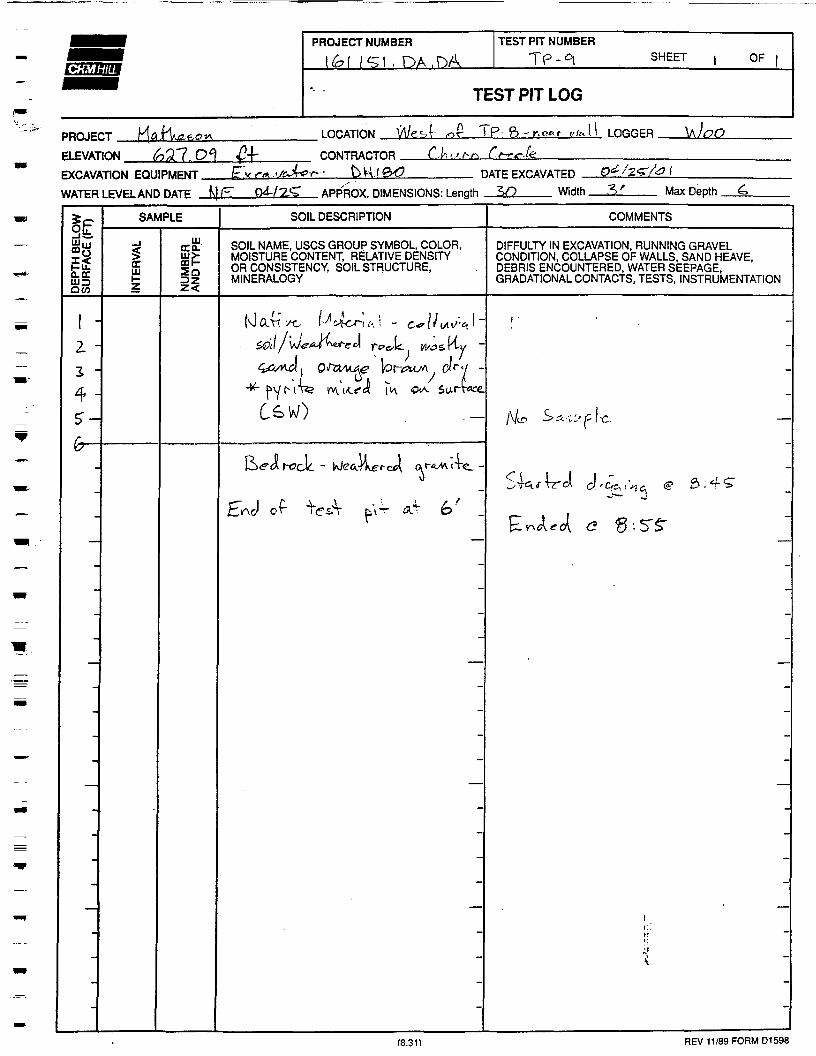
The pyritic material was found to vary withdepth and location. It was observed as a con-tinuous lens in some test pits, and as localizedlenses in other test pits. The pyritic material wascharacterized as a gray, medium to coarse sand-sized material. Surficial layers of pyritic materialbetween 5 and 7 feet thick were found near theretaining walls above the bunkers (Figures lOaand b). The maximum depth to bedrock alsooccurred in these test pits at depths between 8and 14 feet. The southwest corner of the site alsocontained a pyritic layer at a depth between 7and 9 feet. It appeared that this portion of thesite was used as a type of disposal area becausefill and wood debris were present in the test pits.The pyritic material was laterally presentthroughout the entire site. There was no ground-water present in any of the test pits in the load-ing area. During excavation of a test pit in thesoutheast corner of the site near the upperretaining wall (MAT_TP04), a petroleum odor and discolored soil were encountered nearthe surface. A sample of the discolored soil was taken to the laboratory for diesel analysis.
Figure 9 - Looking southerly toward the site.Pyritic waste material (gray) on the surface.
Figures 10a and b - Test pits excavated near the retaining wall, (a) Looking south, (b) Looking west.
RDD/011770002.DOC (CAH979.DOC) 10
DATA EVALUATION REPORTEXISTING CONDITIONS AT IRON MOUNTAIN MINE
MATHESONSITE
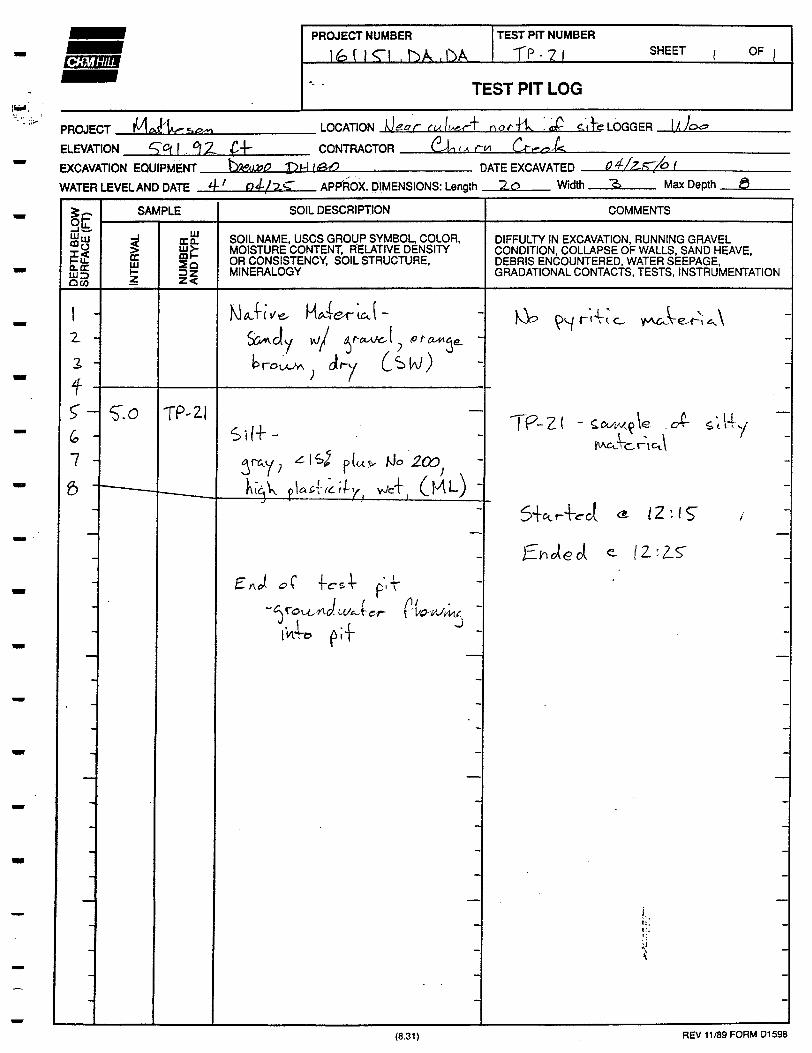
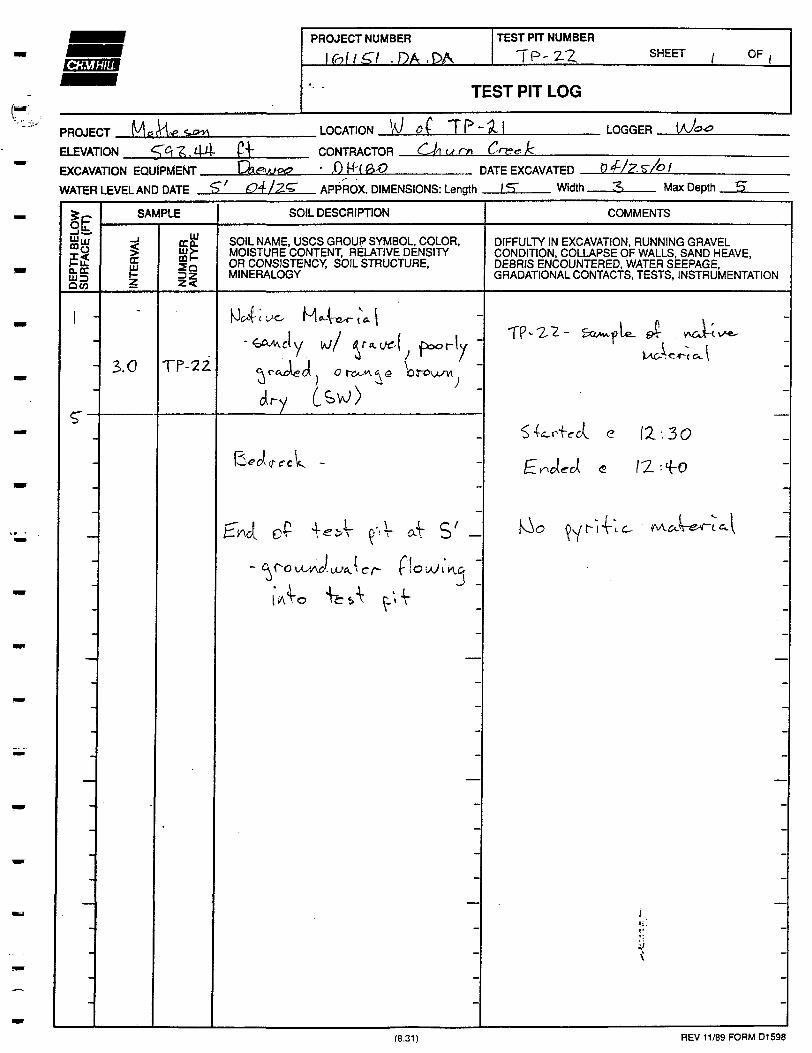
Investigation of the north gully did not confirm the presence of pyritic material. One test pitnear the culvert was excavated to a depth of 8 feet (MATJTP21). A silt layer was observedbetween 4 and 8 feet. Groundwater began seeping into the test pit at approximately 4 feet.Another test pit was excavated along the gully approximately 75 feet further to the west(MAT_TP22) and did not reveal pyritic material, only weathered rock ancTcolluvium. Thedepth of this test pit was 5 feet before bedrock was encountered. Groundwater was presentat the bottom of this test pit. Soil samples were collected from both test pits and the resultswill be used to assess the level of cleanup in this area.
In the south gully/ pyritic material mixed with weathered rock/colluvial soil was observedup to a depth of 2 feet (MAT_TP30). Underlying this was a layer of silt. Groundwater wasobserved seeping into the test pit at a depth of approximately 3 feet. Two soil samples werecollected from this test pit to assess the level of contamination with depth. Only one test pitwas excavated in this area because of limited access.
4.4 Laboratory TestingSoil samples collected from the field investigation were submitted for laboratory analysis atColumbia Analytical Services, in Redding, California. The soil samples were analyzed fortotal metals using TTLC, STLC, and TCLP (Toxicity Characteristic Leaching Procedure).TTLC analyses are conducted by dissolving the soil sample in nitric acid and measuringanalytes using graphite furnace atomic absorption or inductively coupled plasma atomicemission spectroscopy. The results are reported on a wet-weight basis per State of CaliforniaTitle 22 regulatory standards. STLC analyses are conducted on leachate extracted from thesoil using a sodium citrate-citric acid solution. TCLP analyses are also conducted on leachateextracted from the soil using a different procedure to obtain the leachate. TCLP is a Federalrequirement; STLC and TTLC are State of California requirements. These methods wereused to evaluate if the soil was to be classified as a waste material in accordance with theState of California Mining Regulations and to address requirements for disposal of thiswaste material.
A total of 27 samples, with two field duplicates, was collected from the test pits andanalyzed. The samples were composed of either pyrite, native material, or a mixture of thetwo, depending on the material encountered in the test pit. The analytical results are con-tained in Appendix D. The results indicate that some of the samples exceed the stateregulatory standards for arsenic, cadmium, copper, lead, and zinc. Federal regulatorystandards for lead were also exceeded.
There were differences between the pyritic samples and the samples of native material. Forthe TTLC analyses, the highest metals concentrations in the pyritic material were iron, zinc,arsenic, and copper; however, in the native material, the highest metals concentrations wereiron, aluminum, magnesium, and copper. For the STLC analyses, iron, aluminum, lead, andmagnesium were the highest metals concentrations in the pyritic material. Iron, aluminum,magnesium, and copper were the highest metals concentrations in the native material. Forthe TCLP analyses in the pyritic material, iron and lead were the highest metals concen-trations, while in the native material, magnesium and aluminum were the highest metalsconcentrations.
RDD/011770002.DOC (CAH979.DOC)
DATA EVALUATION REPORTEXISTING CONDITIONS AT IRON MOUNTAIN MINE
MATHESONSITE
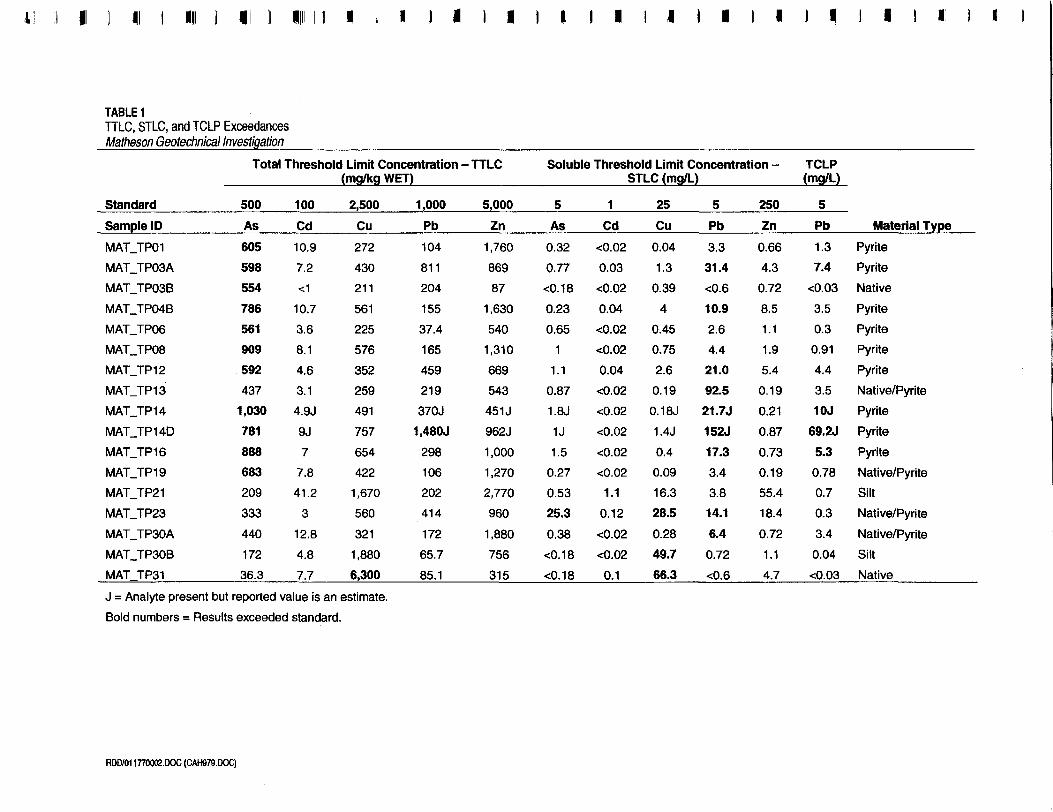
Samples that exceeded state and federal standards are shown in Table 1. Eleven of the29 samples exceeded the TTLC standard for arsenic; one sample exceeded the TTLCstandard for copper. For STLC, nine samples exceeded the standard for lead, three exceededthe standard for copper, one exceeded the standard for arsenic, and one sample exceededthe standard for cadmium. Four of the samples that exceeded the STLC lead standard alsoexceeded the TCLP lead standard. The samples containing pyritic material were the onesthat exceeded the arsenic and lead standards. A sample of native material collected at adepth beneath a layer of pyritic material (MAT_TP03B) also exceeded the arsenic standard.A sample of native material collected at the southern limit of the investigation (MAT_TP31)exceeded the copper standard.
The discolored soil sample with the petroleum odor came back with a diesel concentrationof 3.1 mg/kg, which was below the reporting limit for the analysis.
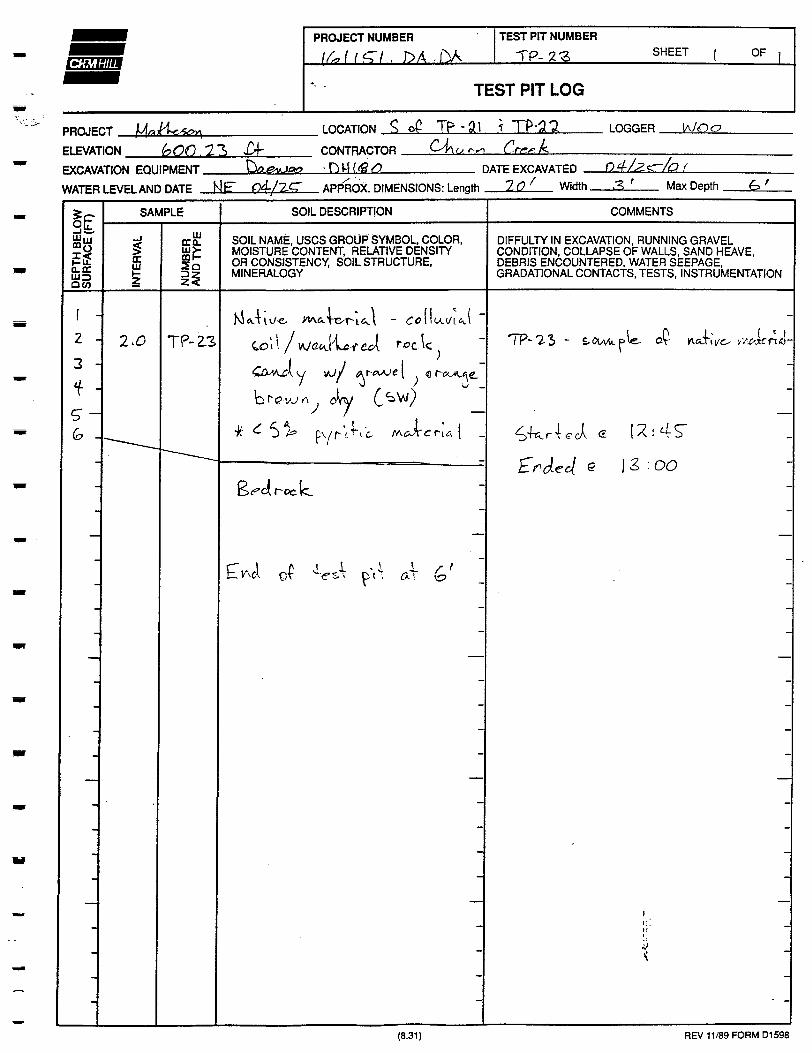
4.5 DiscussionPyritic material exists throughout the site, on the surface and with depth. The pyritic mate-rial exceeds regulatory standards for arsenic and lead and requires removal. Bedrock is theunderlying boundary for the pyritic material in the loading area. The thickness of the pyriticmaterial in the northern half of the site is approximately 2 to 3 feet. Near the retaining wallsand bunkers, the thickness of the pyritic material is the greatest, ranging from 5 to 7 feetfrom ground surface. The southwest corner of the site contains a 2-foot-thick lens of pyriticmaterial with depth ranging from 3 to 9 feet below the surface. The southern portion of thesite also has a rock veneer on the surface that requires clean up. Pyritic material wasobserved on the surface near the remains of the scale/vault. In areas where test pits over-lapped with the locations of MK's test pits, there was good correlation with the findings.Investigation in the north gully did not reveal pyritic material but pyritic material mixedwith native material down to a depth of 6 feet was observed in a test pit immediately southof the gully, within the drainage path (MAT_TP23). A sample from the test pit exceededregulatory standards for arsenic, copper, and lead. MK's investigation in the gully showed aseam of pyritic material between 3 and 4 feet below ground surface.The presence of pyritic material in the south gully was observed to a depth of 2 feet. Asample collected at a depth of 4 feet exceeded the state regulatory standard for copper.Material will be removed to this depth. During MK's investigation, pyritic material wasobserved to a depth of 4 feet. The oil seam noted in MK's investigation was not observed inCH2M HILL'S test pit.
Pyritic material was also observed approximately 300 feet west of the site along the westernaccess road. The material appeared to be located in an isolated area where pyritic materialand other debris were dumped in a small waste pile.No test pits were excavated in the path of the river trail because of safety issues. Somepyritic material was observed on the surface mixed in with the native soil.The location of the test pits and thickness of the pyritic material were input onto an existingdigital terrain model (DTM) of the site using a software package called Inroads. The depthto pyrite was interpolated between each test pit and a surface generated. The resulting sur-face was used to calculate the approximate volume of pyritic material present at the site andthe amount that would have to be excavated. An estimate of the volume of pyritic
RDD/011770002.DOC (CAH979.DOC) 12
I!! • I I I I I I I!
TABLE 1TTLC, STLC, and TCLP ExceedancesMatheson Geotechnical Investigation
Total Threshold Limit Concentration -(mg/kg WET)
StandardSample IDMAT_TP01MAT_TP03A
MAT_TP03BMAT_TP04B
MAT_TP06
MAT_TP08MAT_TP12
MAT_TP13
MAT_TP14MAT_TP14D
MAT_TP16MATJP19MAT_TP21
MAT_TP23MAT_TP30AMAT_TP30B
MAT TP31
500
As
605598554
786561
909592437
1,030781888683209
333
440
172
36.3
100
Cd
10.97.2<1
10.7
3.6
8.1
4.6
3.1
4.9J
9J
7
7.8
41.2
3
12.8
4.8
7.7
2,500
Cu
272
430
211
561
225
576
352
259
491
757
654
422
1,670
560
321
1,880
6,300
1,000
Pb104
811204
155
37.4
165
459
219
370J
1.480J
298106202
414
172
65.7
85.1
•TTLC
5,000
Zn1,760
869
87
1,630
540
1,310
669
543
451 J
962J
1,000
1,270
2,770
960
1,880
756
315
Soluble Threshold Limit Concentration -STLC (mg/L)
5As
0.32
0.77
<0.18
0.23
0.65
1
1.1
0.87
1.8J
U
1.5
0.27
0.53
25.30.38<0.18
<0.18
1
Cd<0.02
0.03<0.02
0.04
<0.02<0.02
0.04
<0.02
<0.02
<0.02
<0.02
<0.02
1.1
0.12
<0.02
<0.02
0.1
25
Cu
0.04
1.3
0.394
0.45
0.75
2.6
0.190.18J
1.4J
0.4
0.09
16.3
28.5
0.2849.7
66.3
5
Pb3.3
31.4
<0.610.9
2.64.421.0
92.5
21 .7J
152J
17.33.4
3.8
14.1
6.4
0.72
<0.6
250
Zn
0.664.3
0.72
8.5
1.1
1.9
5.4
0.19
0.210.87
0.73
0.19
55.4
18.4
0.72
1.1
4.7
TCLP(mg/L)
5Pb1.37.4
<0.03
3.5
0.3
0.91
4.4
3.5
10J69.2J5.30.78
0.7
0.3
3.4
0.04
<0.03
Material TypePyritePyriteNativePyritePyritePyritePyriteNative/PyritePyritePyritePyriteNative/PyriteSiltNative/PyriteNative/PyriteSiltNative
J = Analyte present but reported value is an estimate.Bold numbers = Results exceeded standard.
RDD/011770002.DOC (CAH979.DOC)
DATA EVALUATION REPORTEXISTING CONDITIONS AT IRON MOUNTAIN MINE
MATHESON SITE
material that would have to be excavated is approximately 13,000 cubic yards within theboundaries of the test pits. Additional material may have to be removed outside theseboundaries within the south gulley, railroad bed, or along Keswick Reservoir. Theseadditional items will be addressed it the Preliminary Design Report.
4.6 Site Reconnaissance Visit and FindingsObservations made during site reconnaissance visits to the Matheson Site on April 26, 2001,June 15, 2001, and June 21, 2001, are provided below. The site visit reports are included asAppendix E.
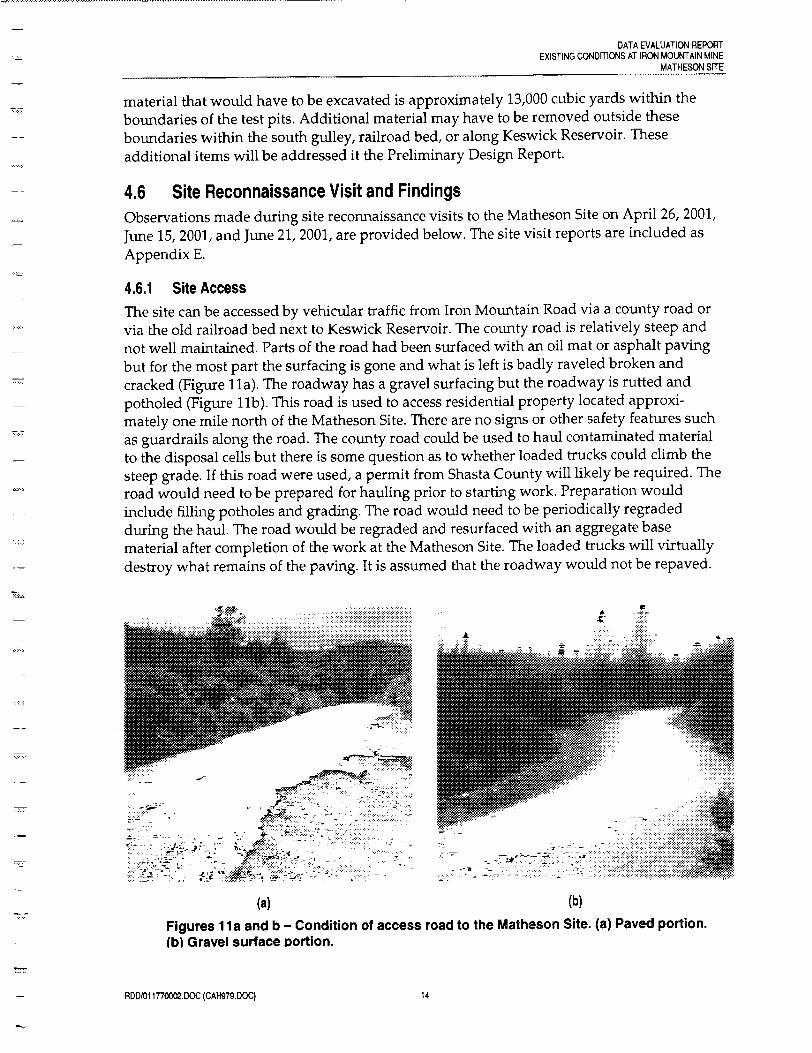
4.6.1 Site AccessThe site can be accessed by vehicular traffic from Iron Mountain Road via a county road orvia the old railroad bed next to Keswick Reservoir. The county road is relatively steep andnot well mamtained. Parts of the road had been surfaced with an oil mat or asphalt pavingbut for the most part the surfacing is gone and what is left is badly raveled broken andcracked (Figure 11 a). The roadway has a gravel surfacing but the roadway is rutted andpotholed (Figure lib). This road is used to access residential property located approxi-mately one mile north of the Matheson Site. There are no signs or other safety features suchas guardrails along the road. The county road could be used to haul contaminated materialto the disposal cells but there is some question as to whether loaded trucks could climb thesteep grade. If this road were used, a permit from Shasta County will likely be required. Theroad would need to be prepared for hauling prior to starting work. Preparation wouldinclude filling potholes and grading. The road would need to be periodically regradedduring the haul. The road would be regraded and resurfaced with an aggregate basematerial after completion of the work at the Matheson Site. The loaded trucks will virtuallydestroy what remains of the paving. It is assumed that the roadway would not be repaved.
(a) (b)Figures 11 a and b - Condition of access road to the Matheson Site, (a) Paved portion,(b) Gravel surface portion.
RDD/011770002.DOC (CAH979.DOC) 14
DATA EVALUATION REPORTEXISTING CONDITIONS AT IRON MOUNTAIN MINE
MATHESON SITE
The railroad bed can be accessed at the Keswick Reservoir boat launch located approxi-mately 3.1 miles south of the site. The railroad bed is being converted to a hiking/equestriantrail by BLM. It was recently gravel-surfaced from the boat launch to a gate locatedapproximately 500 feet south of the Matheson Site. The new surfacing included a 10-foot-wide, 6-inch-thick layer of 3/8-minus crushed rock. If the railroad bed is used for truck andequipment access to and from the site, then it would need to be regraded and resurfacedafter the completion of the Matheson Site restoration. It is recommended that the river trailbe used only if it is determined that the loaded trucks cannot climb the steep grade of thecounty road to Iron Mountain Road.
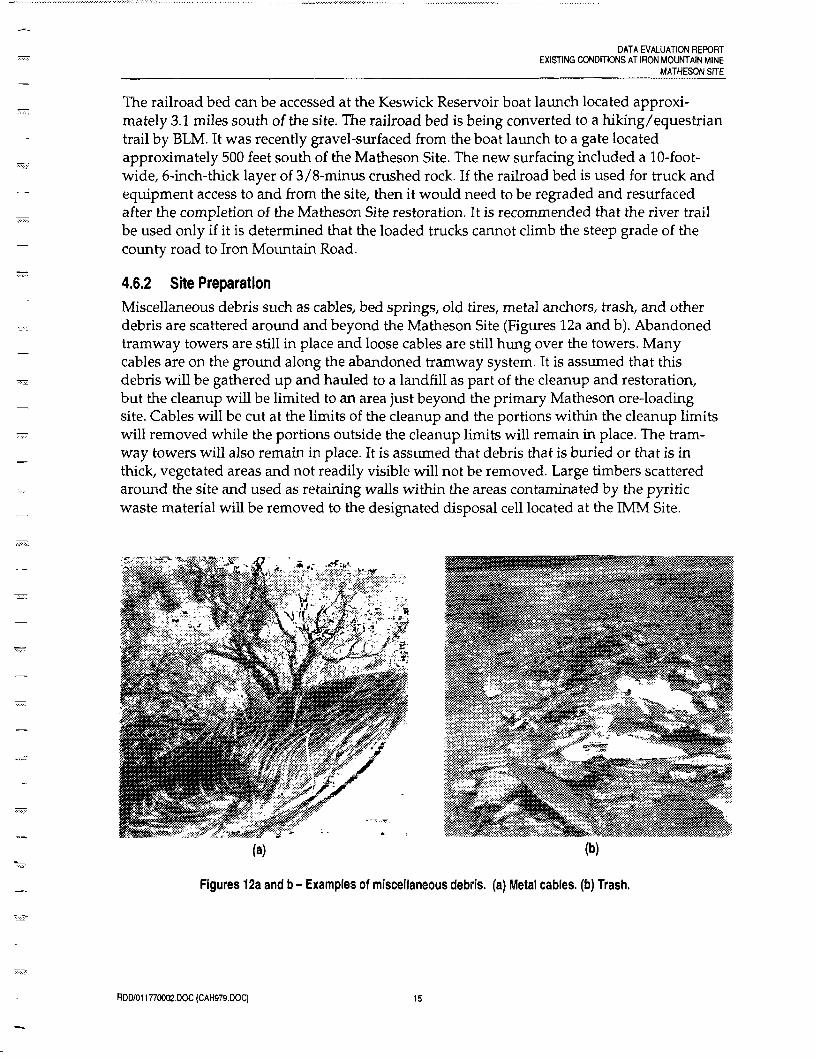
4.6.2 Site PreparationMiscellaneous debris such as cables, bed springs, old tires, metal anchors, trash, and otherdebris are scattered around and beyond the Matheson Site (Figures 12a and b). Abandonedtramway towers are still in place and loose cables are still hung over the towers. Manycables are on the ground along the abandoned tramway system. It is assumed that thisdebris will be gathered up and hauled to a landfill as part of the cleanup and restoration,but the cleanup will be limited to an area just beyond the primary Matheson ore-loadingsite. Cables will be cut at the limits of the cleanup and the portions within the cleanup limitswill removed while the portions outside the cleanup limits will remain in place. The tram-way towers will also remain in place. It is assumed that debris that is buried or that is inthick, vegetated areas and not readily visible will not be removed. Large timbers scatteredaround the site and used as retaining walls within the areas contaminated by the pyriticwaste material will be removed to the designated disposal cell located at the IMM Site.
(a) (b)
Figures 12a and b - Examples of miscellaneous debris, (a) Metal cables, (b) Trash.
RDD/011770002.DOC (CAH979.DOC) 15
DATA EVALUATION REPORTEXISTING CONDITIONS AT IRON MOUNTAIN MINE
MATHESONSITE
Concrete retaining walls, vaults, and other concrete structures will be demolished anddisposed of onsite. The south gully appears to be a potential site for a concrete disposal celland should have the required storage. Other areas near the Matheson Site were consideredbut have a limited area or are located on steep slopes. The existing culvert crossing the rivertrail would need to be extended to develop the south gully as a disposal cell. Vegetation andpyritic waste material will be removed. Clean soil could be excavated and stockpiled forlater use for the cap material over the concrete disposal cell. Railroad ties are exposed insome locations along the river trail. It appears that rails were previously removed. It isassumed that the railroad ties will be removed. Those in the pyritic waste areas will beremoved to the disposal area on the IMM Site; those in clean soils will be salvaged ordisposed of in an approved offsite landfill.
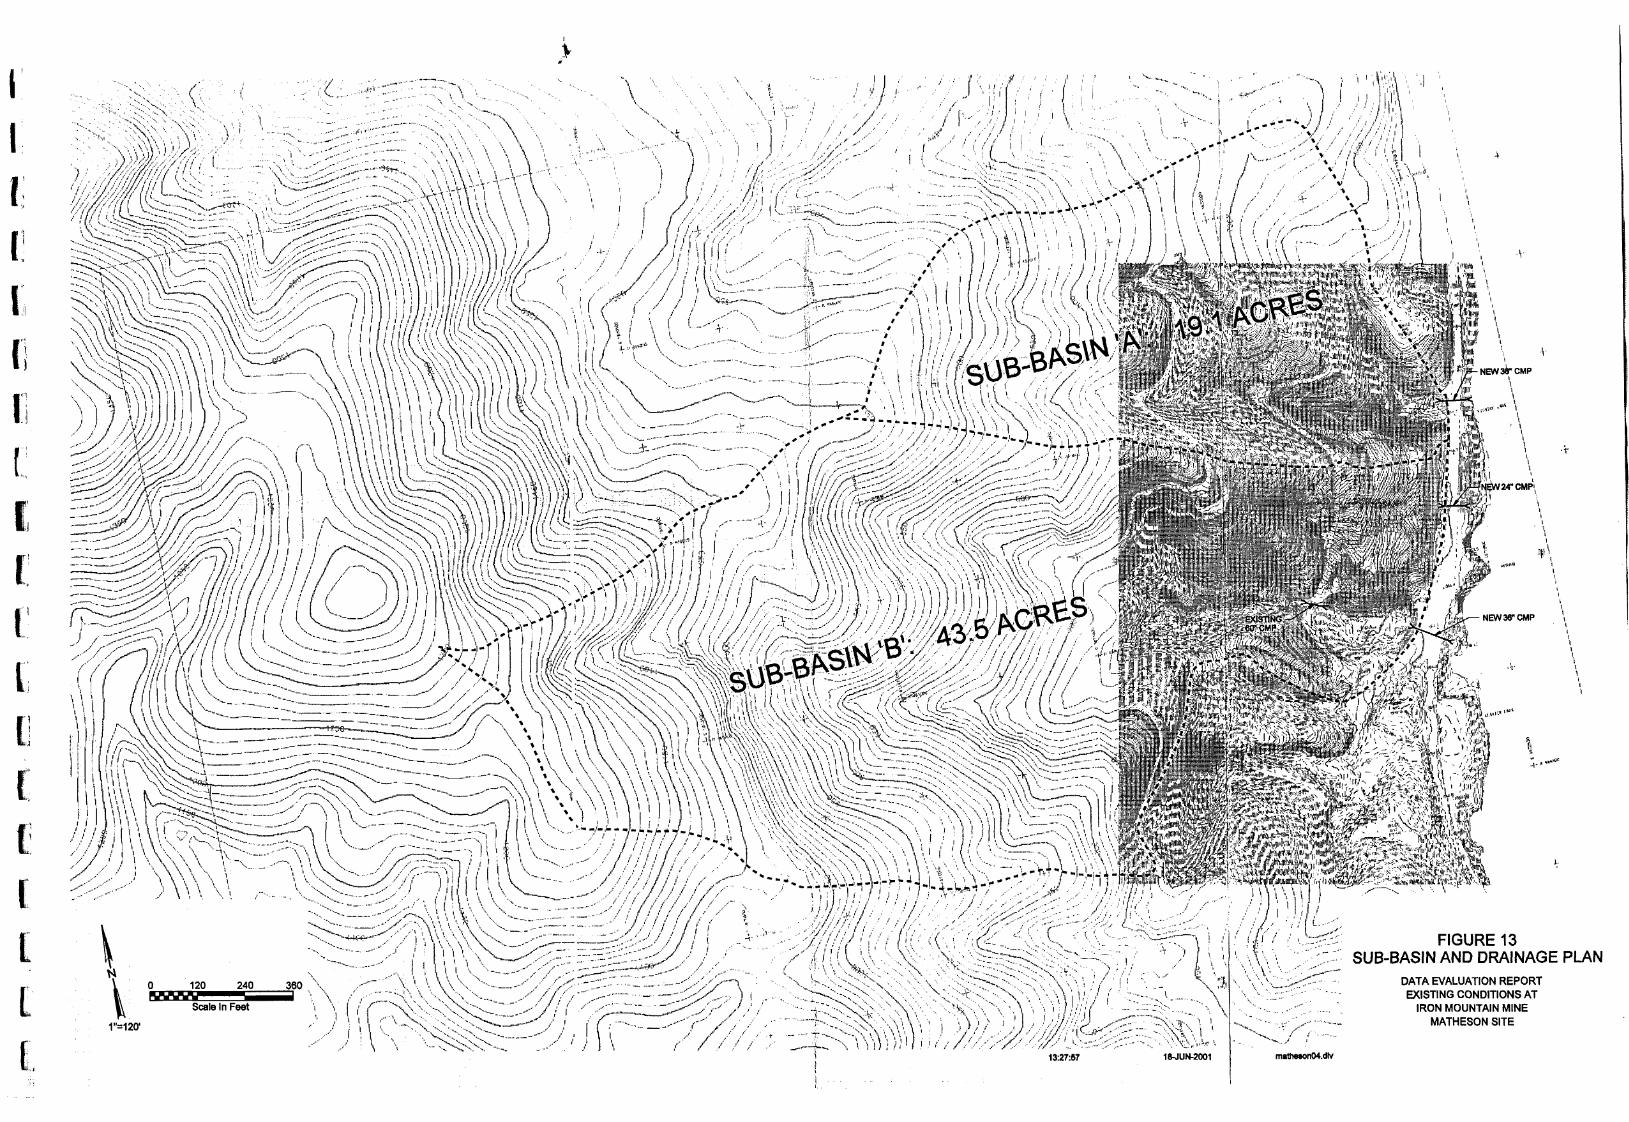
4.6.3 HydrologyThe Matheson Site is approximately 3 acres in area. The site drains to one of two drainagebasins. The north drainage basin contains approximately 19 acres and the south drainagebasin includes about 44 acres. These watersheds drain to Keswick Reservoir as shown onFigure 13. The reservoir has a normal water surface elevation of approximately 581 feetabove mean sea level (msl). The elevation at the top of the watersheds is approximately1,250 feet above msl. Drainage is generally from west to east.
The watersheds drain in open channels until they cross beneath the railroad bed in culverts.The culvert conveying the drainage across the railroad bed on the north side of the site wasapproximately one half full of debris and silt during the initial inspection but later had beencleared. This culvert is 36 inches in diameter, made of corrugated metal pipe materials, andis in poor condition. The ends of the culvert on the south side of the Matheson Site werecovered with vegetation and were completely filled with sediment so the size and conditionare not known. Pyritic waste material was found in the drainage upstream from the culvertso it is expected that the sediments filling the culvert contain pyritic waste materials. Theculvert and the waste materials will need to be removed and the culvert replaced. The eastend of the south culvert could be below the elevation of the water surface in KeswickReservoir. Water was ponded in the area upstream from the entrance to the culvert. Thiswater could have been backup water from Keswick reservoir or caused by plugging of theculvert.
The Matheson Site is void of vegetation. The surrounding hills are covered primarily withmanzanita shrubs and scattered pine trees.
The criteria previously used for the design of drainage systems on IMM will be used to sizeculverts at the Matheson Site. No changes to the existing drainage channels upstream fromthe Matheson Site are anticipated. The drainage ditches immediately upstream from theentrance to the culverts will be cleaned of silt and debris. Any contaminated materials foundin the drainages will be hauled to the disposal cell.
The drainage ditches or the culverts along the county road to the Matheson Site wereinvestigated and, if required, will be replaced after hauling waste materials to the disposal
RDD/011770002.DOC (CAH979.DOC) 16
tt
I
L
llIMIJilipi
'S^Mfe? *imV^Mi ^aft Ai'•i$r*M •*"1&«*'™-*:YT?yi'riffll .TP'V''p5fe;.r * "'.•-. -^~---\. rk;if3'. « ',-
1"=120'
fi( ' •..b???r: FIGURE 13\ \' ,\\ \ "••;"-;.:.'"• SUB-BASIN AND DRAINAGE PLAN
' ' V' """" DATA EVALUATION REPORTEXISTING CONDITIONS AT
IRON MOUNTAIN MINEMATHESON SITE
matheson04.dlv
DATA EVALUATION REPORTEXISTING CONDITIONS AT IRON MOUNTAIN MINE
MATHESON SITE
cell on IMM. Five culverts were found along the county road. The dimensions of theculverts are listed below:
• 18-inch-diameter by 31-foot-long corrugated metal pipe (CMP)• 24-inch-diameter by 35-foot-long CMP• 24-inch-diameter by 38-foot-long CMP• 36-inch-diameter by 35-foot-long CMP• 36-inch-diameter by 35-foot-long CMP
Some of the culverts were covered with thick vegetation, but the general condition of theculverts was good, and showed little silt buildup. A sixth culvert was found along therailroad bed, approximately 140 feet south of the southernmost culvert on the MathesonSite. This 78-inch-diameter by 62-foot-long culvert was observed to be made of concrete andwas half silted up. A summary of the culvert investigation is included in a technicalmemorandum in Appendix E.
4.6.4 Decomposed Granite BorrowA site reconnaissance was conducted to determine potential sources for decomposed graniteto use as backfill around the culverts, material to fill the voids in the concrete disposal cell,and material for a cap over the concrete disposal cell. Findings of the site reconnaissance areincluded in a technical memorandum in Appendix E. Briefly, decomposed granite could beobtained from the steep banks along the county road or from an existing borrow source justinside the gate access to IMM. Because of the requirements to develop borrow sources alongthe county road, including permitting, clearing and grubbing, cut-back slopes, and stabiliz-ing the borrow source after construction as well as the unknowns regarding the quantity ofmaterial at each location, it was assumed that decomposed granite material would beimported from the existing borrow source.
5.0 LimitationsThis report has been prepared in accordance with generally accepted engineering principlesand practices. Recommendations contained in this report are based on data collected fromsite reconnaissance, test pit excavations, and information from previous investigations. Testpits indicate conditions only at the specified locations and to the depths excavated at thetime of the investigation. Soil and groundwater conditions between test pits may differ fromthose shown. If variations in surface or subsurface conditions are encountered, CH2M HILLshould be notified so that the recommendations can be reevaluated.
RDD/011770002.DOC (CAH979.DOC) 18
Appendix AMorrison Knudsen Corporation Matheson Site
_____Investigation
MORRISON KNUDSEN CORPORATIONENGINEERING, CONSTRUCTION & ENVIRONMENTAL GROUP
TRIP REPORT
DATE December 9, 1994 FILE NO:
PREPARED BY: Daniel Wanket LOCATION: San Francisco
TRAVELED TO: Iron Mountain Site
DATE(S) OF TRAVEL: NOV. 29 - Dec. 1, 1994
PERSONS CONTACTED: Jim Ragon (SMC)
PURPOSE OF TRIP: Matheson Site Investigation
On November 29 an investigation was made by Dan Wanket and Mike Godwin of MorrisonKnudsen at the Matheson site near Keswick Reservoir in order to estimate the amount ofmaterial to be removed and disposed in a disposal cell (see Fig 1). Materials investigatedinclude abandoned concrete structures from the old loading station (at the end of the tramline) and waste rock in the vicinity of the loading station.
In order to estimate the extent of the waste rock material. 16 test pits were dug by backhoein the vicinity of the loading station, including two in the gully north of the site and one inthe gully south of the site (see Fig 2). Test pit depths ranged from 6 inches to 8 feet.
if
The concrete structures consist of retaining walls and an apparent scale along the roadadjacent to Keswick Reservoir, underground bunkers, retaining walls above the bunkers,foundation piers and other miscellaneous debris.
Summary of Findings at the Loading Station
• The site consists mostly of approximately 1 foot thick waste rock and other debris overbedrock, with localized areas of thicker material.
• At the loading site the majority of the waste rock material is concentrated behind theretaining walls above the bunkers. The material here ranges to 6 feet deep.
• Other deep zones were found in the north portion of the site (south of the north gully)and in the south-west corner of the site.
• Additional waste rock material is in the under ground concrete bunkers.
Summary of Findings at Adjacent Areas1
• There is a seam of waste rock in the north gully at a depth of approximately 3 feet Thewaste rock, which may have been washed down from the loading station, is overlayed bycolluvium from upslope and upstream.
• In the south gully a seam of oil was found at a depth of 5 feet Additionally, waste rockwas found at a depth of 2-4 feet and again below the oil seam. The depth of the secondwaste rock seam could not be determined because of groundwater inflow into the testpit Due to limited accessibility no further test pits were dug in this area to determinethe extent of the waste rock.
•V
• There are underwater deposits of waste rock material in Keswick Reservoir adjacent tothe Matheson site. The material appears to have eroded into the reservoir from theloading station, primarily through two culverts, one draining from the loading station, theother from the north gully. The approximate volume of material is not known at thistime.
t:\dm\lrenmnVKU9nvquinunm
Summary of Estimated Material Quantities
• ConcreteLoading Station 650 cy
• Waste Rock (Including sludge, rock and fill)Loading Station 6500 cyGully North of Loading Station 1500 cyGully South of Loading Station 1500 cv
Total 9500 cy
Additional Comments
• The thickness of material to be excavated in the north gully is assumed to be 5 feetbased on two 8-foot deep test pits. If removal of waste rock material in this area isrequired, further investigation may be necessary to determine if deeper seams of wasterock exist
• Investigation in the south gully was limited due to difficult accessibility and groundwaterinflow into the test pit. The assumed depth of waste rock material was 8 feet and extentincluded only the small basin at the bottom of the gully (adjacent to the road alongKeswick Reservoir). If excavation is required in this area, further investigation shouldbe performed to determine the actual depth and extent of the waste rock.
• Several structures are shown on the 1948 Property and Fire Map south of the loadingstation, including oil tanks, transformers, garages and warehouses (see Fig 3). Other thana test pit dug in a small basin at the bottom of the gully next to the road no otherinvestigation was performed in this area. The machinery oil found in the test pit dug inthe south gully may be related to 3 oil tanks shown on the 1948 Property and Fire Map.
FICrURE ZSire.
\FT
MKQ229C2
too ZooCfr)______
PROPERTY AND FIRE MAPTHE MOUNTAIN COPPER COMPANY, LTD.
MATHESON PROPERTYSHASTA COUNTY, CALIFORNIA
SCALE I"=IOO' MK022963 MARCH 1948
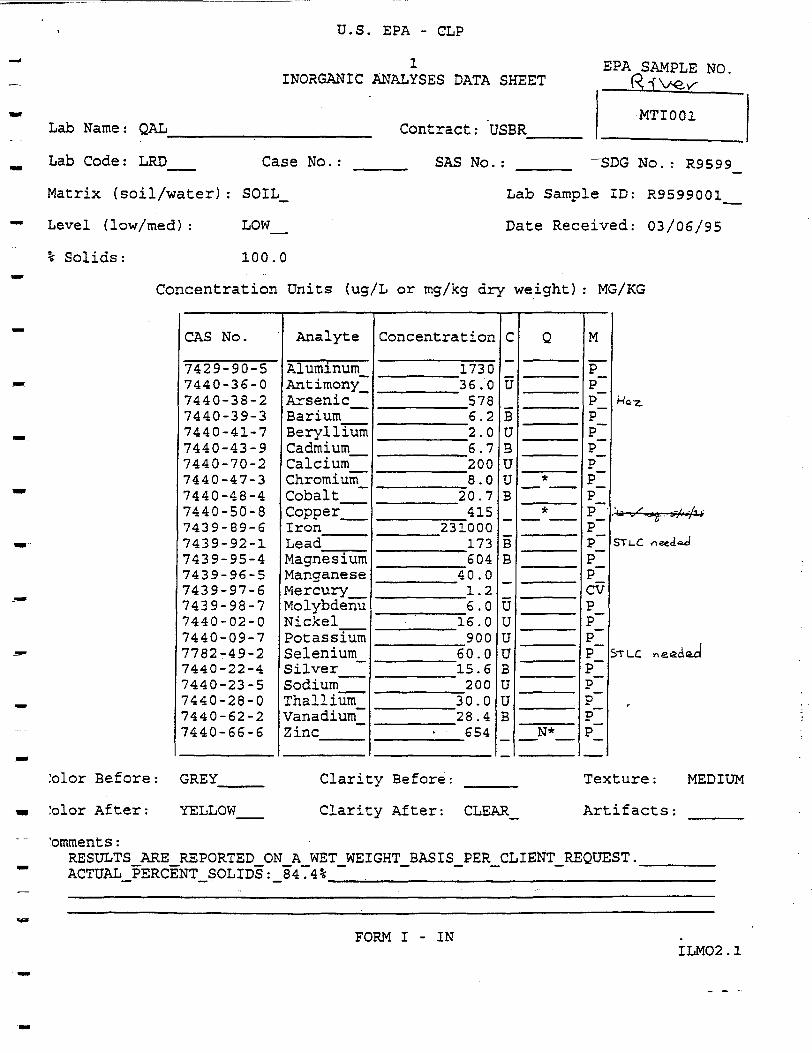
Appendix BU.S. Bureau of Reclamation
Matheson Site Investigation______Analytical Results
/2 00 QS:33a MP-700 of Planning
IS3
p&V?-It^t I1*!
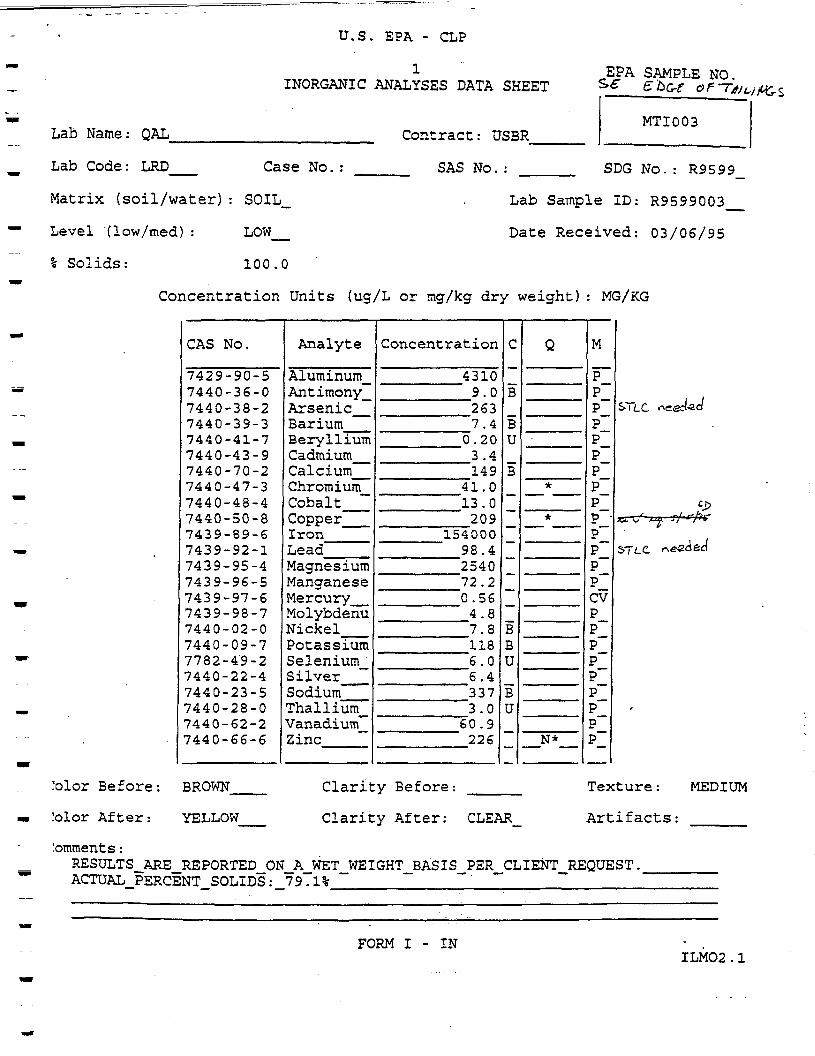
Lab Name: QAL
U.S. EPA - CLP
1INORGANIC ANALYSES DATA SHEET
Contract: USER
EPA SAMPLE NO.
Lab Code: LRD Case No. :
Matrix (soil/water): SOIL_
Level (low/med): LOW_
% Solids: 100.0
SAS No.:
MTI001
~~SDG No. : R9599
Lab Sample ID: R9599001
Date Received: 03/06/95
Concentration Units (ug/L or tr.g/kg dry weight) : MG/KG
CAS No.
7429-90-57440-36-07440-38-27440-39-37440-41-77440-43-97440-70-27440-47-37440-48-47440-50-87439-89-67439-92-17439-95-47439-96-57439-97-67439-98-77440-02-07440-09-77782-49-27440-22-47440-23-57440-28-07440-62-27440-66-6
Analyte
AluminumAntimonyArsenicBariumBerylliumCadmiumCalciumChromiumCobaltCopuerIronLeadMagnesiumManganeseMercuryMolybdenuNickelPotassiumSeleniumSilverSodiumThalliumVanadiumZinc
Concentration
173036.05786.22.06.72008.020.7415
231000173604
40.01.26.0
16.0900
60.015.6200
30.028.4654
C
U
BUBUUB
BB
UUUUBUUB
Q
*
*
N*
M
PPPPPPPPPP 'PPPPCVpPPPPPPPP
i-ta.-z.
YJ-.X -',-'ii-
STJ_C rteedaid
STUC naeciaa
:olor Before:
tolor After;
Clarity Before:
Clarity After: CLEAR_
Texture: MEDIUM
Artifacts:
'omments:RESULTS_ARE_REPORTED_ON_A_WET_WEIGHT_BASIS_PER_CLIENT_REQUEST.ACTUAL PERCENT SOLIDS: 84 .4% ______"
FORM I - INILM02.1
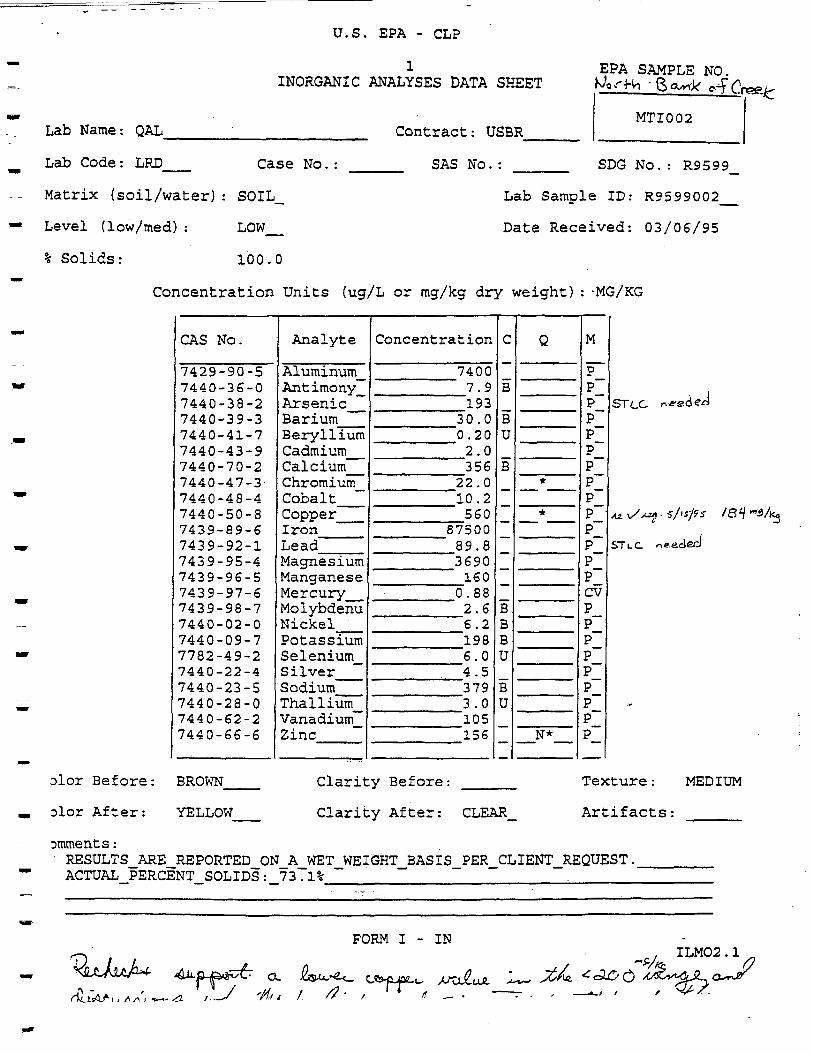
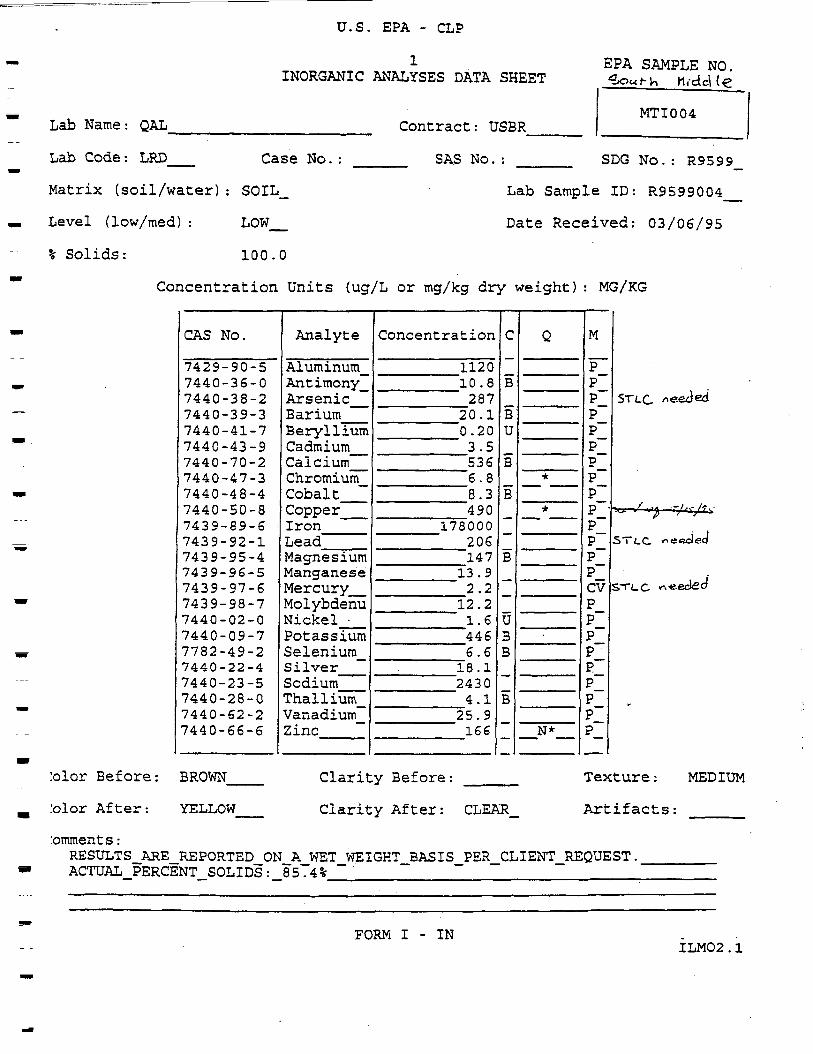
Lab Name: QAL_____
Lab Code: LED__ Case No.:
Matrix (soil/water): SOIL_
Level (low/med): LOW_
% Solids: 100.0
U.S. EPA - CLP
1INORGANIC ANALYSES DATA SHEET
Contract: USER
EPA SAMPLE NO.
SAS No.:
MTI002
SDG No.: R9599
Lab Sample ID: R9599002_
Date Received: 03/06/95
Concentration Units (ug/L or mg/kg dry weight):-MG/KG
CAS No.
7429-90-57440-36-07440-38-27440-39-37440-41-77440-43-97440-70-27440-47-37440-48-47440-50-87439-89-67439-92-17439-95-47439-96-57439-97-67439-98-77440-02-07440-09-77782-49-27440-22-47440-23-57440-28-07440-62-27440-66-6
Analyte
AluminumAntimonyArsenicBariumBerylliumCadmiumCalciumChromiumCobaltCopperIronLeadMagnesiumManganeseMercuryMolybdenuNickelPotassiumSeleniumSilverSodiumThalliumVanadiumZinc
Concentration
74007.9193
30.00.202.0356
22.010.2560
8750089.83690160
0.882.66.21986.04.53793.0105155
C
B
BU
B
BBBU
BU
Q
*
*
N*
M
pPPPPPPPPPPPPPCVPPPPPPPPP
STLC
/8 */ "
olor Before: BROWN Clarity Before: ___ Texture: MEDIUM
olor After: YELLOW__ Clarity After: CLEAR_ Artifacts: _____
omments:• RESULTS_ARE_REPORTED_ON_A_WET_WEIGHT_BASIS_PER_CLIENT_REQUEST._______ACTUAL PERCENT SOLIDS: 73.1% .____________
ex.11 A JA ,
FORM I - INILMO2.1
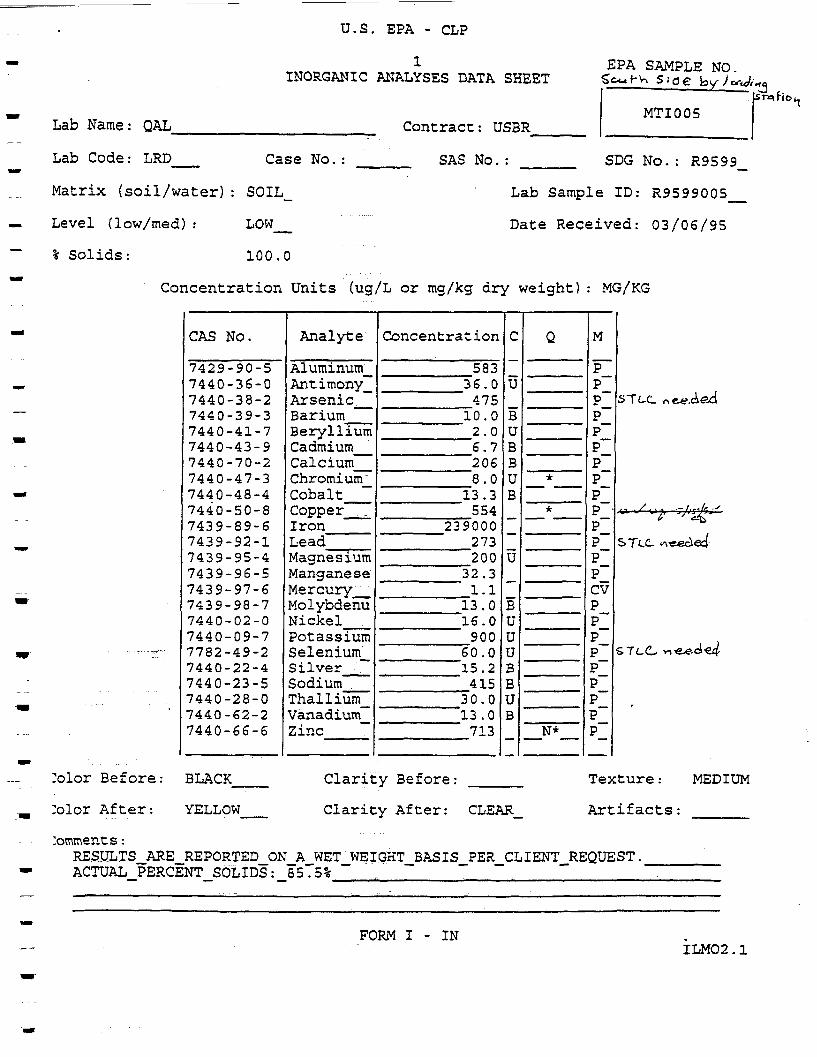
U.S. EPA - CLP
Lab Name: QAL_______________
Lab Code: LRD Case No.:
Matrix (soil/water): SOIL_
Level (low/med): LOW
% Solids: 100.0
INORGANIC ANALYSES DATA SHEET
_______. Contract: USSR
SAS No.:
EPA SAMPLE NO.'
MTI003
SDG No.: R9599
Lab Sample ID: R9599003
Date Received: 03/06/95
Concentration Units (ug/L or mg/kg dry weight) : MG/KG
CAS No.
7429-90-57440-36-07440-38-27440-39-37440-41-77440-43-97440-70-27440-47-37440-48-47440-50-87439-89-67439-92-17439-95-47439-96-57439-97-67439-98-77440-02-07440-09-77782-49-27440-22-47440-23-57440-28-07440-62-27440-66-6
Analyte
AluminumAntimonyArsenicBariumBerylliumCadmiumCalciumChromiumCobaltCopperIronLeadMagnesiumManganeseMercuryMolybdenuNickelPotassiumSeleniumSilverSodiumThalliumVanadiumZinc
Concentration
43109.02637.40.203.4149
41.013.0209
15400098.4254072.20.564.87.81186.06.43373.060.9226
C
B
BU
B
BBU
BU
Q
*
*
N*
M
PPPPPPPPPP 'PPPpCVPPPPPPPPP
STLC eeei-ao
*** * **' ''
S7L.C. ^eeAed
'
:olor Before:
!olor After:
BROWN_
YELLOW
Clarity Before:
Clarity After: CLEAR_
Texture: MEDIUM
Artifacts:
lomments:RESULTS ARE_REPORTED_ON_A WET_WEIGHT_BASIS_PER_CLIENT REQUEST.ACTUAL PERCENT SOLIDS: 79?1%
FORM I - INILM02.1
U.S. EPA - CLP
Lab Name: QAL_______________
Lab Code: LED Case No.:
Matrix (soil/water): SOIL_
Level (low/med): LOW
% Solids: 100.0
INORGANIC ANALYSES DATA SHEET
__ . Contract: USSR
SAS No.:
EPA SAMPLE NO.
MTI004
SDG No.: R9599
Lab Sample ID: R9599004
Date Received: 03/06/95
Concentration Units {ug/L or mg/kg dry weight): MG/KG
CAS No.
7429-90-57440-36-07440-38-27440-39-37440-41-77440-43-97440-70-27440-47-37440-48-47440-50-87439-89-67439-92-17439-95-47439-96-57439-97-67439-98-77440-02-07440-09-77782-49-27440-22-47440-23-57440-28-07440-62-27440-66-6
Analyte
Aluminum_AntimonyArsenicBariumBerylliumCadmiumCalcium _ChromiumCobaltCopper __IronLeadMagnesiumManganeseMercuryMolybdenuNickel •PotassiumSelenium_SilverSodiumThalliumVanadiumZinc
Concentration
112010.8287
20.10.203.55366.88.3490
17800020614713.92.2
12.21.64466.618.124304.1
25.9166
C
B
BU
B
B
B
UBB
B
Q
*
*
N*
M
PPPPPPpPPPPPPPCVPPPP 'PP?PP
STLC needed
•XT-/I-II ,.-/,,- /T,.JU- ^ r, Vf
5Ti_C needed
s~n_c •n-e.&^ed
:olor Before: BROWN__
.'olor After: YELLOW
Clarity Before:
Clarity After: CLEAR_
Texture: MEDIUM
Artifacts::omment s:RESULTS_ARE_REPORTED_ON_A_WET_WE IGHT_B AS I S_PER_CL I ENT_REQUE ST.ACTUAL PERCENT SOLIDS: 85.4% _______'
FORM I - INILM02.1
Lab Name: QAL
U.S. EPA - CLP
1INORGANIC ANALYSES DATA SHEET
________ Contract: USER
EPA SAMPLE NO.
Lab Code : LRD__ Case No. :
Matrix (soil/water): SOIL_
Level (low/med): LOW_
% Solids: 100.0
SAS No.:
MTI005
SDG No.: R9599
Lab Sample ID: R9599005_
Date Received: 03/06/95
Concentration Units (ug/L or mg/kg dry weight) .- MG/KG
CAS No.
7429-90-57440-36-07440-38-27440-39-37440-41-77440-43-97440-70-27440-47-37440-48-47440-50-87439-89-S7439-92-17439-95-47439-96-57439-97-67439-98-77440-02-07440-09-77782-49-27440-22-47440-23-57440-28-07440-62-27440-66-6
Analyte
AluminumAntimonyArsenicBariumBerylliumCadmiumCalciumChromiumCobaltCopper _IronLeadMagnesiumManganeseMercuryMolybdenuNickelPotassiumSeleniumSilver -'.SodiumThalliumVanadiumZinc
Concentration
58336.047510.02.06.72068.013.3554
239000273200
32.31.113.016.090060.015.2415
30.013.0713
C
U
BUBBUB
U
BUUUBBUB
Q
*
*
N*
.M
PPPPPPPPPP •PPPPCVPPPPPPPPP
STt-C needed
,,,/,, , .- /.--//! --'/ -' ' a£-STcC- *-\«eciee{-
STc<L viex?.el-e4
:olor Before: BLACK___ Clarity Before: ____
Tolor After: YELLOW__ Clarity After: CLEAR_
Texture: MEDIUM
Artifacts:
:omments:RESULTS_ARE_REPORTED_ON_A_WET_WEIGKT_BASIS PER CLIENT REQUEST.ACTUAL_PERCENT SOLIDS: 85.5% _ ~__~ _ _~ ___ '
FORM I - INILMO2.1
U.S. EPA - CLP
Lab Name.- QAL_______________
Lab Code: LRD Case No.:
Matrix (soil/water): SOIL_
Level (low/med): LOW_
% Solids: 100.0
INORGANIC ANALYSES DATA SHEET
_______. Contract: USER__
__ _ SAS No. :
EPA SAMPLE NO.
MTI006
SDG No.: R9599
Lab Sample ID: R9599006
Date Received: 03/06/95
Concentration Units (ug/L or mg/kg dry weight): MG/KG
CAS No.
7429-90-57440-36-07440-38-27440-39-37440-41-77440-43-97440-70-27440-47-37440-48-47440-50-87439-89-67439-92-17439-95-47439-96-57439-97-67439-98-77440-02-07440-09-77782-49-27440-22-47440-23-57440-28-07440-62-27440-66-6
Analyte
Alutninum_AntimonyArsenicBariumBerylliumCadmiumCalciumChromiumCobaltCopperIronLead ____MagnesiumManganeseMercuryMolybdenuNickelPotassiumSelenium_SilverSodiumThallium_VanadiumZinc
Concentration
30.040.56977.42.0
11.62008.0
20.4579
324000• 542200
45.81.518.719.5131060.043.4200
30.07.6890
C
UB
BU
UUB
U
BBBU
UUB
Q
*
*
N*
M
PPPPPPPPPP 'PPPpCVPPPPPPPPP
Hatav-ciou
ST<-C -*eeAe.d
M i / -j_A c'jr /"•-0 *& '"
&TLC .-.eedecf
5TLC. needed
•'r
GREY Clarity Before:olor Before:
Olor After: YELLOW__ Clarity After: CLEAR_
Texture: MEDIUM
Artifacts:
omments:RESULTS_ARE REPORTED_ON_A_WET WEIGHT_BASIS PER_CLIENT_REQUEST.ACTUAL PERCENT SOLIDS: 91.8% ~ ________J
FORM I - INILM02.1
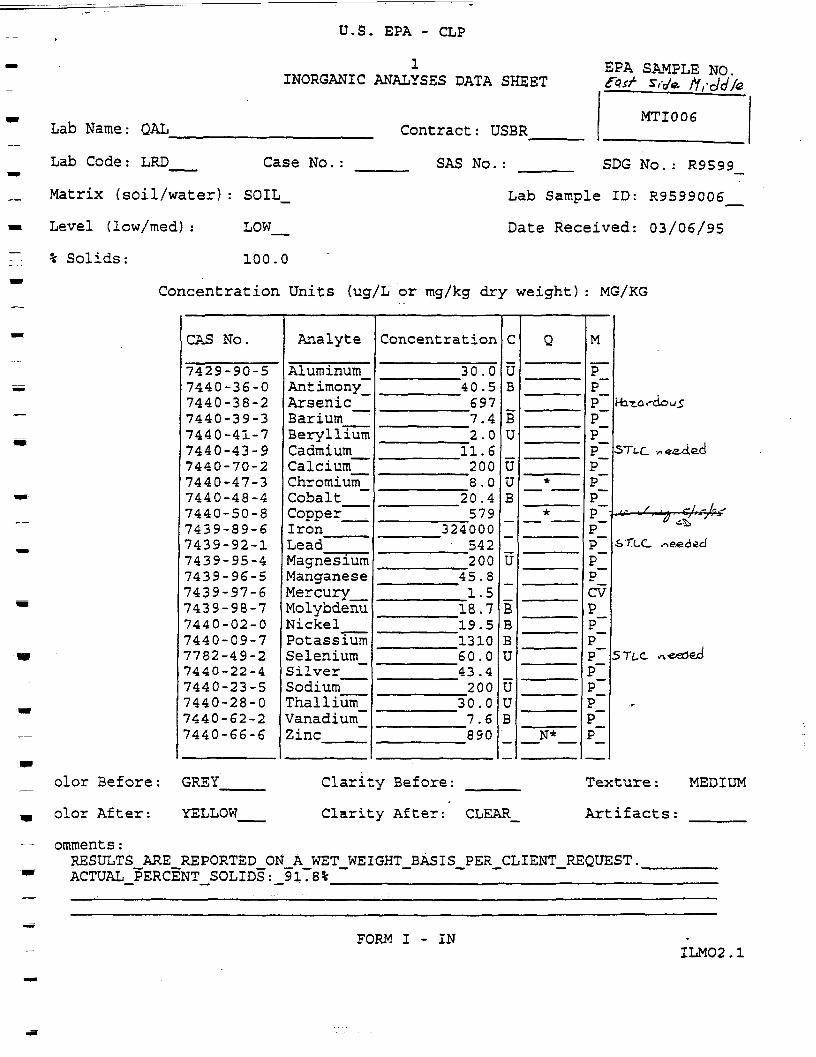
U.S. EPA - CLP
INORGANIC ANALYSES DATA SHEETEPA SAMPLE NO.
Lab Name: QAL_
Lab Code: LRD__ Case No.:
Matrix (soil/water) : SOIL_
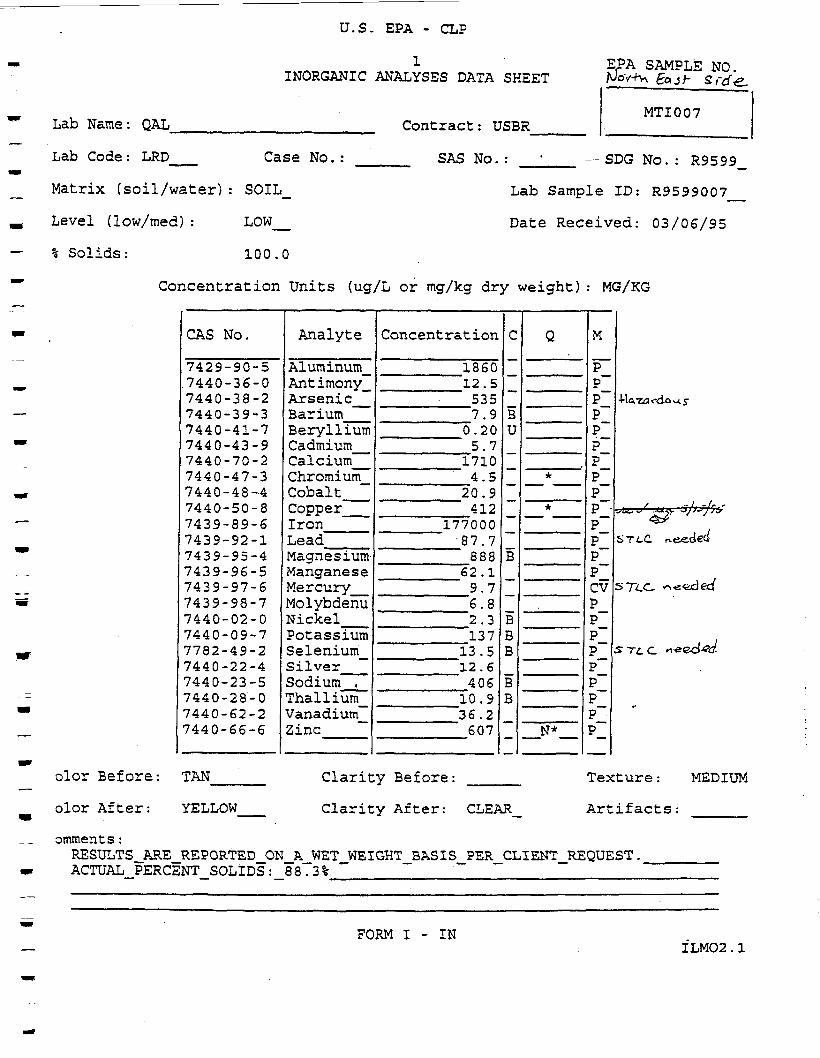
Level (low/med} : LOW_
% Solids: 100.0
Contract: USBR_
SAS No.:
MTI007
SDG No.: R9599
Lab Sample ID: R9599007
Date Received: 03/06/95
Concentration Units (ug/L or mg/kg dry weight): MG/KG
CAS No.
7429-90-57440-36-07440-38-27440-39-37440-41-77440-43-97440-70-27440-47-37440-48-47440-50-87439-89-67439-92-17439-95-47439-96-57439-97-67439-98-77440-02-07440-09-77782-49-27440-22-47440-23-57440-28-07440-62-27440-66-6
Analyte
AluminumAntimonyArsenicBariumBerylliumCadmiumCalciumChromiumCobaltCoo'cer*»Wfc».t*W* __ _
IronLeadMagnesium-ManganeseMercuryMolybdenuNickelPotassiumSeleniumSilverSodium ,ThalliumVanadiumZinc
Concentration
186012.55357.9
0.205.7
17104.5
20.94-1 ?^E X £t
17700087.7888
62.19.76.82.3137
13.512.6406
10.936.2607
C
BU
B
BBB
BB
Q
*
*
N*
M
PPPPPPPPPP -PPPPCVPPPPPPPPP
•Ucvz<a<-<io-j.s'
1" —— ' £P sJ'-~/s*&&•i'Ti-C rx<aedea
STi-C- <s«idecf
s~n.c. *r*ecUw
Clarity Before:olor Before: TAN
olor After: YELLOW__ Clarity After: CLEAR_
Texture: MEDIUM
Artifacts:
omments:RESULTS_ARE_REPORTED_ON_A_WET WEIGHT_BASIS_PER_CLIENT_REQUEST.ACTUAL PERCENT SOLIDS: 88.3%
FORM I - INILM02.1
Lab Name: QAL________________________
Lab Code: LRD Case No.:
Matrix (soil/water): SOIL_
Level (low/med): LOW_
% Solids: 100.0 '
U.S. EPA - CLP
1INORGANIC ANALYSES DATA SHEET
Contract: USER
EPA SAMPLE NO.
SAS No.:
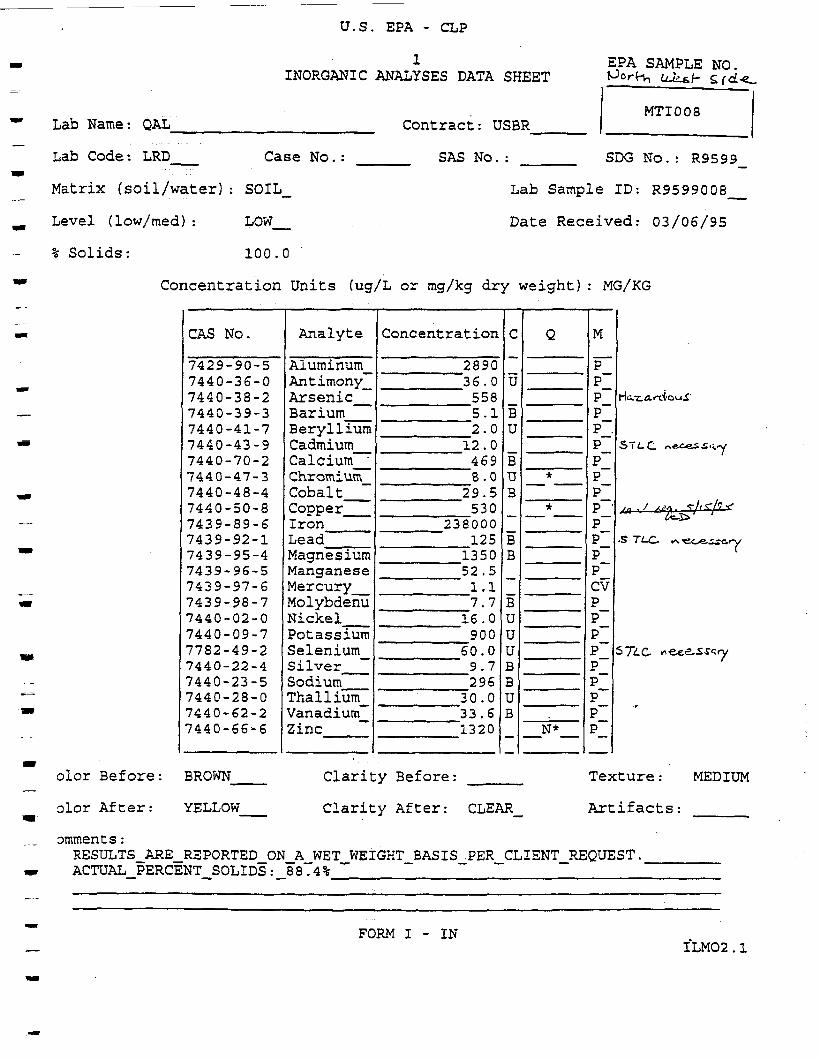
MTI008
SDG No.: R9599
Lab Sample ID: R9599008
Date Received: 03/06/95
Concentration Units (ug/L or mg/kg dry weight): MG/KG
CAS No.
7429-90-57440-36-07440-38-27440-39-37440-41-77440-43-97440-70-27440-47-37440-48-47440-50-87439-89-67439-92-17439-95-47439-96-57439-97-67439-98-77440-02-07440-09-77782-49-27440-22-47440-23-57440-28-07440-62-27440-66-6
Analyte
AluminumAntimonyArsenicBariumBerylliumCadmiumCalciumChromiumCobaltCooperIronLeadMagnesiumManganeseMercuryMolybdenuNickelPotassiumSeleniumSilverSodiumThalliumVanadiumZinc
Concentration
289036.05585.12.0
12.04698.0
29.5530
238000125
135052.51.17.7
16.0900
60.09.7296
30.033.61320
C
U
BU
BUB
BB
BUUUBBUB
Q
*
*
N*
M
PPPPPPPPPP 'PPPPCVPPPPPPPPP
ric.T.A»rio .£-
STLC «oasi.vry
Ml ' / iVt . T/f f/5 *t*3>
M ^ J -H-1
»J * *-C— v% TiOG.- - CfcT'
572.C -ec sr fy
olor Before: BROWN Clarity Before: ___ Texture.- MEDIUM
olor After: YELLOW___ Clarity After: CLEAR_ Artifacts: _____
omments:RESULTS_ARE_REPORTED_ON_A_WET WEIGHT_BASIS_PER_CLIENT_REQUEST.________ACTUAL PERCENT SOLIDS: 88.4%
FORM I - INILMO'2 .1
U.S. EPA - CLP
Lab Name: QAL______________
Lab Code: LRD Case No.:
Matrix (soil/water): SOIL_
Level (low/med): LOW
% Solids: 100.0
INORGANIC ANALYSES DATA SHEET
______ _ _ _ _ _ Contract: USBR__
SAS No.:
EPA SAMPLE NO.
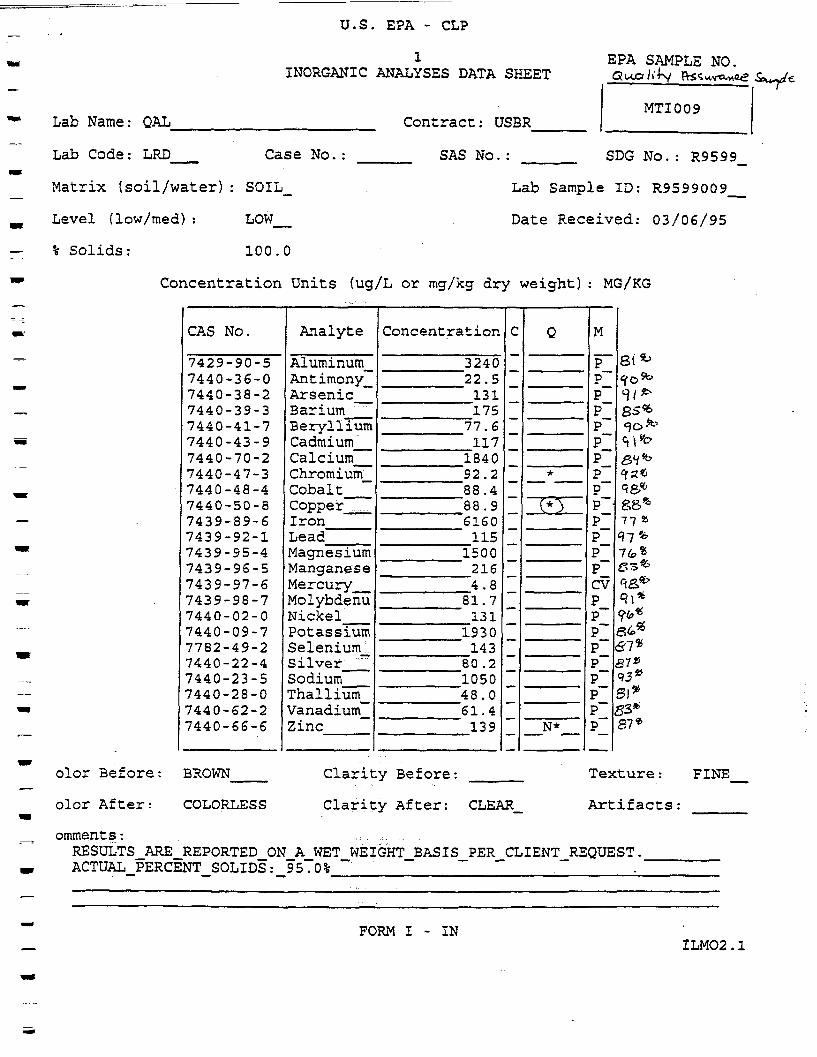
MTI009
SDG No.: R9599
Lab Sample ID: R9599009_
Date Received: 03/06/95
Concentration Units (ug/L or mg/kg dry weight): MG/KG
CAS No.
7429-90-57440-36-07440-38-27440-39-37440-41-77440-43-97440-70-27440-47-37440-48-47440-50-87439-89-67439-92-17439-95-47439-96-57439-97-67439-98-77440-02-07440-09-77782-49-27440-22-47440-23-57440-28-07440-62-27440-66-6
Analyte
AluminumAntimonyArsenicBariumBerylliumCadmiumCalciumChromiumCobaltCopper :.IronLeadMagnesiumManganeseMercuryMolybdenuNickelPotassiumSelenium:SilverSodiumThalliumVanadiumZinc
Concentration
324022.5131175
77.6117
184092.288.488.9616011.5
15002164.8
81.7131
1930143
80.2105048.061.4139
C Q
*
CO
N*
M
PPPPPPPPPPPPPPcvPPPPPPPPP
&( *•>ost>o / &*I 18$*^o*^ \v°8H*>c* 2*6c p$6
SB*77*q-j '*>7(o%£3^£(£*?
91*94?*
8<*%&1^81*93*81*£•3*87*
olor Before:
olor After:
BROWN___
COLORLESS
Clarity Before:
Clarity After: CLEAR_
Texture: FINE_
Artifacts:
omments: : - , „ . , , - , , . : . . . . . . .RESULTS_ARE_REPORTED_ON_A_WET WEIGHT_BASIS_PER_CLIENT_REQUEST.ACTUAL PERCENT SOLIDS: 9 5 . 0 %
FORM I - INILMO2.1
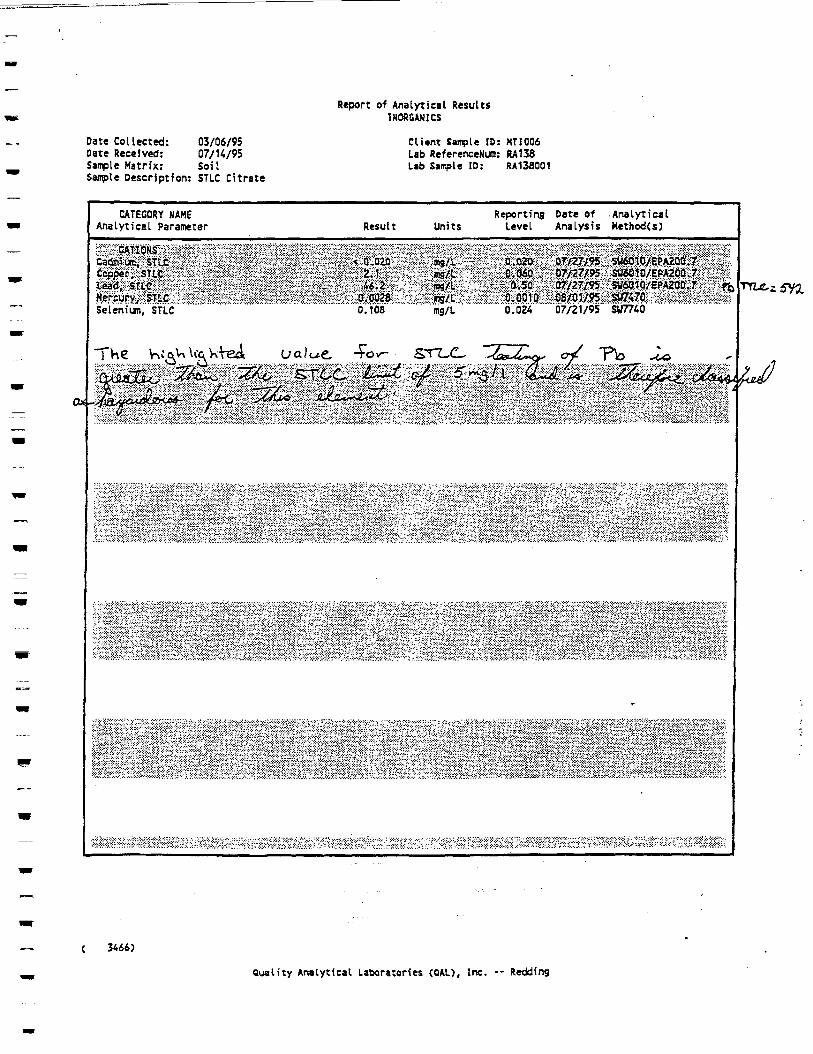
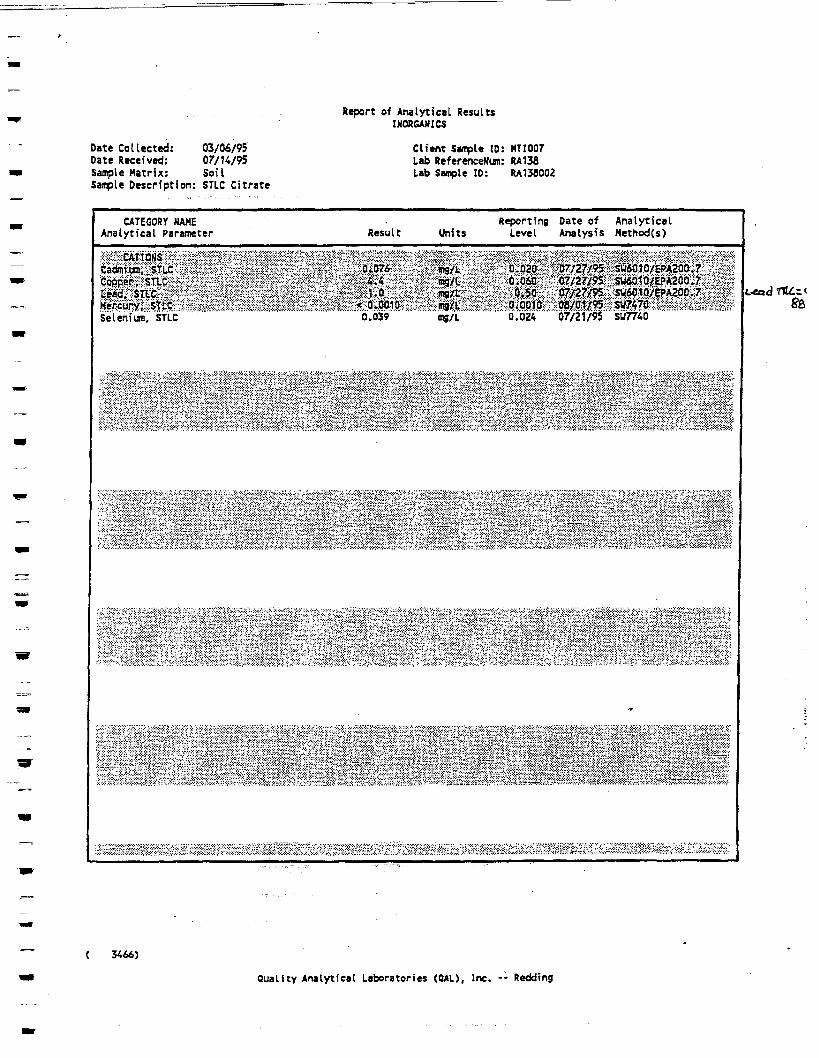
Report of Analytical ResultsINORGANICS
Date Collected: 03/06/95Date Received: 07/14/95Sample Matrix: SoilSanple Description: STLC Citrate
Clitnt Sample ID: HT1006Lab Referenced: RA138Lab Sample ID: RA138001
CATEGORY NAMEAnalytical Parameter Result Units
Reporting Date of AnalyticalLevel Analysis Method(s)
Quality Analytical Laboratories (OAL), Inc. -- Redding
Date Collected: 03/06/95Date Received: 07/H/95Sample Matrix: SoilSample Description: STLC Citrate
Report of Analytical ResultsINORGANICS
Ch'tnt Sample ID: MTI007Lab ReferenceNum: RA138Lab Saitple 10: RA138002
CATEGORY NAMEAnalytical Parameter
Reporting Date of AnalyticalResult Units Level Analysis Hethod(s)
Selenium, STLC 0.039 • "•"-"•••••••*'£;
Quality Analytical Laboratories COAL), Inc. -- Redding
Appendix C™ Test Pit Logs
CH2M HILL Matheson Site Field InvestigationApril 24 to 27,2001
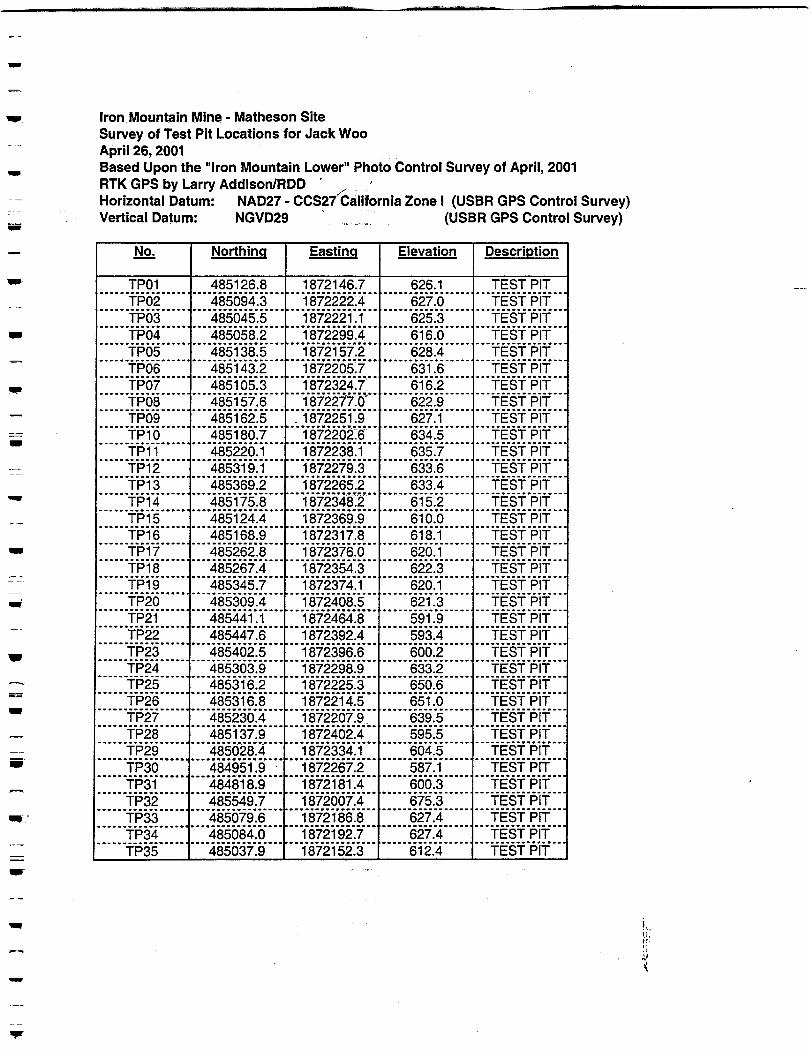
Iron Mountain Mine - Matheson SiteSurvey of Test Pit Locations for Jack WooApril 26,2001Based Upon the "Iron Mountain Lower" Photo Control Survey of April, 2001RTK GPS by Larry Addison/RDD -Horizontal Datum: NAD27 - CCS27 California Zone I (USBR GPS Control Survey)Vertical Datum: NGVD29 (USBR GPS Control Survey)
No.
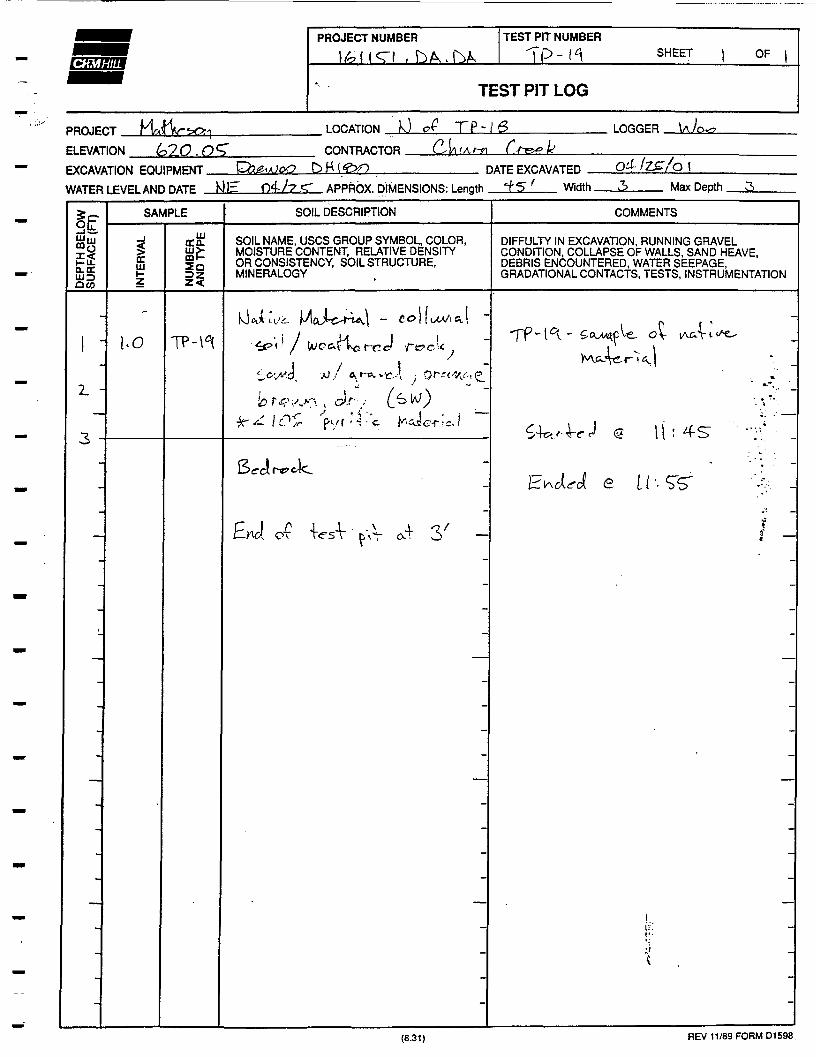
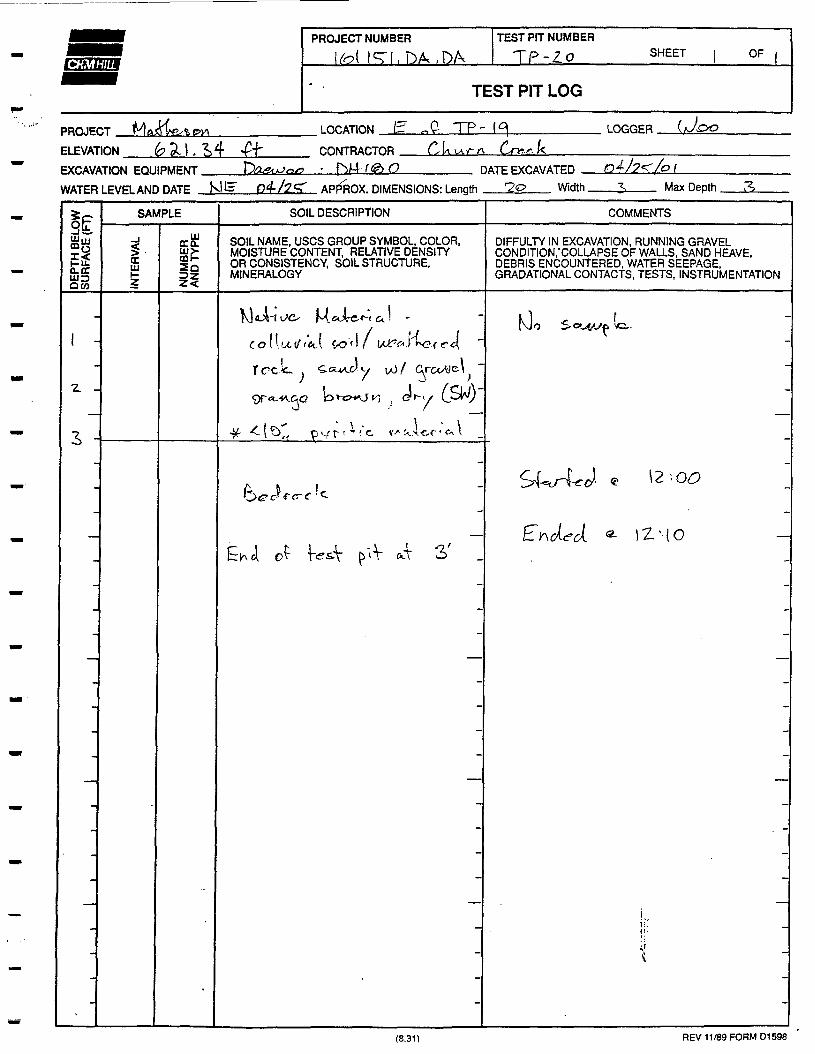
TP01TP02TP03TP04TP05TP06TP07TP08TP09TP10TP11TP12TP13TP14TP15TP16TP17fp'is" 1TP19TP20TP21TP22TP23TP24TP25TP26TP27TP28TP29TP30TP31TP32TP33TP34TP35
Northinq
485126.8485094.3485045.5485058.2485138.5485143.2485105.3485157.6485162.5485180.7485220.1485319.1485369.2485175.8485124.4485168.9485262.8485267.4485345.7485309.4485441.1485447.6485402.5485303.9485316.2485316.8485230.4485137.9485028.4484951.9484818.9485549.7485079.6485084.0485037.9
Eastinq
1872146.71872222.41872221.11872299.41872157.21872205.71872324.71872277.0
. 1872251.91872202.61872238.11872279.31872265.21872348.21872369.91872317.81872376.01872354.31872374.11872408.51872464.81872392.41872396.61872298.91872225.31872214.51872207.91872402.41872334.11872267.21872181.41872007.41872186.81872192.71872152.3
Elevation
626.1627.0625.3616.0628.4631.6616.2622.9627.1634.5635.7633.6633.4615.2610.0618.1620.1622.3620.1621.3591.9593.4600.2633.2650.6651.0639.5595.5604.5587.1600.3675.3627.4627.4612.4
Description
TEST PITTEST PITTEST PITTEST PITTEST PITTEST PITTEST PITTEST PITTEST PITTEST PITTEST PITTEST PITTEST PITTEST PITTEST PITTEST PITTEST PITTEST PITTEST PITTEST PITTEST PITTEST PITTEST PITTEST PITTEST PITTEST PITTEST PITTEST PITTEST PITTEST PITTEST PITTEST PITTEST PITTEST PITTEST PIT
PROJECT NUMBER TEST PIT NUMBERSHEET OF
TEST PIT LOG
PROJECT _ELEVATION.EXCAVATION EQUIPMENT.WATER LEVEL AND DATE .
LOCATION TP'2i_OGGER
. O3. £J- CONTRACTOR (Very?
4 fl-4___________ DATE EXCAVATED _
APPROX. DIMENSIONS: Length Z 6 _ Width . 1~> Max Depth
SAMPLE SOIL DESCRIPTION COMMENTS
O-CCuoQCO
UJ
LUoca.iu>-mf-SOIL NAME, USCS GROUP SYMBOL, COLOR,MOISTURE CONTENT, RELATIVE DENSITYOR CONSISTENCY, SOIL STRUCTURE,MINERALOGY
DIFFULTY IN EXCAVATION, RUNNING GRAVELCONDITION, COLLAPSE OF WALLS, SAND HEAVE,DEBRIS ENCOUNTERED, WATER SEEPAGE,GRADATIONAL CONTACTS, TESTS, INSTRUMENTATION
z.
3 -
TP-Z
imc nf'f
' 2-
End £-4
(8.31) REV 11/89 FORM D1598
I-mZ
o H
O
•0
0•n-HO mIIw <to «~to >
LP
M
DEPTH 8£LOWSURFACE (FT)
INTERVAL
NUMBERAND TYPE
> S m -o•o > r- 3J3 ' 2 2M m < <—-S S> 52 m 5
m< 2mr-
1 s
MM >
i S
a •Hm(AH
H
>I-r-r-OO
!r" o1 m
O
• i— oma
J————I————L, ' ••-!————I————1——I——L.
Oi
-i——i———r -i———i———i———r
o -
9-0"T5>
r*mZnHI
O
?',ss— IT ?ft
O
D1599 8
DEPTH BELOWSURFACE (FT>
INTERVAL
NUMBERAND TYPE
H3
PROJECT NUMBER
1611 .DXTEST PIT NUMBER
TP-4 SHEET OF
TEST PIT LOG
PROJECT _,ELEVATION ________EXCAVATION EQUIPMENT.WATER LEVELAND DATE J
LOCATION IP'4 LOGGERCONTRACTOR CW<l-c\ (Ye*Jc.
DATE EXCAVATED •< /I Q. APPROX. DIMENSIONS: Length 3 ' Max Depth
SAMPLE SOIL DESCRIPTION COMMENTS
mO.CCow
ECOl
S?mfUJ SOIL NAME, USCS GROUP SYMBOL, COLOR,
MOISTURE CONTENT, RELATIVE DENSITYOR CONSISTENCY, SOIL STRUCTURE,MINERALOGY
DIFFULTY IN EXCAVATION, RUNNING GRAVELCONDITION, COLLAPSE OF WALLS, SAND HEAVE,DEBRIS ENCOUNTERED, WATER SEEPAGE,GRADATIONAL CONTACTS, TESTS, INSTRUMENTATION
so;
-<. (6-- 35"
REV 11/89 FORM D1598
4! ! 4 1 II I I
)IS202.11REV 7/86 FORMDt599
I I I II! II I I I I j ) i n i ) f;••••••
DEP
TH 8
ELO
WS
UR
FAC
E [
FT
)
o -
3 -
-
• v l } ' -
(1
\
SAMPLE
INT
ER
VA
L
(.0
**•
NU
MB
ER
AN
D
TY
PE
'--":
PROJECT NUMBER TEST PIT NUMBER
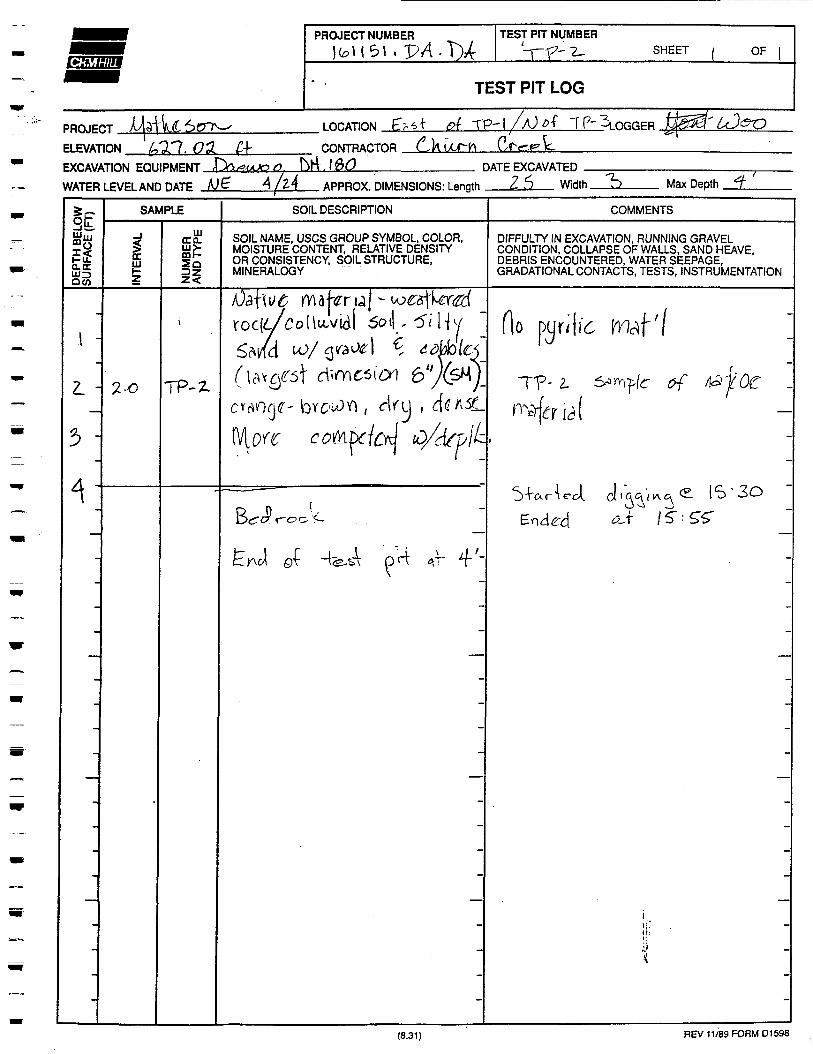
16,1 IS! .DA, DA TP-£, SHEET I OF 1
TEST PIT WALL LOG
PROJECT McAW<;on LOCATION Ki <€>$: TP - 2. MAPOF M WALL OF PIT
ELEVATION ^^{.^(^ tH" CONTRACTOR L^\MA.t~ n Cr*--eL DATE FXr.AVATPH <O4-{2-C^/O\
WATER LEVEL AND DATE WoUiS (St^OlMtfvreA EXCAVATION METHOD f^Vx?VOOO t>M ( fi>O Ex^alWrOfLOGGER lA/CO
APPROXIMATE DIMENSIONS: LENGTH 3O WIDTH "5> DFPTH 3> REMARKS
i
' ty//?' ' / / / - . • • • • •
" /^/y'j^^^Yu,Ai ^4 rziz~r- \ ' I . SflA\ . • i \ \ ( • / / • , ' , \ •Contnxuc'c . I^VLsCprl) \ c^bloWs. (S>\d) orei^e.
• • &,a^k b-^^lry,^^ -
•
-
•
O ' (O LENGTH (FT)2O 3Q
COMMENTS
pyriTi'c irAttf-ezricAr/ \
^Y\<k<?A &- 8 ' / 0
TEST PIT WALL LOGFORM D1599
OIS202.11REV 7/86 FORMD1599
PROJECT NUMBER
Ifol ICI , DA, DATEST PIT NUMBER
TP- ? SHEET OF
TEST PIT LOG
PROJECT __ELEVATION _EXCAVATION EQUIPMENT.WATER LEVELAND DATE .
. LOCATION ET Or TP - £> K-l g?P Tf -^ LOGGER U)
Z4 (34- CONTRACTOR[f)r"i
OR t JA u c SA £!rr-eU
klE APPROX. DIMENSIONS: LengthDATE EXCAVATED
\O' VVidth
(
Max Depth Q.
SAMPLE SOIL DESCRIPTION COMMENTS
Q.OCmf-iiz<
SOIL NAME, USCS GROUP SYMBOL, COLOR,MOISTURE CONTENT, RELATIVE DENSITYOR CONSISTENCY, SOIL STRUCTURE,MINERALOGY
DIFFULTY IN EXCAVATION, RUNNING GRAVELCONDITION, COLLAPSE OF WALLS, SAND HEAVE,DEBRIS ENCOUNTERED, WATER SEEPAGE,GRADATIONAL CONTACTS, TESTS, INSTRUMENTATION
fJc
CuTf
: 15
(2.
(8.31) REV 11/89 FORM D1598
PROJECT NUMBER
16)1 ICTI .DA .
TEST PIT NUMBER
TP-ft SHEET OF
TEST PIT LOG
PROJECT _ELEVATION ________EXCAVATION EQUIPMENT.WATER LEVELAND DATE _
. LOCATION I O' l)
CONTRACTORDATE EXCAVATED
APPROX. DIMENSIONS: Length Width. Max Depth
SAMPLE SOIL DESCRIPTION COMMENTS
MO.CC
IUoca.UJ>-
ll
SOIL NAME, USCS GROUP SYMBOL, COLOR,MOISTURE CONTENT, RELATIVE DENSITYOR CONSISTENCY, SOIL STRUCTURE,MINERALOGY
DIFFULTY IN EXCAVATION, RUNNING GRAVELCONDITION, COLLAPSE OF WALLS, SAND HEAVE,DEBRIS ENCOUNTERED, WATER SEEPAGE,GRADATIONAL CONTACTS, TESTS, INSTRUMENTATION
co' VM.OS.ny C.) . ' 1
1-0-«A •( i & o. (^ &1J J
i -<?V-
'
(8.31) REV 11/89 FORM D1598
PROJECT NUMBER
I6f l<5\ , DA,DATEST PIT NUMBER
TP-°i SHEET OF
TEST PIT LOG
PROJECT f^Qjn/ia.feo*v
ELEVATION <£27. O^
. LOCATION l/e.s(- oft ! P- fi - T LOGGER
CONTRACTOR
EXCAVATION EQUIPMENT ___kWATER LEVELAND DATE K)^
DATE EXCAVATEDQ4-/2.C APPROX. DIMENSIONS: Length Width. Max Depth
SAMPLE SOIL DESCRIPTION COMMENTS
OCD
QCO
HIoca.LU>CDh-
iiSOIL NAME, USCS GROUP SYMBOL, COLOR,MOISTURE CONTENT, RELATIVE DENSITYOR CONSISTENCY, SOIL STRUCTURE,MINERALOGY
DIFFULTY IN EXCAVATION, RUNNING GRAVELCONDITION, COLLAPSE OF WALLS, SAND HEAVE,DEBRIS ENCOUNTERED, WATER SEEPAGE,GRADATIONAL CONTACTS, TESTS, INSTRUMENTATION
Z
2
4 L' -
;^-1 / •',\-r AT 6
(8.311 REV 11/89 FORM 01598
PROJECT NUMBER
, DATEST PIT NUMBER
TP- in SHEET OF
TEST PIT LOG
PROJECT _ELEVATION
•o-n LOCATION LOGGER
CONTRACTORx\
EXCAVATION EQUIPMENT DATE EXCAVATEDWATER LEVEL AND DATE Mp' C4-/2.C APPROX. DIMENSIONS: Length Width Max Depth
SAMPLE SOIL DESCRIPTION COMMENTS
UJ UJ
IQco
UJeraUJ>mf-
z<
SOIL NAME, USCS GROUP SYMBOL, COLOR,MOISTURE CONTENT, RELATIVE DENSITYOR CONSISTENCY, SOIL STRUCTURE,MINERALOGY
DIFFULTY IN EXCAVATION, RUNNING GRAVELCONDITION, COLLAPSE OF WALLS, SAND HEAVE,DEBRIS ENCOUNTERED, WATER SEEPAGE,GRADATIONAL CONTACTS, TESTS, INSTRUMENTATION
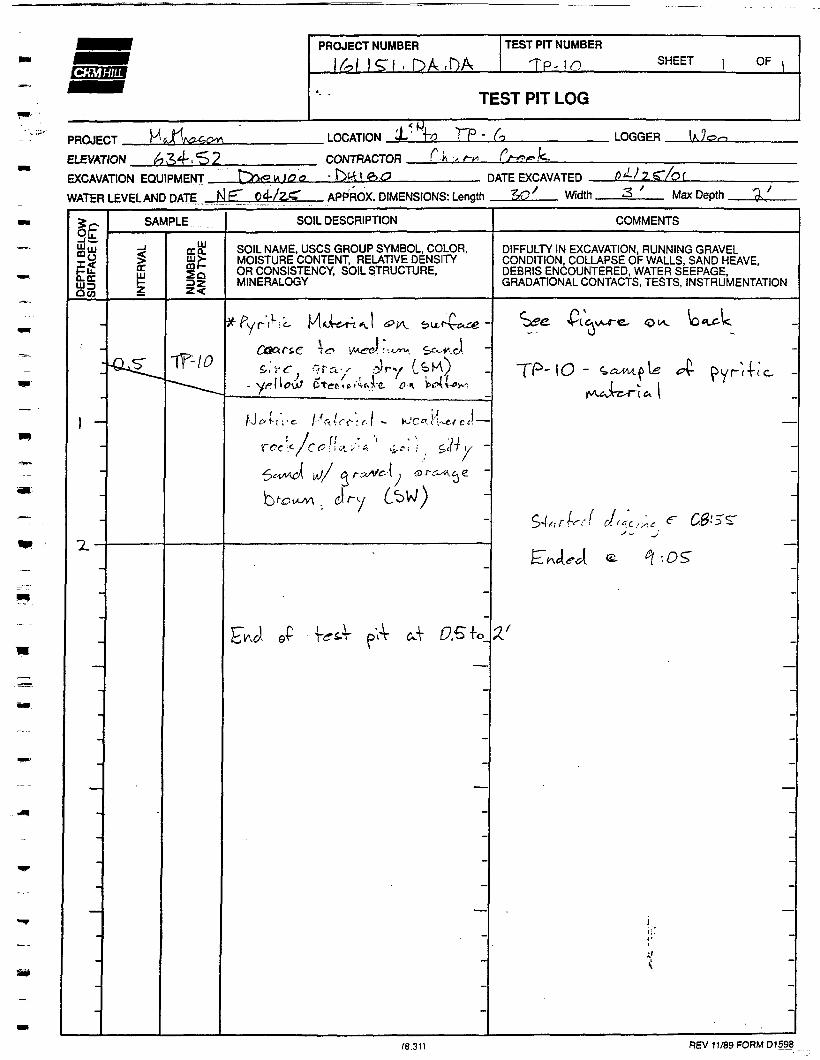
0O«u^<
TT-/0
; /'.<-/
l--*citst-:f- ---*citr,'
f8.31l REV 11/89 FORM 01598
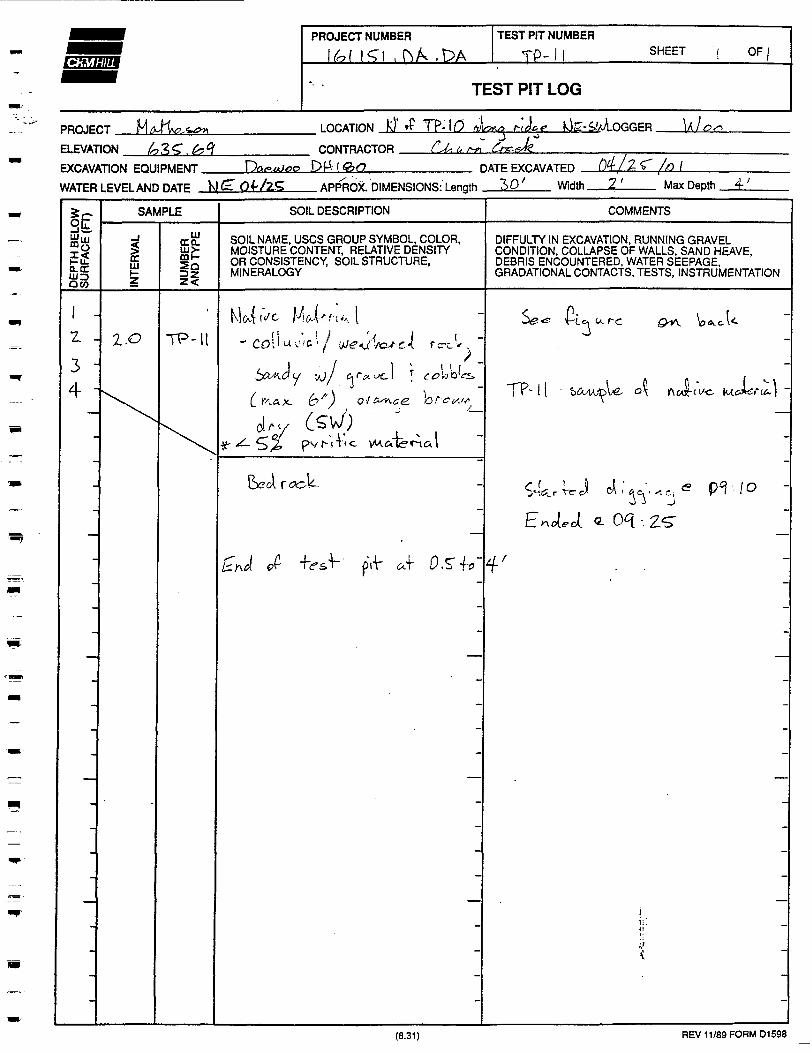
PROJECT NUMBER TEST PIT NUMBER
TP-l l SHEET OF,
TEST PIT LOG
PROJECTELEVATION
LOCATION k)' £ TP-10 J
CONTRACTOR __
J iM-OGGER Vlo^
EXCAVATION EQUIPMENT.WATER LEVEL AND DATE _
/IT i <ou^_________ DATE EXCAVATED _APPROX. DIMENSIONS:length 30' Width.
' /Of______. Max Depth __iJ
?SAMPLE SOIL DESCRIPTION COMMENTS
aw
uiera. SOIL NAME, USCS GROUP SYMBOL, COLOR,MOISTURE CONTENT, RELATIVE DENSITYOR CONSISTENCY, SOIL STRUCTURE,MINERALOGY
DIFFULTY IN EXCAVATION, RUNNING GRAVELCONDITION, COLLAPSE OF WALLS, SAND HEAVE,DEBRIS ENCOUNTERED, WATER SEEPAGE,GRADATIONAL CONTACTS, TESTS, INSTRUMENTATION
z.o TP-I ^
34 C K AX 6
Cir
of c>^.c, e. x-ti^e »u.eJ«:
(8.31) REV 11/89 FORM D1598
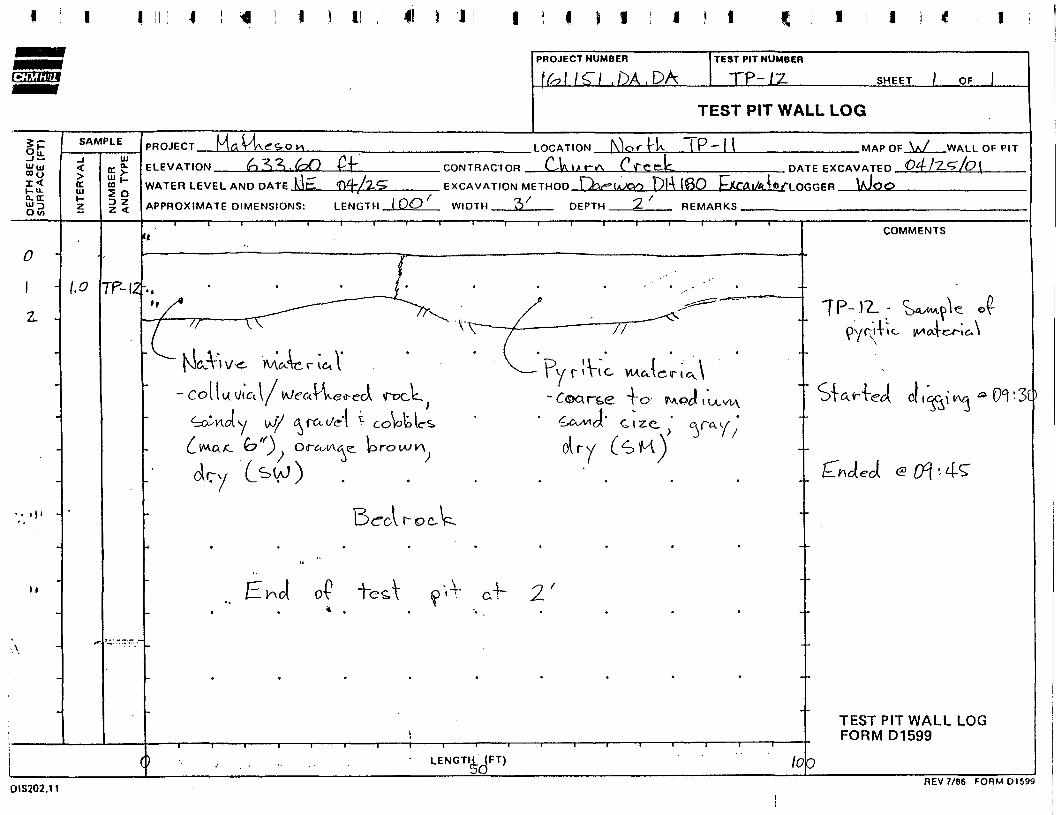
II I ! IPROJECT NUMBER
S"/ .DA.PATEST PIT NUMBER
TP-IZ SHEET OF
TEST PIT WALL LOG
||00 y
I-"-
O v)
SAMPLE
ER
VA
L
NU
MB
ER
AN
D
TY
PE
PROJECT LOCATION IP '11
ELEVATION. IfMAPOF WALI OF PIT
.CONTRACTOR L >A t~>^
WATER LEVEL AND DATE JdJ
APPROXIMATE DIMENSIONS:
EXCAVATION METHOD. DlA I$5O
__ DATE EXrAVATFD <O4- ITJZIP \I , ILSlTLOGGER__1
I FNP.TH I OO WIDTH 'Z/ DFPTH 2. REMARKS.
o
z. -TT-\Z
dl
II 0? 2'
-i———i———i———rLENGTH (FT)
fa.v/
COMMENTS
TP-)2_-^\
o | i {
TEST PIT WALL LOGFORM D1599
'• 3
OIS202.11REV 7/86 FORMD1599
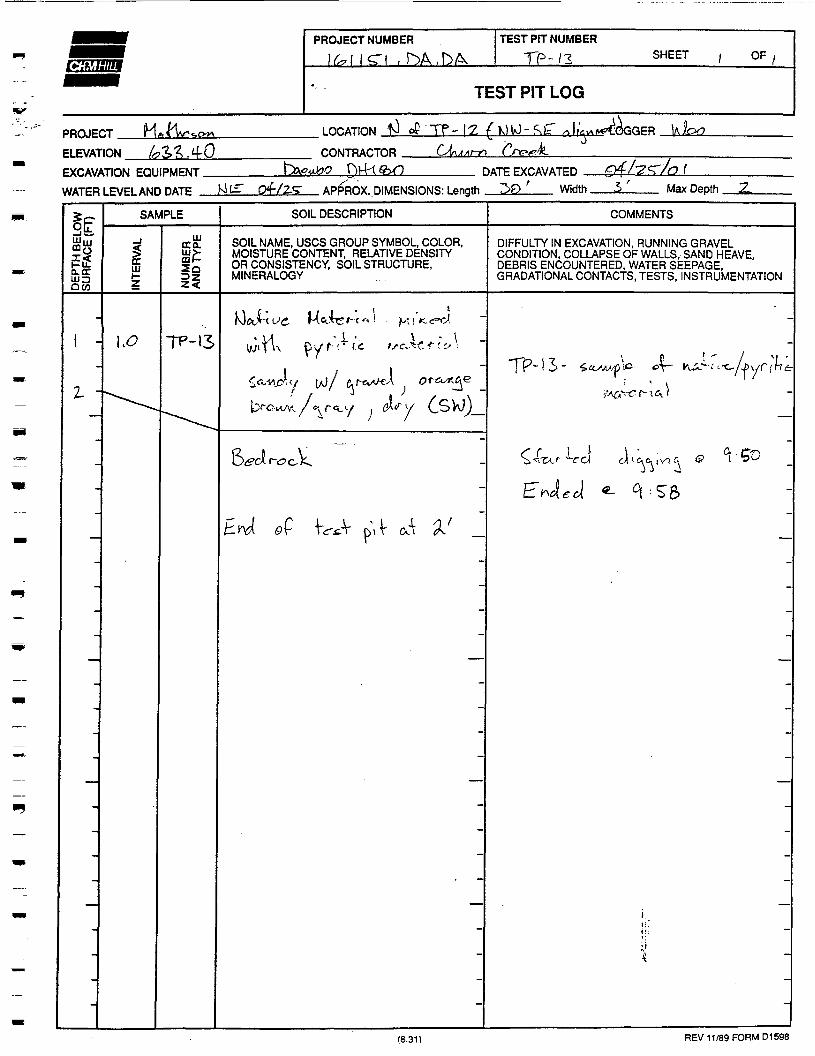
f»-JOTBIIW
PROJECT NUMBER TEST PIT NUMBER
TP-/2 SHEET OF
TEST PIT LOG
PROJECTELEVATION ________EXCAVATION EQUIPMENT.WATER LEVEL AND DATE _
LOCATION t^ of If- |2 /MU-^gT xJ |evv LOGGER.——————— ^j — '7\
CONTRACTOR __DATE FyrtAVATFn OfV^cr/7 f
T Q4-/Z? APPROX. DIMENSIONS: Length Width Max Depth
SAMPLE SOIL DESCRIPTION COMMENTS
Jo iUJ
oco
LUCO.Ul>mf-li
SOIL NAME, USCS GROUP SYMBOL, COLOR,MOISTURE CONTENT, RELATIVE DENSITYOR CONSISTENCY, SOIL STRUCTURE,MINERALOGY
DIFFULTY IN EXCAVATION, RUNNING GRAVELCONDITION, COLLAPSE OF WALLS, SAND HEAVE,DEBRIS ENCOUNTERED, WATER SEEPAGE,GRADATIONAL CONTACTS, TESTS, INSTRUMENTATION
9yf>i
I(".f^iAACA^ . ^
I J
(8.31) REV 11/89 FORM D1598

PROJECT NUMBER TEST PIT NUMBER
TP-MS SHEET OF
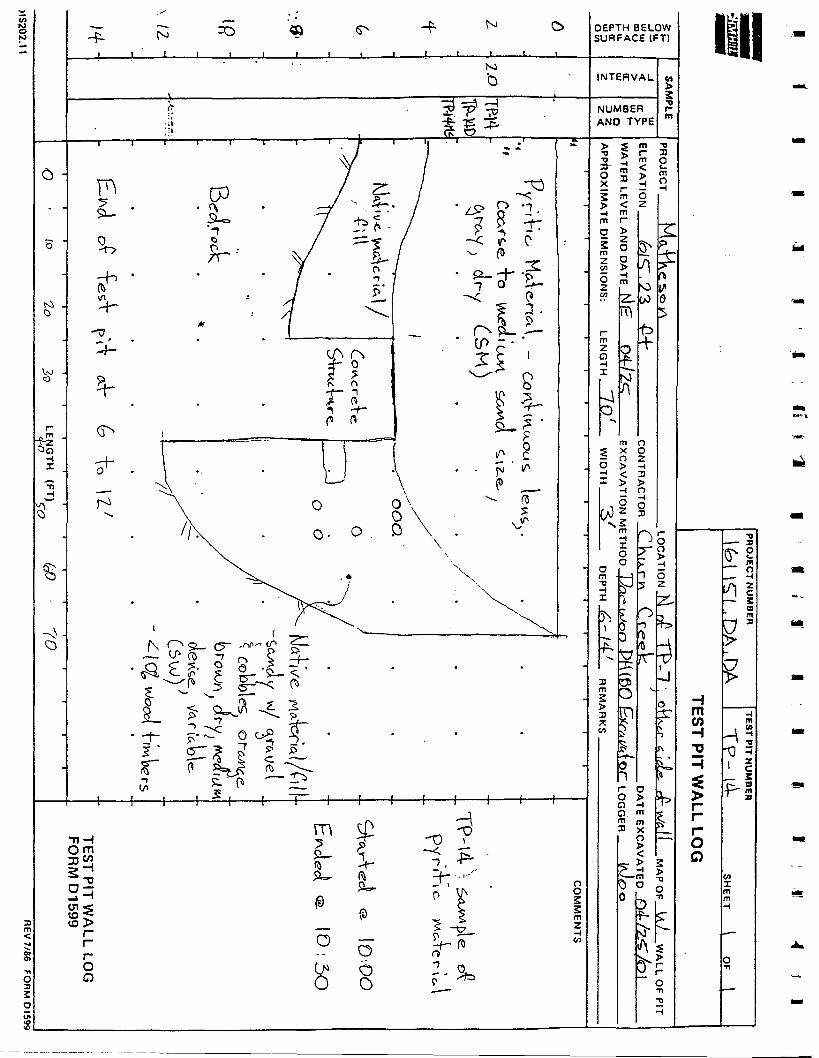
TEST PIT LOG
PROJECT __ELEVATION _EXCAVATION EQUIPMENT.WATER LEVELAND DATE _
LOCATION TP-I4- LOGGER
04- £4" CONTRACTOR___________ DATE EXCAVATED _
f^E P4r/ L APPROX. DIMENSIONS: Length '\Q Width.
Of/Zg/kfMax Depth 4.
SAMPLE SOIL DESCRIPTION COMMENTS
E EDE
P TERV
A
NUM
BER
AND
TYP
E SOIL NAME, USCS GROUP SYMBOL, COLOR,MOISTURE CONTENT, RELATIVE DENSITYOR CONSISTENCY, SOIL STRUCTURE,MINERALOGY
DIFFULTY IN EXCAVATION, RUNNING GRAVELCONDITION, COLLAPSE OF WALLS, SAND HEAVE,DEBRIS ENCOUNTERED, WATER SEEPAGE,GRADATIONAL CONTACTS, TESTS, INSTRUMENTATION
2
Ty
C:
,
tO'.r y . f'^fff. -<
(8.31) REV 11/89 FORM D1598
PROJECT NUMBER1 fo 1 I Cl ,bA.DA
TEST PIT NUMBERSHEET OF
TEST PIT LOG
PROJECT rUFVl
ELEVATION £?2O.O7
LOCATION !> - (4- LOGGER U/fiO/O
EXCAVATION EQUIPMENT.I LEVEL AND DATE _
CONTRACTOR
ftmeoC
DATE EXCAVATED\F fVt/ZC . APPROX. DIMENSIONS: Length 4o' Width Max Depth
SAMPLE SOIL DESCRIPTION COMMENTS
cog£!£&§a«
ccUJ ii
2<
SOIL NAME, USCS GROUP SYMBOL, COLOR,MOISTURE CONTENT, RELATIVE DENSITYOR CONSISTENCY, SOIL STRUCTURE,MINERALOGY
DIFFULTY IN EXCAVATION, RUNNING GRAVELCONDITION, COLLAPSE OF WALLS, SAND HEAVE,DEBRIS ENCOUNTERED, WATER SEEPAGE,GRADATIONAL CONTACTS, TESTS, INSTRUMENTATION
-<e-
W/$ c&v'a'es.
1 6-K
\\'-2.O
©r VcsT >tT oT &.
11'so CQRM
PROJECT NUMBER TEST PIT NUMBERSHEET OF
TEST PIT LOG
PROJECT LOCATION J- TP-.I-7 LOGGER
ELEVATION CONTRACTOREXCAVATION EQUIPMENT DATE EXCAVATED £"f/Z-
WATER LEVEL AND DATE KlE OJ/ZC APPROX. DIMENSIONS: Length Width. Max Depth
SAMPLE SOIL DESCRIPTION COMMENTS
o.trUO003
ILU
LJtro.m>-03 f-li
SOIL NAME, USCS GROUP SYMBOL, COLOR,MOISTURE CONTENT, RELATIVE DENSITYOR CONSISTENCY, SOIL STRUCTURE,MINERALOGY
DIFFULTY IN EXCAVATION, RUNNING GRAVELCONDITION, COLLAPSE OF WALLS, SAND HEAVE,DEBRIS ENCOUNTERED, WATER SEEPAGE,GRADATIONAL CONTACTS, TESTS, INSTRUMENTATION
1,0vj-•' (Oo
TP- (6 - s. CUM fie'
ov.A \ \ , \ A I 1 s)lv TGS.">" ti v"^" CC ' I i o J~ _
(8.31) REV 11/89 FORM D1598
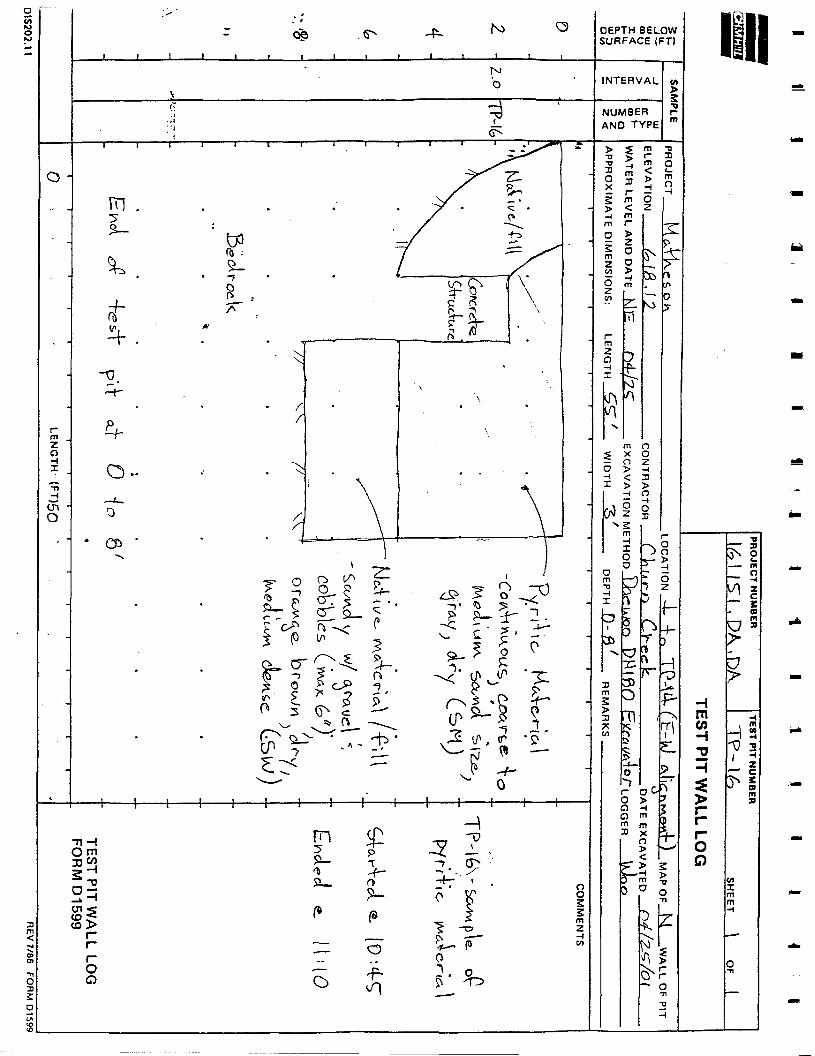
PROJECT NUMBER TEST PIT NUMBERSHEET OF
TEST PIT LOG
PROJECT _ELEVATION
K-JV LOCATION kl of TP-16 LOGGER
CONTRACTOR (_{->&=> fe*EXCAVATION EQUIPMENT. DATE EXCAVATED O4
WATER LEVEL AND DATE Klin o4-/^cT..._ APPROX. DIMENSIONS: Length *f 5"'—— Width. Max Depth 3
>c-9CSAMPLE SOIL DESCRIPTION COMMENTS
a:UJ=)aco
in
UJCO.
11SOIL NAME, USCS GROUP SYMBOL, COLOR,MOISTURE CONTENT, RELATIVE DENSITYOR CONSISTENCY, SOIL STRUCTURE,MINERALOGY
DIFFULTY IN EXCAVATION, RUNNING GRAVELCONDITION, COLLAPSE OF WALLS, SAND HEAVE,DEBRIS ENCOUNTERED, WATER SEEPAGE,GRADATIONAL CONTACTS, TESTS, INSTRUMENTATION
TP-\°( V
.<^ jJ / ^r-sv^.-J . Qr-Z'.'"/,
^/v-rx, dryO^r 'pvf ' ''
e
rOT ^s\
(8.31) REV 11/89 FORM D1598
PROJECT NUMBER TEST PIT NUMBER
TP-Zo SHEET OF
TEST PIT LOG
PROJECT . LOCATION t± TP- \0\ LOGGER tooELEVATION CONTRACTOREXCAVATION EQUIPMENT
WATER LEVELAND DATE KIE"DATE EXCAVATED
APP^OX. DIMENSIONS: Length Width. Max Depth
DEPT
H B
ELO
WSU
RFAC
E (FT
)
1 -
x !3> -
-
-
SAMPLE
INTE
RVAL
NUM
BER
AND
TYP
E
•
SOIL DESCRIPTION
SOIL NAME, USCS GROUP SYMBOL, COLOR,MOISTURE CONTENT, RELATIVE DENSITYOR CONSISTENCY, SOIL STRUCTURE,MINERALOGY
» \ I • i / i I(\JaJr1 <JCs M.6U«re" < <x.l -
co(W«A.( $6<\f .wv«&<i.tfJ( -ft?ct- , Co^uJ"-/ i/J/ Grcc/ye-l) f ^ )
• - \ " \
i ^ C~T ^" r~ f ' C».
pi N | [ . \ l_ SJ'
-
-
COMMENTS
DIFFULTY IN EXCAVATION, RUNNING GRAVELCONDITION.'COLLAPSE OF WALLS, SAND HEAVE,DEBRIS ENCOUNTERED, WATER SEEPAGE,GRADATIONAL CONTACTS, TESTS, INSTRUMENTATION
fO <<? (c.^
^
S4*trttr J1 « 1 2 •' O^>
—
iif- _I!
?
(8.31) REV 11/89 FORM D1598
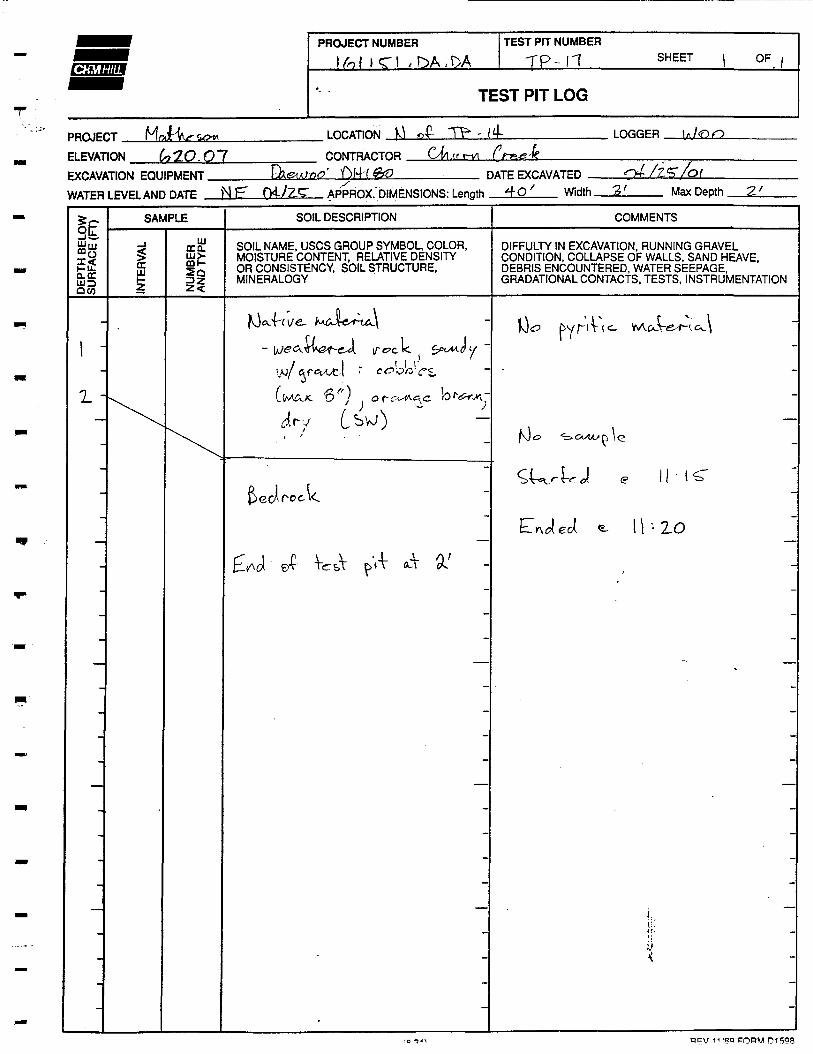
PROJECT NUMBER TEST PIT NUMBER
T P - 7 1 SHEET OF
TEST PIT LOG
PROJECT rA / LOCATION \]ear CiTe LOGGER
ELEVATION ___________EXCAVATION EQUIPMENT___WATER LEVEL AND DATE 4-'
CONTRACTOR
O«/-/7 <T
__________ DATE EXCAVATED _:. DIMENSIONS: Length 2.O Width.
Q4-/Z,K'/CH
Max Depth.
SAMPLE SOIL DESCRIPTION COMMENTS
Q.CCoo00}
£HIz
LUoca.Soz<
SOIL NAME, USCS GROUP SYMBOL, COLOR,MOISTURE CONTENT, RELATIVE DENSITYOR CONSISTENCY, SOIL STRUCTURE,MINERALOGY
DIFFULTY IN EXCAVATION, RUNNING GRAVELCONDITION, COLLAPSE OF WALLS, SAND HEAVE,DEBRIS ENCOUNTERED, WATER SEEPAGE,GRADATIONAL CONTACTS, TESTS, INSTRUMENTATION
Z
f
(o
1
6
5row_A\
TP-21
2CO
P j
(8.31) REV 11/89 FORM D1598
PROJECT NUMBER
I f o f / g 7 .DA .DATEST PIT NUMBER
Tfi-2-Z SHEET
TEST PIT LOG
PROJECT LOCATION VJ 0C T P - LOGGER
ELEVATION ^^.44 £±EXCAVATION EQUIPMENT.WATER LEVEL AND DATE .
Ck<«*AKX7CONTRACTOR• ,014-ffl^
C^\ u.rn Crec k
DATE EXCAVATED Q<f-/Z^/Ot
O4/2.<^ APPROX. DIMENSIONS: Length Width Max Depth.
SAMPLE SOIL DESCRIPTION COMMENTS
eo QHI
UJera.OK
SOIL NAME, USCS GROUP SYMBOL, COLOR,MOISTURE CONTENT, RELATIVE DENSITYOR CONSISTENCY, SOIL STRUCTURE,MINERALOGY
DIFFULTY IN EXCAVATION, RUNNING GRAVELCONDITION, COLLAPSE OF WALLS, SAND HEAVE,DEBRIS ENCOUNTERED, WATER SEEPAGE,GRADATIONAL CONTACTS, TESTS, INSTRUMENTATION
i/e- t
3.0 TP-22 °\ rCoorlyrl ~
&r wcJ-
Iorou/rv\;
e (2.-.3O
do W
S' -
J -
(8.31) REV 11/89 FORM D1598
PROJECT NUMBER TEST PIT NUMBERSHEET OF
TEST PIT LOG
PROJECT _ELEVATION
LOCATION oC LOGGER K/<OO
(oOG. Dr CONTRACTOR Ch<j, ™ Crr.s-k
EXCAVATION EQUIPMENT Lkig^aoWATER LEVEL AND DATE SlF C$-I~L<Z APPROX. DIMENSIONS: Length
DATE EXCAVATFn
1 0/ Width S_ Max Depth.
SAMPLE SOIL DESCRIPTION COMMENTS
cogi-2CLDCQCO
HI
HIoca.co£Soz<
SOIL NAME, USCS GROUP SYMBOL, COLOR,MOISTURE CONTENT, RELATIVE DENSITYOR CONSISTENCY, SOIL STRUCTURE,MINERALOGY
DIFFULTY IN EXCAVATION, RUNNING GRAVELCONDITION, COLLAPSE OF WALLS, SAND HEAVE,DEBRIS ENCOUNTERED, WATER SEEPAGE,GRADATIONAL CONTACTS, TESTS, INSTRUMENTATION
23T.
6 J
TP-13 Co eAy
.
S'6 J 2 : 00
(8.31) REV 11/89 FORM D1598
PROJECT NUMBER TEST PIT NUMBER
TP-24 SHEET OF
TEST PIT LOG
PROJECT LOCATION TP - 12- ( g-
ELEVATION £f CONTRACTOR c/u. ic
EXCAVATION EQUIPMENT.WATER LEVEL AND DATE _
DATE EXCAVATEDMl£ o4-/Z<T APPROX. DIMENSIONS: Length Width. Max Depth I
SAMPLE SOIL DESCRIPTION COMMENTS
o-trUOOW
I01
LUtro.
liz<
SOIL NAME, USCS GROUP SYMBOL, COLOR,MOISTURE CONTENT, RELATIVE DENSITYOR CONSISTENCY, SOIL STRUCTURE,MINERALOGY
DIFFULTY IN EXCAVATION, RUNNING GRAVELCONDITION, COLLAPSE OF WALLS, SAND HEAVE,DEBRIS ENCOUNTERED, WATER SEEPAGE,GRADATIONAL CONTACTS, TESTS, INSTRUMENTATION
v<e_
\3 t-o-vun/ -j-y
CC Vv/A.<r&^!
(8-31) REV 11/89 FORM D1598

PROJECT NUMBER TEST PIT NUMBERSHEET
TEST PIT LOG
PROJECT __ELEVATION ______EXCAVATION EQUIPMENT.WATER LEVEL AND DATE _
LOCATION P-12. LOGGER \k)
£4~ CONTRACTOR Cl/i u ?«. c_
t&O DATE EXCAVATED O4 /2t^/O I. APPROX. DIMENSIONS: Length 3C/ Width ——^__ Max Depth . 1 X
SAMPLE SOIL DESCRIPTION COMMENTS
010
to:OW
UJ
££ooFSOIL NAME, USCS GROUP SYMBOL, COLOR,MOISTURE CONTENT, RELATIVE DENSITYOR CONSISTENCY, SOIL STRUCTURE,MINERALOGY
DIFFULTY IN EXCAVATION, RUNNING GRAVELCONDITION, COLLAPSE OF WALLS, SAND HEAVE,DEBRIS ENCOUNTERED, WATER SEEPAGE,GRADATIONAL CONTACTS, TESTS, INSTRUMENTATION
J .TC
'=),,v;, >viCCCA \ V\
z-
\i-
(8.31) REV 11/89 FORM D1598
PROJECT NUMBER TEST PIT NUMBER
TP-Z6 SHEET OF
TEST PIT LOG
PROJECT __IELEVATION ____________
EXCAVATION EQUIPMENT _£JfiWATER LEVEL AND DATE NE"
. LOCATION -I-
CONTRACTORV«/A «gy-
O4-ZCTDATE EXCAVATED _
APPROX. DIMENSIONS: Length 7,0 f Width.04- ll^ /O (
Max Depth
SAMPLE SOIL DESCRIPTION COMMENTS
ICLCCUJDQCO
SOIL NAME, USCS GROUP SYMBOL, COLOR,MOISTURE CONTENT, RELATIVE DENSITYOR CONSISTENCY, SOIL STRUCTURE,MINERALOGY
DIFFULTY IN EXCAVATION, RUNNING GRAVELCONDITION, COLLAPSE OF WALLS, SAND HEAVE,DEBRIS ENCOUNTERED, WATER SEEPAGE,GRADATIONAL CONTACTS, TESTS, INSTRUMENTATION
C o
D
6 "0
<?.
(CiCvHACl
e.Zr
Sed
\r &.T 1
(8.31) REV 11/89 FORM D1598

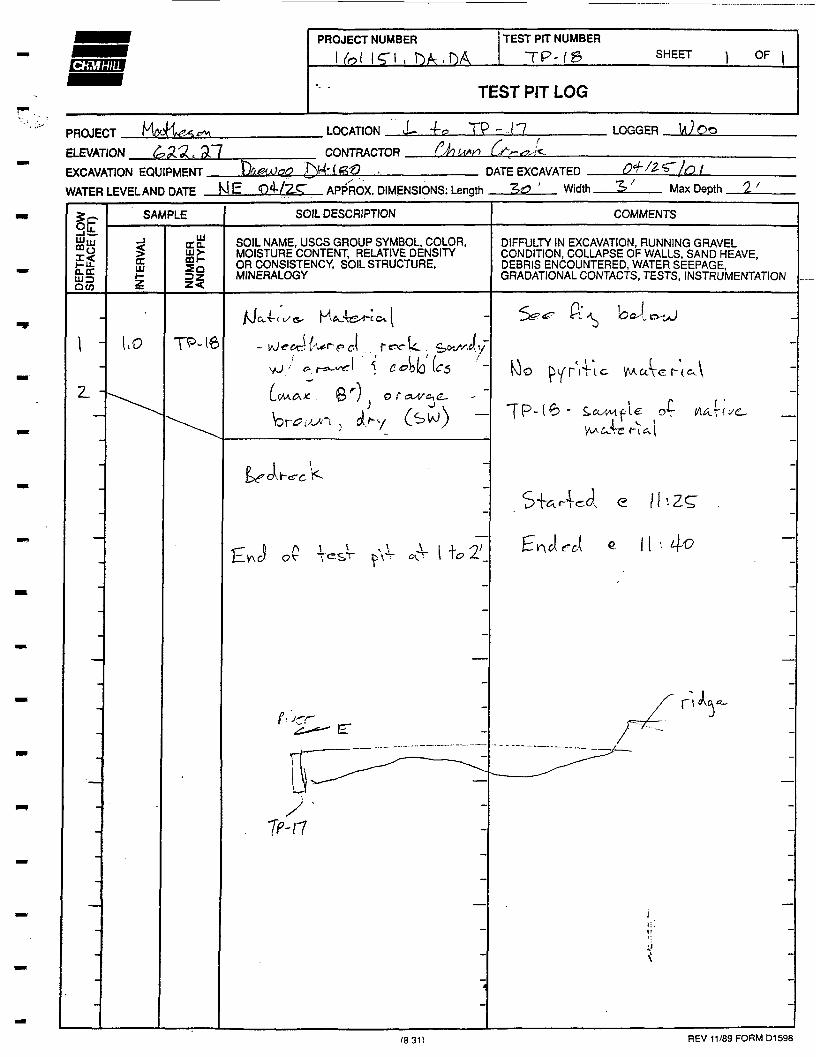
PROJECT NUMBER TEST PIT NUMBERSHEET OF
TEST PIT LOG
PROJECT __ELEVATION ___EXCAVATION EQUIPMENT.WATER LEVEL AND DATE H£ O /?..?
LOCATION UJ TP-I LOGGER,
CONTRACTOR&cenc/A.4 Dt4l&f) DATE EXCAVATED _
. APPROX. DIMENSIONS: Length 2O ' Width. "3' Max Depth
SAMPLE SOIL DESCRIPTION COMMENTS
iQ.OCHOoco
01CCQ.Ul>BDK
II
SOIL NAME, USCS GROUP SYMBOL, COLOR,MOISTURE CONTENT, RELATIVE DENSITYOR CONSISTENCY, SOIL STRUCTURE,MINERALOGY
DIFFULTY IN EXCAVATION, RUNNING GRAVELCONDITION, COLLAPSE OF WALLS, SAND HEAVE,DEBRIS ENCOUNTERED, WATER SEEPAGE,GRADATIONAL CONTACTS, TESTS, INSTRUMENTATION
>o!olCob bit £.') _
£ IS'-ST
2.
BPV 11'89 FORM D1598
PROJECT NUMBER
ifeMs-i .DA .bATEST PIT NUMBER
TP-28 SHEET OF
TEST PIT LOG
PROJECT _ELEVATION
LOCATION
CONTRACTOR ClAu
Hfc LOGGER k)oo
rrv
WATER LEVELAND DATE n4/Z«r APPROX. DIMENSIONS: Length IP Width Max Depth *2.
SAMPLE SOIL DESCRIPTION COMMENTS
Icc
QCO
111CCCL
IISOIL NAME, USCS GROUP SYMBOL, COLOR,MOISTURE CONTENT, RELATIVE DENSITYOR CONSISTENCY. SOIL STRUCTURE,MINERALOGY
DIFFULTY IN EXCAVATION, RUNNING GRAVELCONDITION, COLLAPSE OF WALLS, SAND HEAVE,DEBRIS ENCOUNTERED, WATER SEEPAGE,GRADATIONAL CONTACTS, TESTS, INSTRUMENTATION
T»>U Kk,
i., & l&'-OO
\b--\O
(8.31) REV 11/89 FORM D1598
PROJECT NUMBER TEST PIT NUMBERSHEET OF
TEST PIT LOG
PROJECT n&ir
ELEVATION fe>O4-.
LOCATION ET LOGGERPr-eek
EXCAVATION gDLJIPMENTWATER LEVELAND DATE KiE
&t o rCONTRACTOR _• DMl&O__________ DATE EXCAVATED _
. APF*ROX. DIMENSIONS: Length 20 Width.04- /Zg' /O
Max Depth .
SAMPLE SOIL DESCRIPTION COMMENTS
CCD
OW
UJDCQ.
IISOIL NAME, USCS GROUP SYMBOL, COLOR,MOISTURE CONTENT, RELATIVE DENSITYOR CONSISTENCY, SOIL STRUCTURE,MINERALOGY
DIFFULTY IN EXCAVATION, RUNNING GRAVELCONDITION, COLLAPSE OF WALLS, SAND HEAVE,DEBRIS ENCOUNTERED, WATER SEEPAGE,GRADATIONAL CONTACTS, TESTS, INSTRUMENTATION
Z
3f
3.ouy A
J~
T
> £X
v c. « Itvi
(8.31) REV 11/89 FORM D1598

^^^V PROJECT NUMBER TEST PIT NUMBER
^m
PROJE(ELEVATEXCAWWATER
DEPT
H B
ELO
WSU
RFAC
E (F
T)
1
2
3 -
5"-
TEST PIT LOG
ST MA.H.O C.a*\ LOCATION S AM! ! , / <?= o£ TP 2-^ LOGGER
"ION fTftT- | \- CONTRACTOR £-(M, ™ <V^_ U
VTION EQU
LEVEL ANC
IPMENT E"^/-/M,r/aifl^- - D t A l f t O DATF PyrAVATFD 04-/l£ /O (
i
)DATE 3>' CH- Z< APPROX. DIMENSIONS- Length ^(O^ Width 2' Max DeDth 5=5'
SAMPLE
INTE
RVAL
l.o
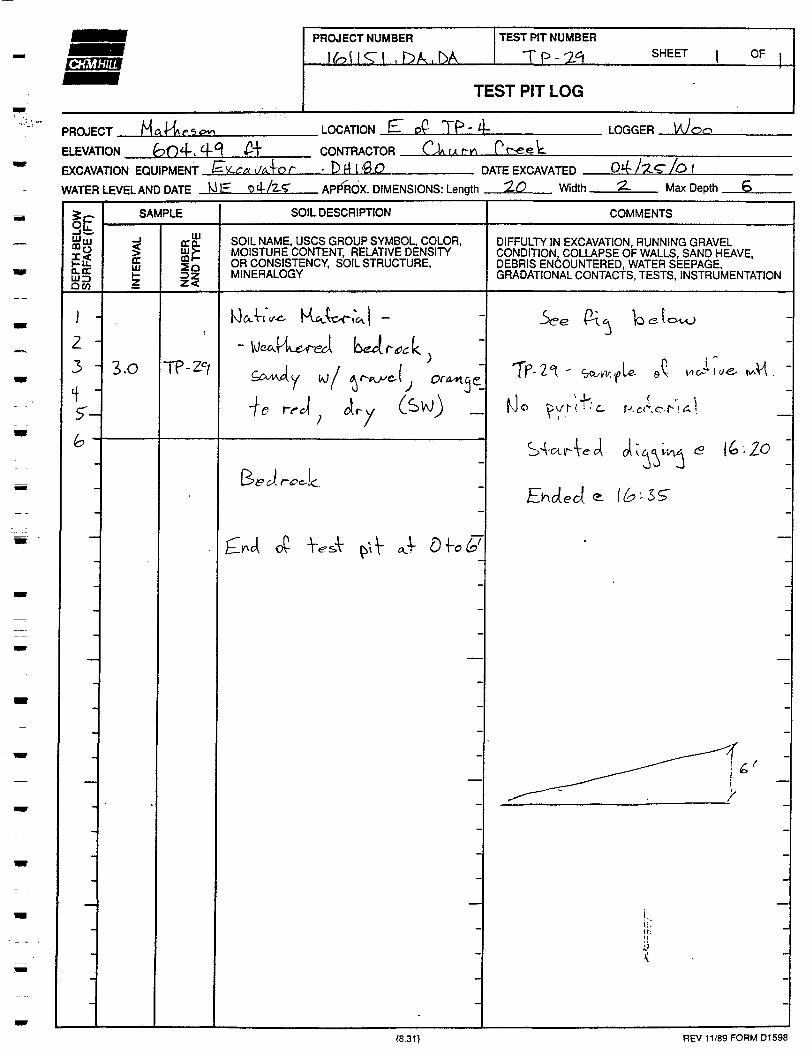
^•^
NU
MBE
RAN
D T
YPE
™
SOIL DESCRIPTION
SOIL NAME, USCS GROUP SYMBOL, COLOR,MOISTURE CONTENT, RELATIVE DENSITYOR CONSISTENCY, SOIL STRUCTURE.MINERALOGY
-CollvuAcJ co'il /w ejd eJ~( ^^\.
<* 1 > ** \ ' )_
r\ \isiH. p|cvfeT(^ f f-v \fj<z\, \a\f \.\ [ " 1 "1*^ I V^ (vJAJH V*C- K -cOr e *^?CL f
tu/ ^ ?/- y^uu^^ ou/^j-1VATO ft iT
COMMENTS
DIFFULTY IN EXCAVATION, RUNNING GRAVELCONDITION, COLLAPSE OF WALLS, SAND HEAVE,DEBRIS ENCOUNTERED, WATER SEEPAGE,GRADAT1ONAL CONTACTS, TESTS, INSTRUMENTATION
I " ( - 1
""-•-±5_ £:nde>o( € IT-OO
i
—
(8.31) REV 11/89 FORM D1598
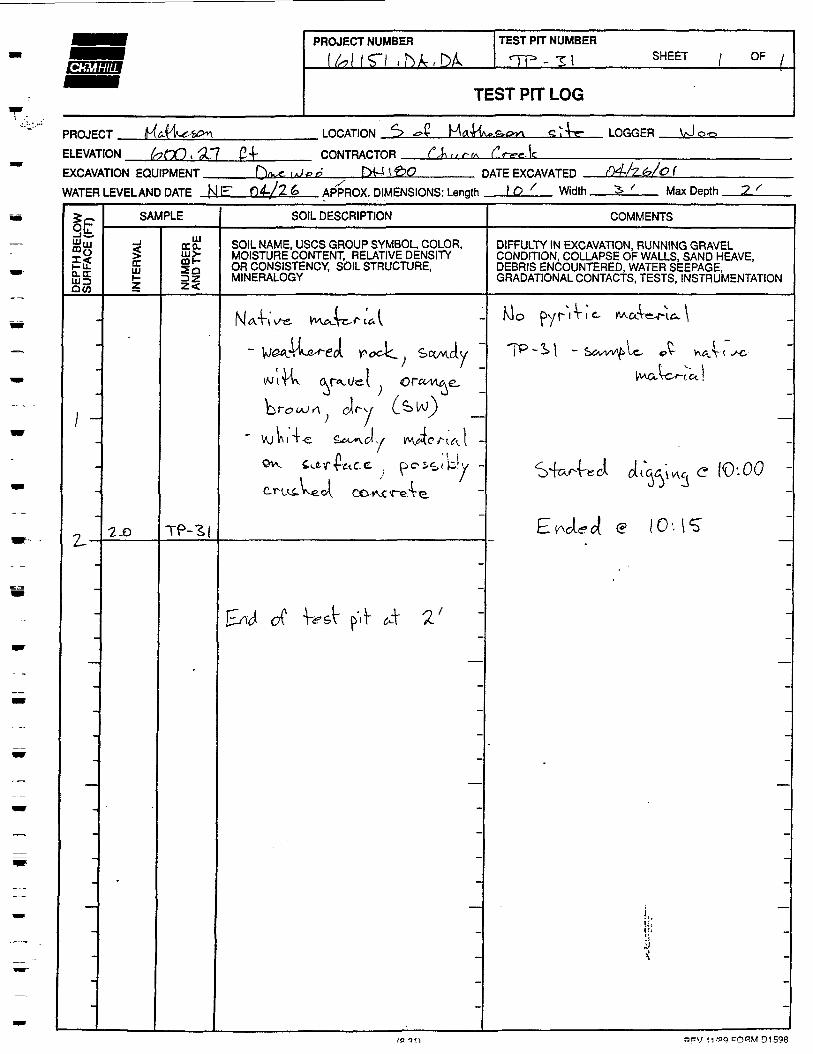
i*;*',/.-//i«PROJECT NUMBER TEST PIT NUMBER
SHEET OF
TEST PIT LOG
PROJECT _ELEVATION
LOCATION £ Mfl-Uv»j£>g>y\ LOGGER
. £7 CJ- CONTRACTOR f <-ff. 1;,|C
EXCAVATION EQUIPMENT.WATER LEVEL AND DATE . APPROX. DIMENSIONS: Length
DATE EXCAVATED>O X Width
( _Max Depth
SAMPLE SOIL DESCRIPTION COMMENTS
llli
Q.CCUJ3QCO
GC111
LUCCOLUJ>-CDH-
II
SOIL NAME, USCS GROUP SYMBOL, COLOR,MOISTURE CONTENT, RELATIVE DENSITYOR CONSISTENCY, SOIL STRUCTURE,MINERALOGY
DIFFULTY IN EXCAVATION, RUNNING GRAVELCONDITION, COLLAPSE OF WALLS, SAND HEAVE,DEBRIS ENCOUNTERED, WATER SEEPAGE,GRADATIONAL CONTACTS, TESTS, INSTRUMENTATION
Nl A.TI \ \^r- I
S»ccMcly
Mo DyriTit. r^cor
" •-> 1 ~ S</vwlf> tc, fi. V <
D
i r-
o" • ; , . , clrv
-e &cc*v..CA-y ^M
i (0:00
2-0 10'.
oc\/ 11/pq FORM 01598
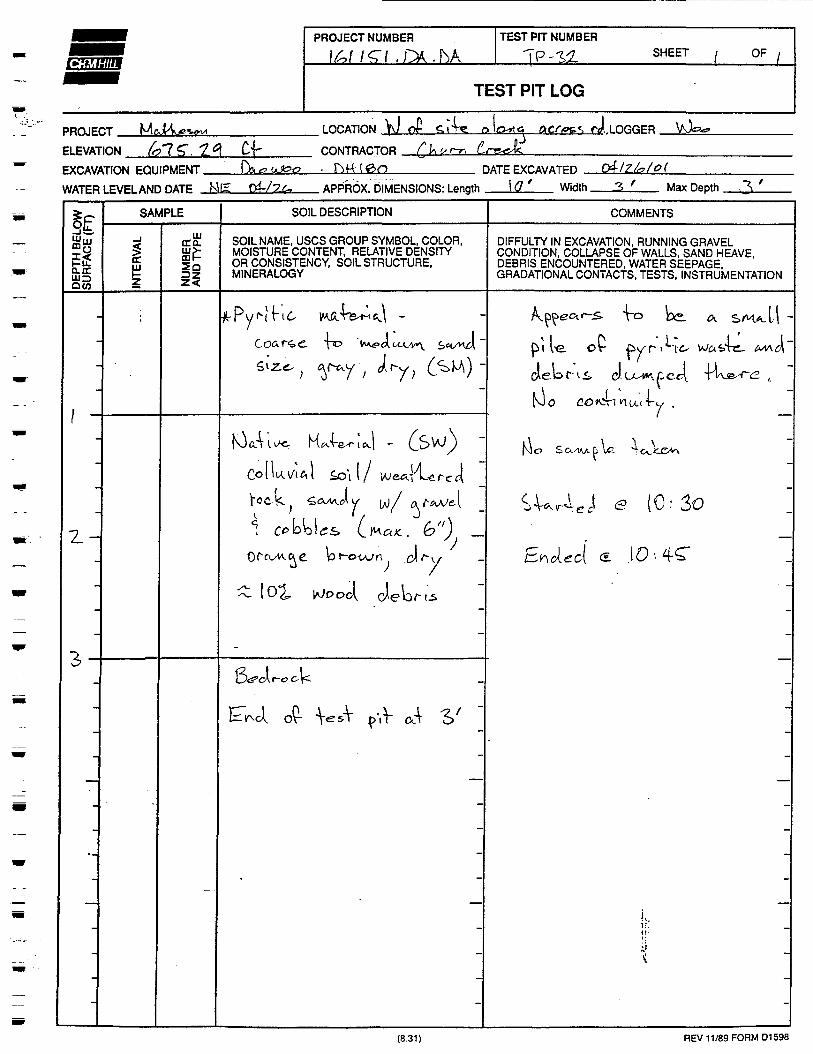
PROJECT NUMBER TEST PIT NUMBERSHEET OF
TEST PIT LOG
PROJECT McjK< LOCATION \J of oSo-rfe; QCAoc.*. ra1. LOGGER .
ELEVATION £". t°( CffkEXCAVATION EQUIPMENT _
WATER LEVELAND DATE Kig o4-/2.g.
CONTRACTOR(e>r>
. APPROX. DIMENSIONS: LengthDATE EXCAVATED
i f f '04/ZJ*/0<
Width .3' Max Depth. ~\'
SAMPLE SOIL DESCRIPTION COMMENTS
:•£.<rQco
m(to.
11SOIL NAME, USCS GROUP SYMBOL, COLOR,MOISTURE CONTENT, RELATIVE DENSITYOR CONSISTENCY. SOIL STRUCTURE,MINERALOGY
DIFFULTY IN EXCAVATION, RUNNING GRAVELCONDITION, COLLAPSE OF WALLS, SAND HEAVE,DEBRIS ENCOUNTERED, WATER SEEPAGE,GRADATIONAL CONTACTS, TESTS, INSTRUMENTATION
to jii le or >U.
JW.I-
r e1-ocK ^
. c^v /
(0:30
(8.31) REV 11/89 FORM D1598
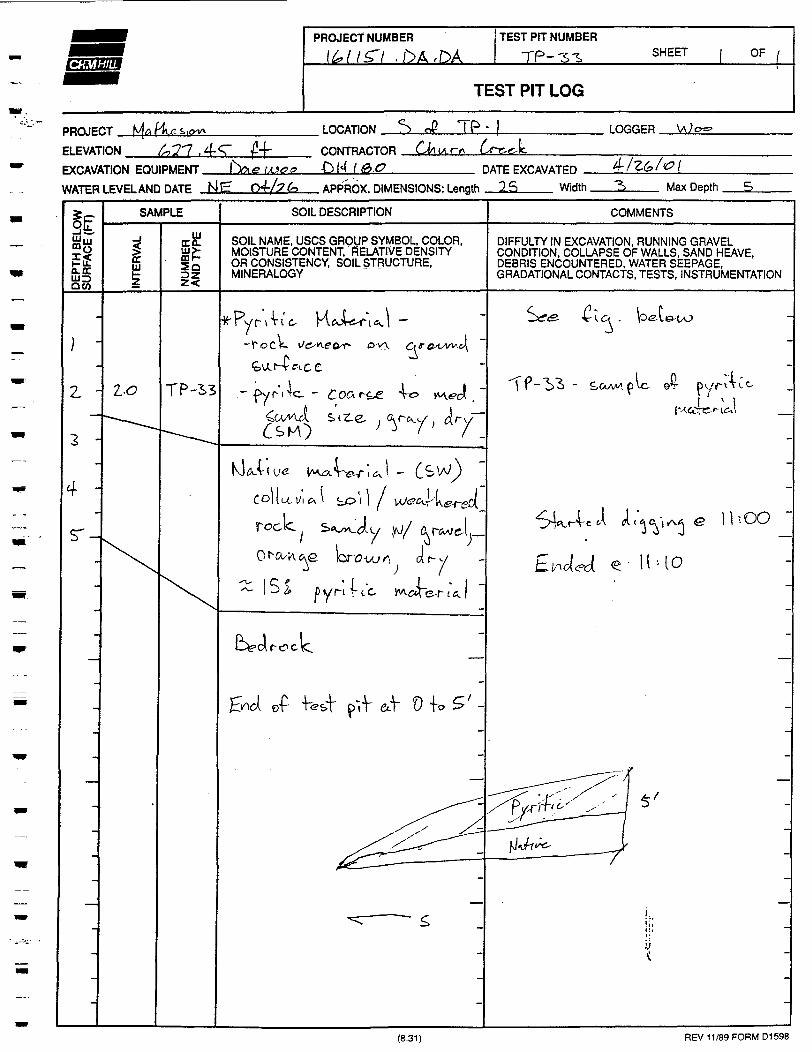
PROJECT NUMBER TEST PIT NUMBERSHEET OF
TEST PIT LOG
PROJECT Ma fig s-frv* LOCATION S oP TP • LOGGER
ELEVATION ___ CONTRACTORtjuoo £>K f 0.<?EXCAVATION EQUIPMENT _
WATER LEVEL AND DATE Ng o4-/?fe APPROX. DIMENSIONS: Length ISDATE EXCAVATED 4-/Z&/&.1
Width Max Depth
SAMPLE SOIL DESCRIPTION COMMENTS
im
CQ-
39SOIL NAME, USCS GROUP SYMBOL, COLOR,MOISTURE CONTENT, RELATIVE DENSITYOR CONSISTENCY, SOIL STRUCTURE,MINERALOGY
DIFFULTY IN EXCAVATION, RUNNING GRAVELCONDITION, COLLAPSE OF WALLS, SAND HEAVE,DEBRIS ENCOUNTERED, WATER SEEPAGE,GRADATIONAL CONTACTS, TESTS, INSTRUMENTATION
*-(
-ITock
& .
ovy aTP-S3 ^&
4 -
r-C o u. i/i o,i o, \ bo M
I -> £ C y ri {- c c
U ' - I O
f 0
(8.31) REV 11/89 FORM D1598

SB™ '
PROJECT NUMBER
\b\\Z\ -DA,D/TEST PIT NUMBER
k TP-36 SHEET | OF |
TEST PIT LOG
PROJECT \4aJA*rAt>* LOCATION S oQ-
ELEVATION (r> \ 3. S£> £4~ CONTRACTOR ^_dkEXCAVATION EQUIPMENT Drt ixVCT*? • DM f «<0
TP-32> "" TP-S4(Arr\ Prr .L
DATF FXCAVATFD
LOGGER !A /OO
O4-f2Jofo\
WATER LEVEL AND DATE NE" APP'ROX. DIMENSIONS: Length Width. Max Depth
SAMPLE SOIL DESCRIPTION COMMENTS
ccuoO«
UJITCLILJ>cof-SOIL NAME, USCS GROUP SYMBOL, COLOR,MOISTURE CONTENT, RELATIVE DENSITYOR CONSISTENCY, SOIL STRUCTURE,MINERALOGY
DIFFULTY IN EXCAVATION, RUNNING GRAVELCONDITION, COLLAPSE OF WALLS, SAND HEAVE,DEBRIS ENCOUNTERED, WATER SEEPAGE,GRADATIONAL CONTACTS, TESTS, INSTRUMENTATION
K) TCC
CHr
TP-15 <5>< CA^
j 'n , e /f : 3,0
(8.31) REV 11/89 FORM D1598
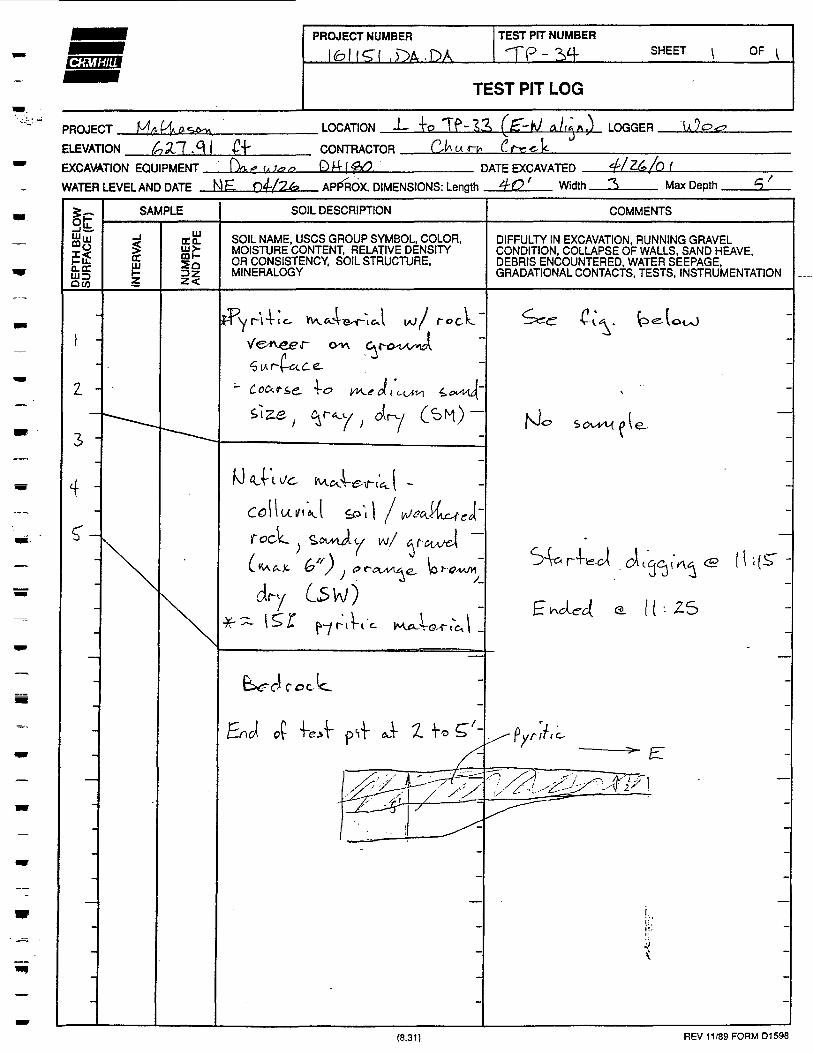
PROJECT NUMBER
ci .DA. DATEST PIT NUMBER
TP-2>4 SHEET OF
TEST PIT LOG
.3 IPROJECT __IELEVATION _EXCAVATION EQUIPMENT 1)
WATER LEVEL AND DATE N£
LOCATION -L fa Tf*-23> - a./>f i f tJ LOGGER ^O.
CONTRACTORDATE EXCAVATED (_
APFflOX. DIMENSIONS: Length Width Max Depth.
SAMPLE SOIL DESCRIPTION COMMENTS
UJD0(0
01nco.UJ>oo f-
11SOIL NAME, USCS GROUP SYMBOL, COLOR,MOISTURE CONTENT, RELATIVE DENSITYOR CONSISTENCY, SOIL STRUCTURE,MINERALOGY
DIFFULTY IN EXCAVATION, RUNNING GRAVELCONDITION, COLLAPSE OF WALLS, SAND HEAVE,DEBRIS ENCOUNTERED, WATER SEEPAGE,GRADATIONAL CONTACTS, TESTS, INSTRUMENTATION
Jf-v MTi i J/
T a(
N A^ri t/e
C5W)' -» *• M r t c.
'. ZS
rot
,T- 1 TO gX-
(8.31) REV 11/89 FORM D1598
Appendix DAnalytical Results
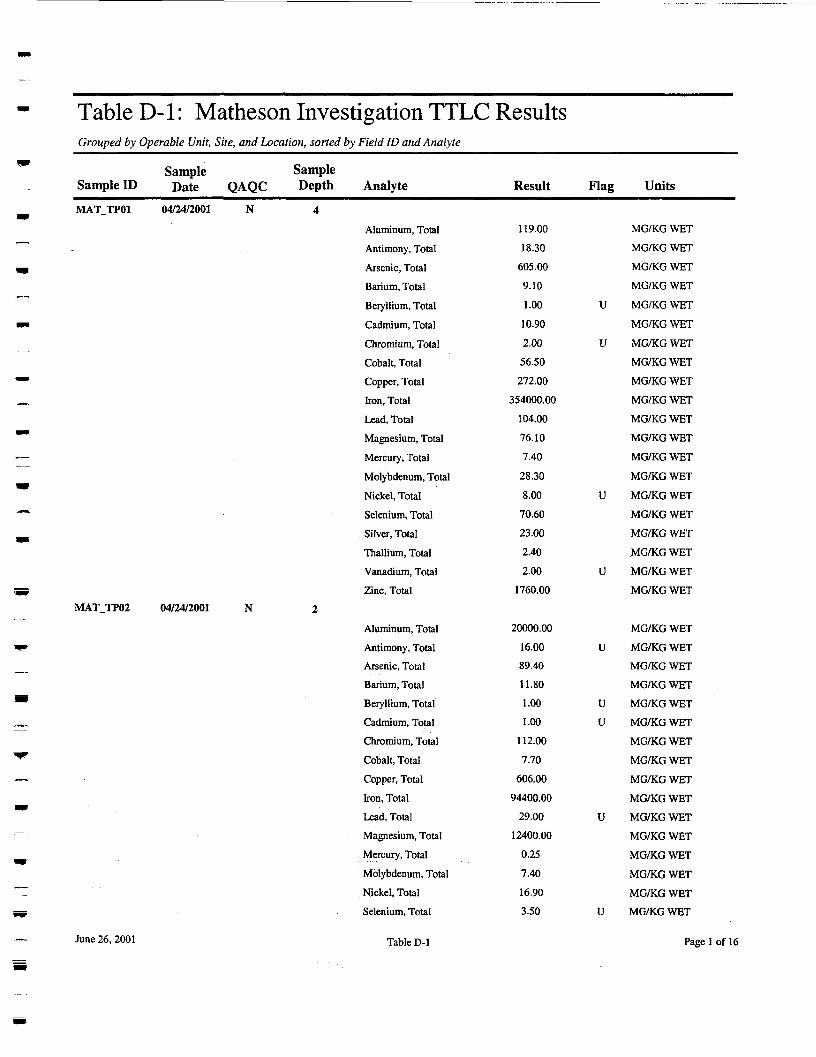
Table D-1: Matheson Investigation TTLC ResultsGrouped by Operable Unit, Site, and Location, sorted by Field ID and Analyte
Sample SampleSample ID Date QAQC Depth AnalyteMATJTPOl 04/24/2001 N 4
Aluminum, TotalAntimony, TotalArsenic, TotalBarium, TotalBeryllium, TotalCadmium, TotalChromium, TotalCobalt, TotalCopper, TotalIron, TotalLead, TotalMagnesium, TotalMercury, TotalMolybdenum, TotalNickel, TotalSelenium, TotalSilver, TotalThallium, TotalVanadium, TotalZinc, Total
MAT_TP02 04/24/2001 N 2
Aluminum, TotalAntimony, TotalArsenic, TotalBarium, TotalBeryllium, TotalCadmium, TotalChromium, TotalCobalt, TotalCopper, TotalIron, TotalLead, TotalMagnesium, TotalMercury, Total
Molybdenum, TotalNickel, TotalSelenium, Total
Result
119.0018.30
605.009.101.00
10.902.0056.50272.00
354000.00104.0076.107.40
28.308.00
70.6023.002.402.00
1760.00
20000.0016.0089.40
11.801.001.00
112.007.70
606.0094400.00
29.0012400.00
0.25
7.4016.903.50
Flag Units
MG/KG WETMG/KG WETMG/KG WETMG/KG WET
U MG/KG WETMG/KG WET
U MG/KG WETMG/KG WETMG/KG WETMG/KG WETMG/KG WETMG/KG WETMG/KG WET
MG/KG WET
U MG/KG WETMG/KG WETMG/KG WETMG/KG WET
U MG/KG WETMG/KG WET
MG/KG WETU MG/KG WET
MG/KG WETMG/KG WET
U MG/KG WETU MG/KG WET
MG/KG WETMG/KG WETMG/KG WETMG/KG WET
U MG/KG WETMG/KG WETMG/KG WET
MG/KG WETMG/KG WET
U MG/KG WET
June 26, 2001 Table D-1 Page 1 of 16
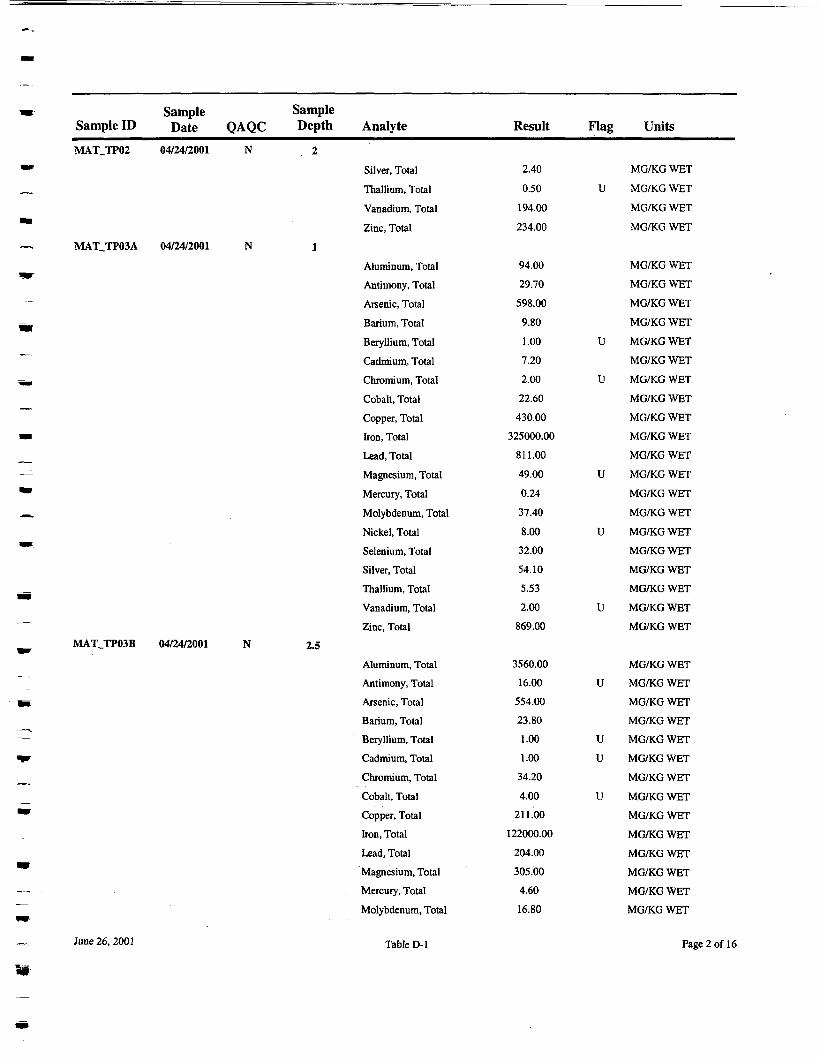
Sample SampleSample ID Date QAQC Depth AnalyteMAT_TP02 04/24/2001 N 2
Silver, TotalThallium, TotalVanadium, Total
Zinc, TotalMATJTP03A 04/24/2001 N 1
Aluminum, TotalAntimony, TotalArsenic, TotalBarium, TotalBeryllium, TotalCadmium, TotalChromium, TotalCobalt, TotalCopper, TotalIron, TotalLead, TotalMagnesium, TotalMercury, TotalMolybdenum, TotalNickel, TotalSelenium, TotalSilver, TotalThallium, TotalVanadium, TotalZinc, Total
MATJTP03B 04/24/2001 N 2.5
Aluminum, Total
Antimony, TotalArsenic, TotalBarium, TotalBeryllium, TotalCadmium, TotalChromium, TotalCobalt, TotalCopper, TotalIron, TotalLead, TotalMagnesium, TotalMercury, Total
Molybdenum, Total
Result
2.40
0.50
194.00234.00
94.0029.70
598.009.801.007.202.0022.60
430.00325000.00
811.0049.000.24
37.408.0032.0054.105.532.00
869.00
3560.0016.00
554.0023.801.001.00
34.204.00
211.00122000.00
204.00305.004.6016.80
Flag Units
MG/KG WETU MG/KG WET
MG/KG WETMG/KG WET
MG/KG WETMG/KG WETMG/KG WETMG/KG WET
U MG/KG WETMG/KG WET
U MG/KG WETMG/KG WETMG/KG WETMG/KG WETMG/KG WET
U MG/KG WETMG/KG WETMG/KG WET
U MG/KG WETMG/KG WETMG/KG WETMG/KG WET
U MG/KG WETMG/KG WET
MG/KG WETU MG/KG WET
MG/KG WETMG/KG WET
U MG/KG WETU MG/KG WET
MG/KG WETU MG/KG WET
MG/KG WETMG/KG WETMG/KG WETMG/KG WETMG/KG WETMG/KG WET
June 26, 2001
mTable D-l Page 2 of 16
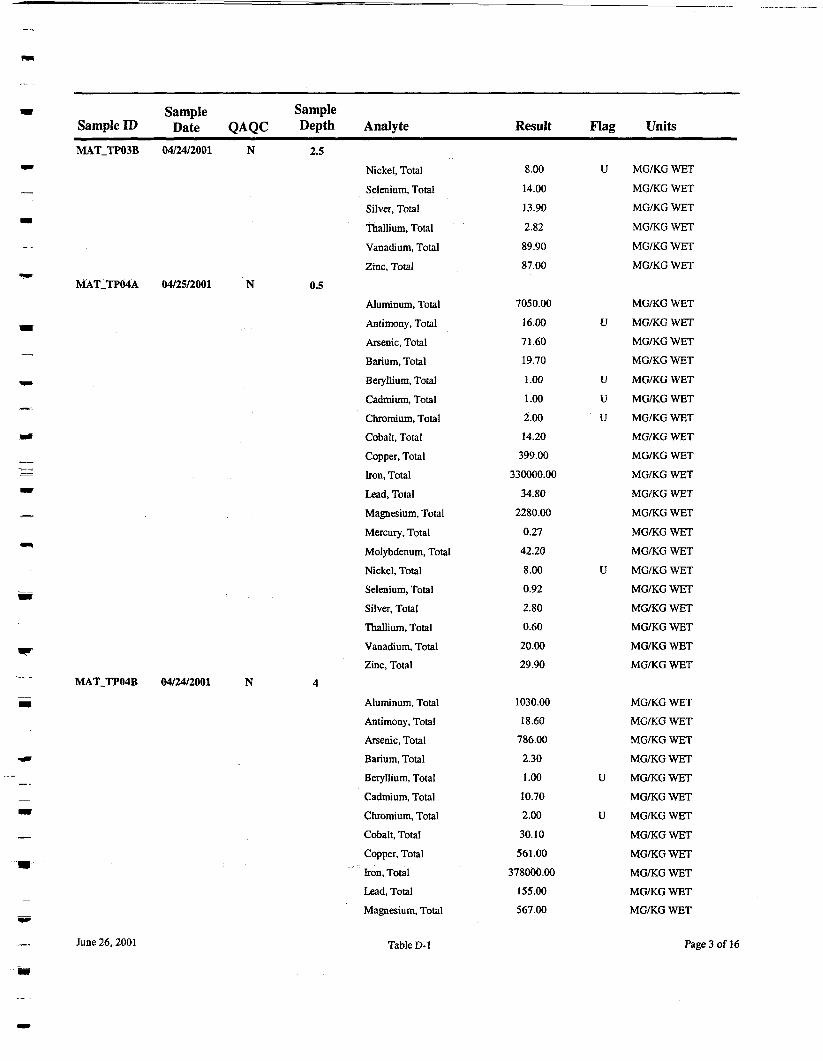
Sample SampleSample ID Date QAQC Depth AnalyteMAT_TP03B 04/24/2001 N 2.5
Nickel, Total
Selenium, TotalSilver, TotalThallium, TotalVanadium, TotalZinc, Total
MAT_TP04A 04/25/2001 N 0.5
Aluminum, TotalAntimony, TotalArsenic, TotalBarium, TotalBeryllium, TotalCadmium, TotalChromium, TotalCobalt, TotalCopper, TotalIron, TotalLead, TotalMagnesium, TotalMercury, Total
Molybdenum, TotalNickel, TotalSelenium, TotalSilver, TotalThallium, TotalVanadium, TotalZinc, Total
MATJTP04B 04/24/2001 N 4
Aluminum, TotalAntimony, TotalArsenic, TotalBarium, TotalBeryllium, TotalCadmium, TotalChromium, TotalCobalt, TotalCopper, TotalIron, TotalLead, TotalMagnesium, Total
Result
8.0014.0013.90
2.8289.9087.00
7050.00
16.0071.6019.701.001.002.0014.20
399.00330000.00
34.802280.00
0.2742.208.000.922.800.60
20.0029.90
1030.0018.60
786.002.301.0010.702.0030.10561.00
378000.00155.00567.00
Flag Units
U MG/KG WETMG/KG WETMG/KG WET
MG/KG WET
MG/KG WETMG/KG WET
MG/KG WETU MG/KG WET
MG/KG WETMG/KG WET
U MG/KG WETU MG/KG WETU MG/KG WET
MG/KG WETMG/KG WETMG/KG WETMG/KG WETMG/KG WET
MG/KG WETMG/KG WET
U MG/KG WETMG/KG WETMG/KG WETMG/KG WETMG/KG WETMG/KG WET
MG/KG WETMG/KG WETMG/KG WETMG/KG WET
U MG/KG WETMG/KG WET
U MG/KG WETMG/KG WETMG/KG WETMG/KG WETMG/KG WETMG/KG WET
June 26, 2001 Table D-l Page 3 of 16
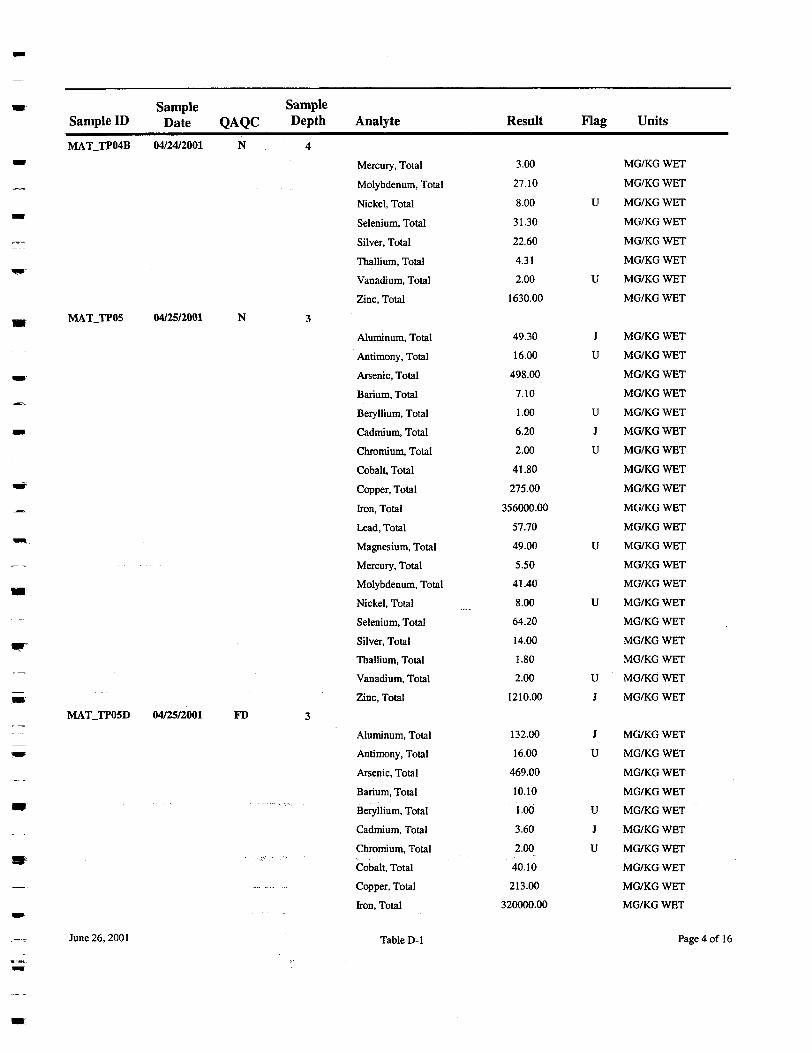
Sample SampleSample ID Date QAQC Depth AnaiyteMAT_TP04B 04/24/2001 N 4
Mercury, TotalMolybdenum, TotalNickel, TotalSelenium, TotalSilver, Total
Thallium, TotalVanadium, Total
Zinc, TotalMATJTP05 04/25/2001 N 3
Aluminum, Total
Antimony, TotalArsenic, TotalBarium, Total
Beryllium, TotalCadmium, TotalChromium, TotalCobalt, TotalCopper, TotalIron, TotalLead, TotalMagnesium, TotalMercury, TotalMolybdenum, TotalNickel, Total
Selenium, Total
Silver, TotalThallium, TotalVanadium, TotalZinc, Total
MATJTP05D 04/25/2001 FD 3
Aluminum, TotalAntimony, Total
Arsenic, Total
Barium, TotalBeryllium, TotalCadmium, TotalChromium, TotalCobalt, Total
— — . - - . - . Copper, Total
Iron, Total
Result
3.0027.10
8.0031.3022.60
4.312.00
1630.00
49.3016.00
498.00
7.101.006.202.00
41.80275.00
356000.00
57.7049.00
5.5041.408.00
64.20
14.001.802.00
1210.00
132.0016.00
469.00
10.101.003.602.00
40.10213.00
320000.00
Flag
u
u
ju
uJu
u
u
uJ
Ju
uJu
Units
MG/KG WET
MG/KG WET
MG/KG WET
MG/KG WET
MG/KG WET
MG/KG WETMG/KG WET
MG/KG WET
MG/KG WETMG/KG WET
MG/KG WETMG/KG WET
MG/KG WETMG/KG WETMG/KG WET
MG/KG WET
MG/KG WET
MG/KG WET
MG/KG WETMG/KG WETMG/KG WETMG/KG WET
MG/KG WETMG/KG WET
MG/KG WETMG/KG WETMG/KG WETMG/KG WET
MG/KG WET
MG/KG WET
MG/KG WET
MG/KG WETMG/KG WET
MG/KG WET
MG/KG WETMG/KG WETMG/KG WETMG/KG WET
June 26,2001 Table D-l Page 4 of 16
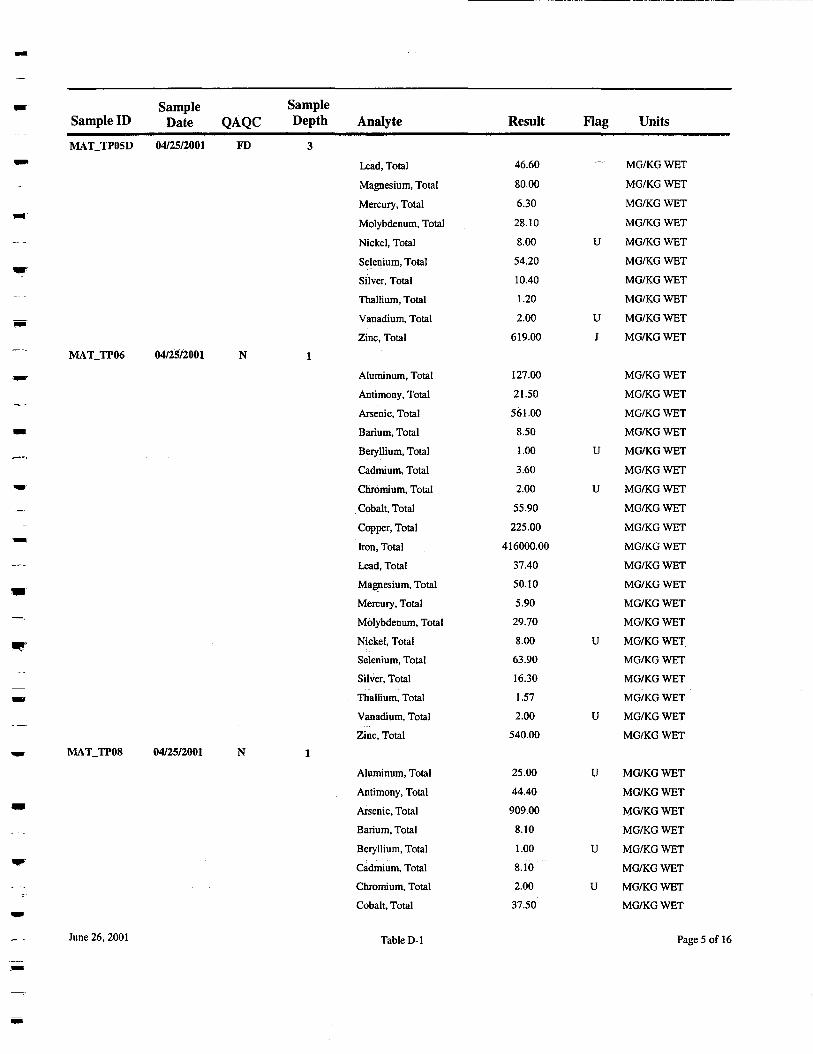
Sample SampleSample ID Date QAQC Depth AnalyteMATJTPOSD 04/25/2001 FD 3
Lead, TotalMagnesium, TotalMercury, Total
Molybdenum, TotalNickel, TotalSelenium, TotalSilver, TotalThallium, TotalVanadium, TotalZinc, Total
MATJTP06 04/25/2001 N 1
Aluminum, TotalAntimony, TotalArsenic, TotalBarium, TotalBeryllium, TotalCadmium, TotalChromium, TotalCobalt, TotalCopper, TotalIron, TotalLead, TotalMagnesium, TotalMercury, TotalMolybdenum, TotalNickel, TotalSelenium, TotalSilver, TotalThallium, TotalVanadium, TotalZinc, Total
MAT_TP08 04/25/2001 N 1
Aluminum, TotalAntimony, TotalArsenic, TotalBarium, TotalBeryllium, TotalCadmium, TotalChromium, TotalCobalt, Total
Result
46.60
80.006.30
28.108.0054.2010.401.202.00
619.00
127.0021.50561.00
8.501.003.602.0055.90225.00
416000.0037.4050.105.9029.708.0063.9016.301.572.00
540.00
25.0044.40909.00
8.101.008.102.0037.50
Flag Units
— MG/KG WET
MG/KG WETMG/KG WET
MG/KG WETU MG/KG WET
MG/KG WETMG/KG WETMG/KG WET
U MG/KG WETJ MG/KG WET
MG/KG WETMG/KG WETMG/KG WETMG/KG WET
U MG/KG WETMG/KG WET
U MG/KG WETMG/KG WETMG/KG WETMG/KG WETMG/KG WETMG/KG WETMG/KG WETMG/KG WET
U MG/KG WETMG/KG WETMG/KG WETMG/KG WET
U MG/KG WETMG/KG WET
U MG/KG WETMG/KG WETMG/KG WETMG/KG WET
U MG/KG WETMG/KG WET
U MG/KG WETMG/KG WET
June 26, 2001 Table D-l Page 5 of 16
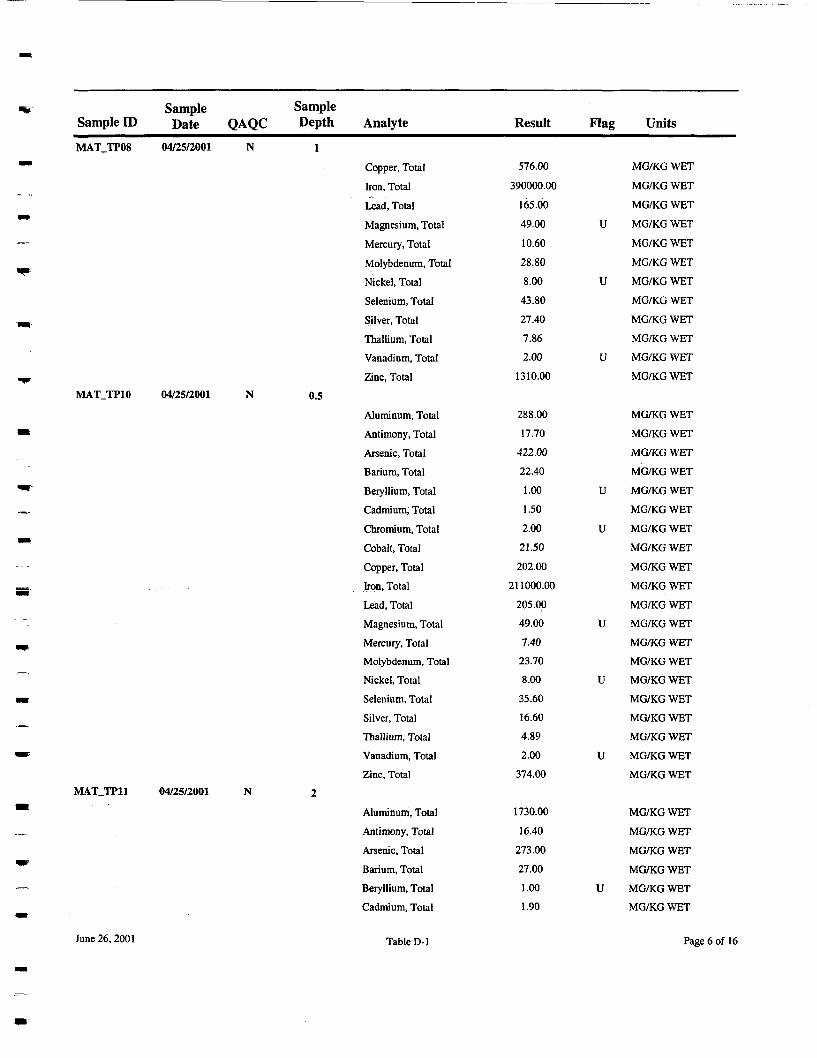
m
Sample SampleSample ID Date QAQC Depth AnalyteMATJTP08 04/25/2001 N 1
Copper, TotalIron, TotalLead, TotalMagnesium, TotalMercury, TotalMolybdenum, TotalNickel, TotalSelenium, TotalSilver, TotalThallium, TotalVanadium, TotalZinc, Total
MAT_TP10 04/25/2001 N 0.5
Aluminum, TotalAntimony, TotalArsenic, TotalBarium, TotalBeryllium, TotalCadmium, Total
Chromium, TotalCobalt, TotalCopper, TotalIron, Total
Lead, TotalMagnesium, TotalMercury, TotalMolybdenum, TotalNickel, TotalSelenium, TotalSilver, TotalThallium, TotalVanadium, TotalZinc, Total
MATJTPll 04/25/2001 N 2
Aluminum, TotalAntimony, TotalArsenic, TotalBarium, TotalBeryllium, TotalCadmium, Total
Result
576.00
390000.00165.0049.00
10.6028.808.00
43.8027.407.862.00
1310.00
288.0017.70
422.0022.401.001.502.00
21.50202.00
211000.00205.0049.007.4023.708.00
35.6016.604.892.00
374.00
1730.0016.40
273.0027.001.001.90
Flag Units
MG/KG WET
MG/KG WETMG/KG WET
U MG/KG WET
MG/KG WETMG/KG WET
U MG/KG WETMG/KG WETMG/KG WETMG/KG WET
U MG/KG WETMG/KG WET
MG/KG WETMG/KG WETMG/KG WETMG/KG WET
U MG/KG WETMG/KG WET
U MG/KG WETMG/KG WETMG/KG WETMG/KG WETMG/KG WET
U MG/KG WETMG/KG WETMG/KG WET
U MG/KG WETMG/KG WETMG/KG WETMG/KG WET
U MG/KG WETMG/KG WET
MG/KG WETMG/KG WETMG/KG WETMG/KG WET
U MG/KG WETMG/KG WET
June 26,2001 Table D-l Page 6 of 16
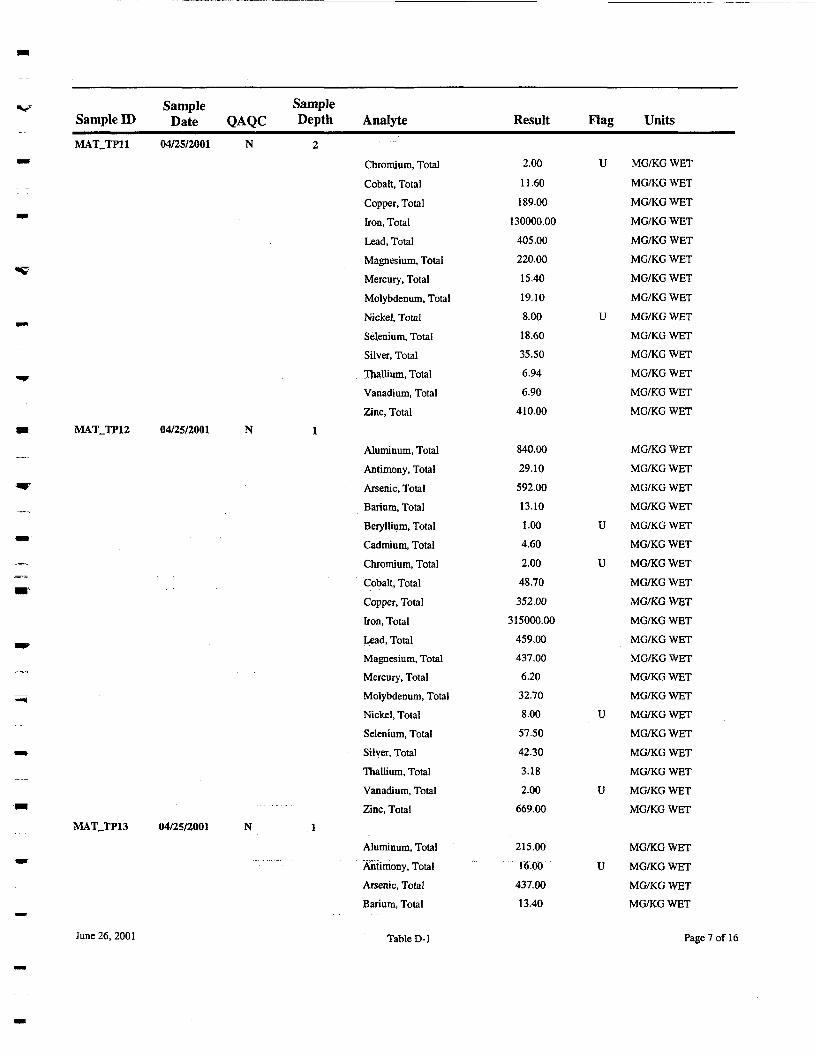
Sample SampleSample ID Date QAQC Depth AnalyteMAT_TP11 04/25/2001 N 2
Chromium, TotalCobalt, TotalCopper, TotalIron, TotalLead, TotalMagnesium, TotalMercury, TotalMolybdenum, TotalNickel, Total
Selenium, TotalSilver, TotalThallium, TotalVanadium, TotalZinc.Total
MAT_TP12 04/25/2001 N 1
Aluminum, TotalAntimony, TotalArsenic, TotalBarium, TotalBeryllium, TotalCadmium, TotalChromium, TotalCobalt, TotalCopper, TotalIron, TotalLead, TotalMagnesium, Total
Mercury, TotalMolybdenum, TotalNickel, TotalSelenium, TotalSilver, TotalThallium, TotalVanadium, TotalZinc.Total
MAT_TP13 04/25/2001 N 1
Aluminum, TotalAntimony, TotalArsenic, TotalBarium, Total
Result
2.00
11.60189.00
130000.00405.00220.0015.4019.108.0018.6035.506.946.90
410.00
840.00
29.10592.0013.101.004.602.0048.70352.00
315000.00459.00437,006.2032.708.0057.5042.303.182.00
669.00
215.0016.00
437.0013.40
Flag Units
U MG/KG WET
MG/KG WETMG/KG WET
MG/KG WETMG/KG WETMG/KG WETMG/KG WETMG/KG WET
U MG/KG WETMG/KG WETMG/KG WETMG/KG WETMG/KG WETMG/KG WET
MG/KG WET
MG/KG WETMG/KG WETMG/KG WET
U MG/KG WET
MG/KG WETU MG/KG WET
MG/KG WETMG/KG WETMG/KG WETMG/KG WETMG/KG WET
MG/KG WETMG/KG WET
U MG/KG WETMG/KG WETMG/KG WETMG/KG WET
U MG/KG WETMG/KG WET
MG/KG WET
U MG/KG WETMG/KG WETMG/KG WET
June 26, 2001 Table D-l Page 7 of 16
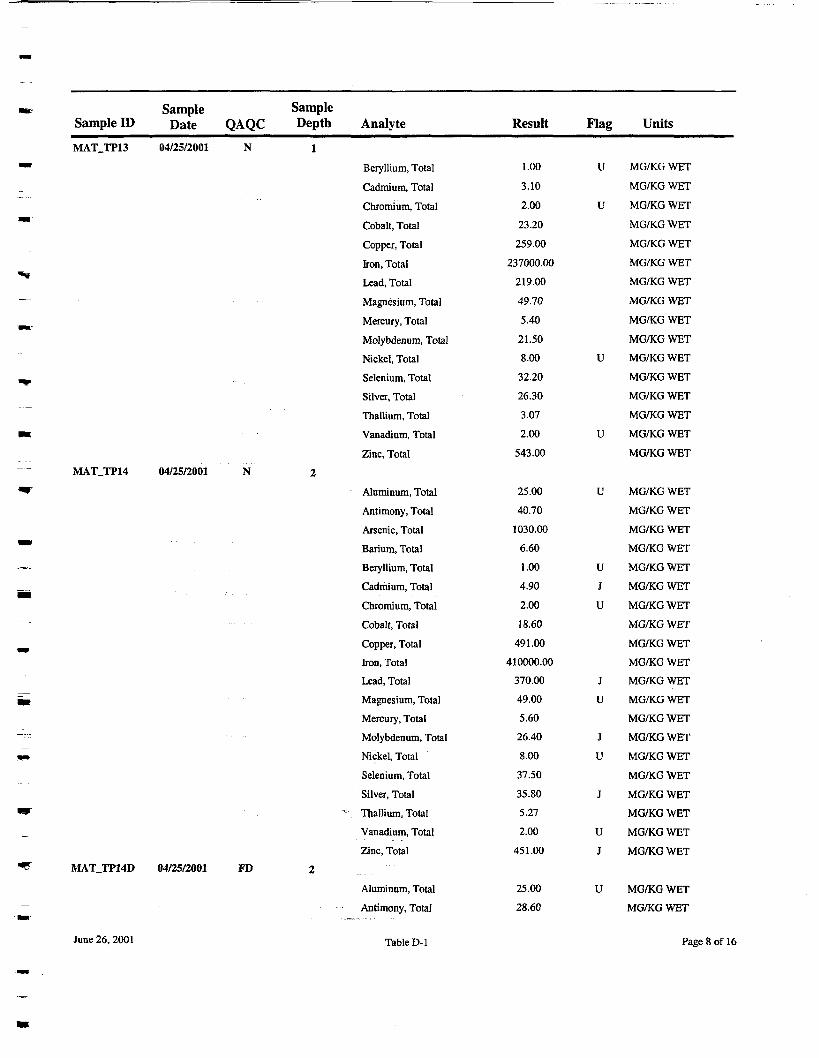
Sample SampleSample ID Date QAQC Depth AnalyteMAT_TP13 04/25/2001 N 1
Beryllium, TotalCadmium, TotalChromium, TotalCobalt, TotalCopper, TotalIron, TotalLead, TotalMagnesium, TotalMercury, TotalMolybdenum, TotalNickel, TotalSelenium, TotalSilver, TotalThallium, TotalVanadium, TotalZinc, Total
MAT_TP14 04/25/2001 N 2
Aluminum, TotalAntimony, TotalArsenic, TotalBarium, TotalBeryllium, TotalCadmium, TotalChromium, TotalCobalt, TotalCopper, TotalIron, TotalLead, TotalMagnesium, TotalMercury, TotalMolybdenum, TotalNickel, TotalSelenium, TotalSilver, Total
" _ Thallium, TotalVanadium, TotalZinc, Total
MAT_TP14D 04/25/2001 FD 2
Aluminum, TotalAntimony, Total
Result
1.00
3.102.00
23.20259.00
237000.00219.0049.705.40
21.508.0032.2026.303.072.00
543.00
25.0040.70
1030.006.601.004.902.0018.60
491.00410000.00
370.0049.005.6026.408.0037.5035.805.272.00
451.00
25.0028.60
Flag
u
u
u
u
u
uJu
Ju
Ju
J
uJ
u
Units
MG/KG WETMG/KG WETMG/KG WETMG/KG WETMG/KG WETMG/KG WETMG/KG WETMG/KG WETMG/KG WETMG/KG WETMG/KG WETMG/KG WETMG/KG WETMG/KG WETMG/KG WETMG/KG WET
MG/KG WETMG/KG WETMG/KG WETMG/KG WETMG/KG WETMG/KG WETMG/KG WETMG/KG WETMG/KG WETMG/KG WETMG/KG WETMG/KG WETMG/KG WETMG/KG WETMG/KG WETMG/KG WETMG/KG WETMG/KG WETMG/KG WETMG/KG WET
MG/KG WETMG/KG WET
June 26,2001 Table D-l Page 8 of 16
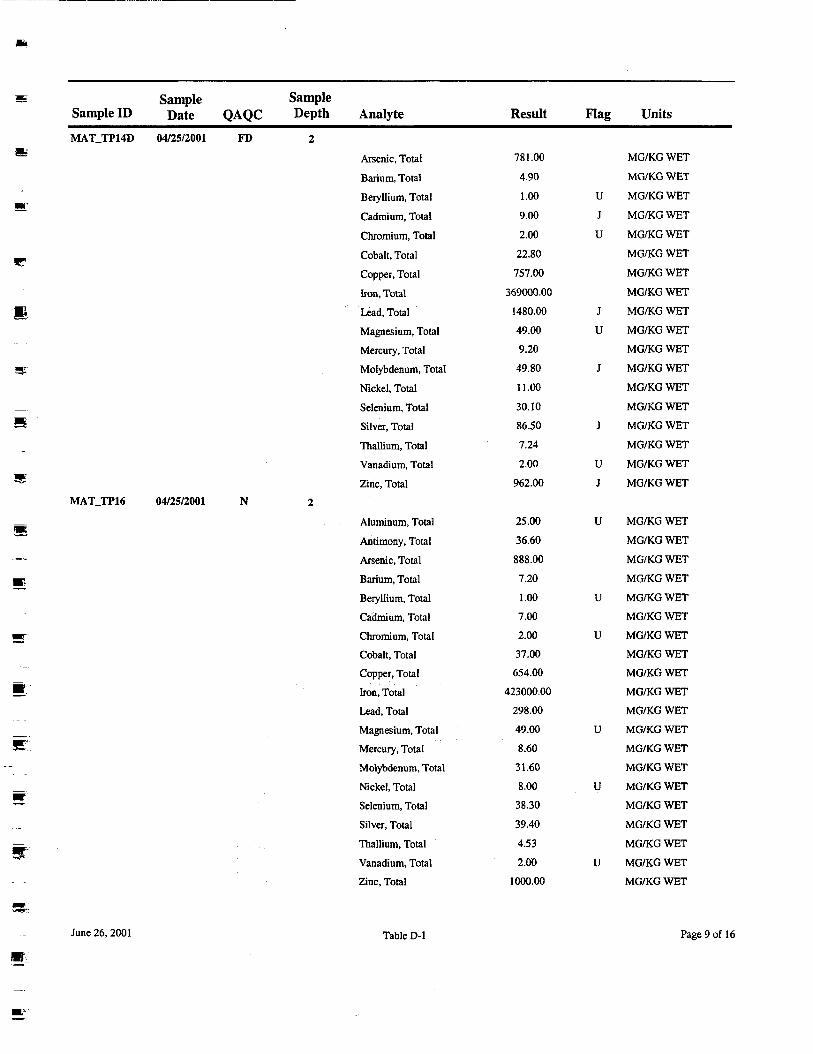
m
IT.
Sample SampleSample ID Date QAQC Depth AnalyteMAT.TP14D 04/25/2001 FD 2
Arsenic, TotalBarium, TotalBeryllium, TotalCadmium, Total
Chromium, TotalCobalt, TotalCopper, TotalIron, TotalLead, TotalMagnesium, TotalMercury, TotalMolybdenum, TotalNickel, TotalSelenium, TotalSilver, Total
Thallium, TotalVanadium, TotalZinc, Total
MAT_TP16 04/25/2001 N 2
Aluminum, Total
Antimony, TotalArsenic, TotalBarium, TotalBeryllium, TotalCadmium, TotalChromium, TotalCobalt, TotalCopper, TotalIron, TotalLead, TotalMagnesium, TotalMercury, TotalMolybdenum, TotalNickel, TotalSelenium, TotalSilver, TotalThallium, TotalVanadium, TotalZinc, Total
Result
781.004.90
1.00
9.002.0022.80
757.00
369000.001480.0049.009.20
49.8011.00
30.1086.507.242.00
962.00
25.0036.60888.007.201.007.002.0037.00
654.00423000.00
298.0049.008.60
31.608.00
38.3039.40
4.532.00
1000.00
Flag Units
MG/KG WETMG/KG WET
U MG/KG WET
J MG/KG WETU MG/KG WET
MG/KG WETMG/KG WET
MG/KG WETJ MG/KG WETU MG/KG WET
MG/KG WETJ MG/KG WET
MG/KG WET
MG/KG WETJ MG/KG WET
MG/KG WETU MG/KG WETJ MG/KG WET
U MG/KG WETMG/KG WET
MG/KG WETMG/KG WET
U MG/KG WETMG/KG WET
U MG/KG WETMG/KG WETMG/KG WETMG/KG WETMG/KG WET
U MG/KG WETMG/KG WETMG/KG WET
U MG/KG WETMG/KG WETMG/KG WET
MG/KG WETU MG/KG WET
MG/KG WET
June 26, 2001 Table D-l Page 9 of 16
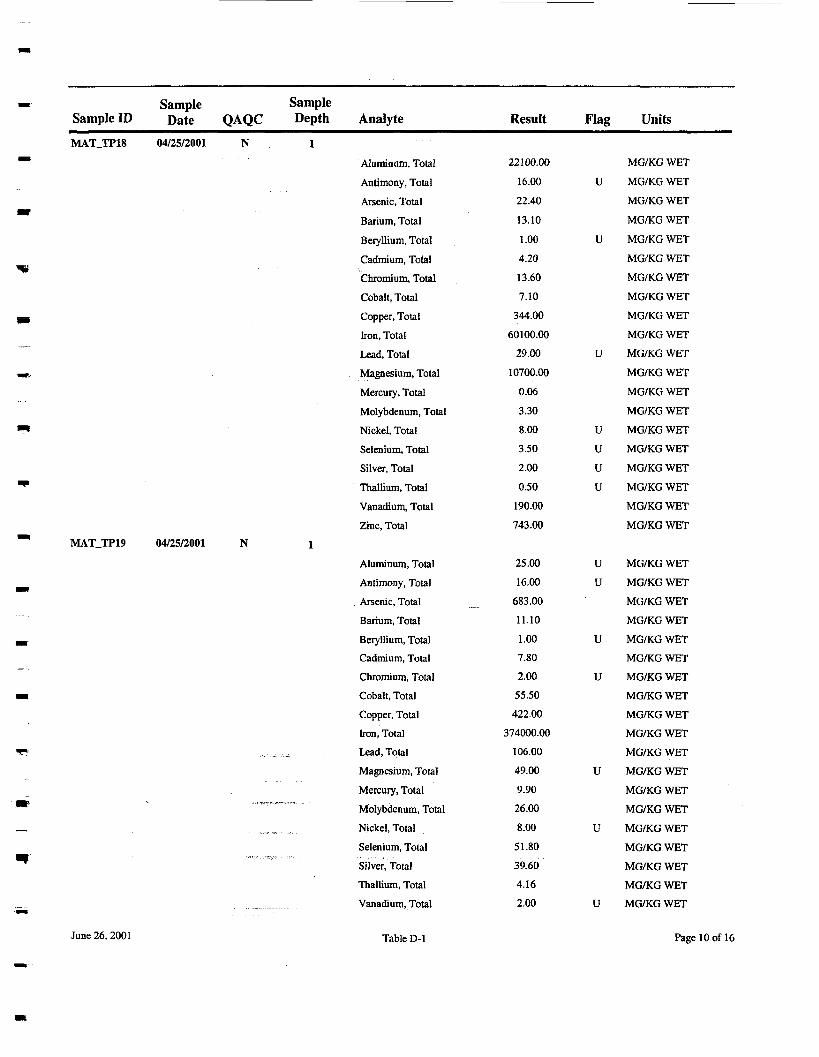
Sample SampleSample ID Date QAQC Depth AnalyteMATJTP18 04/25/2001 N . 1
Aluminum, TotalAntimony, TotalArsenic, TotalBarium, TotalBeryllium, TotalCadmium, TotalChromium, TotalCobalt, TotalCopper, TotalIron, TotalLead, TotalMagnesium, TotalMercury, TotalMolybdenum, TotalNickel, TotalSelenium, TotalSilver, TotalThallium, TotalVanadium, TotalZinc, Total
MAT_TP19 04/25/2001 N 1
Aluminum, TotalAntimony, TotalArsenic, TotalBarium, Total
Beryllium, TotalCadmium, Total
Chromium, TotalCobalt, TotalCopper, TotalIron, TotalLead, TotalMagnesium, TotalMercury, TotalMolybdenum, Total
.,.,._-,.,„,.,,. Nickel, TotalSelenium, Total
Silver, TotalThallium, TotalVanadium, Total
Result
22100.0016.0022.4013.101.004.2013.607.10
344.0060100.00
29.00
10700.000.063.308.003.50
2.000.50
190.00743.00
25.0016.00
683.0011.101.007.802.0055.50
422.00374000.00
106.0049.009.9026.008.00
51.8039.604.162.00
Flag Units
MG/KG WET
U MG/KG WETMG/KG WETMG/KG WET
U MG/KG WETMG/KG WETMG/KG WETMG/KG WETMG/KG WETMG/KG WET
U MG/KG WETMG/KG WETMG/KG WETMG/KG WET
U MG/KG WETU MG/KG WETU MG/KG WETU MG/KG WET
MG/KG WETMG/KG WET
U MG/KG WETU MG/KG WET
MG/KG WETMG/KG WET
U MG/KG WETMG/KG WET
U MG/KG WETMG/KG WETMG/KG WETMG/KG WETMG/KG WET
U MG/KG WETMG/KG WETMG/KG WET
U MG/KG WETMG/KG WETMG/KG WETMG/KG WET
U MG/KG WET
June 26, 2001 Table D-l Page 10 of 16
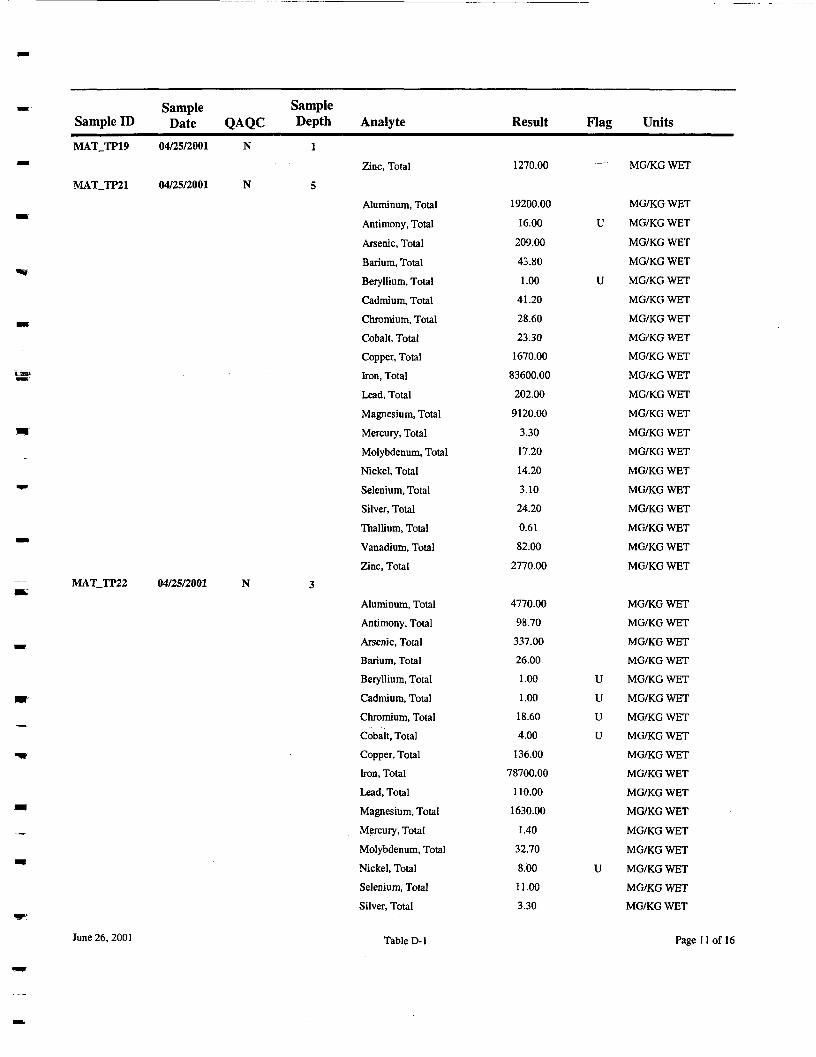
Sample SampleSample ID Date QAQC Depth AnalyteMAT_TP19 04/25/2001 N 1
Zinc, TotalMAT.TP21 04/25/2001 N 5
Aluminum, TotalAntimony, TotalArsenic, TotalBarium, TotalBeryllium, TotalCadmium, TotalChromium, TotalCobalt, TotalCopper, TotalIron, TotalLead, TotalMagnesium, TotalMercury, Total
Molybdenum, TotalNickel, TotalSelenium, TotalSilver, TotalThallium, Total
Vanadium, TotalZinc, Total
MAT_TP22 04/25/2001 N 3
Aluminum, TotalAntimony, TotalArsenic, TotalBarium, TotalBeryllium, TotalCadmium, TotalChromium, TotalCobalt, TotalCopper, TotalIron, TotalLead, TotalMagnesium, TotalMercury, TotalMolybdenum, TotalNickel, TotalSelenium, TotalSilver, Total
Result
1270.00
19200.00
16.00
209.0043.801.00
41.2028.6023.30
1670.0083600.00202.00
9120.00
3.3017.2014.203.1024.200.6182.00
2770.00
4770.0098.70337.0026.001.001.00
18.604.00
136.0078700.00
110.001630.00
1.4032.708.0011.003.30
Flag Units
MG/KG WET
MG/KG WETU MG/KG WET
MG/KG WETMG/KG WET
U MG/KG WETMG/KG WETMG/KG WETMG/KG WETMG/KG WETMG/KG WETMG/KG WETMG/KG WETMG/KG WETMG/KG WETMG/KG WETMG/KG WETMG/KG WETMG/KG WETMG/KG WETMG/KG WET
MG/KG WETMG/KG WETMG/KG WETMG/KG WET
U MG/KG WET
U MG/KG WETU MG/KG WETU MG/KG WET
MG/KG WETMG/KG WET
MG/KG WETMG/KG WETMG/KG WETMG/KG WET
U MG/KG WETMG/KG WETMG/KG WET
June 26,2001 Table D-l Page 11 of 16
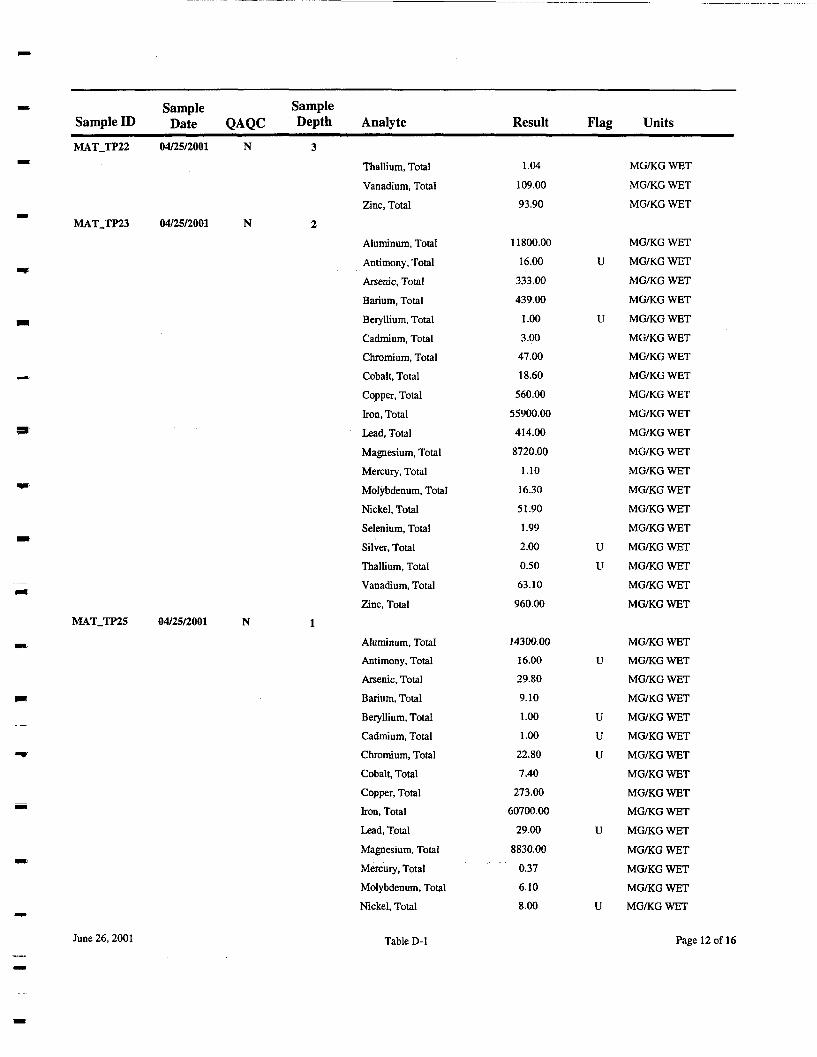
Sample SampleSample ID Date QAQC Depth AnalyteMAT_TP22 04/25/2001 N 3
Thallium, TotalVanadium, TotalZinc, Total
MAT_TP23 04/25/2001 N 2
Aluminum, TotalAntimony, TotalArsenic, TotalBarium, TotalBeryllium, TotalCadmium, TotalChromium, TotalCobalt, TotalCopper, TotalIron, TotalLead, TotalMagnesium, TotalMercury, TotalMolybdenum, TotalNickel, Total
Selenium, TotalSilver, TotalThallium, TotalVanadium, TotalZinc, Total
MAT_TP25 04/25/2001 N 1
Aluminum, TotalAntimony, Total
Arsenic, TotalBarium, TotalBeryllium, TotalCadmium, TotalChromium, TotalCobalt, TotalCopper, Totalton, TotalLead, TotalMagnesium, TotalMercury, TotalMolybdenum, TotalNickel, Total
Result
1.04
109.0093.90
11800.0016.00
333.00439.00
1.003.0047.0018.60
560.00
55900.00414.00
8720.001.10
16.3051.90
1.992.000.50
63.10960.00
14300.0016.0029.809.101.001.00
22.807.40
273.0060700.00
29.00
8830.000.376.108.00
Flag Units
MG/KG WET
MG/KG WETMG/KG WET
MG/KG WETU MG/KG WET
MG/KG WETMG/KG WET
U MG/KG WETMG/KG WETMG/KG WETMG/KG WETMG/KG WETMG/KG WETMG/KG WETMG/KG WETMG/KG WETMG/KG WETMG/KG WETMG/KG WET
U MG/KG WETU MG/KG WET
MG/KG WETMG/KG WET
MG/KG WETU MG/KG WET
MG/KG WETMG/KG WET
U MG/KG WETU MG/KG WETU MG/KG WET
MG/KG WETMG/KG WETMG/KG WET
U MG/KG WET
MG/KG WETMG/KG WETMG/KG WET
U MG/KG WET
June 26, 2001 Table D-l Page 12 of 16
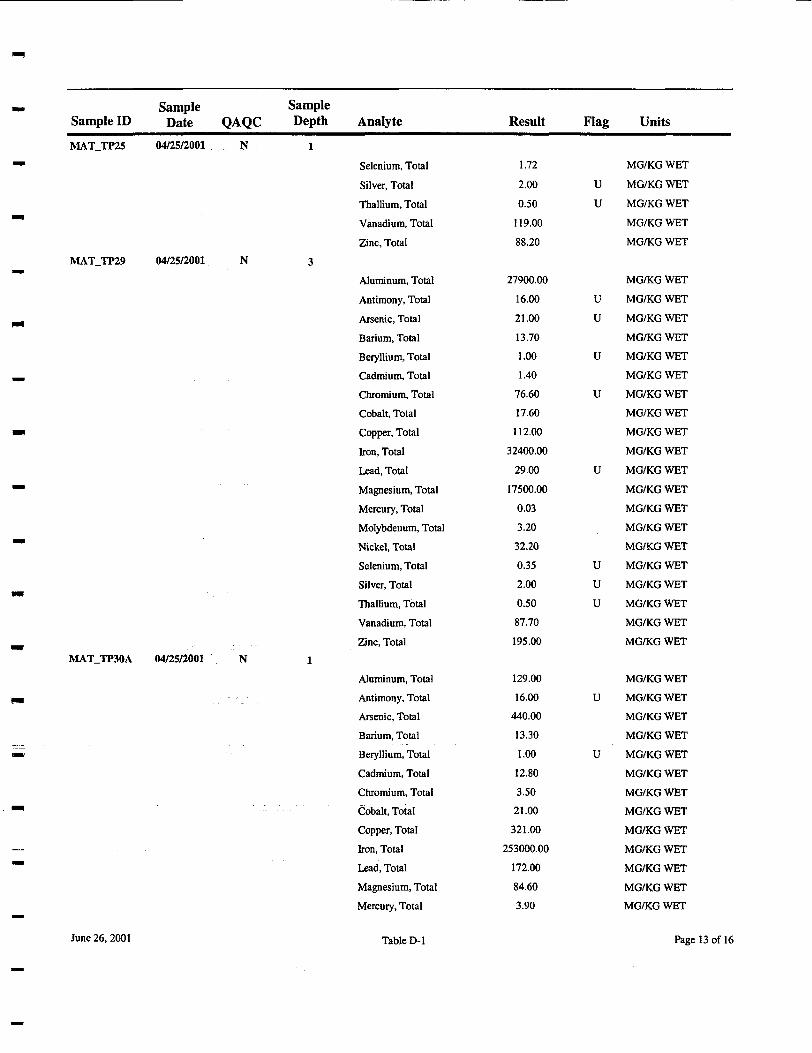
Sample SampleSample ID Date QAQC Depth AnalyteMAT_TP25 04/25/2001 N. 1
Selenium, TotalSilver, TotalThallium, TotalVanadium, TotalZinc, Total
MAT_TP29 04/25/2001 N 3
Aluminum, TotalAntimony, TotalArsenic, TotalBarium, TotalBeryllium, TotalCadmium, TotalChromium, TotalCobalt, TotalCopper, TotalIron, TotalLead, TotalMagnesium, TotalMercury, TotalMolybdenum, TotalNickel, TotalSelenium, TotalSilver, TotalThallium, TotalVanadium, TotalZinc, Total
MAT_TP30A 04/25/2001 N 1
Aluminum, TotalAntimony, TotalArsenic, TotalBarium, TotalBeryllium, TotalCadmium, TotalChromium, TotalCobalt, TotalCopper, TotalIron, TotalLead, TotalMagnesium, TotalMercury, Total
Result
1.72
2.000.50
119.0088.20
27900.0016.0021.0013.701.001.40
76.6017.60
112.0032400.00
29.0017500.00
0.033.2032.20
0.352.000.5087.70195.00
129.0016.00
440.0013.301.00
12.803.50
21.00321.00
253000.00172.0084.603.90
Hag Units
MG/KG WET
U MG/KG WETU MG/KG WET
MG/KG WETMG/KG WET
MG/KG WET
U MG/KG WETU MG/KG WET
MG/KG WETU MG/KG WET
MG/KG WETU MG/KG WET
MG/KG WETMG/KG WETMG/KG WET
U MG/KG WETMG/KG WETMG/KG WETMG/KG WETMG/KG WET
U MG/KG WETU MG/KG WETU MG/KG WET
MG/KG WETMG/KG WET
MG/KG WETU MG/KG WET
MG/KG WETMG/KG WET
U MG/KG WETMG/KG WETMG/KG WETMG/KG WETMG/KG WETMG/KG WETMG/KG WETMG/KG WETMG/KG WET
June 26,2001 Table D-l Page 13 of 16
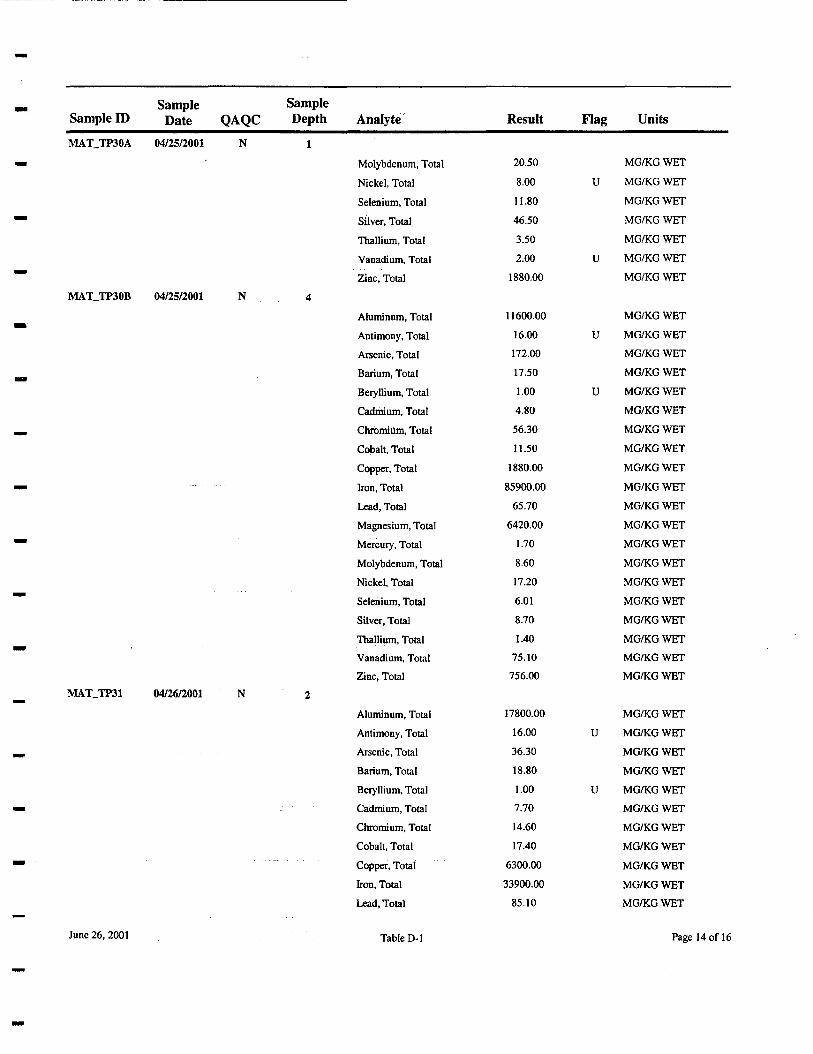
Sample SampleSample ID Date QAQC Depth AnalyteMATJTP30A 04/25/2001 N 1
Molybdenum, TotalNickel, Total
Selenium, TotalSilver, TotalThallium, TotalVanadium, TotalZinc, Total
MAT_TP30B 04/25/2001 N 4
Aluminum, TotalAntimony, TotalArsenic, TotalBarium, TotalBeryllium, TotalCadmium, TotalChromium, TotalCobalt, TotalCopper, Total
Iron, TotalLead, TotalMagnesium, TotalMercury, TotalMolybdenum, TotalNickel, TotalSelenium, TotalSilver, TotalThallium, TotalVanadium, TotalZinc, Total
MATJTP31 04/26/2001 N 2
Aluminum, TotalAntimony, TotalArsenic, TotalBarium, TotalBeryllium, TotalCadmium, TotalChromium, TotalCobalt, Total
Copper, TotalIron, TotalLead, Total
Result
20.50
8.0011.8046.503.502.00
1880.00
11600.0016.00172.0017.501.004.8056.3011.50
1880.00
85900.0065.70
6420.001.708.6017.206.018.701.40
75.10756.00
17800.0016.0036.3018.801. 007.7014.6017.40
6300.0033900.00
85.10
Flag Units
MG/KG WET
U MG/KG WETMG/KG WETMG/KG WETMG/KG WET
U MG/KG WETMG/KG WET
MG/KG WETU MG/KG WET
MG/KG WETMG/KG WET
U MG/KG WETMG/KG WETMG/KG WETMG/KG WETMG/KG WET
MG/KG WETMG/KG WETMG/KG WETMG/KG WETMG/KG WETMG/KG WETMG/KG WETMG/KG WETMG/KG WETMG/KG WETMG/KG WET
MG/KG WETU MG/KG WET
MG/KG WETMG/KG WET
U MG/KG WETMG/KG WETMG/KG WETMG/KG WETMG/KG WETMG/KG WETMG/KG WET
June 26,2001 Table D-l Page 14 of 16
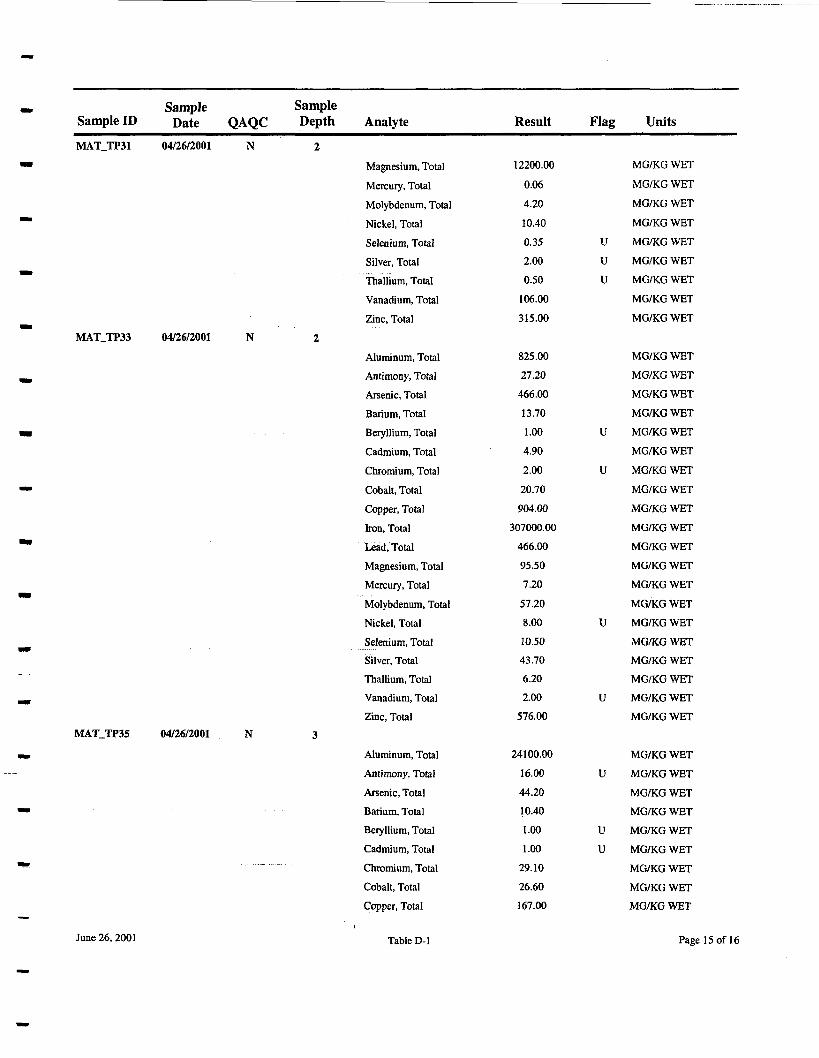
Sample SampleSample ID Date QAQC Depth AnalyteMAT_TP31 04/26/2001 N 2
Magnesium, TotalMercury, TotalMolybdenum, TotalNickel, Total
Selenium, TotalSilver, TotalThallium, TotalVanadium, TotalZinc, Total
MATJTP33 04/26/2001 N 2
Aluminum, TotalAntimony, TotalArsenic, TotalBarium, TotalBeryllium, Total
Cadmium, TotalChromium, TotalCobalt, TotalCopper, TotalIron, TotalLead, TotalMagnesium, TotalMercury, TotalMolybdenum, TotalNickel, TotalSelenium, TotalSilver, TotalThallium, TotalVanadium, TotalZinc, Total
MAT_TP35 04/26/2001 N 3
Aluminum, TotalAntimony, TotalArsenic, TotalBarium, TotalBeryllium, TotalCadmium, Total
'" '~~- -'-"--' Chromium, Total
Cobalt, TotalCopper, Total
Result
12200.00
0.064.2010.400.352.000.50
106.00315.00
825.0027.20466.00
13.701.004.90
2.0020.70904.00
307000.00466.0095.507.20
57.208.00
10.5043.70
6.202.00
576.00
24100.0016.0044.2010.401.001.00
29.1026.60167.00
Flag Units
MG/KG WET
MG/KG WETMG/KG WET
MG/KG WETU MG/KG WETU MG/KG WETU MG/KG WET
MG/KG WETMG/KG WET
MG/KG WETMG/KG WETMG/KG WETMG/KG WET
U MG/KG WETMG/KG WET
U MG/KG WETMG/KG WETMG/KG WETMG/KG WETMG/KG WETMG/KG WETMG/KG WETMG/KG WET
U MG/KG WETMG/KG WETMG/KG WETMG/KG WET
U MG/KG WETMG/KG WET
MG/KG WETU MG/KG WET
MG/KG WETMG/KG WET
U MG/KG WETU MG/KG WET
MG/KG WETMG/KG WETMG/KG WET
June 26, 2001 Table D-l Page 15 of 16
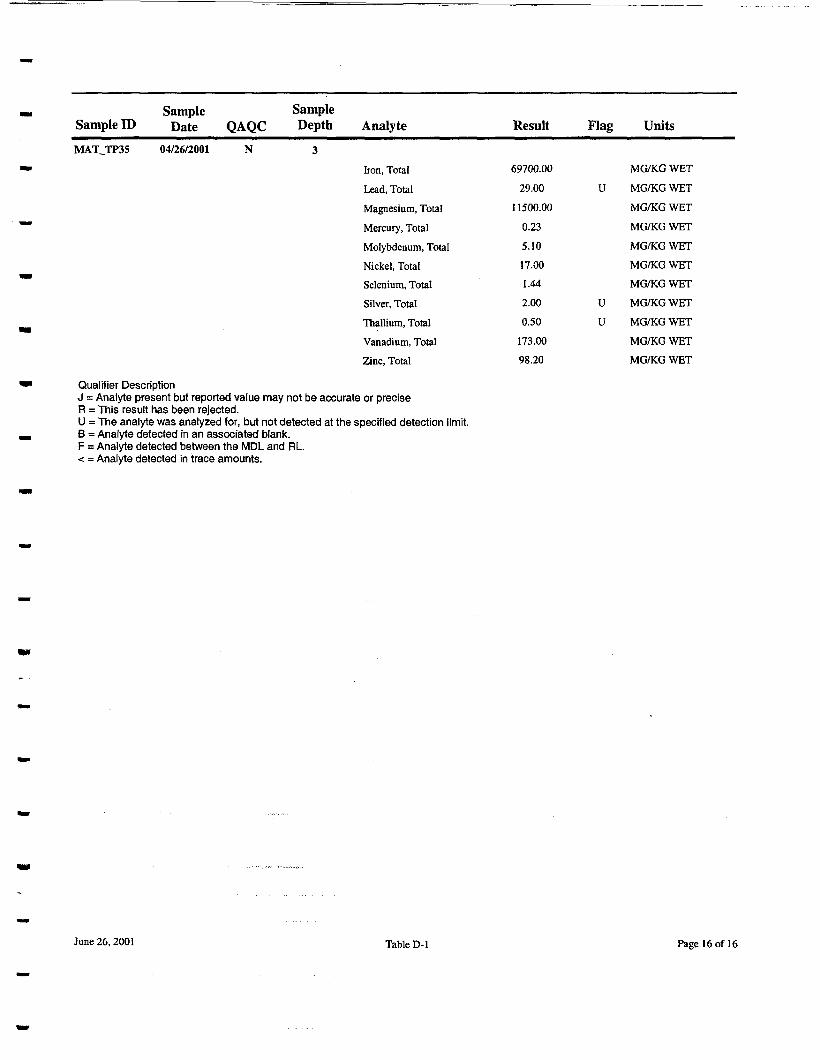
Sample SampleSample ID Date QAQC Depth AnalyteMATJTP35 04/26/2001 N 3
Iron, Total
Lead, TotalMagnesium, TotalMercury, TotalMolybdenum, TotalNickel, TotalSelenium, TotalSilver, TotalThallium, TotalVanadium, TotalZinc, Total
Result
69700.00
29.0011500.00
0.235.1017.001.44
2.000.50
173.0098.20
Flag Units
MG/KG WET
U MG/KG WETMG/KG WET
MG/KG WET
MG/KG WETMG/KG WETMG/KG WET
U MG/KG WETU MG/KG WET
MG/KG WETMG/KG WET
Qualifier DescriptionJ = Analyte present but reported value may not be accurate or preciseR = This result has been rejected.U = The analyte was analyzed for, but not detected at the specified detection limit.B = Analyte detected in an associated blank.F = Analyte detected between the MDL and RL.< = Analyte detected in trace amounts.
June 26,2001 Table D-l Page 16 of 16
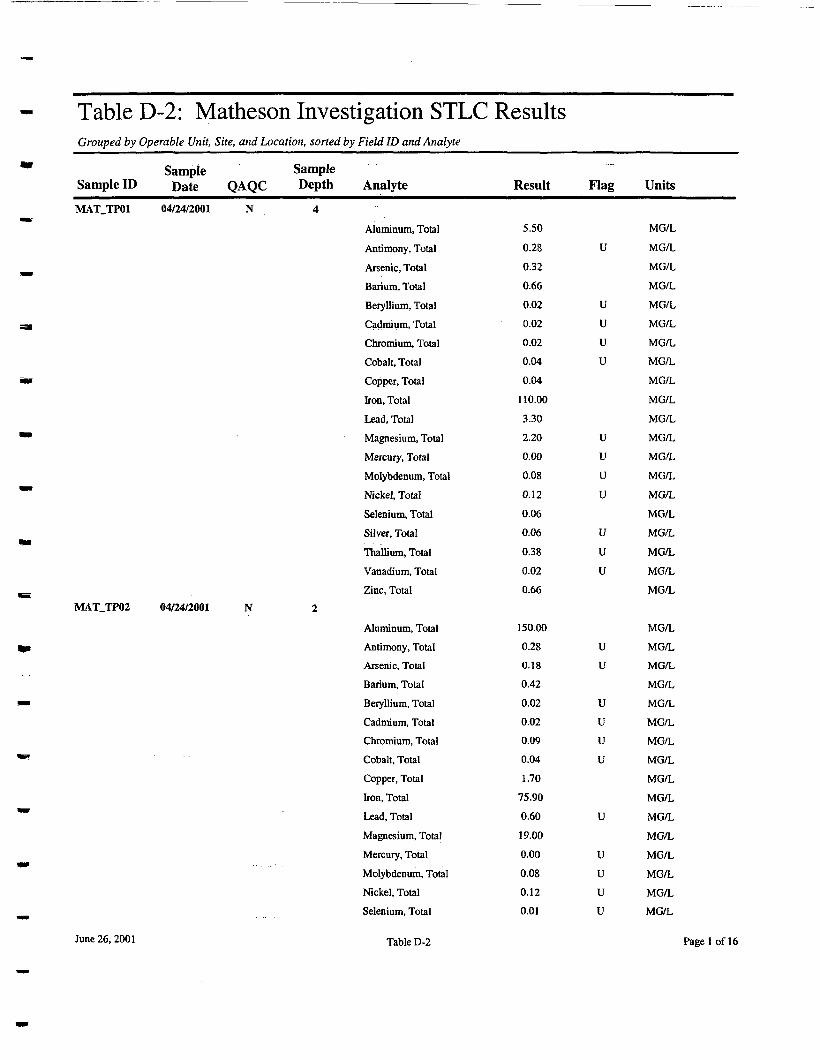
Table D-2: Matheson Investigation STLC ResultsGrouped by Operable Unit, Site, and Location, sorted by Field ID and Analyte
Sample SampleSample ID Date QAQC Depth AnalyteMAT_TP01 04/24/2001 N 4
Aluminum, TotalAntimony, TotalArsenic, TotalBarium, TotalBeryllium, TotalCadmium, TotalChromium, TotalCobalt, TotalCopper, TotalIron, TotalLead, TotalMagnesium, TotalMercury, TotalMolybdenum, TotalNickel, TotalSelenium, TotalSilver, TotalThallium, TotalVanadium, TotalZinc, Total
MAT_TP02 04/24/2001 N 2
Aluminum, TotalAntimony, TotalArsenic, Total
Barium, TotalBeryllium, TotalCadmium, TotalChromium, TotalCobalt, TotalCopper, TotalIron, TotalLead, TotalMagnesium, TotalMercury, TotalMolybdenum, TotalNickel, TotalSelenium, Total
Result
5.50
0.280.320.660.020.020.020.040.04
110.003.302.200.000.080.120.060.060.380.020.66
150.000.280.180.420.020.020.090.041.70
75.900.6019.000.000.080.120.01
Flag
u
uuuu
uuuu
uuu
uu
uuuu
u
uuuu
Units
MG/L
MG/LMG/LMG/LMG/LMG/LMG/LMG/LMG/LMG/LMG/LMG/LMG/LMG/LMG/LMG/LMG/LMG/LMG/LMG/L
MG/LMG/LMG/L
MG/LMG/LMG/LMG/LMG/LMG/LMG/LMG/LMG/LMG/LMG/LMG/LMG/L
June 26, 2001 Table D-2 Pagel of 16
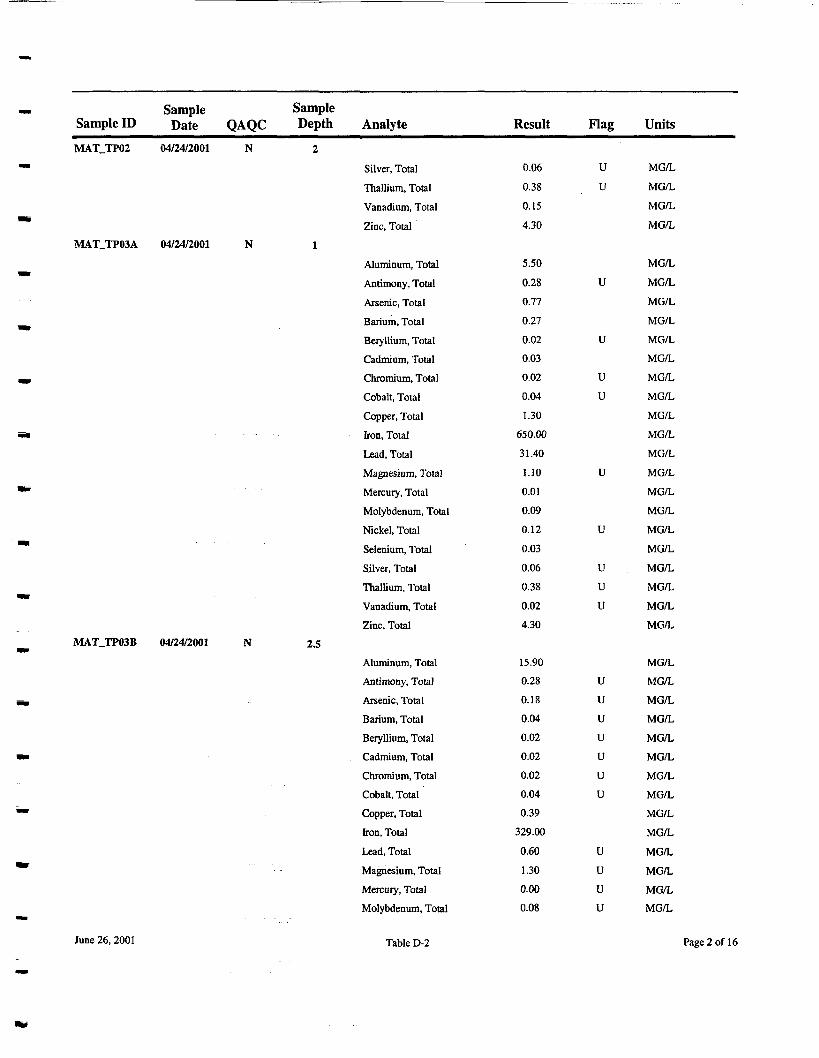
Sample SampleSample ID Date QAQC Depth AnalyteMAT.TP02 04/24/2001 N 2
Silver, TotalThallium, TotalVanadium, TotalZinc, Total
MAT_TP03A 04/24/2001 N 1
Aluminum, TotalAntimony, TotalArsenic, TotalBarium, Total
Beryllium, TotalCadmium, TotalChromium, TotalCobalt, TotalCopper, TotalIron, TotalLead, TotalMagnesium, TotalMercury, TotalMolybdenum, TotalNickel, TotalSelenium, TotalSilver, TotalThallium, TotalVanadium, TotalZinc, Total
MAT_TP03B 04/24/2001 N 2.5
Aluminum, Total
Antimony, TotalArsenic, TotalBarium, TotalBeryllium, TotalCadmium, TotalChromium, TotalCobalt, TotalCopper, TotalIron, TotalLead, TotalMagnesium, TotalMercury, TotalMolybdenum, Total
Result
0.060.380.154.30
5.50
0.280.770.270.020.030.020.041.30
650.0031.40
1.100.010.090.120.030.060.380.024.30
15.900.280.180.040.020.020.020.040.39
329.00
0.601.300.000.08
Flag
uu
u
u
uu
u
u
uuu
uuuuuuu
uuuu
Units
MG/LMG/LMG/LMG/L
MG/LMG/LMG/LMG/LMG/LMG/LMG/LMG/LMG/LMG/LMG/LMG/LMG/LMG/LMG/LMG/LMG/LMG/LMG/LMG/L
MG/LMG/LMG/LMG/LMG/LMG/LMG/LMG/LMG/LMG/L
MG/LMG/LMG/LMG/L
June 26, 2001 Table D-2 Page 2 of 16

Sample SampleSample ID Date QAQC Depth AnalyteMAT_TP03B 04/24/2001 N 2.5
Nickel, TotalSelenium, TotalSilver, TotalThallium, TotalVanadium, TotalZinc, Total
MAT_TP04A 04/25/2001 N 0.5
Aluminum, TotalAntimony, TotalArsenic, TotalBarium, TotalBeryllium, TotalCadmium, TotalChromium, TotalCobalt, TotalCopper, TotalIron, TotalLead, TotalMagnesium, TotalMercury, TotalMolybdenum, TotalNickel, TotalSelenium, TotalSilver, TotalThallium, TotalVanadium, TotalZinc, Total
MAT_TP04B 04/24/2001 N 4
Aluminum, TotalAntimony, TotalArsenic, TotalBarium, TotalBeryllium, TotalCadmium, TotalChromium, TotalCobalt, Total
Copper, TotalIron, TotalLead, TotalMagnesium, Total
Result
0.12
0.010.06
0.380.910.72
17.000.280.181.100.020.020.020.040.7158.900.691.700.000.080.120.010.060.380.020.06
75.100.280.230.120.020.040.04
0.054.00
364.0010.9044.70
Flag
uuuu
uu
uuuu
uuuuuuuuu
u
u
u
Units
MG/LMG/L
MG/LMG/LMG/L
MG/L
MG/LMG/LMG/LMG/LMG/LMG/LMG/LMG/LMG/LMG/LMG/LMG/LMG/LMG/LMG/LMG/LMG/LMG/LMG/LMG/L
MG/LMG/LMG/LMG/LMG/LMG/LMG/LMG/L
MG/LMG/LMG/LMG/L
June 26,2001 Table D-2 Page 3 of 16
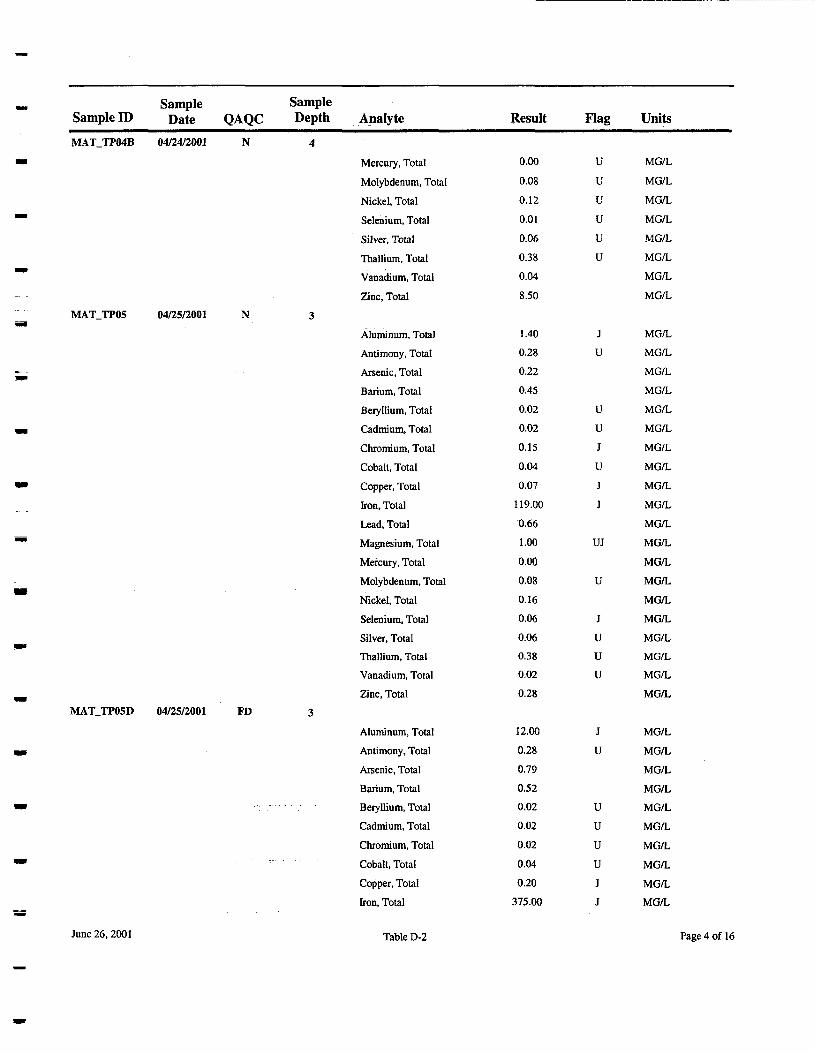
Sample SampleSample ID Date QAQC Depth AnalyteMATJTP04B 04/24/2001 N 4
Mercury, TotalMolybdenum, TotalNickel, TotalSelenium, TotalSilver, TotalThallium, TotalVanadium, TotalZinc, Total
MAT_TP05 04/25/2001 N 3
Aluminum, TotalAntimony, TotalArsenic, TotalBarium, TotalBeryllium, TotalCadmium, TotalChromium, TotalCobalt, TotalCopper, TotalIron, TotalLead, TotalMagnesium, TotalMercury, TotalMolybdenum, TotalNickel, TotalSelenium, TotalSilver, TotalThallium, TotalVanadium, TotalZinc, Total
MATJTP05D 04/25/2001 FD 3
Aluminum, TotalAntimony, TotalArsenic, TotalBarium, Total
~ Beryllium, TotalCadmium, TotalChromium, Total
^ Cobalt, TotalCopper, TotalIron, Total
Result
0.00
0.080.120.010.060.380.048.50
1.400.280.220.450.020.020.150.04
0.07119.000.661.000.000.080.160.060.060.380.020.28
12.000.280.790.520.020.020.020.040.20
375.00
Flag
uuuuuu
Ju
uuJuJJ
UJ
u
Juuu
Ju
uuuuJJ
Units
MG/L
MG/LMG/LMG/LMG/LMG/LMG/LMG/L
MG/LMG/LMG/LMG/LMG/LMG/LMG/LMG/LMG/LMG/LMG/LMG/LMG/LMG/LMG/LMG/LMG/LMG/LMG/LMG/L
MG/LMG/LMG/LMG/LMG/LMG/LMG/LMG/LMG/LMG/L
June 26,2001 Table D-2 Page 4 of 16
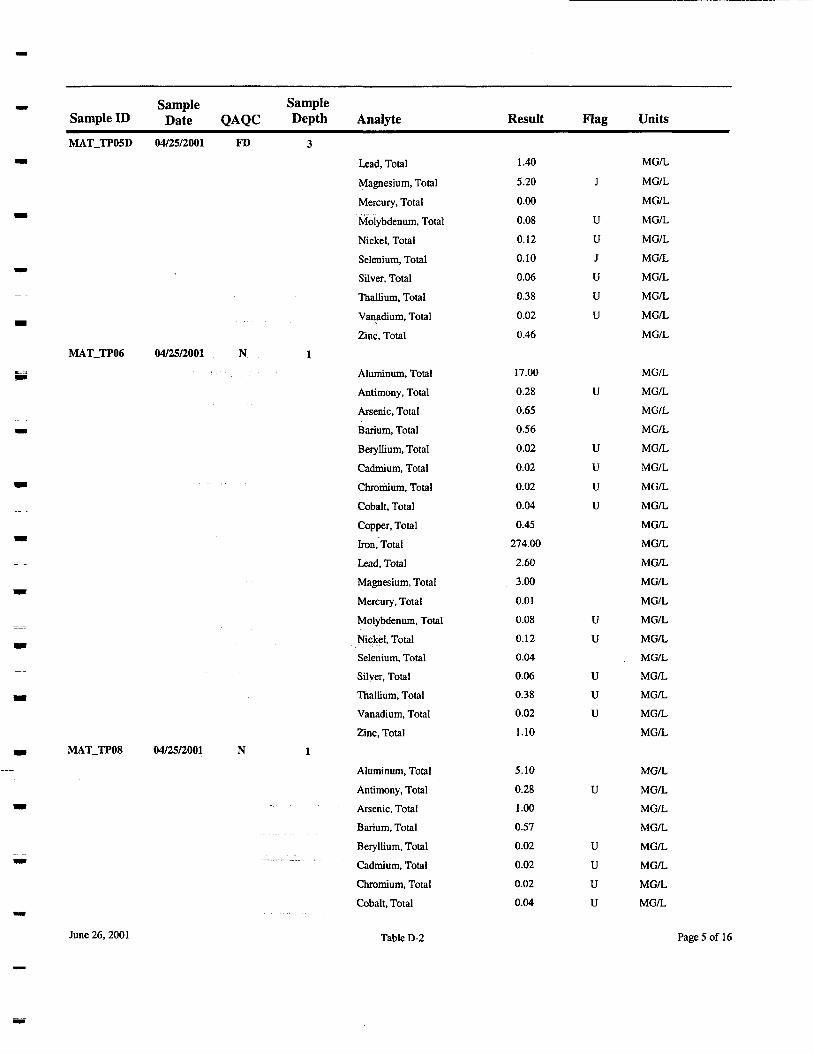
Sample SampleSample ID Date QAQC Depth AnalyteMAT_TP05D 04/25/2001 FD 3
Lead, TotalMagnesium, TotalMercury, TotalMolybdenum, TotalNickel, TotalSelenium, TotalSilver, TotalThallium, TotalVanadium, TotalZinc, Total
MATJTP06 04/25/2001 . N . 1
•••"::.: J Aluminum, TotalAntimony, TotalArsenic, TotalBarium, TotalBeryllium, TotalCadmium, TotalChromium, TotalCobalt, TotalCopper, TotalIron, TotalLead, TotalMagnesium, TotalMercury, TotalMolybdenum, TotalNickel, TotalSelenium, Total
Silver, TotalThallium, TotalVanadium, TotalZinc, Total
MATJTP08 04/25/2001 N 1
Aluminum, TotalAntimony, Total
•~----~ Arsenic, Total
Barium, TotalBeryllium, TotalCadmium, TotalChromium, TotalCobalt, Total
Result
1.40
5.20
0.000.080.120.100.060.380.020.46
17.000.280.650.560.02
0.020.020.040.45
274.002.603.000.010.080.120.040.060.380.021.10
5.100.281.000.570.020.020.020.04
Flag
J
uuJuuu
u
uuuu
uu
uuu
u
uuuu
Units
MG/L
MG/LMG/L
MG/LMG/LMG/LMG/LMG/LMG/LMG/L
MG/LMG/LMG/LMG/LMG/LMG/LMG/LMG/LMG/LMG/LMG/LMG/LMG/LMG/LMG/LMG/LMG/LMG/LMG/LMG/L
MG/LMG/LMG/LMG/LMG/LMG/LMG/LMG/L
June 26,2001 Table D-2 Page 5 of 16
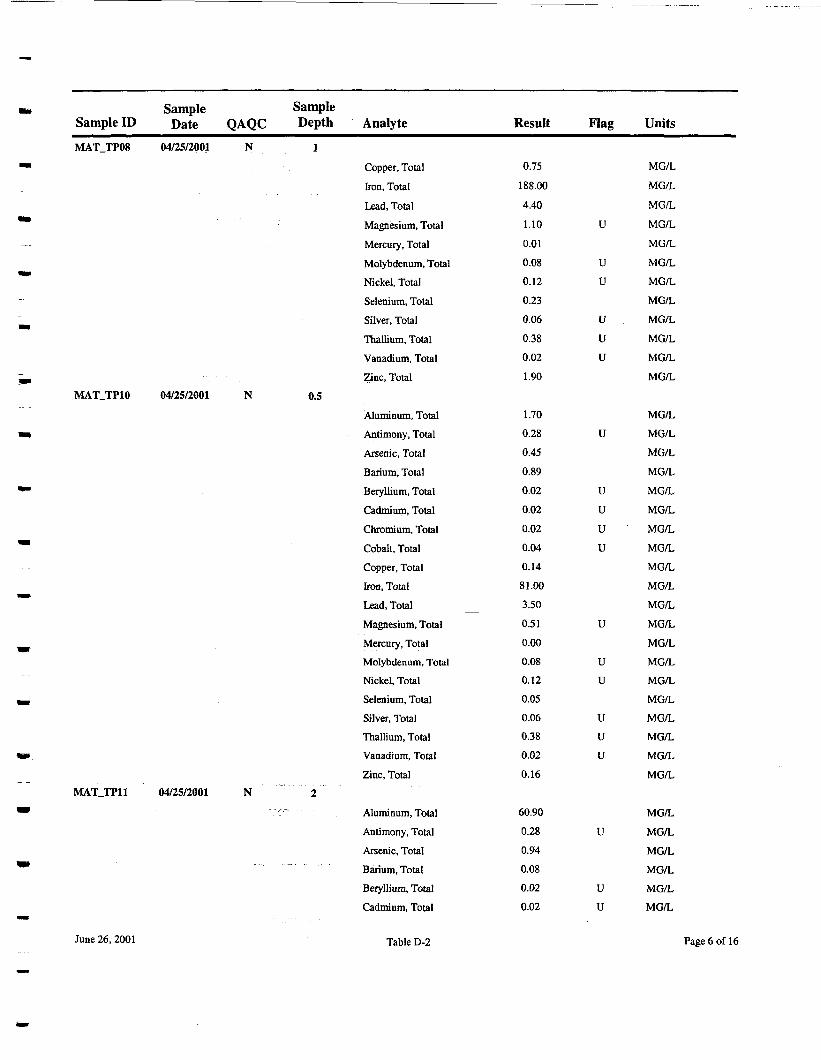
Sample SampleSample ID Date QAQC Depth AnalyteMATJTP08 04/25/2001 N 1
Copper, TotalIron, TotalLead.TotalMagnesium, TotalMercury, TotalMolybdenum, TotalNickel, TotalSelenium, TotalSilver, TotalThallium, TotalVanadium, TotalZinc, Total
MATJTPIO 04/25/2001 N 0.5
Aluminum, TotalAntimony, TotalArsenic, TotalBarium, TotalBeryllium, TotalCadmium, TotalChromium, TotalCobalt, TotalCopper, TotalIron, TotalLead, TotalMagnesium, TotalMercury, TotalMolybdenum, Total
Nickel, TotalSelenium, TotalSilver, TotalThallium, TotalVanadium, TotalZinc, Total
MAT_TP11 04/25/2001 N 2
:~ Aluminum, TotalAntimony, TotalArsenic, TotalBarium, TotalBeryllium, TotalCadmium, Total
Result
0.75
188.00
4.40
1.100.010.080.120.230.06
0.380.021.90
1.700.280.45
0.890.020.020.020.040.1481.003.500.510.000.080.120.050.060.380.020.16
60.900.280.940.080.020.02
Flag
u
uu
uuu
u
uuuu
u
uu
uuu
u
uu
Units
MG/L
MG/L
MG/LMG/LMG/LMG/LMG/LMG/LMG/LMG/LMG/LMG/L
MG/LMG/LMG/LMG/LMG/LMG/L
MG/LMG/LMG/LMG/LMG/LMG/LMG/LMG/LMG/LMG/LMG/LMG/LMG/LMG/L
MG/LMG/LMG/LMG/LMG/LMG/L
June 26, 2001 Table D-2 Page 6 of 16
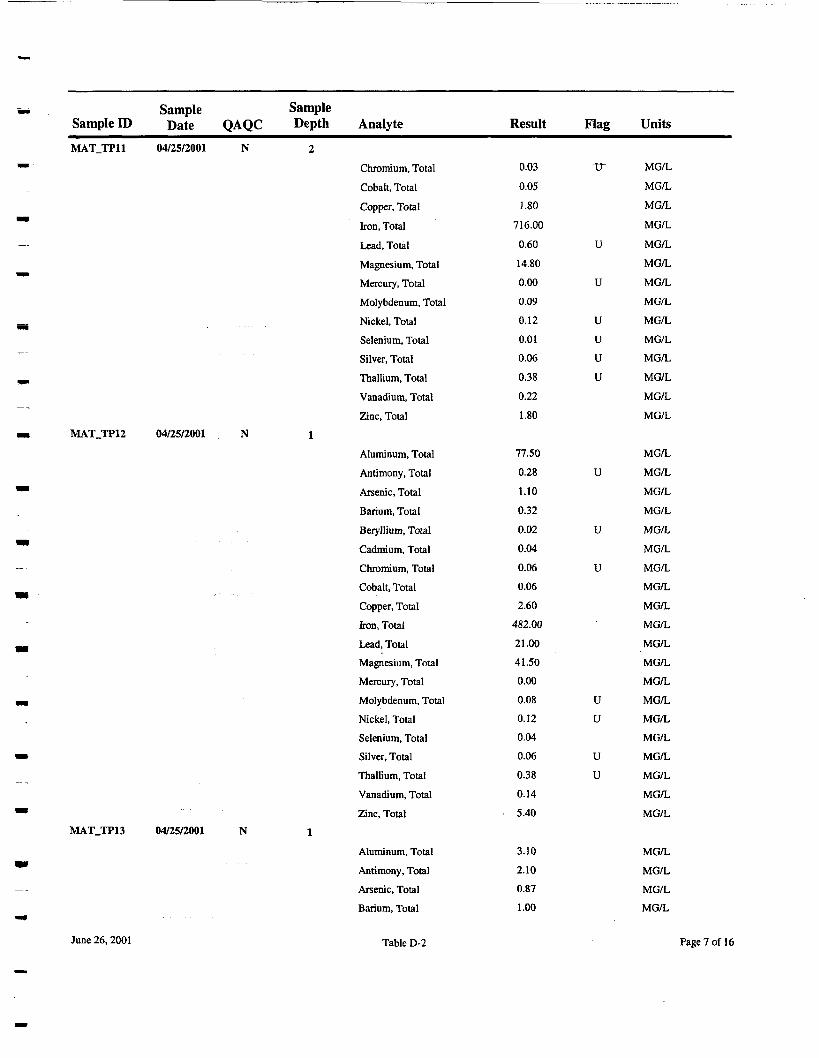
Sample SampleSample ID Date QAQC Depth AnalyteMATJTPll 04/25/2001 N 2
Chromium, TotalCobalt, TotalCopper, TotalIron, TotalLead, TotalMagnesium, TotalMercury, TotalMolybdenum, TotalNickel, TotalSelenium, TotalSilver, TotalThallium, TotalVanadium, TotalZinc, Total
MAT_TP12 04/25/2001 N 1
Aluminum, TotalAntimony, TotalArsenic, TotalBarium, TotalBeryllium, TotalCadmium, TotalChromium, TotalCobalt, TotalCopper, Total
Iron, TotalLead, TotalMagnesium, TotalMercury, TotalMolybdenum, TotalNickel, TotalSelenium, TotalSilver, TotalThallium, TotalVanadium, TotalZinc, Total
MAT_TP13 04/25/2001 .. N I
Aluminum, TotalAntimony, TotalArsenic, TotalBarium, Total
Result
0.03
0.051.80
716.000.6014.800.000.090.120.010.060.380.221.80
77.500.28
1.100.32
0.020.040.060.062.60
482.0021.0041.500.000.080.120.040.060.380.145.40
3.102.100.871.00
Flag Units
tr MG/LMG/L
MG/LMG/L
U MG/LMG/L
U MG/LMG/L
U MG/LU MG/LU MG/LU MG/L
MG/LMG/L
MG/LU MG/L
MG/LMG/L
U MG/LMG/L
U MG/LMG/LMG/LMG/LMG/LMG/LMG/L
U MG/LU MG/L
MG/LU MG/LU MG/L
MG/LMG/L
MG/LMG/LMG/LMG/L
June 26,2001 Table D-2 Page 7 of 16
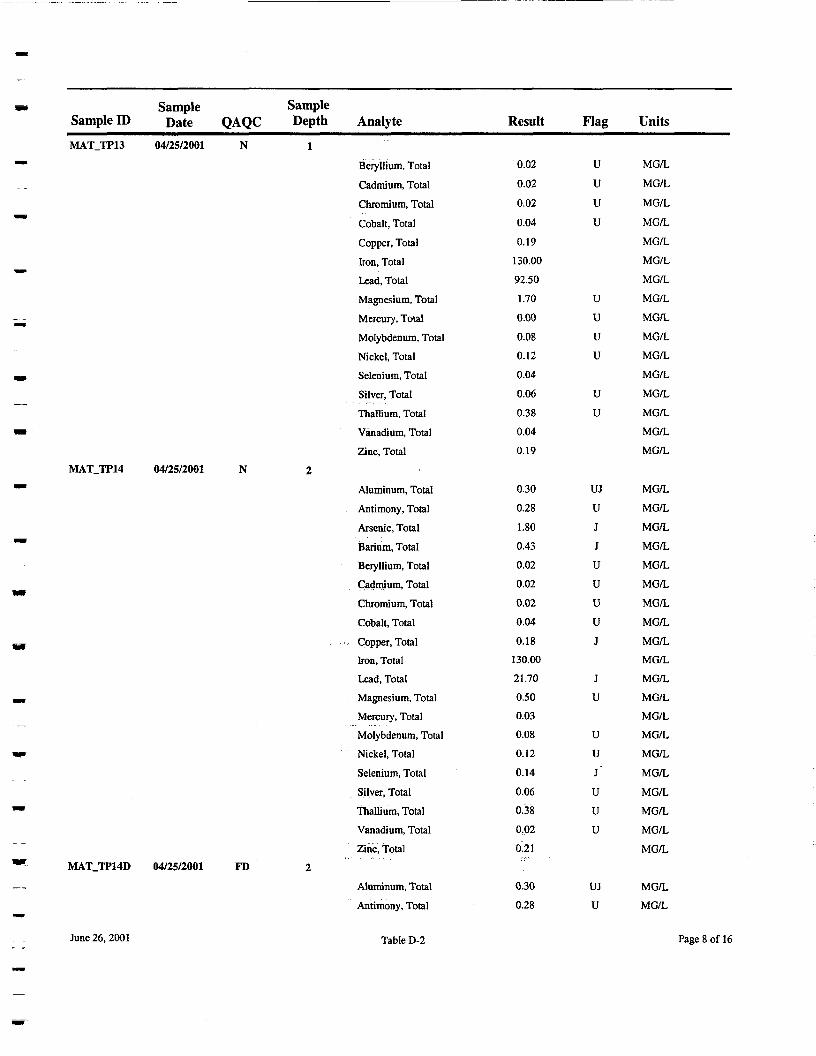
Sample SampleSample ID Date QAQC Depth AnalyteMATJTP13 04/25/2001 N 1
Beryllium, TotalCadmium, TotalChromium, TotalCobalt, TotalCopper, TotalIron, TotalLead, TotalMagnesium, Total
Mercury, TotalMolybdenum, TotalNickel, TotalSelenium, TotalSilver, TotalThallium, TotalVanadium, TotalZinc, Total
MATJTP14 04/25/2001 N 2
Aluminum, TotalAntimony, Total
Arsenic, TotalBarium, TotalBeryllium, TotalCadmium, TotalChromium, TotalCobalt, Total
> Copper, TotalIron, Total
Lead, TotalMagnesium, TotalMercury, TotalMolybdenum, TotalNickel, TotalSelenium, TotalSilver, TotalThallium, TotalVanadium, TotalZinc, Total
MATJTP14D 04/25/2001 FD 2
Aluminum, TotalAntimony, Total
Result
0.020.02
0.020.04
0.19130.0092.501.700.000.080.120.04
0.060.380.040.19
0.300.281.800.430.020.02
0.020.04
0.18130.0021.700.500.030.080.120.140.060.380.020.21
0.300.28
Flag
uuuu
uuuu
uu
UJuJJuuuuJ
Ju
uuJ"uuu
UJu
Units
MG/L
MG/LMG/L
MG/LMG/LMG/LMG/LMG/LMG/LMG/LMG/LMG/LMG/LMG/LMG/LMG/L
MG/LMG/LMG/LMG/LMG/LMG/LMG/LMG/LMG/LMG/LMG/LMG/LMG/LMG/LMG/LMG/L
MG/LMG/LMG/LMG/L
MG/LMG/L
June 26,2001 Table D-2 Page 8 of 16
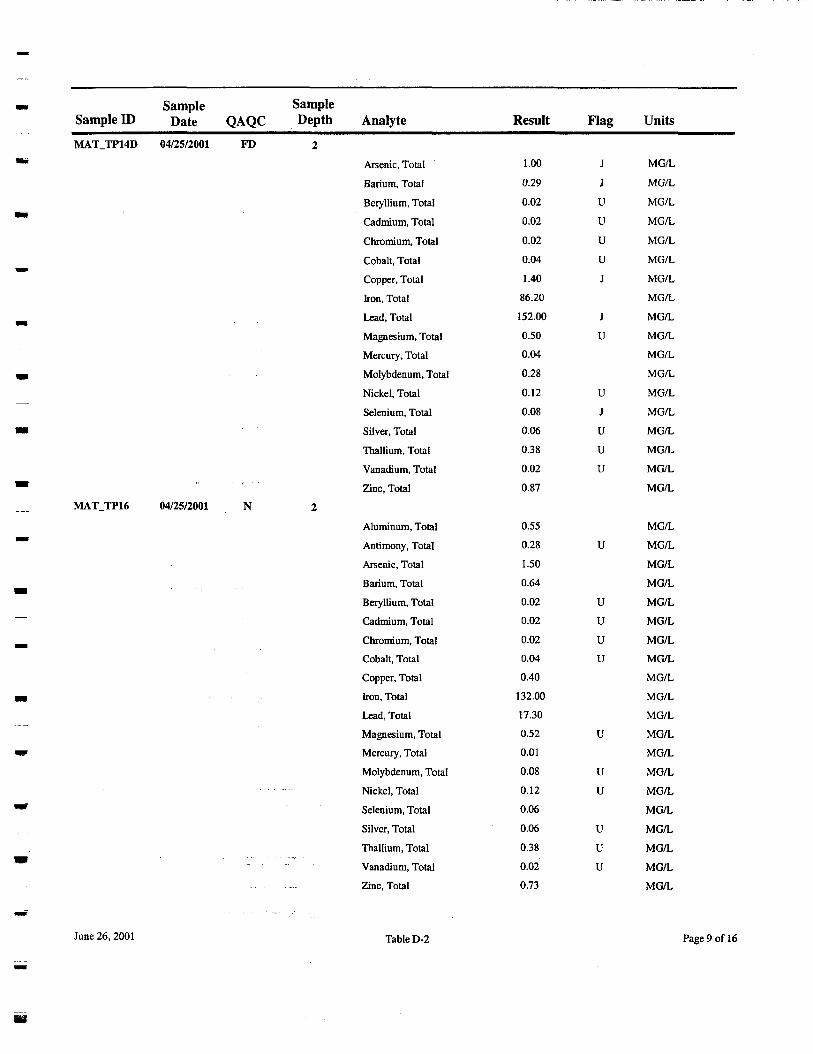
Sample SampleSample ID Date QAQC Depth AnalyteMATJTP14D 04/25/2001 FD 2
Arsenic, TotalBarium, TotalBeryllium, TotalCadmium, Total
Chromium, TotalCobalt, TotalCopper, TotalIron, Total
Lead, TotalMagnesium, TotalMercury, TotalMolybdenum, Total
Nickel, TotalSelenium, TotalSilver, TotalThallium, TotalVanadium, TotalZinc, Total
MAT_TP16 04/25/2001 N ^
Aluminum, TotalAntimony, TotalArsenic, TotalBarium, TotalBeryllium, TotalCadmium, Total
Chromium, TotalCobalt, TotalCopper, TotalIron, TotalLead, TotalMagnesium, TotalMercury, TotalMolybdenum, TotalNickel, TotalSelenium, TotalSilver, TotalThallium, Total
Vanadium, TotalZinc, Total
Result
1.00
0.290.02
0.020.020.041.40
86.20152.000.500.04
0.280.120.080.060.380.020.87
0.550.281.500.640.020.020.020.040.40
132.0017.300.520.010.080.120.060.060.380.020.73
Flag
jjuuuuJ
Ju
uJuuu
u
uuuu
u
uu
uuu
Units
MG/LMG/LMG/L
MG/LMG/LMG/LMG/LMG/LMG/LMG/LMG/LMG/L
MG/LMG/LMG/LMG/LMG/LMG/L
MG/LMG/LMG/LMG/LMG/LMG/LMG/LMG/LMG/LMG/LMG/LMG/LMG/LMG/LMG/LMG/LMG/LMG/LMG/LMG/L
June 26, 2001 Table D-2 Page 9 of 16
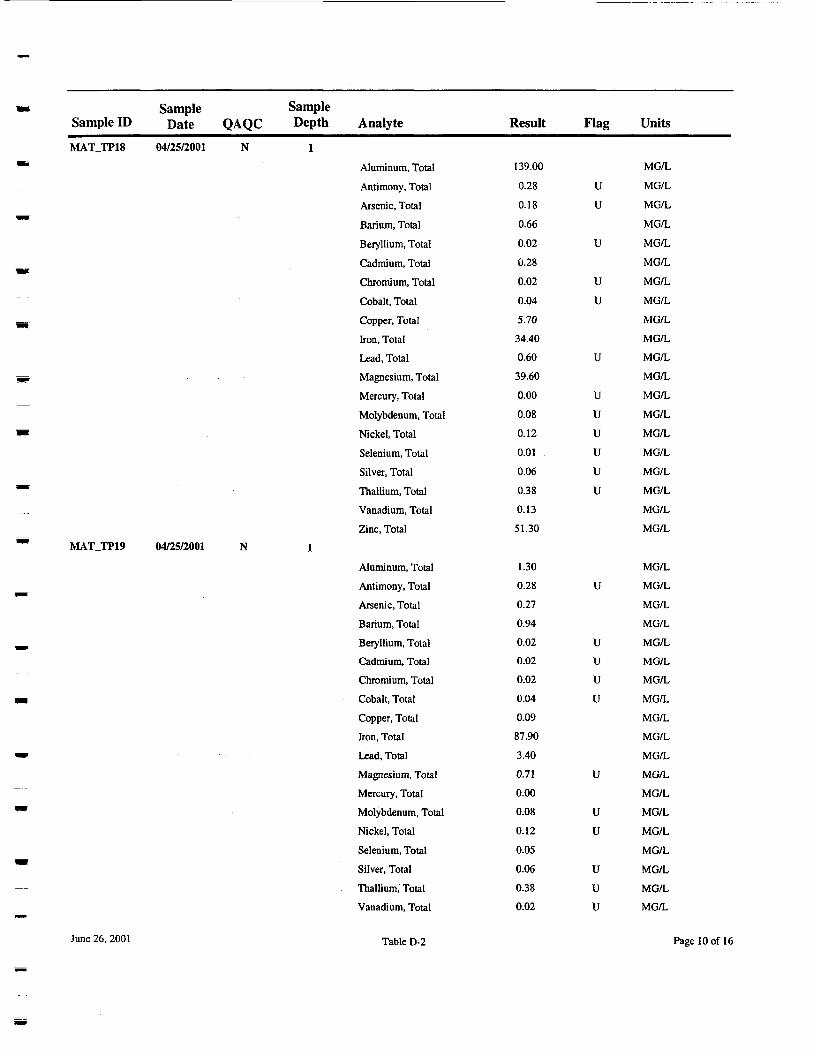
Sample SampleSample ID Date QAQC Depth AnalyteMATJTP18 04/25/2001 N 1
Aluminum, TotalAntimony, TotalArsenic, TotalBarium, TotalBeryllium, TotalCadmium, TotalChromium, Total
Cobalt, TotalCopper, TotalIron, TotalLead, TotalMagnesium, TotalMercury, TotalMolybdenum, TotalNickel, TotalSelenium, TotalSilver, TotalThallium, TotalVanadium, TotalZinc, Total
MAT_TP19 04/25/2001 N 1
Aluminum, TotalAntimony, Total
Arsenic, TotalBarium, TotalBeryllium, TotalCadmium, TotalChromium, TotalCobalt, TotalCopper, TotalIron, TotalLead, TotalMagnesium, TotalMercury, TotalMolybdenum, TotalNickel, TotalSelenium, TotalSilver, TotalThallium, TotalVanadium, Total
Result
139.00
0.280.180.660.020.280.020.045.7034.400.6039.600.000.080.120.010.060.380.1351.30
1.300.280.270.940.020.020.020.040.0987.903.400.710.000.080.120.050.060.380.02
Flag
uu
u
uu
u
uuuuuu
u
uuuu
u
uu
uuu
Units
MO/L
MG/LMG/LMG/LMG/LMG/LMG/LMG/LMG/LMG/LMG/LMG/LMG/LMG/LMG/LMG/LMG/LMG/LMG/LMG/L
MG/LMG/LMG/LMG/LMG/LMG/LMG/LMG/LMG/LMG/LMG/LMG/LMG/LMG/LMG/LMG/LMG/LMG/LMG/L
June 26, 2001 Table D-2 Page 10 of 16
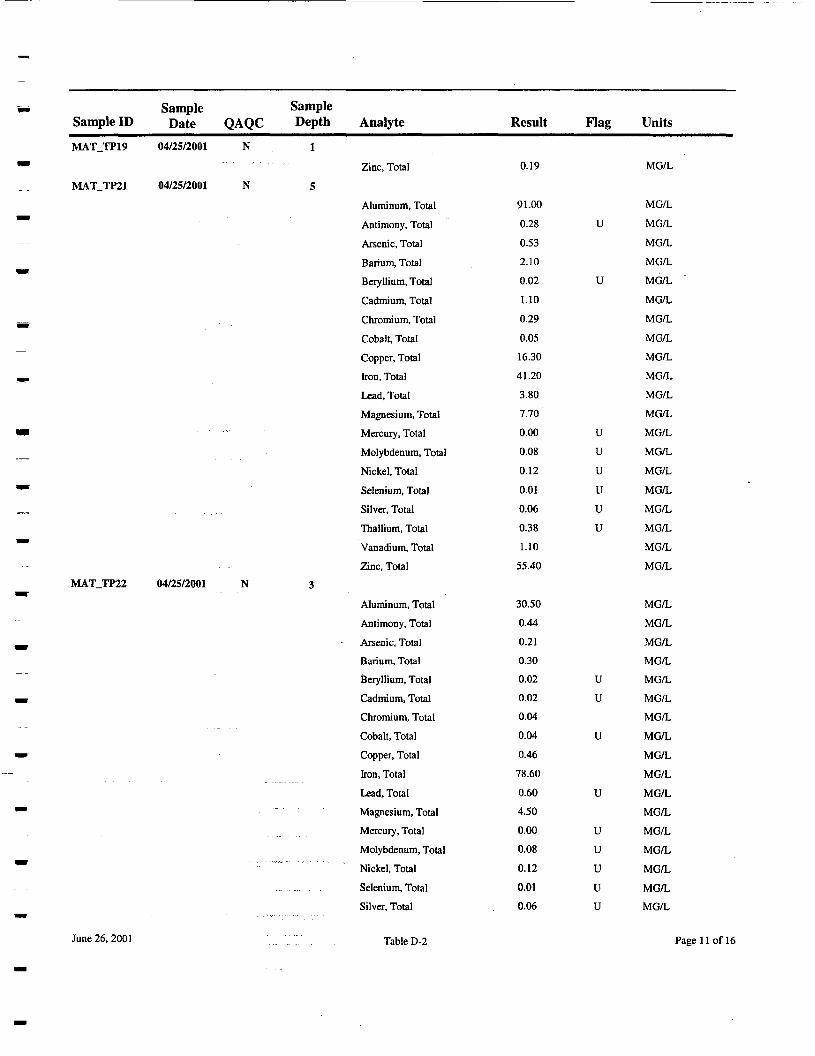
Sample SampleSample ID Date QAQC Depth AnalyteMATJTP19 04/25/2001 N . 1
Zinc, TotalMAT_TP21 04/25/2001 N 5
Aluminum, TotalAntimony, TotalArsenic, TotalBarium, TotalBeryllium, TotalCadmium, TotalChromium, Total
Cobalt, TotalCopper, TotalIron, TotalLead, TotalMagnesium, Total
• • • - Mercury, TotalMolybdenum, TotalNickel, TotalSelenium, TotalSilver, TotalThallium, TotalVanadium, TotalZinc, Total
MAT_TP22 04/25/2001 N 3
Aluminum, TotalAntimony, TotalArsenic, TotalBarium, TotalBeryllium, TotalCadmium, TotalChromium, TotalCobalt, TotalCopper, TotalIron, TotalLead, TotalMagnesium, TotalMercury, TotalMolybdenum, TotalNickel, TotalSelenium, TotalSilver, Total
Result
0.19
91.00
0.280.532.100.021.10
0.290.0516.3041.203.807.700.000.080.120.010.060.381.10
55.40
30.500.440.210.300.020.020.040.04
0.4678.600.604.500.000.080.12
0.010.06
Flag
u
u
uuuuuu
uu
u
u
uuuuu
Units
MG/L
MG/LMG/LMG/LMG/LMG/L
MG/LMG/LMG/LMG/LMG/LMG/LMG/LMG/LMG/L
MG/LMG/LMG/LMG/LMG/LMG/L
MG/LMG/LMG/LMG/L
MG/LMG/LMG/LMG/LMG/LMG/LMG/LMG/LMG/LMG/L
MG/LMG/LMG/L
June 26, 2001 Table D-2 Page 11 of 16
Sample SampleSample ID Date QAQC Depth AnalyteMAT_TP22 04/25/2001 N 3
Thallium, TotalVanadium, TotalZinc, Total
MAT_TP23 04/25/2001 N 2
Aluminum, TotalAntimony, TotalArsenic, TotalBarium, TotalBeryllium, TotalCadmium, TotalChromium, TotalCobalt, TotalCopper, TotalIron, TotalLead, TotalMagnesium, TotalMercury, TotalMolybdenum, TotalNickel, TotalSelenium, TotalSilver, TotalThallium, TotalVanadium, TotalZinc, Total
MAT_TP25 04/25/2001 N 1
Aluminum, TotalAntimony, Total
Arsenic, TotalBarium, TotalBeryllium, TotalCadmium, TotalChromium, Total
Cobalt, TotalCopper, TotalIron, TotalLead, TotalMagnesium, TotalMercury, Total
Molybdenum, TotalNickel, Total
Result
0.38
0.14
0.63
57.603.7025.303.000.020.120.230.8128.50180.0014.1010.70
0.000.520.600.010.060.380.1018.40
98.100.280.180.450.020.020.040.041.20
54.600.609.200.000.080.12
Flag
u
u
u
uuu
uu
uu
u
u
uuu
Units
MG/L
MG/LMG/L
MG/LMG/LMG/LMG/L
MG/LMG/LMG/L
MG/LMG/LMG/LMG/LMG/LMG/L
MG/LMG/LMG/LMG/LMG/L
MG/L
MG/L
MG/LMG/LMG/LMG/LMG/LMG/LMG/LMG/LMG/LMG/LMG/LMG/LMG/LMG/LMG/L
June 26,2001 Table D-2 Page 12 of 16
Sample SampleSample ID j)ate QAQC Depth AnalyteMAT_TP25 04/25/2001 N 1
Selenium, TotalSilver, TotalThallium, TotalVanadium, TotalZinc, Total
MAT_TP29 04/25/2001 N 3
Aluminum, TotalAntimony, TotalArsenic, TotalBarium, TotalBeryllium, TotalCadmium, TotalChromium, TotalCobalt, TotalCopper, TotalIron, TotalLead, TotalMagnesium, TotalMercury, TotalMolybdenum, TotalNickel, TotalSelenium, TotalSilver, TotalThallium, TotalVanadium, TotalZinc, Total
MAT_TP30A 04/25/2001 N 1
Aluminum, TotalAntimony, TotalArsenic, TotalBarium, TotalBeryllium, TotalCadmium, TotalChromium, TotalCobalt, TotalCopper, TotalIron, TotalLead, TotalMagnesium, TotalMercury, Total
Result
0.010.060.38
0.200.47
117.000.280.181.200.020.070.040.683.3032.900.6058.500.00
0.080.150.010.060.380.339.20
5.700.280.381.400.020.020.020.040.28
179.006.405.000.00
Flag
truu
uu
u
u
uu
uuu
u
uuuu
u
Units
MG/L
MG/LMG/L
MG/LMG/L
MG/LMG/LMG/LMG/LMG/LMG/LMG/LMG/LMG/LMG/LMG/LMG/LMG/L
MG/LMG/LMG/LMG/LMG/LMG/LMG/L
MG/LMG/LMG/LMG/LMG/LMG/LMG/LMG/LMG/LMG/LMG/LMG/LMG/L
June 26,2001 Table D-2 Page 13 of 16
Sample SampleSample ID Date QAQC Depth AnalyteMATJTP30A 04/25/2001 N 1
Molybdenum, TotalNickel, TotalSelenium, TotalSilver, TotalThallium, TotalVanadium, TotalZinc, Total
MATJTP30B 04/25/2001 N 4
Aluminum, TotalAntimony, TotalArsenic, TotalBarium, TotalBeryllium, TotalCadmium, TotalChromium, TotalCobalt, TotalCopper, TotalIron, TotalLead, TotalMagnesium, TotalMercury, TotalMolybdenum, TotalNickel, TotalSelenium, TotalSilver, TotalThallium, TotalVanadium, TotalZinc, Total
MATJTP31 04/26/2001 N 2
Aluminum, TotalAntimony, TotalArsenic, TotalBarium, TotalBeryllium, TotalCadmium, Total
_ ........ Chromium, TotalCobalt, Total
• • - -—- Copper, TotalIron, TotalLead, Total
Result
0.08
0.120.010.060.380.030.72
88.200.280.180.970.020.020.380.04
49.7066.000.728.000.000.080.12
0.010.060.380.691.10
,
12.800.280.180.630.020.100.020.61
66.3035.600.60
Flag
uuuuu
uu
uu
u
uuuuu
uu
u
u
u
Units
MG/L
MG/LMG/LMG/L
MG/LMG/LMG/L
MG/LMG/LMG/LMG/LMG/LMG/LMG/LMG/LMG/LMG/LMG/LMG/LMG/LMG/LMG/L
MG/LMG/LMG/LMG/LMG/L
MG/LMG/LMG/LMG/LMG/LMG/LMG/LMG/L
MG/LMG/LMG/L
June 26, 2001 Table D-2 Page 14 of 16
Sample SampleSample ID Date QAQC Depth AnalyteMAT_TP31 04/26/2001 N 2
Magnesium, TotalMercury, Total
Molybdenum, TotalNickel, TotalSelenium, TotalSilver, TotalThallium, TotalVanadium, TotalZinc, Total
MATJTP33 04/26/2001 N 2
Aluminum, TotalAntimony, TotalArsenic, TotalBarium, TotalBeryllium, Total
Cadmium, TotalChromium, TotalCobalt, TotalCopper, TotalIron, TotalLead, TotalMagnesium, TotalMercury, TotalMolybdenum, TotalNickel, Total.
Selenium, TotalSilver, Total
Thallium, TotalVanadium, TotalZinc, Total
MAT_TP3S 04/26/2001 N 3
Aluminum, TotalAntimony, TotalArsenic, Total
'"-"'- Barium,TotalBeryllium, TotalCadmium, Total
Chromium, TotalCobalt, TotalCopper, Total
Result
161.00
0.00
0.080.15
0.010.060.380.564.70
7.900.280.590.080.020.02
0.020.041.90
540.000.601.400.000.240.120.010.060.380.040.66
125.00
0.280.180.420.020.020.020.861.30
Flag
U
uUu
u
uuuu
uuu
uuuu
uu
uuu
Units
MG/L
MG/LMG/L
MG/LMG/LMG/LMG/LMG/LMG/L
MG/LMG/LMG/LMG/LMG/LMG/LMG/LMG/LMG/LMG/LMG/LMG/LMG/LMG/LMG/LMG/LMG/L
MG/LMG/LMG/L
MG/LMG/LMG/LMG/LMG/LMG/LMG/LMG/LMG/L
June 26, 2001 Table D-2 Page 15 of 16
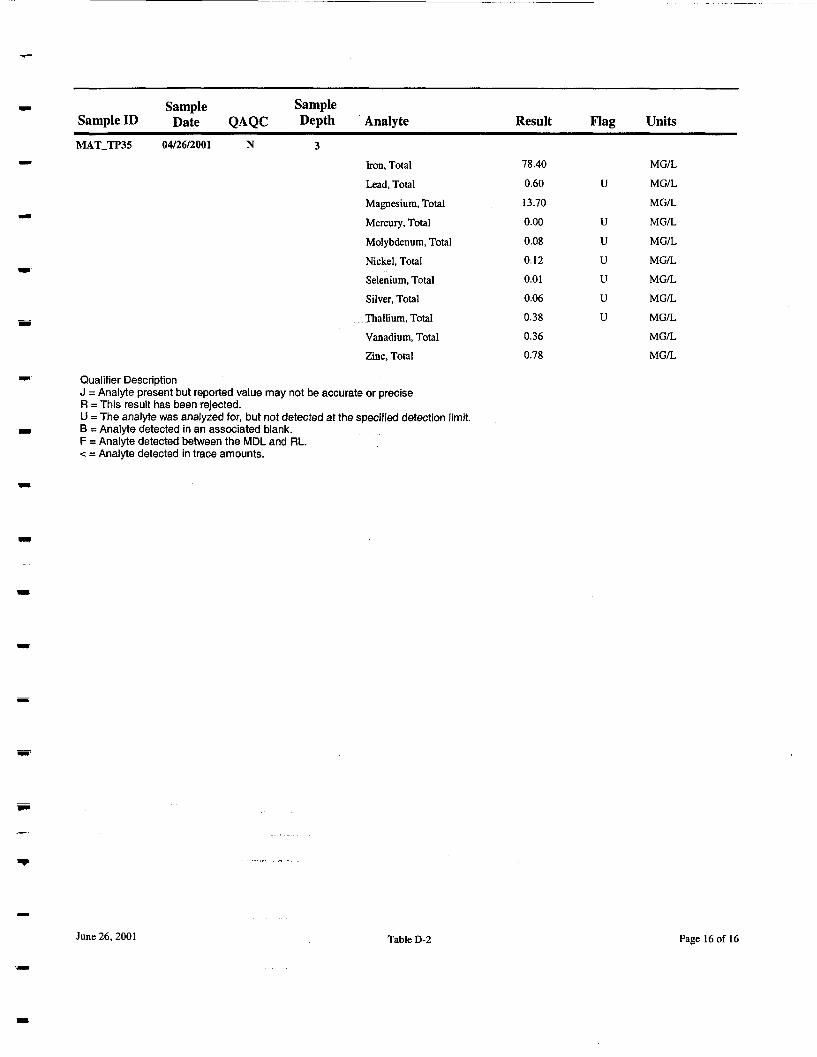
Sample SampleSample ID Date QAQC Depth AnalyteMAT_TP3S 04/26/2001 N 3
Iron, TotalLead, TotalMagnesium, Total
Mercury, TotalMolybdenum, TotalNickel, TotalSelenium, TotalSilver, TotalThallium, TotalVanadium, TotalZinc, Total
Result
78.40
0.6013.700.00
0.080.120.010.060.380.360.78
Flag
u
uuuuuu
Units
MG/L
MG/LMG/LMG/L
MG/LMG/LMG/LMG/LMG/LMG/LMG/L
Qualifier DescriptionJ = Analyte present but reported value may not be accurate or preciseR = This result has been rejected.U = The analyte was analyzed for, but not detected at the specified detection limit.B = Analyte detected in an associated blank.F = Analyte detected between the MDL and RL.< = Analyte detected in trace amounts.
June 26, 2001 Table D-2 Page 16 of 16
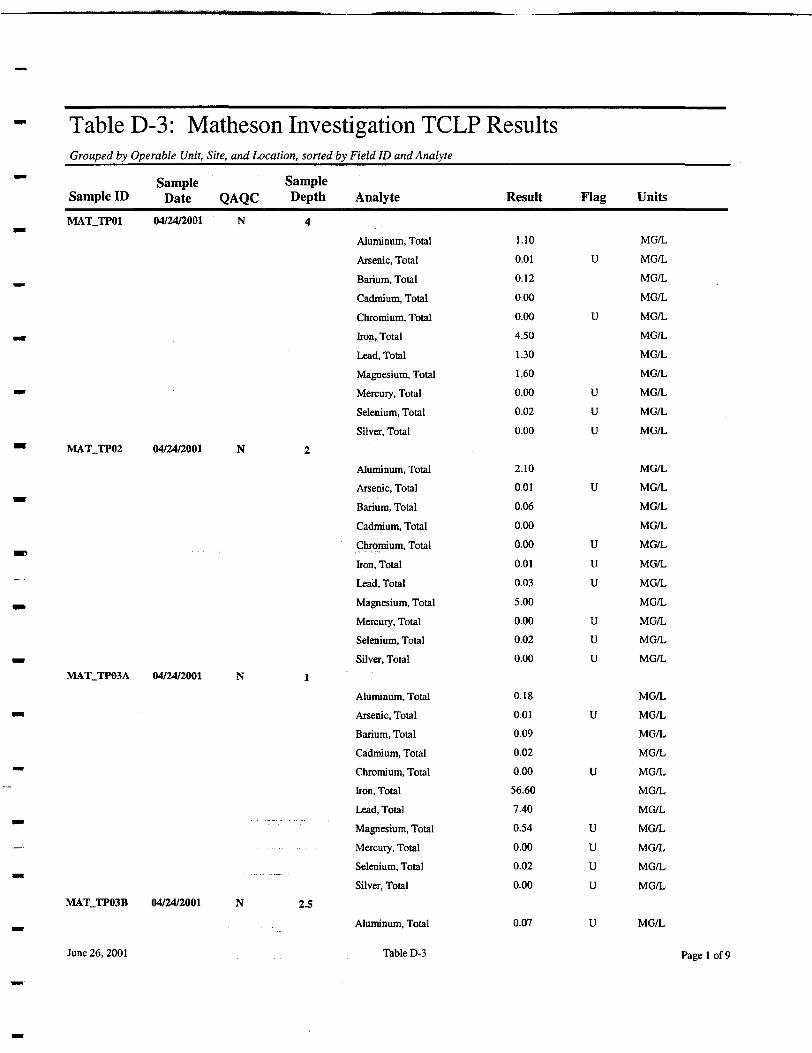
Table D-3: Matheson Investigation TCLP ResultsGrouped by Operable Unit, Site, and Location, sorted by Field ID andAnalyte
Sample SampleSample ID Date QAQC DepthMATJTPOl 04/24/2001 N 4
MAT_TP02 04/24/2001 N 2
MAT_TP03A 04/24/2001 N 1
MATJTP03B 04/24/2001 N 2.5
June 26, 2001
Analyte
Aluminum, TotalArsenic, TotalBarium, TotalCadmium, TotalChromium, Totalton, TotalLead, TotalMagaesium, TotalMercury, TotalSelenium, TotalSilver, Total
Aluminum, TotalArsenic, TotalBarium, TotalCadmium, TotalChromium, Total
Iron, TotalLead, TotalMagnesium, TotalMercury, TotalSelenium, TotalSilver, Total
Aluminum, TotalArsenic, TotalBarium, TotalCadmium, TotalChromium, TotalIron, TotalLead, TotalMagnesium, TotalMercury, TotalSelenium, TotalSilver, Total
Aluminum, Total
Table D-3
Result
1.100.010.120.000.004.501.301.600.000.020.00
2.100.010.060.000.000.010.035.000.000.020.00
0.180.010.090.020.0056.607.400.54
0.000.020.00
0.07
Flag
u
u
uuu
u
uuu
uuu
u
u
uuuu
u
Units
MG/LMG/LMG/LMG/LMG/LMG/LMG/LMG/LMG/LMG/L
MG/L
MG/LMG/LMG/L
MG/LMG/L
MG/LMG/LMG/LMG/LMG/LMG/L
MG/LMG/LMG/LMG/LMG/LMG/LMG/LMG/LMG/LMG/LMG/L
MG/L
Page 1 of 9
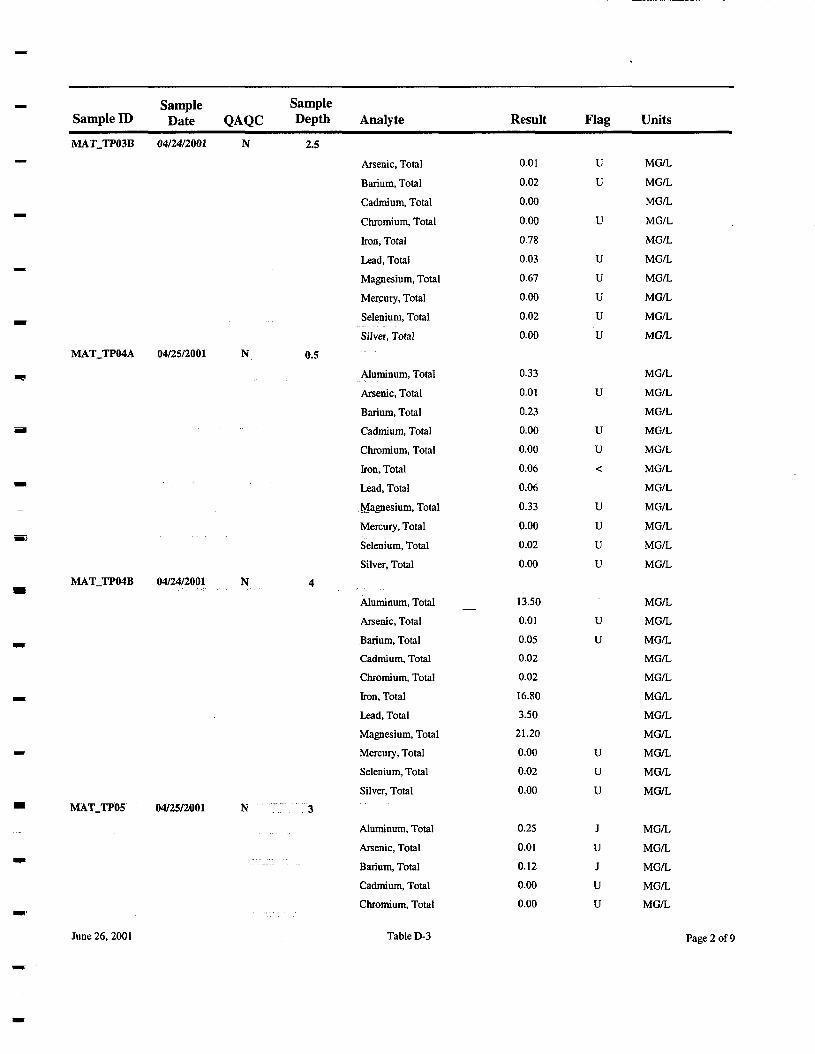
Sample SampleSample ID Date QAQC Depth AnalyteMAT_TP03B 04/24/2001 N 2.5
Arsenic, TotalBarium, TotalCadmium, TotalChromium, TotalIron, TotalLead, TotalMagnesium, TotalMercury, TotalSelenium, TotalSilver, Total
MAT_TP04A 04/25/2001 N 0.5
Aluminum, Total
Arsenic, TotalBarium, TotalCadmium, TotalChromium, TotalIron, TotalLead, TotalMagnesium, TotalMercury, TotalSelenium, TotalSilver, Total
MAT_TP04B 04/24/2001 N 4
Aluminum, TotalArsenic, TotalBarium, TotalCadmium, TotalChromium, TotalIron, TotalLead, TotalMagnesium, TotalMercury, TotalSelenium, TotalSilver, Total
MATJTP05 04/25/2001 N 3
Aluminum, TotalArsenic, TotalBarium, TotalCadmium, TotalChromium, Total
Result
0.01
0.020.00
0.000.78
0.030.670.000.020.00
0.330.01
0.230.000.000.060.06
0.330.000.020.00
13.500.01
0.050.020.0216.803.50
21.200.000.020.00
0.250.010.120.000.00
Flag
uu
u
uuuuu
u
uu<
uuuu
uu
uuu
JuJuu
Units
MG/L
MG/LMG/L
MG/LMG/LMG/LMG/LMG/LMG/LMG/L
MG/LMG/LMG/LMG/LMG/LMG/LMG/LMG/LMG/LMG/LMG/L
MG/LMG/LMG/LMG/LMG/LMG/LMG/LMG/LMG/LMG/LMG/L
MG/LMG/LMG/LMG/LMG/L
June 26, 2001 Table D-3 Page 2 of9
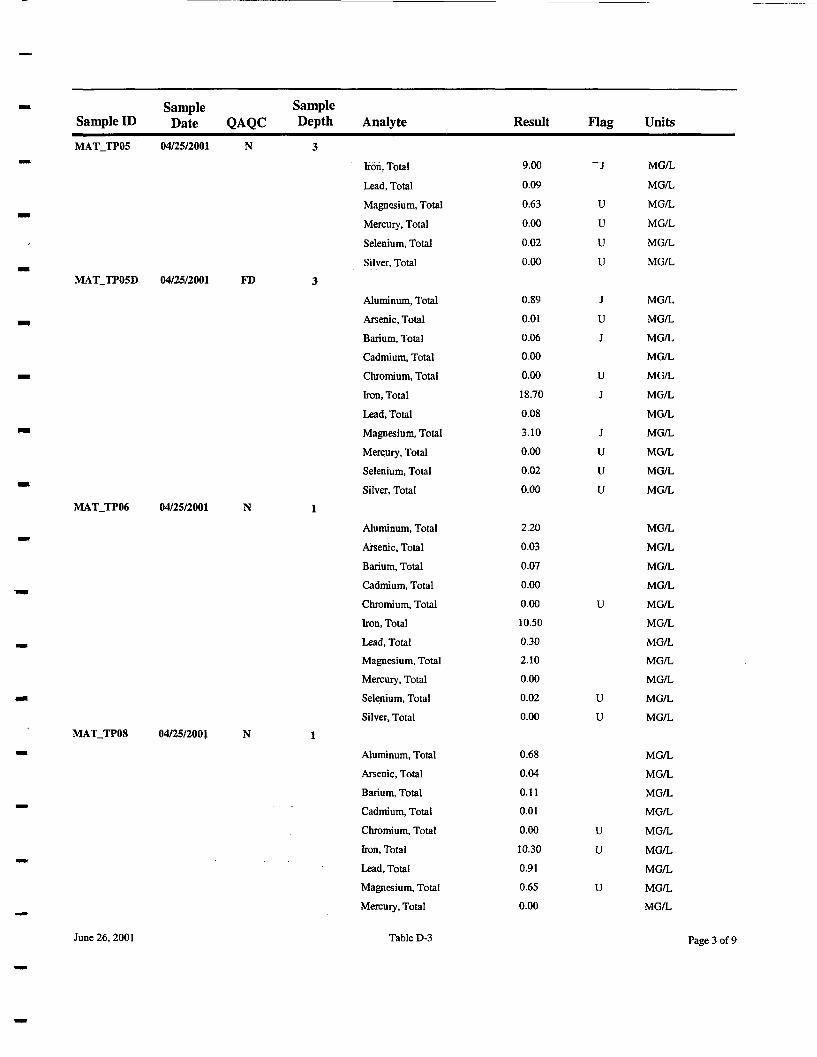
Sample SampleSample ID Date QAQC Depth AnalyteMATJTP05 04/25/2001 N 3
Iron, TotalLead, TotalMagnesium, TotalMercury, TotalSelenium, TotalSilver, Total
MATJTP05D 04/25/2001 FD 3
Aluminum, TotalArsenic, TotalBarium, TotalCadmium, TotalChromium, TotalIron, TotalLead, TotalMagnesium, TotalMercury, TotalSelenium, TotalSilver, Total
MAT_TP06 04/25/2001 N 1
Aluminum, Total
Arsenic, TotalBarium, TotalCadmium, TotalChromium, TotalIron, TotalLead, TotalMagnesium, Total
Mercury, TotalSelenium, TotalSilver, Total
MAT_TP08 04/25/2001 N 1
Aluminum, TotalArsenic, TotalBarium, TotalCadmium, TotalChromium, TotalIron, TotalLead, TotalMagnesium, TotalMercury, Total
Result
9.000.09
0.630.000.020.00
0.890.010.060.000.00
18.700.083.100.000.020.00
2.200.030.070.000.0010.500.302.100.000.020.00
0.680.040.110.010.00
10.300.910.650.00
Flag
-j
uuuu
JuJ
uJ
Juuu
u
uu
uu
u
Units
MG/L
MG/LMG/L
MG/LMG/LMG/L
MG/LMG/LMG/LMG/LMG/LMG/LMG/LMG/LMG/LMG/LMG/L
MG/LMG/L
MG/LMG/LMG/LMG/LMG/LMG/LMG/LMG/LMG/L
MG/LMG/LMG/LMG/LMG/LMG/LMG/LMG/LMG/L
June 26, 2001 Table D-3 Page 3 of 9
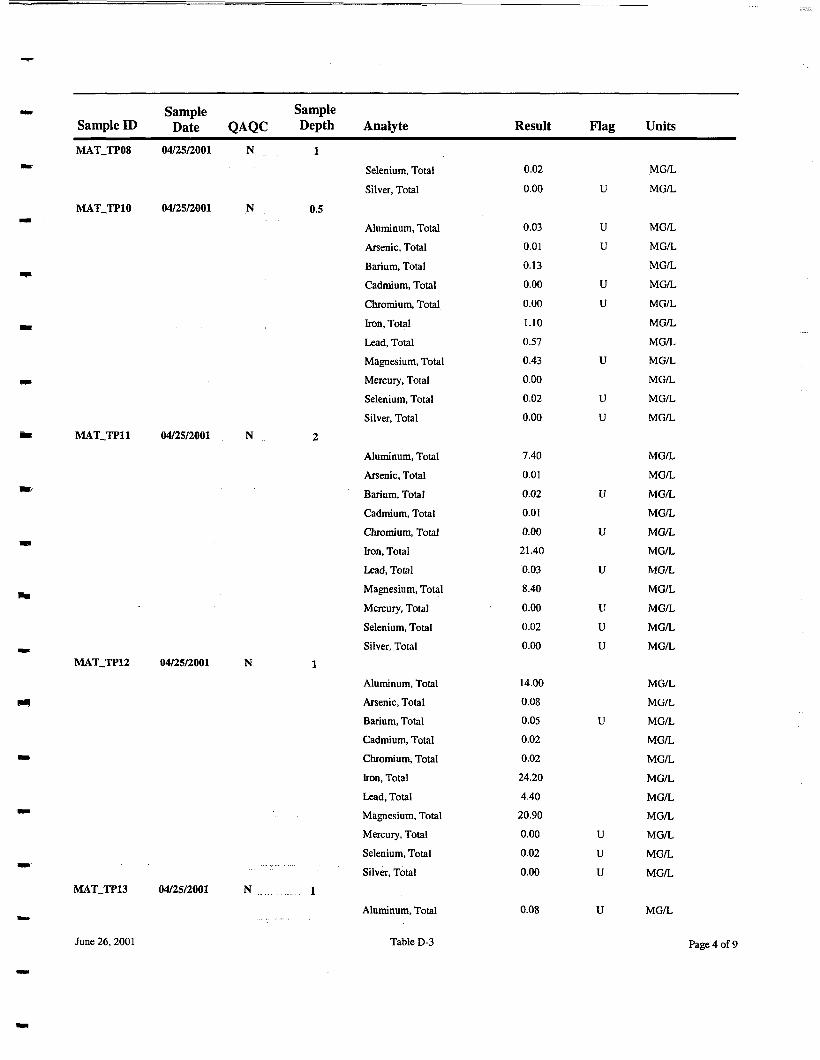
Sample SampleSample ID Date QAQC DepthMAT_TP08 04/25/2001 N 1
MATJTP10 04/25/2001 N 0.5
MAT_TP11 04/25/2001 N 2
MAT_TP12 04/25/2001 N 1
MAT_TP13 04/25/2001 N . ._ . . . . . . . . . . . . 1
June 26, 2001
Analyte
Selenium, TotalSilver, Total
Aluminum, TotalArsenic, TotalBarium, TotalCadmium, TotalChromium, TotalIron, TotalLead, TotalMagnesium, TotalMercury, TotalSelenium, TotalSilver, Total
Aluminum, TotalArsenic, TotalBarium, TotalCadmium, TotalChromium, TotalIron, TotalLead, TotalMagnesium, TotalMercury, TotalSelenium, TotalSilver, Total
Aluminum, TotalArsenic, TotalBarium, TotalCadmium, TotalChromium, TotalIron, TotalLead, TotalMagnesium, TotalMercury, TotalSelenium, TotalSilver, Total
Aluminum, Total
Table D-3
Result
0.02
0.00
0.030.010.130.000.00
1.100.570.430.000.020.00
7.400.010.020.010.00
21.400.038.400.000.020.00
14.000.080.050.020.0224.204.40
20.900.000.020.00
0.08
Flag
u
uu
uu
u
uu
u
u
u
uuu
u
uuu
u
Units
MG/L
MG/L
MG/L
MG/LMG/LMG/LMG/LMG/LMG/LMG/LMG/LMG/LMG/L
MG/LMG/LMG/LMG/LMG/LMG/LMG/LMG/LMG/LMG/LMG/L
MG/LMG/LMG/LMG/LMG/LMG/LMG/LMG/LMG/LMG/LMG/L
MG/L
Paee4of9
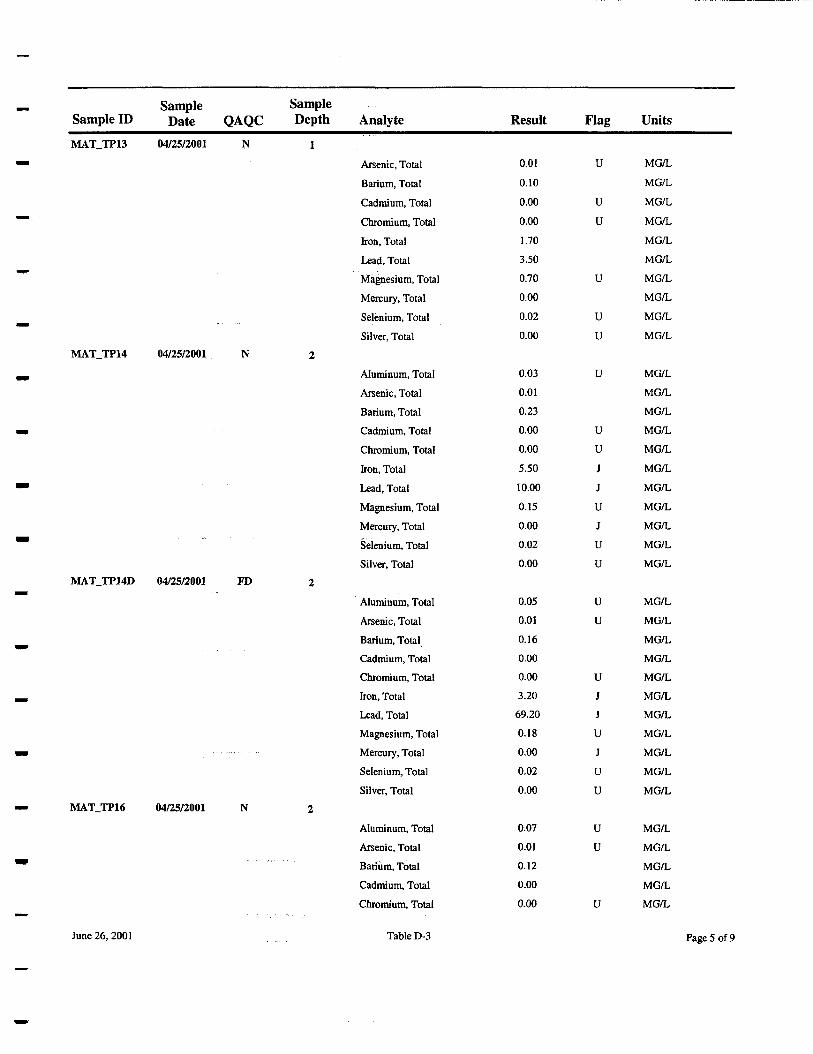
Sample SampleSample ID Date QAQC Depth AnalyteMAT_TP13 04/25/2001 N 1
Arsenic, TotalBarium, TotalCadmium, TotalChromium, Totalton, TotalLead, TotalMagnesium, TotalMercury, TotalSelenium, TotalSilver, Total
MATJTP14 04/25/2001 N 2
Aluminum, TotalArsenic, TotalBarium, TotalCadmium, TotalChromium, Total
Iron, TotalLead, TotalMagnesium, TotalMercury, TotalSelenium, TotalSilver, Total
MAT_TP14D 04/25/2001 FD 2
Aluminum, TotalArsenic, TotalBarium, TotalCadmium, TotalChromium, TotalIron, TotalLead, TotalMagnesium, Total
. . , . . . . „ . . Mercury, TotalSelenium, TotalSilver, Total
MAT_TP16 04/25/2001 N 2
Aluminum, TotalArsenic, TotalBarium, TotalCadmium, TotalChromium, Total
Result
0.010.100.00
0.001.703.500.700.000.020.00
0.030.010.230.000.005.5010.000.150.000.020.00
0.050.010.160.000.003.2069.200.180.000.020.00
0.070.010.120.000.00
Flag
u
uu
u
uu
u
uuJJuJuu
uu
uJJuJuu
uu
u
Units
MG/L
MG/LMG/LMG/L
MG/LMG/LMG/LMG/LMG/LMG/L
MG/LMG/LMG/LMG/LMG/LMG/L
MG/LMG/LMG/LMG/LMG/L
MG/LMG/LMG/LMG/LMG/LMG/LMG/LMG/LMG/LMG/LMG/L
MG/LMG/LMG/LMG/LMG/L
June 26, 2001 Table D-3 Page 5 of 9
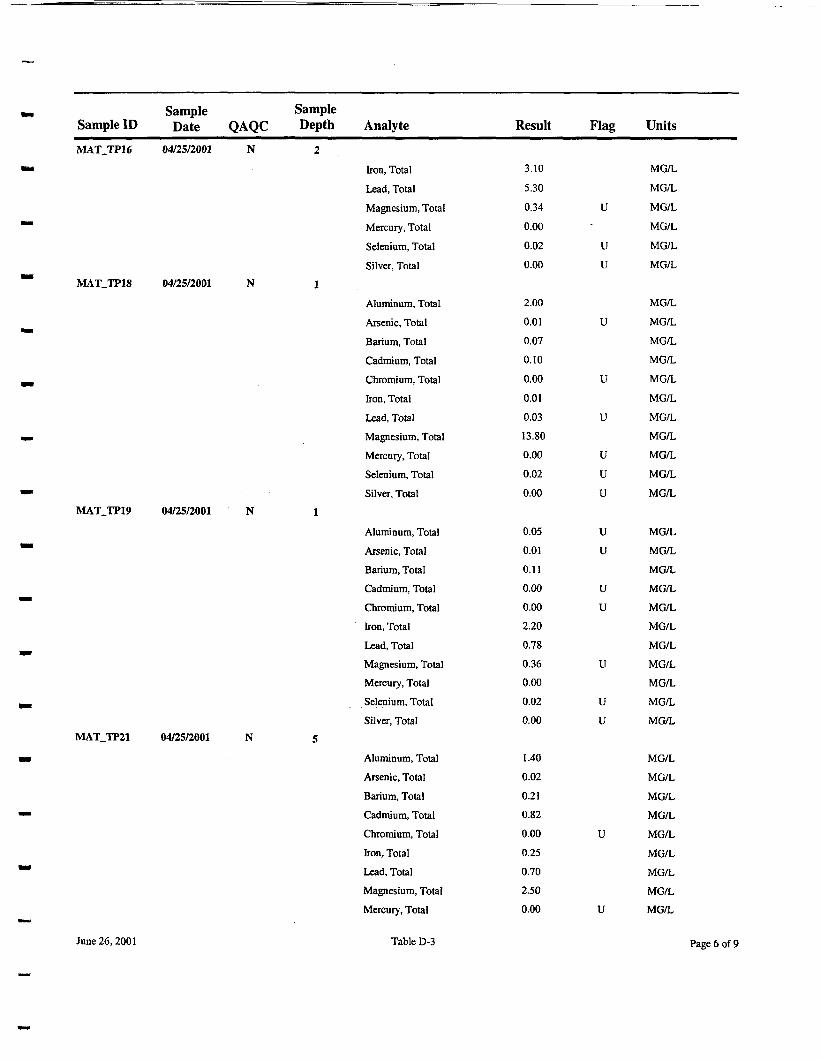
Sample SampleSample ID Date QAQC Depth AnalyteMATJTP16 04/25/2001 N 2
Iron, TotalLead, TotalMagnesium, TotalMercury, TotalSelenium, TotalSilver, Total
MATJTP18 04/25/2001 N 1
Aluminum, TotalArsenic, TotalBarium, TotalCadmium, TotalChromium, TotalIron, TotalLead, TotalMagnesium, TotalMercury, TotalSelenium, TotalSilver, Total
MATJTP19 04/25/2001 N 1
Aluminum, TotalArsenic, TotalBarium, TotalCadmium, TotalChromium, TotalIron, TotalLead, TotalMagnesium, TotalMercury, TotalSelenium, TotalSilver, Total
MAT_TP21 04/25/2001 N 5
Aluminum, TotalArsenic, TotalBarium, TotalCadmium, TotalChromium, TotalIron, TotalLead, TotalMagnesium, TotalMercury, Total
Result
3.105.300.34
0.000.020.00
2.00
0.010.070.100.00
0.010.0313.800.000.020.00
0.050.010.110.000.002.200.780.360.000.020.00
1.400.020.210.820.000.250.702.500.00
Flag
u
uu
u
u
u
uuu
uu
uu
u
uu
u
u
Units
MG/L
MG/LMG/LMG/L
MG/LMG/L
MG/LMG/LMG/LMG/LMG/LMG/LMG/LMG/LMG/LMG/LMG/L
MG/LMG/LMG/LMG/LMG/LMG/LMG/LMG/LMG/LMG/LMG/L
MG/LMG/L
MG/LMG/LMG/LMG/LMG/LMG/LMG/L
June 26, 2001 Table D-3 Page 6 of 9
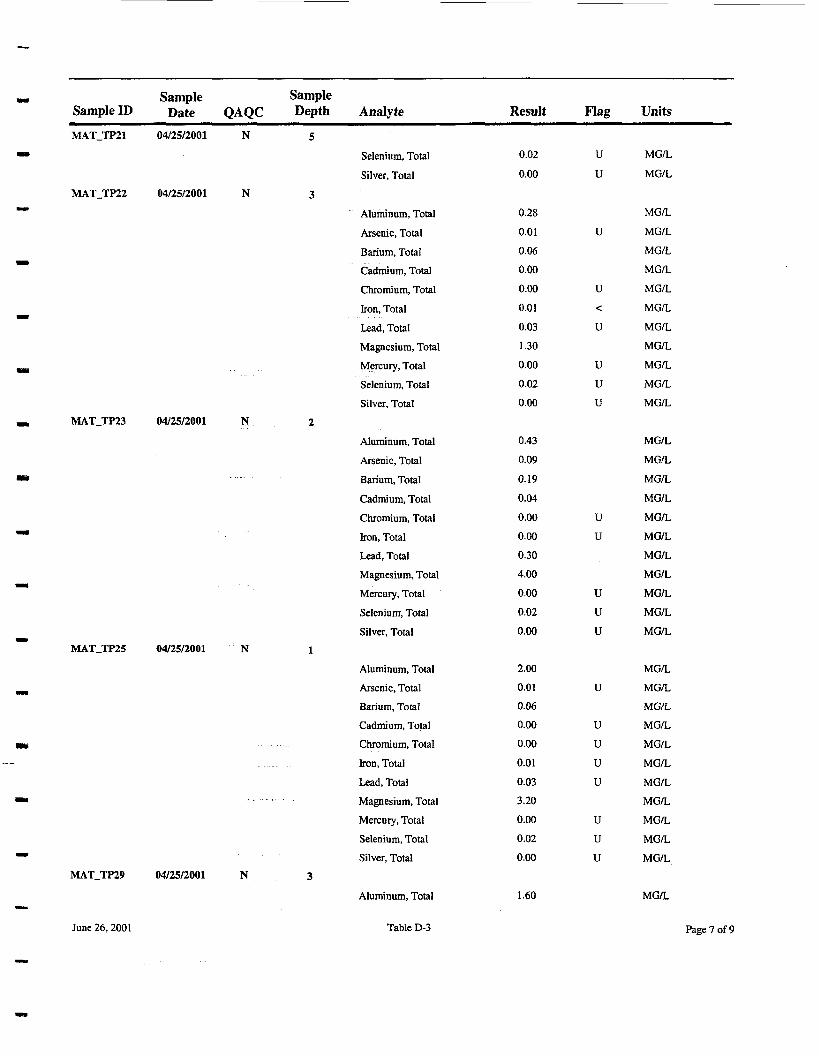
SampleSample ID Date QAQCMATJTP21 04/25/2001 N
MATJTP22 04/25/2001 N
MAT_TP23 04/25/2001 N
MAT_TP25 04/25/2001 N
MAT_TP29 04/25/2001 N
June 26, 2001
SampleDepth Analyte
5Selenium, TotalSilver, Total
3Aluminum, TotalArsenic, TotalBarium, TotalCadmium, TotalChromium, TotalIron, TotalLead, TotalMagnesium, TotalMercury, TotalSelenium, TotalSilver, Total
2Aluminum, TotalArsenic, TotalBarium, TotalCadmium, TotalChromium, Total
Iron, TotalLead, TotalMagnesium, TotalMercury, Total
Selenium, TotalSilver, Total
1Aluminum, TotalArsenic, TotalBarium, TotalCadmium, TotalChromium, TotalIron, TotalLead, TotalMagnesium, TotalMercury, TotalSelenium, TotalSilver, Total
3
Aluminum, Total
Table D-3
Result
0.02
0.00
0.280.010.060.000.00
0.010.031.300.000.020.00
0.430.09
0.190.040.000.000.304.000.000.020.00
2.000.010.060.000.000.010.033.200.000.020.00
1.60
Flag
uu
u
u<
u
uuu
uu
uuu
u
uuuu
uuu
Units
MG/L
MG/L
MG/L
MG/LMG/LMG/LMG/LMG/LMG/LMG/LMG/LMG/LMG/L
MG/LMG/L
MG/LMG/LMG/LMG/LMG/LMG/LMG/LMG/LMG/L
MG/LMG/LMG/LMG/LMG/LMG/LMG/LMG/LMG/LMG/LMG/L
MG/L
Page 7 of 9
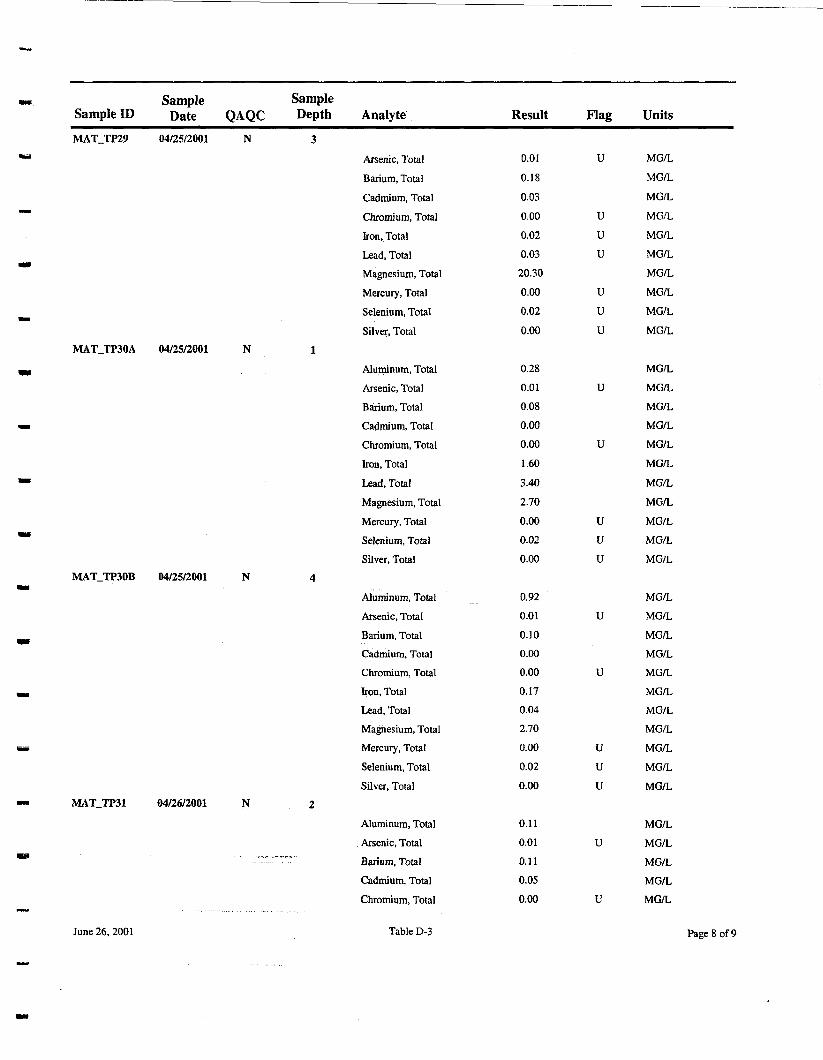
Sample SampleSample ID Date QAQC Depth AnalyteMATJTP29 04/25/2001 N 3
Arsenic, TotalBarium, TotalCadmium, TotalChromium, TotalIron, TotalLead, TotalMagnesium, TotalMercury, TotalSelenium, TotalSilver, Total
MAT_TP30A 04/25/2001 N 1
Aluminum, TotalArsenic, TotalBarium, TotalCadmium, TotalChromium, TotalIron, Total
Lead, TotalMagnesium, TotalMercury, TotalSelenium, TotalSilver, Total
MAT_TP30B 04/25/2001 N 4
Aluminum, TotalArsenic, TotalBarium, TotalCadmium, Total
Chromium, TotalIron, Total
Lead, TotalMagnesium, TotalMercury, Total
Selenium, TotalSilver, Total
MAT_TP31 04/26/2001 N 2
Aluminum, TotalArsenic, Total
""' - Barium, TotalCadmium, TotalChromium, Total
Result
0.01
0.180.030.000.020.0320.300.000.02
0.00
0.280.010.080.000.00
1.603.40
2.700.000.020.00
0.920.010.100.000.000.170.042.700.000.020.00
0.110.010.110.050.00
Flag
u
uuu
uuu
u
u
uuu
u
u
uuu
u
u
Units
MG/LMG/LMG/L
MG/LMG/LMG/LMG/LMG/LMG/L
MG/L
MG/LMG/LMG/LMG/LMG/L
MG/LMG/LMG/LMG/LMG/LMG/L
MG/LMG/LMG/LMG/LMG/LMG/LMG/LMG/LMG/LMG/LMG/L
MG/LMG/LMG/LMG/LMG/L
June 26, 2001 Table D-3 Page 8 of9
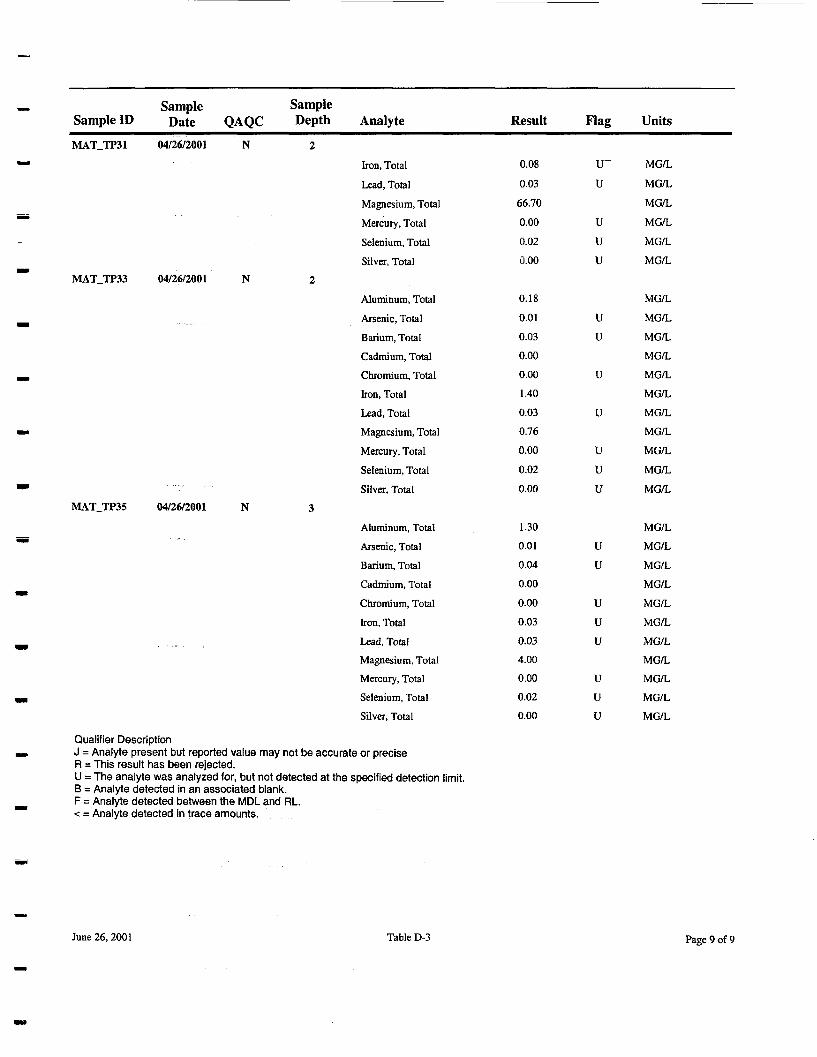
Sample SampleSample ID Date QAQC Depth AnalyteMATJTP31 04/26/2001 N 2
Iron, TotalLead, TotalMagnesium, TotalMercury, Total
Selenium, TotalSilver, Total
MAT_TP33 04/26/2001 N 2
Aluminum, TotalArsenic, TotalBarium, TotalCadmium, TotalChromium, TotalIron, TotalLead, TotalMagnesium, TotalMercury, TotalSelenium, TotalSilver, Total
MAT_TP35 04/26/2001 N 3
Aluminum, TotalArsenic, TotalBarium, TotalCadmium, TotalChromium, TotalIron, TotalLead, TotalMagnesium, Total
Mercury, TotalSelenium, TotalSilver, Total
Result
0.080.03
66.700.000.020.00
0.18
0.010.030.000.001.400.030.760.000.02
0.00
1.300.0 10.040.000.000.030.034.000.000.020.00
Flag
U"U
uuu
uu
V
u
uuu
uu
uuu
uuu
Units
MG/L
MG/LMG/LMG/L
MG/LMG/L
MG/LMG/LMG/LMG/LMG/LMG/LMG/LMG/LMG/L
MG/LMG/L
MG/LMG/LMG/LMG/LMG/LMG/LMG/LMG/LMG/LMG/LMG/L
Qualifier DescriptionJ = Analyte present but reported value may not be accurate or preciseR = This result has been rejected.U = The analyte was analyzed for, but not detected at the specified detection limit.B = Analyte detected in an associated blank.F = Analyte detected between the MDL and RL.< = Analyte detected in trace amounts.
June 26, 2001 Table D-3 Page 9 of 9
Appendix ESite Reconnaissance Visit Reports
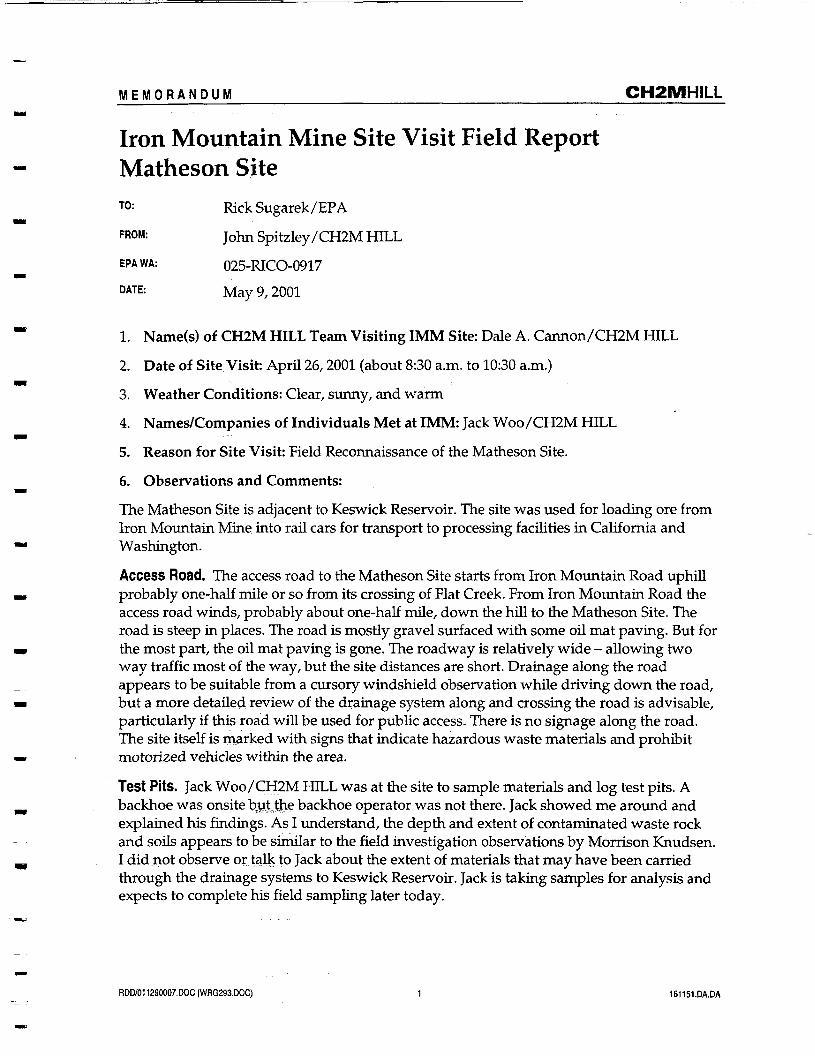
MEMORANDUM_________________________________CH2MHILL
Iron Mountain Mine Site Visit Field ReportMatheson SiteT0: Rick Sugarek/EPA
FROM: John Spitzley/CH2M HILL
EPAWA; 025-RICO-0917DATE: May 9/ 2001
1. Name(s) of CH2M HILL Team Visiting IMM Site: Dale A. Cannon/CH2M HILL
2. Date of Site Visit: April 26,2001 (about 8:30 a.m. to 10:30 a.m.)
3. Weather Conditions: Clear, sunny, and warm
4. Names/Companies of Individuals Met at IMM: Jack Woo/CH2M HILL
5. Reason for Site Visit: Field Reconnaissance of the Matheson Site.
6. Observations and Comments:
The Matheson Site is adjacent to Keswick Reservoir. The site was used for loading ore fromIron Mountain Mine into rail cars for transport to processing facilities in California andWashington.
Access Road. The access road to the Matheson Site starts from Iron Mountain Road uphillprobably one-half mile or so from its crossing of Flat Creek. From Iron Mountain Road theaccess road winds, probably about one-half mile, down the hill to the Matheson Site. Theroad is steep in places. The road is mostly gravel surfaced with some oil mat paving. But forthe most part, the oil mat paving is gone. The roadway is relatively wide - allowing twoway traffic most of the way, but the site distances are short. Drainage along the roadappears to be suitable from a cursory windshield observation while driving down the road,but a more detailed review of the drainage system along and crossing the road is advisable,particularly if this road will be used for public access. There is no signage along the road.The site itself is marked with signs that indicate hazardous waste materials and prohibitmotorized vehicles within the area.
Test Pits. Jack Woo/CH2M HILL was at the site to sample materials and log test pits. Abackhoe was onsite but the backhoe operator was not there. Jack showed me around andexplained his findings. As I understand, the depth and extent of contaminated waste rockand soils appears to be similar to the field investigation observations by Morrison Knudsen.I did not observe or talk to Jack about the extent of materials that may have been carriedthrough the drainage systems to Keswick Reservoir. Jack is taking samples for analysis andexpects to complete his field sampling later today.
RDD/011290007.DOC (WRG293.DOC) 1 161151.0A.DA
IRON MOUNTAIN MINE SITE VISIT FIELD REPORTMATHESON SITE
Drainage. The culverts across the old railroad bed on the south side of the site were coveredwith vegetation. Water from Keswick Reservoir appears to back up in the drainage culverts.Surface drainage appears to pond on the upper side of the culverts. On the north side of thesite, a 36-inch-diameter CMP culvert was exposed. Sediment from the Matheson Site andfrom the drainage basin was present in the drainage channel upstream from the culvert.Because there was no sign of erosion across the old railroad bed, it was assumed that theculverts were adequately sized but this should be verified. The physical condition of theculverts should also be verified if they are to be used for long-term drainage.
Sacramento River Trail to Shasta Dam. The river trail is an old railroad bed. It is wide andhas a graveled surfaced. A private residence is located about three-quarters of a mile northof the site. It appears that this property was accessed from this trail. Some railroad ties areexposed. The trackage may not have been removed or only partially removed. A pitbetween rails at the loading dock is open. I am not sure of the purpose of the pit, but it is asafety hazard and will need to be removed or filled.
Clean-up Cells. If disposal cells were to be located near the site, the best locations might beon the lower sections of the drainage gullies on either the north side or the south side of thesite. The upper sections of the gullies might be too narrow and to steep construct disposalcells. Vegetation would need to be removed, which would leave a scar visible from thereservoir and the trail. A disposal cell might be constructed at the lower section of the northgully but existing sediment would need to be temporarily removed, underdrains anddrainage pipes installed, membranes constructed, and waste rock and soils replaced andcovered. The drainage gully on the south side of the site appears to have more room fordisposal cells but is highly vegetated. This vegetation would need to be removed and thesite prepared with underdrains, drainage pipelines, and containment membranes. Therewould be a scar visible from the proposed trail and from the reservoir.
Debris. Debris, such as bed springs, cables, etc., was observed scattered around the site.Timbers were used for bulkheads. I suspect some timbers and other debris may be buriedon site.
RDD/011290007.DOC (WRG293.DOC)
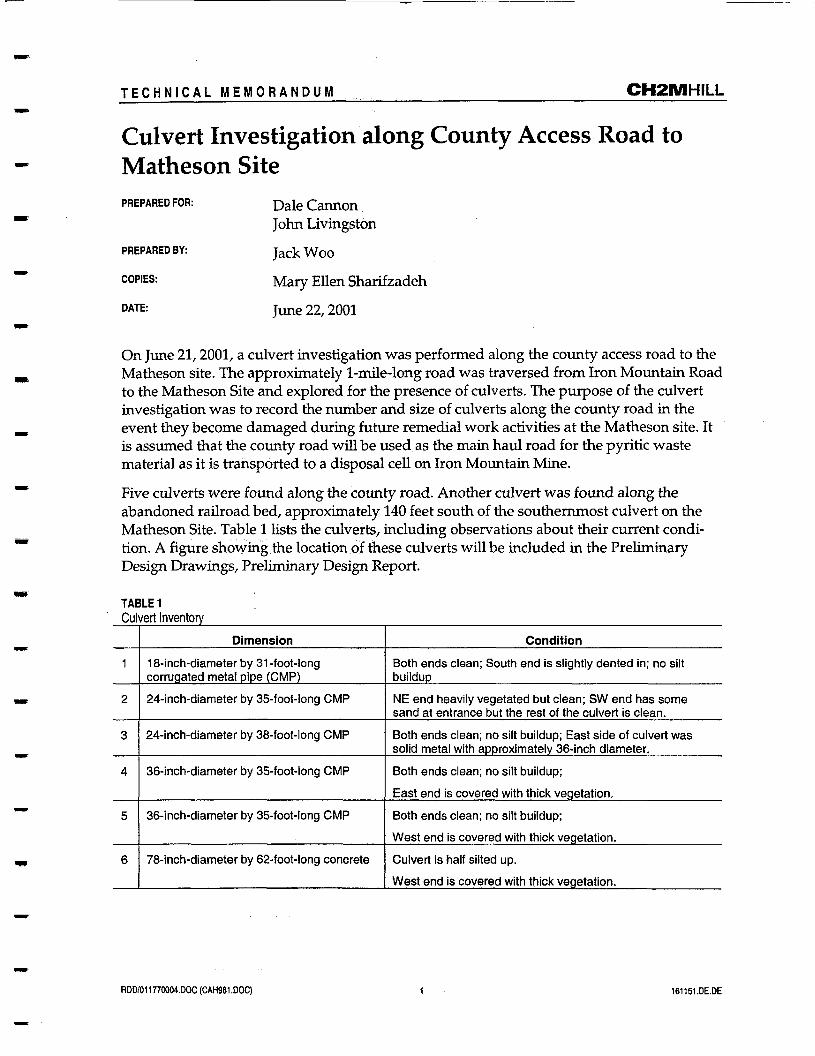
T E C H N I C A L M E M O R A N D U M CH2MHILL
Culvert Investigation along County Access Road toMatheson SitePREPARED FOR:
PREPARED BY:
COPIES:
DATE:
Dale CannonJohn Livingston
Jack Woo
Mary Ellen Sharifzadeh
June 22,2001
On June 21,2001, a culvert investigation was performed along the county access road to theMathespn site. The approximately 1-mile-long road was traversed from Iron Mountain Roadto the Matheson Site and explored for the presence of culverts. The purpose of the culvertinvestigation was to record the number and size of culverts along the county road in theevent they become damaged during future remedial work activities at the Matheson site. Itis assumed that the county road will be used as the main haul road for the pyritic wastematerial as it is transported to a disposal cell on Iron Mountain Mine.
Five culverts were found along the county road. Another culvert was found along theabandoned railroad bed, approximately 140 feet south of the southernmost culvert on theMatheson Site. Table 1 lists the culverts, including observations about their current condi-tion. A figure showing the location of these culverts will be included in the PreliminaryDesign Drawings, Preliminary Design Report.
TABLETCulvert Inventory
1
2
3
4
5
6
Dimension
1 8-inch-diameter by 31 -foot-longcorrugated metal pipe (CMP)
24-inch-diameter by 35-foot-long CMP
24-inch-diameter by 38-foot-long CMP
36-inch-diameter by 35-foot-long CMP
36-inch-diameterby 35-foot-long CMP
78-inch-diameter by 62-foot-long concrete
Condition
Both ends clean; South end is slightly dented in; no siltbuildup
NE end heavily vegetated but clean; SW end has somesand at entrance but the rest of the culvert is clean.
Both ends clean; no silt buildup; East side of culvert wassolid metal with approximately 36-inch diameter.
Both ends clean; no silt buildup;East end is covered with thick vegetation.
Both ends clean; no silt buildup;
West end is covered with thick vegetation.
Culvert is half silted up.West end is covered with thick vegetation.
RDD/011770004.DOC (CAH981.DOC) 161151.DE.DE
T E C H N I C A L MEMORANDUM___________________________CH2MHILL
Matheson Concrete Disposal Borrow SourcePREPARED FOR: Jack Woo
Dale Cannon
PREPARED BY: John LivingstonDATE: June 15,2001
Jack Woo and I visited the site on 6/15/01. We discussed removal of the concrete andmethods of breaking it up and disposing of it in the gully to the south. If the concrete isbroken up into 12-inch minus pieces, then I see no reason to import smaller soil materials tofill the voids because big voids should not occur. If lime needs to be added, it could beblown or sprinkled via bags of lime. If larger maximum size is allowed, then imported soilwould be needed to mix with the concrete to produce a fill relatively free of significantvoids. I looked at roads cuts along the steep access road facing Keswick Reservoir. Severalareas could easily be excavated to 5 feet plus without major ripping to produce somedecomposed granite (DG) material. These slopes are currently very steep and could beflattened; however, the environmental impact of doing this must be considered. I wouldestimate that getting 1,000 cubic yards would be easy.
We also visited the borrow/disposal site just south of the electronic gate to IMM. This areacontains some DG and appears underlain by colluvial soils that contain rock and soil.Boulders to 3 feet plus appear present. This is also a good source of material and couldeasily yield 1,000 cubic yards.
I recommend the disposal area in the gully south of the Matheson Site concrete walls becleared of all brush and contaminated sediment. It should be enlarged to receive theconcrete with the excavated material saved for cover material. The concrete should be eitherbroken into 12-inch minus and placed and compacted or broken into larger pieces andmixed with soil from an approved borrow source. The rebar must be removed to the pointwhere it does not interfere with compaction. This is a difficult decision without being hardto construct. Slabs can be put in the disposal cell if they are stacked and surrounded with12-inch minus material.
Let me know if you need further clarification or assistance.
RDD/011790003.DOC (CAH984.DOC) 1 161151.DE.DE