Embed Size (px)
Citation preview

Data Fluency for All
Professor Amy Greenwald
Favorite Visualization: Amy
Visualization of the
displacement of 10 million
enslaved Africans over the
course (3+ centuries) of the
Atlantic slave trade.
slavevoyages.org

Win probability as a function of time in Super Bowl 51.
Favorite Visualization: Aditya
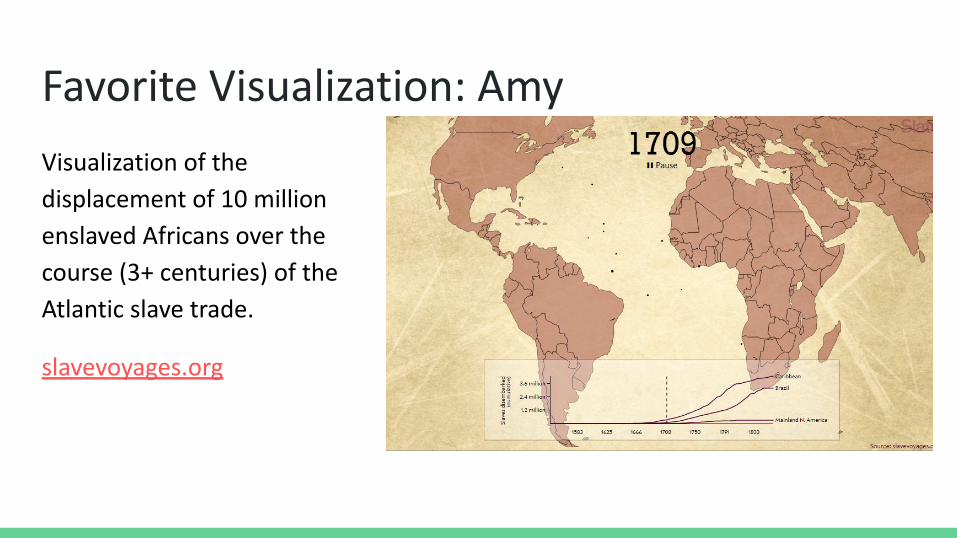
Favorite Visualization: Iris
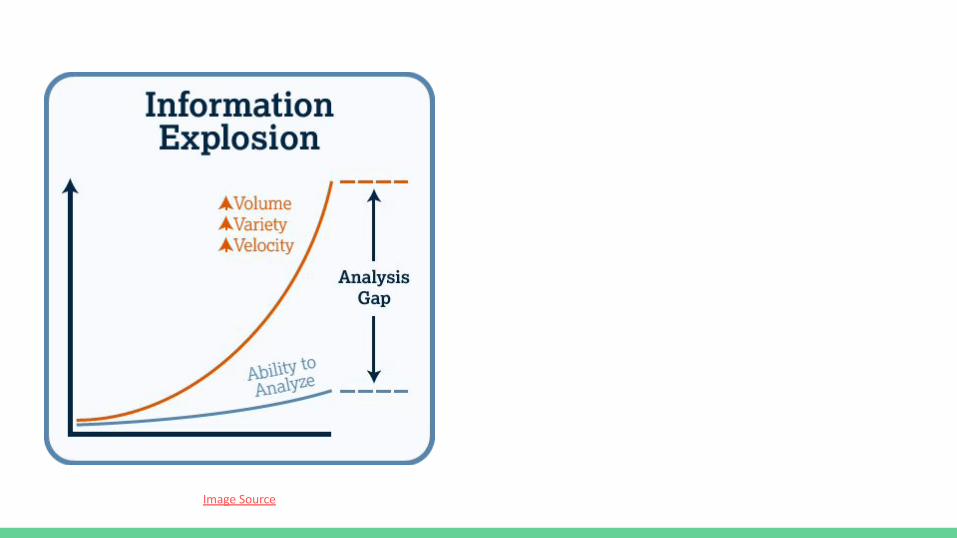
Image Source
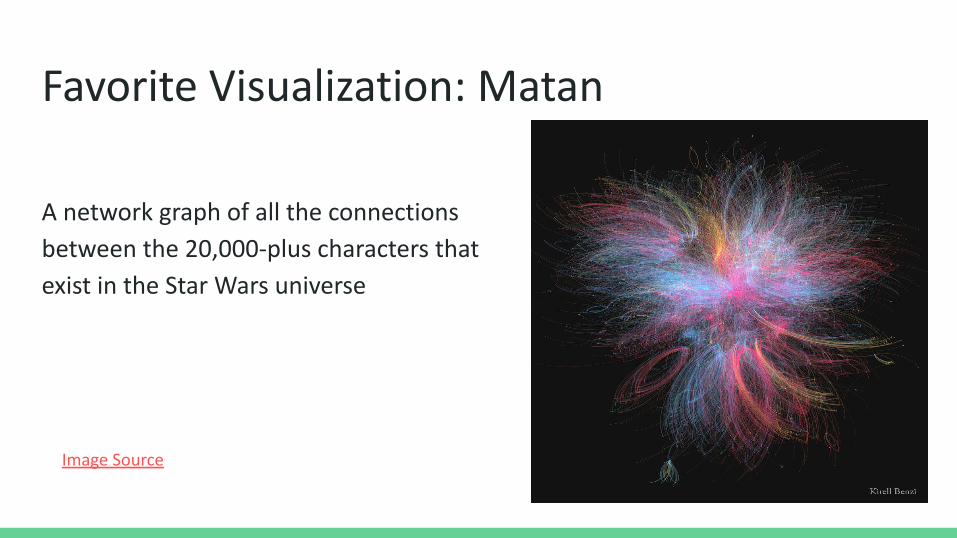
Favorite Visualization: Matan
A network graph of all the connections
between the 20,000-plus characters that
exist in the Star Wars universe
Image Source
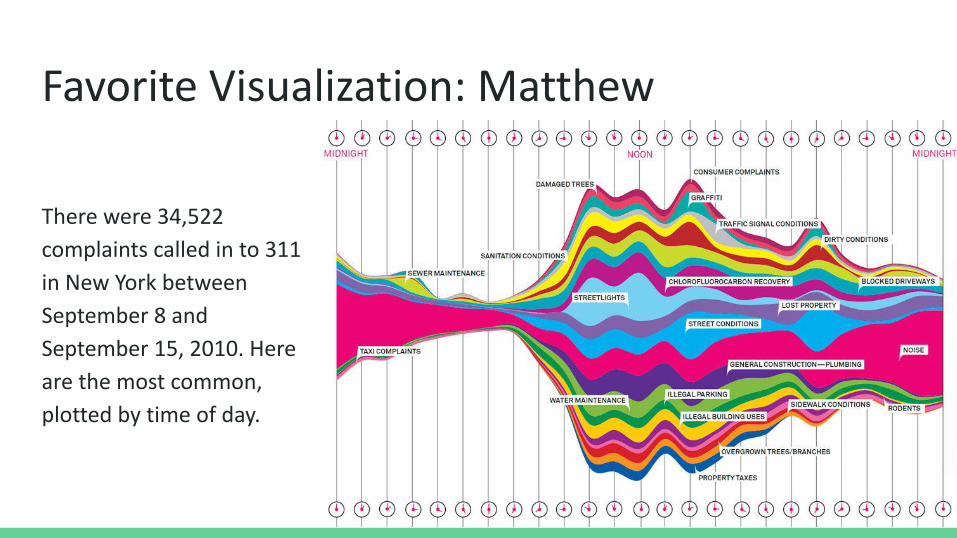
Favorite Visualization: Matthew
There were 34,522
complaints called in to 311
in New York between
September 8 and
September 15, 2010. Here
are the most common,
plotted by time of day.
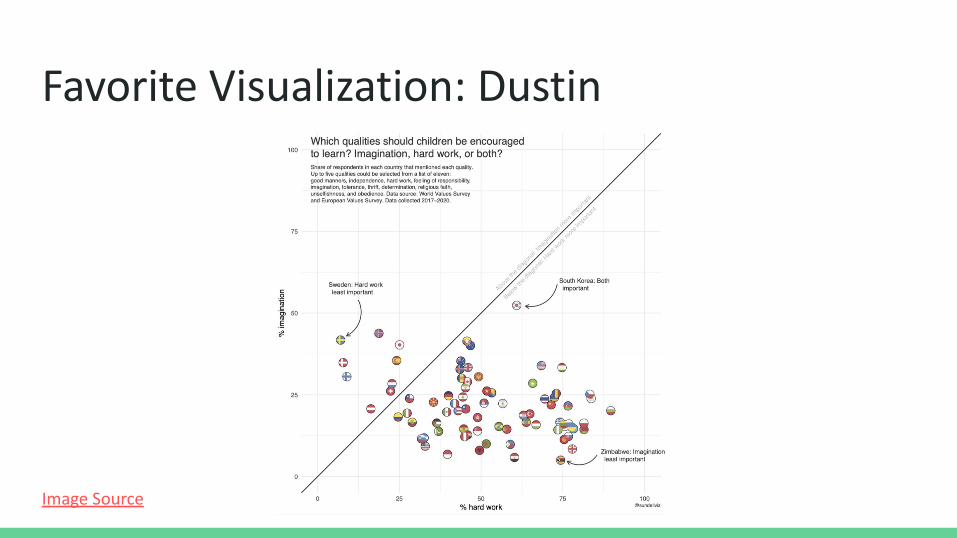
Image Source
Favorite Visualization: Dustin

Favorite Visualization: JenniferWealth shown to scale: Image Source
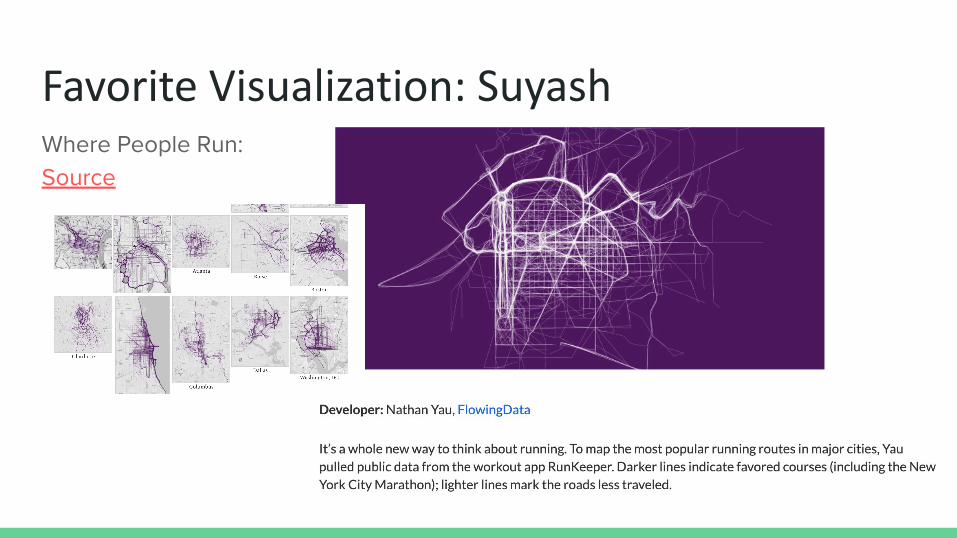
Favorite Visualization: SuyashWhere People Run:Source

Student Projects
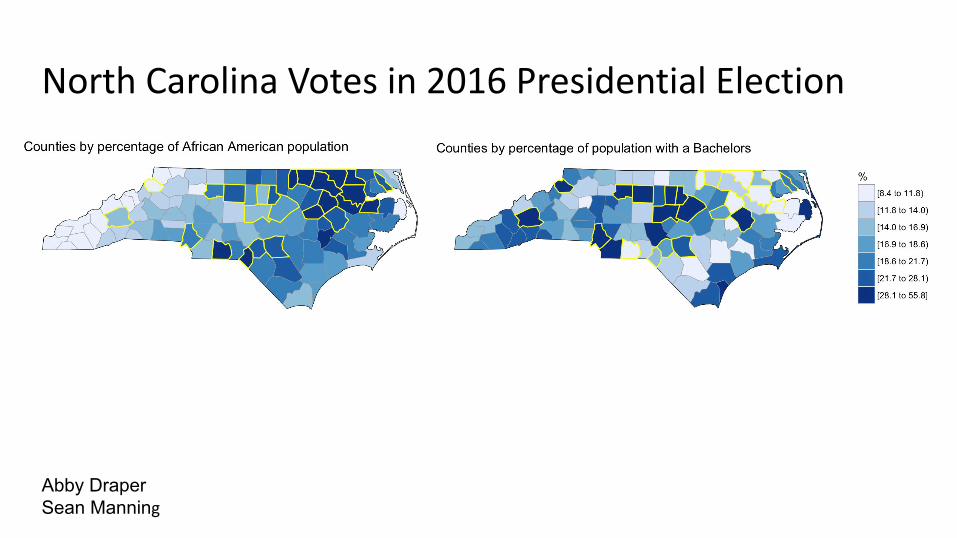
Abby DraperSean Manning
North Carolina Votes in 2016 Presidential Election
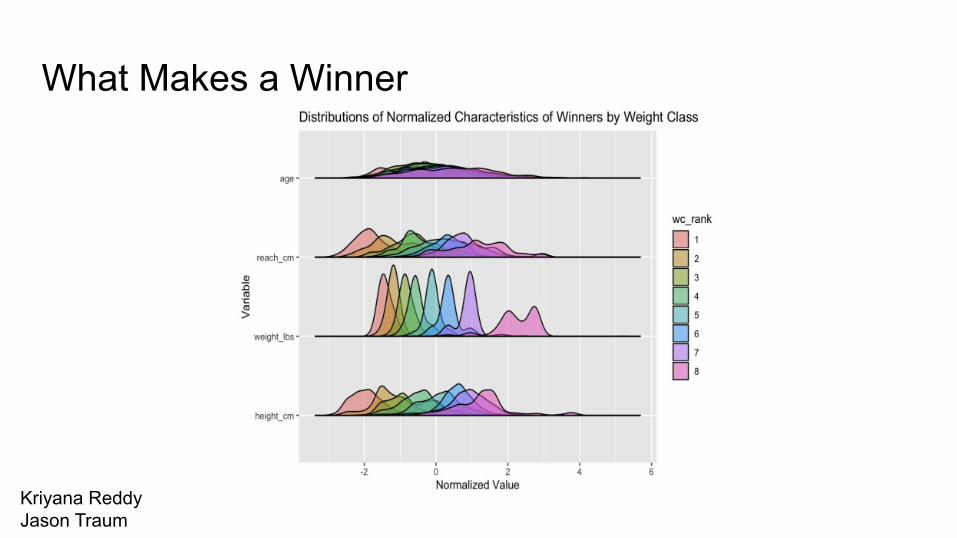
What Makes a Winner
Kriyana Reddy Jason Traum

The Politics and Economics of Development
Francis Baviera MaloneyKatya Scocimara
Data are Everywhere
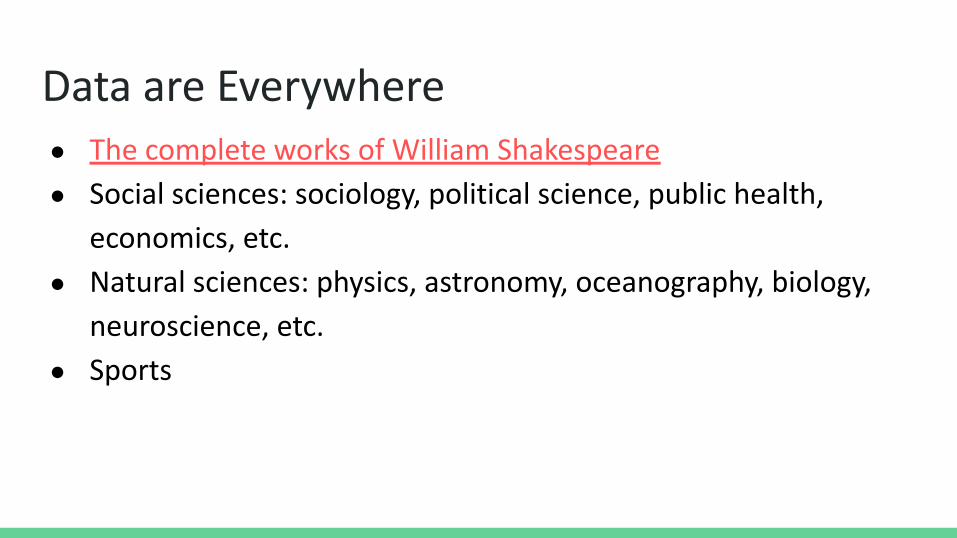
Data are Everywhere● The complete works of William Shakespeare
● Social sciences: sociology, political science, public health,
economics, etc.
● Natural sciences: physics, astronomy, oceanography, biology,
neuroscience, etc.
● Sports

● Predict elections
● Study demographics
● Campaign managers study
voters and target their
messages accordingly
Politics
Image Source
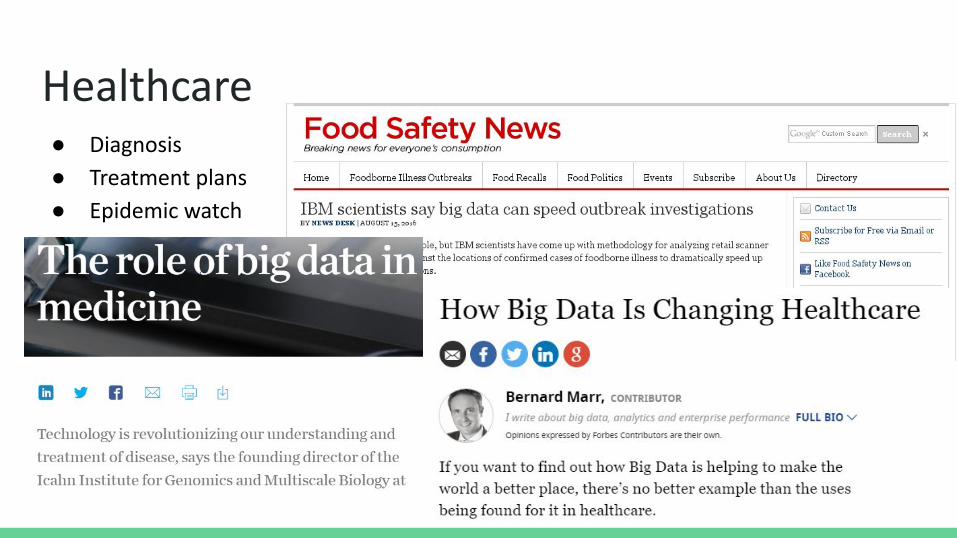
● Diagnosis
● Treatment plans
● Epidemic watch
Healthcare
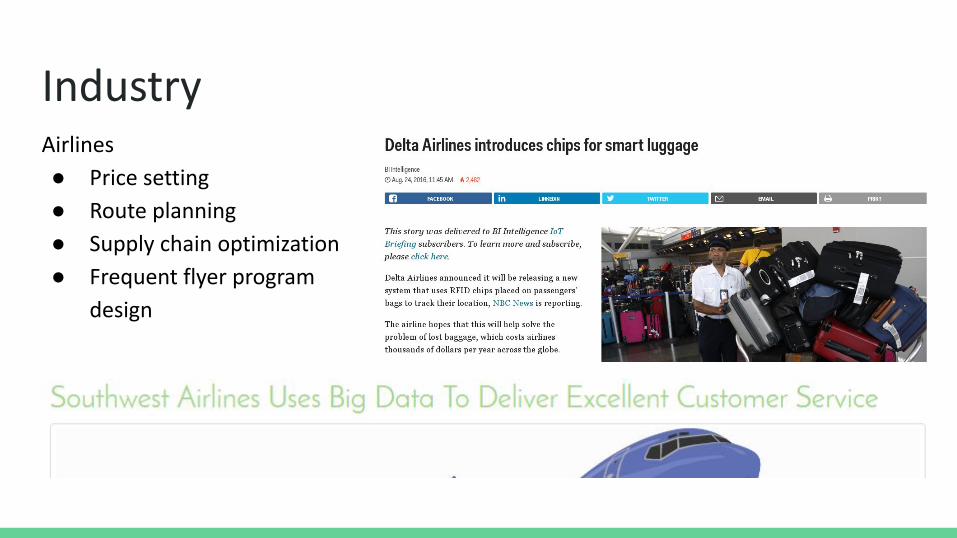
IndustryAirlines
● Price setting
● Route planning
● Supply chain optimization
● Frequent flyer program
design


Image Source Image Source

Observation by Michael Franklin(Berkeley Computer Science Professor)
● 1970’s: the confluence of electrical engineering and maths led to
the birth of the field of Computer Science
● 2010’s: the confluence of computer science and statistics [a.k.a.
machine learning], together with relevant domain knowledge,
is prompting the growth of a new field called Data Science

The fourth scientific paradigm
1. Theoretical
2. Experimental
3. Computational
4. Data-driven: Empirical

Proceed with caution● Algorithmic Bias Q&A with
Cynthia Dwork
● When Discrimination is Baked
into Algorithms
● Fairness, Accountability, &
Transparency Conference

Goals of Data Science

Herb Simon: “Basic” vs. “Applied” Science● Basic science = Descriptive & explanatory goals
○ To know: i.e., “to describe the world”
○ To understand: i.e., “to [explain] phenomena”
● Applied science = Predictive goals○ “Laws connecting sets of variables allow … predictions to be made
from known values of some of the variables to unknown values
of other variables.”
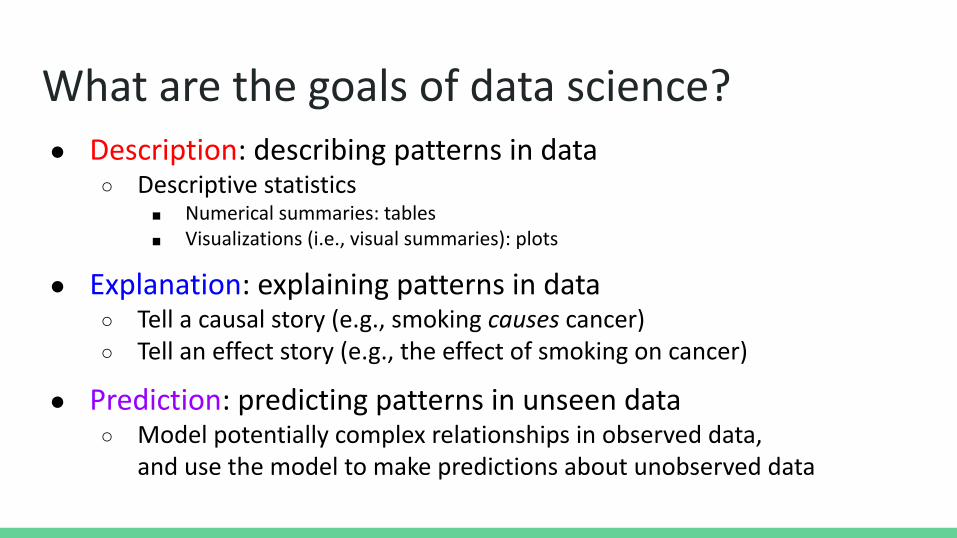
What are the goals of data science?● Description: describing patterns in data
○ Descriptive statistics■ Numerical summaries: tables■ Visualizations (i.e., visual summaries): plots
● Explanation: explaining patterns in data○ Tell a causal story (e.g., smoking causes cancer)○ Tell an effect story (e.g., the effect of smoking on cancer)
● Prediction: predicting patterns in unseen data○ Model potentially complex relationships in observed data,
and use the model to make predictions about unobserved data

What are the goals of data science?● Abductive Reasoning
● Inductive reasoning
● Deductive reasoning
Data● We might have data about middle-age, middle-class women
(like me!) living in Providence, RI
● We might have a snapshot of these data, or the data set could
be longitudinal (i.e., span multiple years)
● If the data concern women from, say, the 1950’s, we might even
have labels: e.g., cause of death

Descriptive Goal of Data Science● We can summarize the data by calculating the average age of
death, the most common cause of death, etc.
● With longitudinal data, we can plot weight, height, …, over time
● Basic tools are descriptive statistics○ Numerical summaries: tables
○ Visualizations (i.e., visual summaries): plots
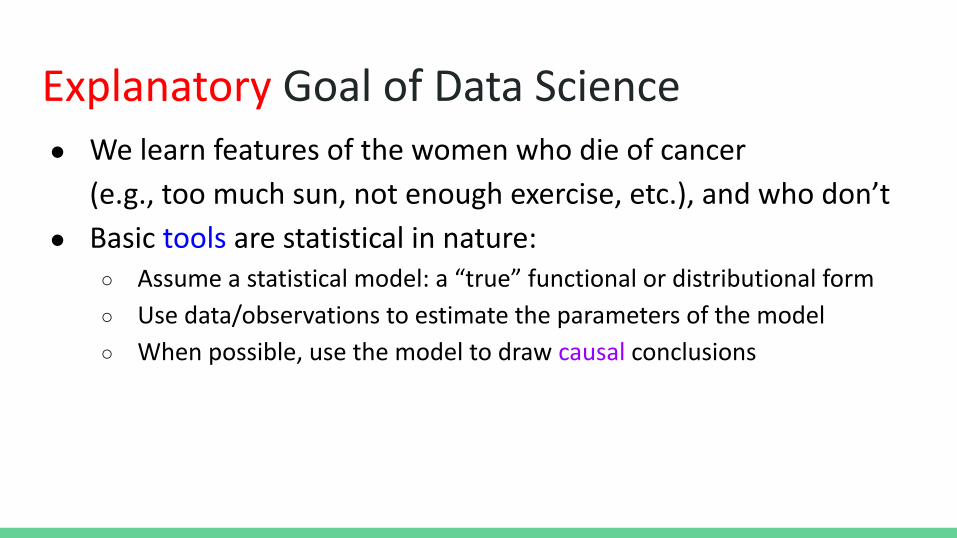
Explanatory Goal of Data Science● We learn features of the women who die of cancer
(e.g., too much sun, not enough exercise, etc.), and who don’t
● Basic tools are statistical in nature:○ Assume a statistical model: a “true” functional or distributional form
○ Use data/observations to estimate the parameters of the model
○ When possible, use the model to draw causal conclusions

Predictive Goal of Data Science● We learn a model (e.g., a function) that predicts (i.e., forecasts)
whether a new individual (like me!) will die of cancer
● Some tools come from machine learning and optimization:
E.g., learn a function that minimizes error in predictions
● Other tools are statistical in nature:○ Assume a statistical model: a “true” functional or distributional form
○ Use data/observations to estimate the parameters of the model
○ Use the model to make predictions for new data/observations
Methods of Data Science
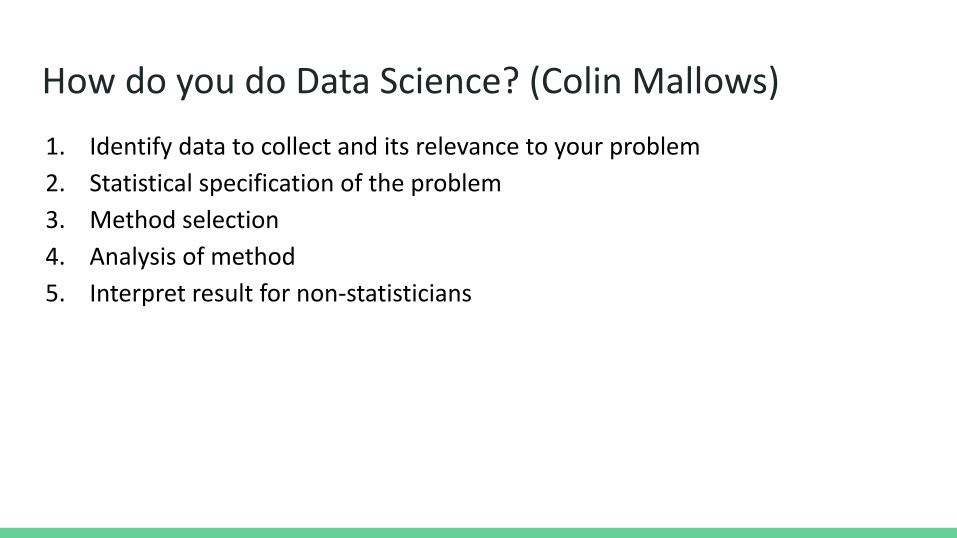
How do you do Data Science? (Colin Mallows)
1. Identify data to collect and its relevance to your problem
2. Statistical specification of the problem
3. Method selection
4. Analysis of method
5. Interpret result for non-statisticians

How do you do Data Science? (Ben Fry)
1. Acquire
2. Parse
3. Filter
4. Mine
5. Represent
6. Refine
7. Interact

How do you do Data Science? (Peter Huber)
1. Inspection
2. Error Checking
3. Modification
4. Comparison
5. Modeling and model fitting
6. Simulation
7. What-if analyses
8. Interpretation
9. Presentation of conclusions

How do you do Data Science? (Galit Shmueli)
1. Define goal
2. Design study and collect data
3. Prepare data
4. Exploratory data analysis
5. Choose variables
6. Choose methods
7. Evaluate, validate, and model selection
8. User model and report
Source

How do you do Data Science? (CSCI 100)
1. Prepare data
2. Exploratory data analysis
3. Choose variables and methods (i.e., build models)
4. Evaluate, validate, and model selection
5. Report (explanations or predictions)

Course Overview

Course Overview1. Descriptive Statistics: Summarizing Data
○ No underlying model
○ No learning, statistical or otherwise
○ Just Exploratory Data Analysis
Examples○ Histograms, conditional histograms
○ Measures of central tendency
○ Measures of dispersion

Course Overview (cont’d)2. Classic Machine Learning: Summarizing Data
○ No underlying statistical model
○ Learning, so training on in-sample data
○ Prediction: Inductive, out-of-sample forecasting
Example Methods○ Decision and regression trees
○ k-nearest neighbors

Course Overview (cont’d)3. Classic Statistics
○ Law of Large Numbers
○ Central Limit Theorem
○ Confidence Intervals
○ Hypothesis Testing
Example Applications○ Analyzing clinical trials to predict drug efficacy
○ Analyzing polling data to predict election outcomes

Course Overview (cont’d)3. Statistical Machine Learning (i.e., Estimation and Inference)
○ Assume an underlying statistical model of a population■ Selects a few key variables of interest
■ Might make assumptions about how they are distributed
■ Might describe how they relate to one another
○ Estimate the parameters of the model, using in-sample data■ Example estimators: sample mean, sample variance, etc.
■ Example techniques: maximum likelihood, maximum a posteriori
○ Inference: Apply the model to generalize to out-of-sample data
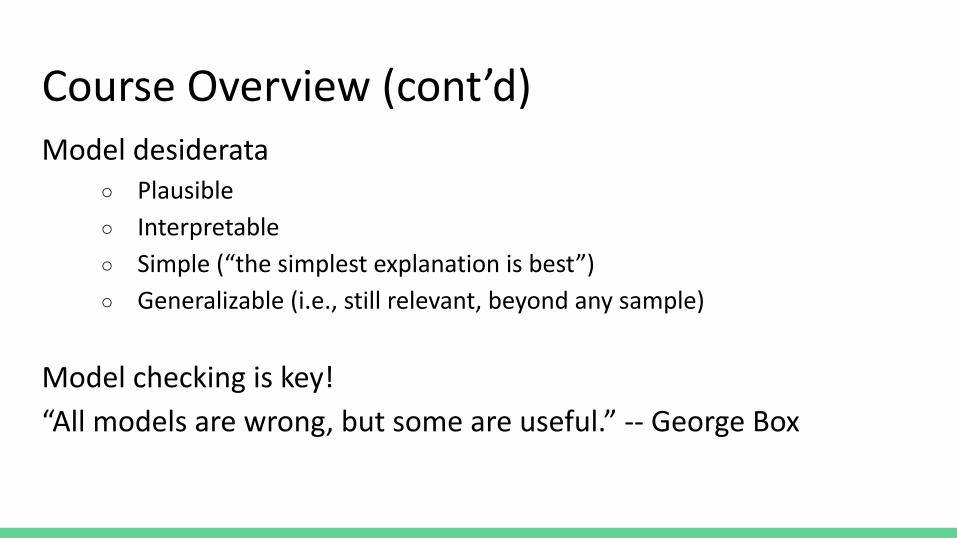
Model desiderata○ Plausible
○ Interpretable
○ Simple (“the simplest explanation is best”)
○ Generalizable (i.e., still relevant, beyond any sample)
Model checking is key!
“All models are wrong, but some are useful.” -- George Box
Course Overview (cont’d)
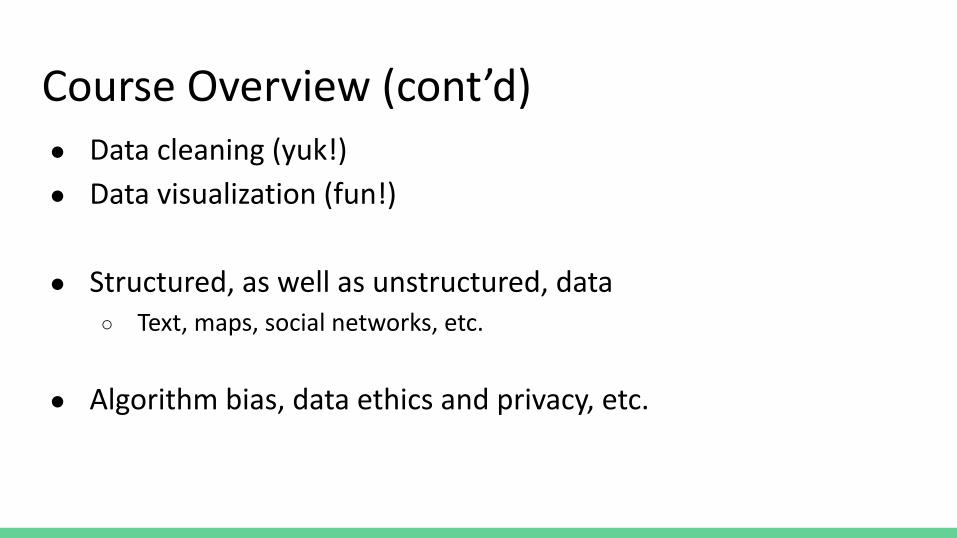
● Data cleaning (yuk!)
● Data visualization (fun!)
● Structured, as well as unstructured, data○ Text, maps, social networks, etc.
● Algorithm bias, data ethics and privacy, etc.
Course Overview (cont’d)

Course Administration

Goal of CS 100To endow students with a basic set of computational skills that will
enable them to process data, and ultimately glean meaningful
information from them.

What will students learn in this course?● Probability and Statistics
○ Descriptive Statistics (measures of central tendency and dispersion)
○ Law of Large Numbers, Central Limit Theorem, etc.
○ Conditional Probability, Bayes’ Theorem, etc.
● Machine Learning○ Classification
○ Regression
○ Clustering
● Tools○ Spreadsheets, R, and Markdown

Who does Data Science?● Statisticians
● Computer Scientists
● Domain Experts (e.g., Economists, Biologists, etc.)
● Really...everyone!

Who is this course for?Really...everyone!
Everyone who wants to learn to process any part of the myriad of
data that are currently being collected by both the private and
public sector about our daily lives.
Caveat: if you are or intend to be a CS concentrator, other Brown courses are better suited to your
level/needs, like CSCI 1951A (Available Spr 2022).
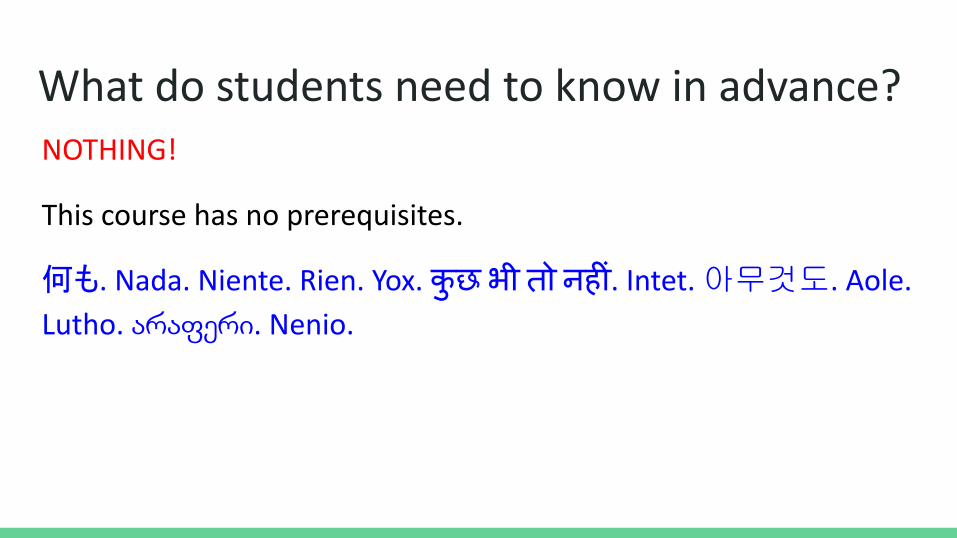
What do students need to know in advance?NOTHING!
This course has no prerequisites.
何も. Nada. Niente. Rien. Yox. कुछ भी तो नहीं. Intet. 아무것도. Aole.
Lutho. არაფერი. Nenio.

Course Structure● Meetings
○ Lectures on Mondays and Wednesdays
○ TA-led discussion sections on most Fridays
○ Studios: collaborative hands-on activities
● Take-home assignments○ Homework assignments, due every other week through Thanksgiving
○ One week mini project due right before Indigenous People’s Day
○ One month final project (the bulk of which you will do after Thanksgiving),
in lieu of a final exam

Course Structure (cont’d)● Lectures are conceptual, and can be theoretical at times
○ They are designed to introduce you a topic, generally, and at a high level
○ They include little explicit R instruction (except during programming week)
○ They often require thinking (indeed, you’ll notice me thinking aloud often)
● Studios and homeworks are hands on, and very practical○ They are designed to help you work out details about a topic
○ They include explicit R instruction (sometimes, just “type this”; “type that”)
○ Sometimes, they (studios, especially) don’t require thinking

Weekly Readings● Many online references
○ Seeing Theory, A Visual Introduction to Stats
● Optional Textbooks○ The Cartoon Guide to Statistics
○ Naked Statistics, by Charles Wheelan
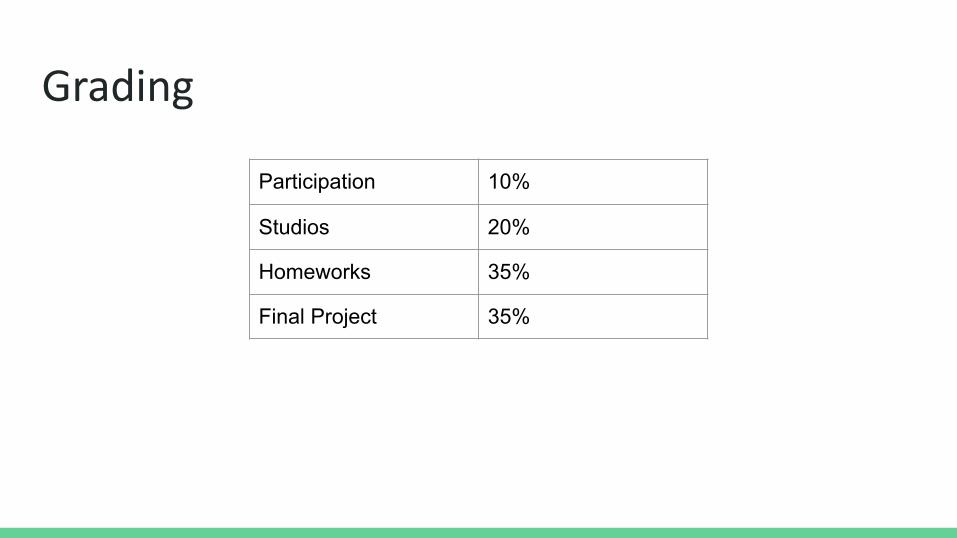
Grading
Participation 10%
Studios 20%
Homeworks 35%
Final Project 35%

Office hoursAmy’s office hours are Thursdays 12-1, or by appointment.
Her office number is CIT 383.
When they are finalized, the TA’s office hours and locations will be
posted on the course website calendar.

Collaboration PolicyStudents are encouraged to collaborate with their peers in CSCI 0100. Studios are pair-programmed. For their own benefit, students should make a concerted effort to work with multiple partners over the course of the semester.
When working on homework assignments, students may consult one another; but students are required to list the names of all students with whom they discussed an assignment on their submitted work. Unnatural similarities among students’ submissions with other students whose names are not listed will be forwarded to the Dean of the College’s office for review, to assess whether or not there has been a violation of Brown's Academic Code.
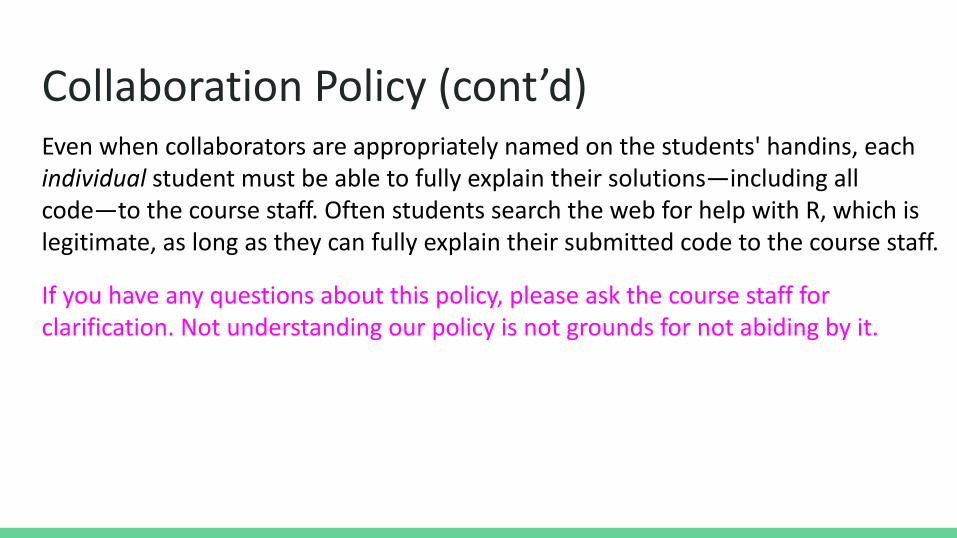
Collaboration Policy (cont’d)Even when collaborators are appropriately named on the students' handins, each individual student must be able to fully explain their solutions—including all code—to the course staff. Often students search the web for help with R, which is legitimate, as long as they can fully explain their submitted code to the course staff.
If you have any questions about this policy, please ask the course staff for clarification. Not understanding our policy is not grounds for not abiding by it.

Diversity and InclusionThe computer science department is committed to diversity and inclusion, and strives to create a climate conducive to the success of women, students of color, students of all (or no) sexual orientations, and any other students who feel marginalized for any reason.
If you feel you have been been mistreated by another student, or by any of the course staff, please feel free to reach out to one of the CS department’s Diversity and Inclusion Student Advocates, or to Professor Greenwald, Professor Doeppner (DUS), or Professor Hughes (the CS department chair).
We, the CS department, take all such complaints seriously.

AccommodationsIf you feel you have any disabilities that could affect your performance in the course, please contact SEAS. We will support accommodations referred by SEAS.

HarassmentPlease review Brown’s Title IX and Gender Equity Policy.
If you feel you might be the victim of harassment (in this course or any other), you may seek help from any of the resources listed here.
Course Laptop UseOwning a laptop is neither required nor necessary to succeed in CSCI 100, so not owning a laptop does not preclude you from taking this course. Nonetheless, during some classes, such as sections and programming lectures, students may benefit from the use of a personal laptop. (Note that during other classes, the professor may expressly forbid the use of any personal devices.)
If you do not own a laptop, but would like access to one this semester, please contact the HTAs for assistance, assuming you are comfortable doing so. Otherwise, please feel free to reach out to Dean Elie, the Associate Dean for Financial Advising, for help purchasing a laptop, or the IT service center, to borrow a laptop.

Final bit of logistics
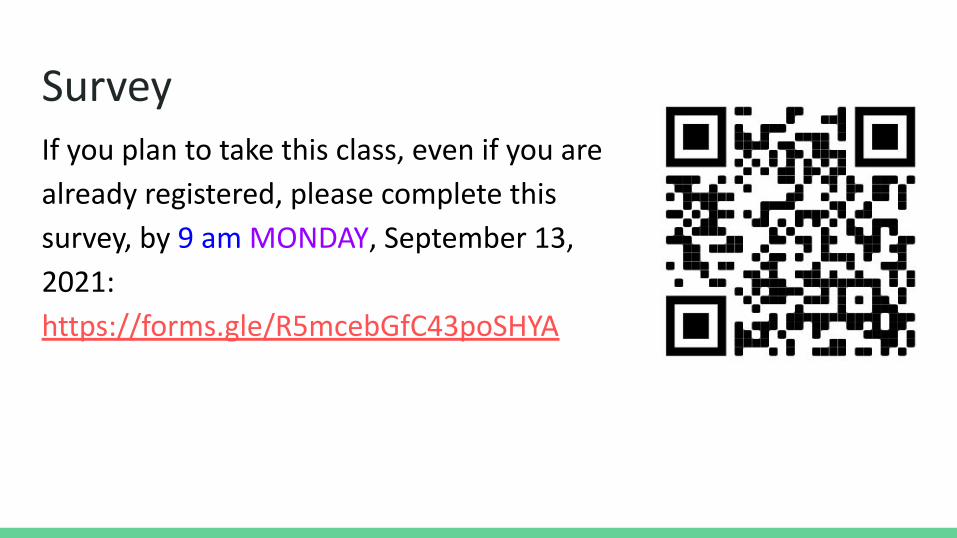
SurveyIf you plan to take this class, even if you are
already registered, please complete this
survey, by 9 am MONDAY, September 13,
2021:
https://forms.gle/R5mcebGfC43poSHYA

Studio 0Studio 0 is a take-home assignment.
It involves reading our course policies, signing the course
collaboration policy, installing the requisite software, etc.
It is due on Wednesday, September 11 at 11:59 a.m..

If you end up taking this class, be sure to:1. Visit the course website
http://www.cs.brown.edu/courses/cs100
1. Register for the course so you can login to the CS dept machines
2. Sign up for Piazza (instructions are on the course website)

Jargon

JargonPerhaps for practical reasons, all fields are full of jargon.
Never in this classroom or in studio should you hesitate to ask for
clarification if you do not understand some bit of jargon used by the
professor, a TA, or any of your fellow students.
No one understands all jargon. Please do not be embarrassed to ask
questions when you are confused by terminology.

Big Data“Extremely large data sets that may be analyzed computationally to
reveal patterns, trends, and associations.”
Oxford Dictionary
N.B. This course is concerned primarily with small data.
Additional tools, beyond those taught in this course, are
necessary to manipulate big data.

Data Munging/Wrangling/JujitsuConverting data from one "raw" form into another form,
which is often cleaner and more structured
Data MiningExtracting comprehensible information from data
Predictive ModelingBuilding a statistical model of unknown behavior
Predictive AnalyticsMaking predictions about unknown future events