Embed Size (px)
Citation preview
Data-intensive Geoinformatics
Gilberto CâmaraOctober 2012
Licence: Creative Commons ���� By Attribution ���� Non Commercial ���� Share Alikehttp://creativecommons.org/licenses/by-nc-sa/2.5/
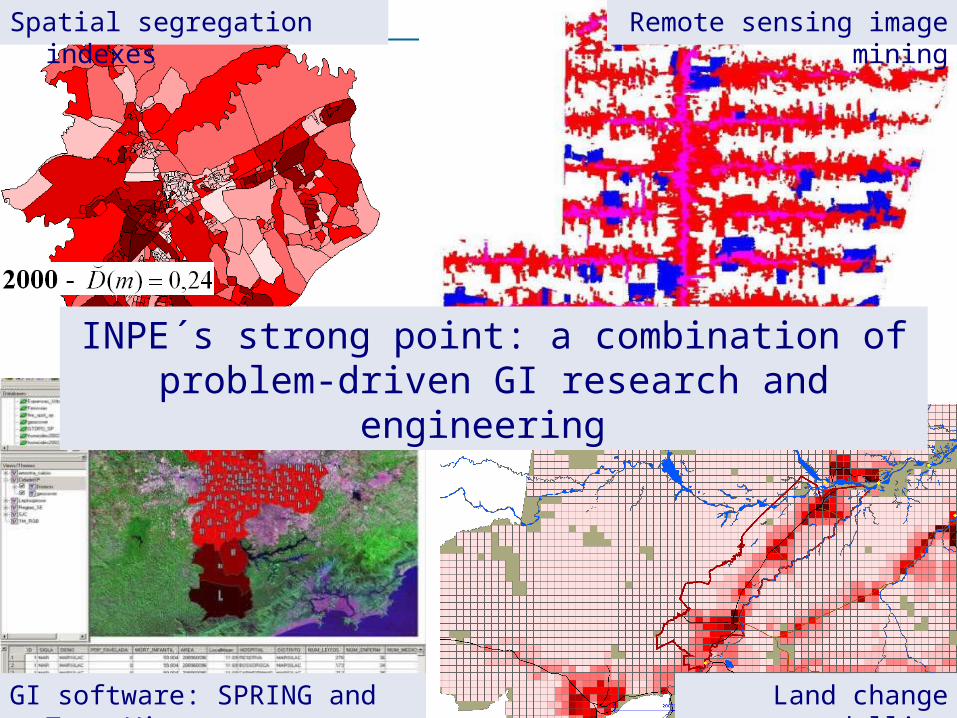
Spatial segregation indexes Remote sensing image mining
GI software: SPRING and TerraView Land change modelling
INPE´s strong point: a combination of problem-driven GI research and engineering
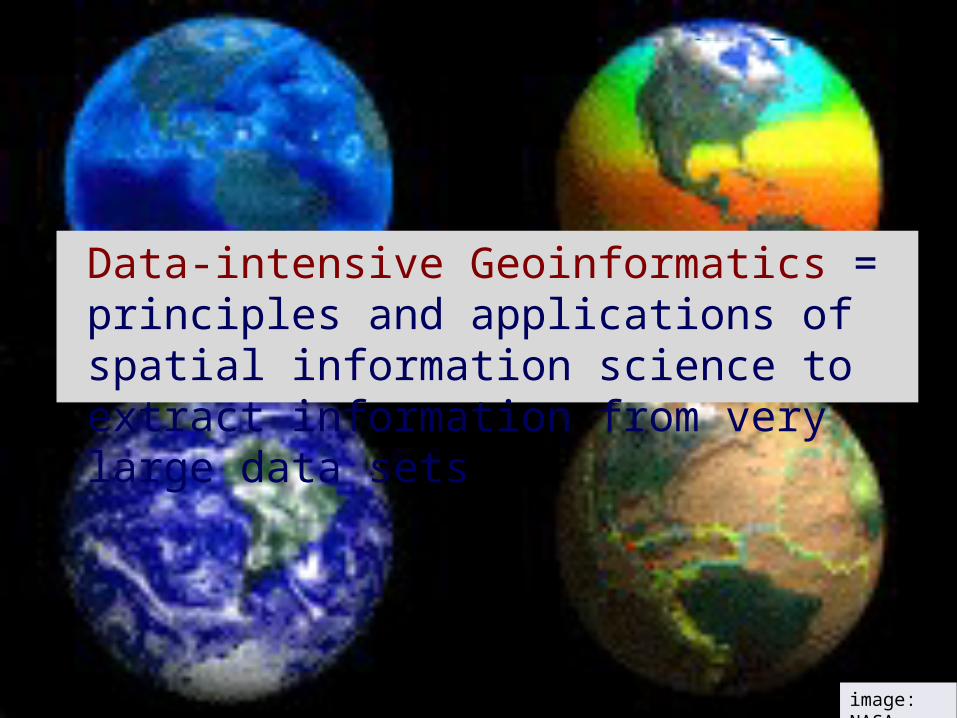
Data-intensive Geoinformatics = principles and applications of spatial information science to extract information from very large data sets
image: NASA
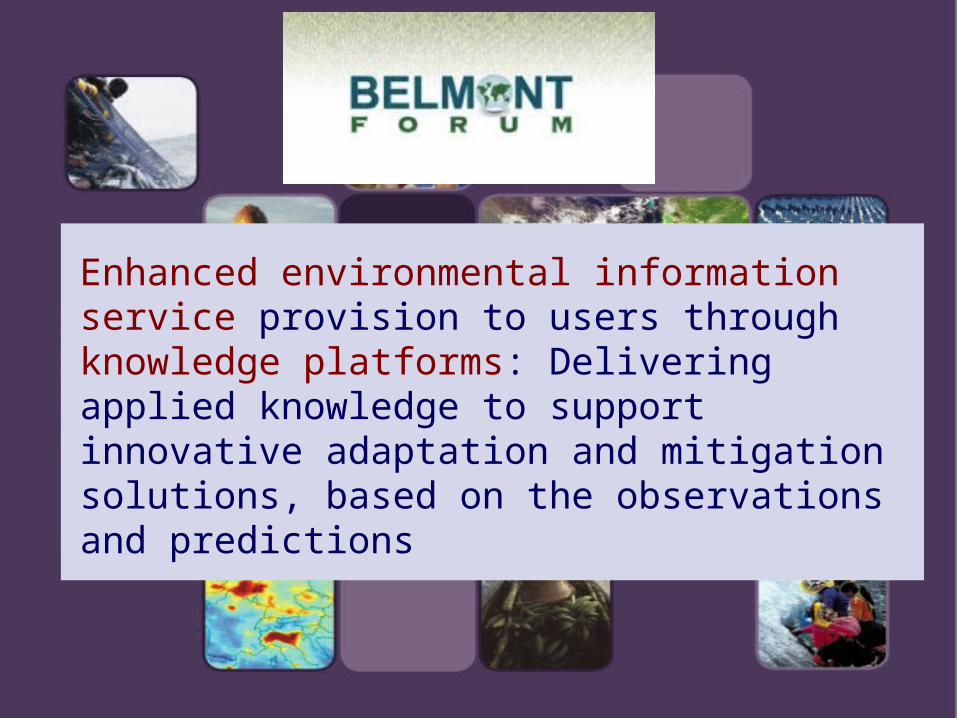
Enhanced environmental information service provision to users through knowledge platforms: Delivering applied knowledge to support innovative adaptation and mitigation solutions, based on the observations and predictions
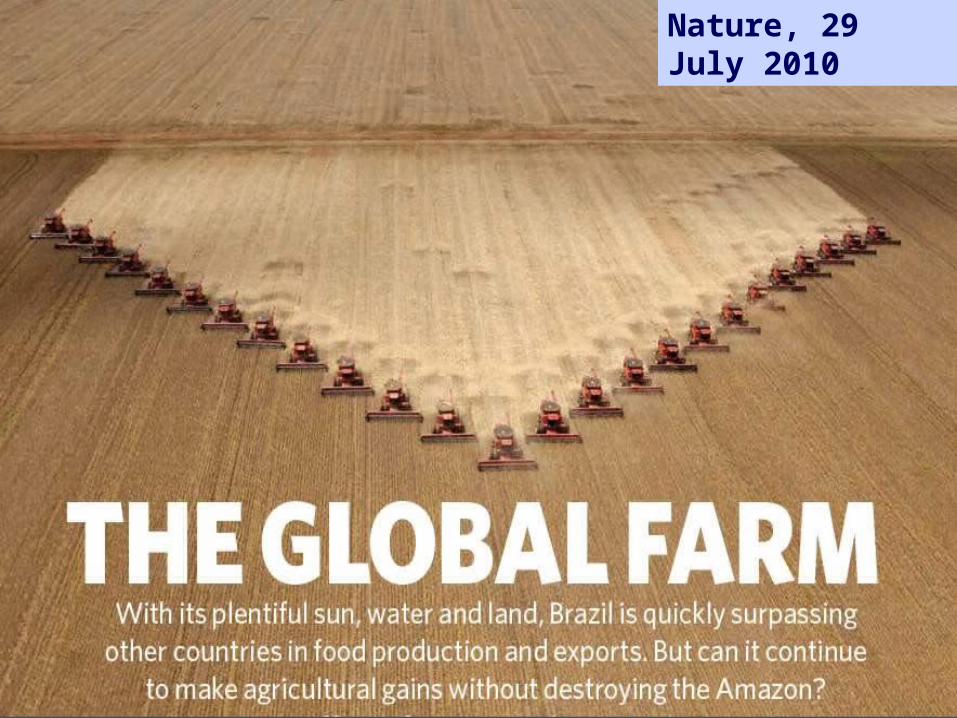
Nature, 29 July 2010
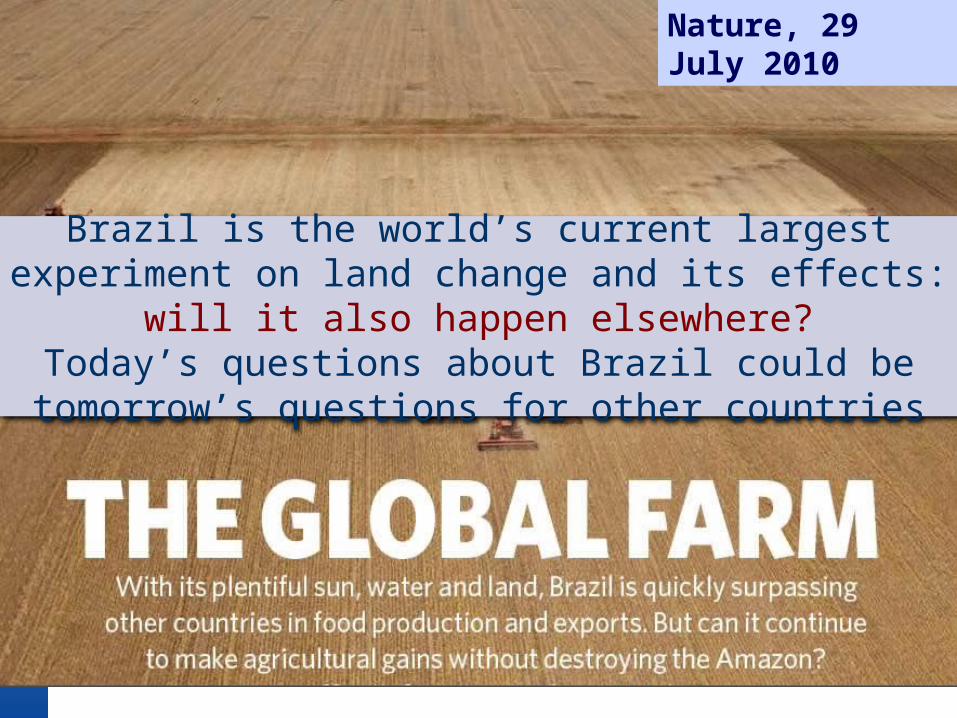
Nature, 29 July 2010
Brazil is the world’s current largest experiment on land change and its effects: will it also happen elsewhere?
Today’s questions about Brazil could be tomorrow’s questions for other countries
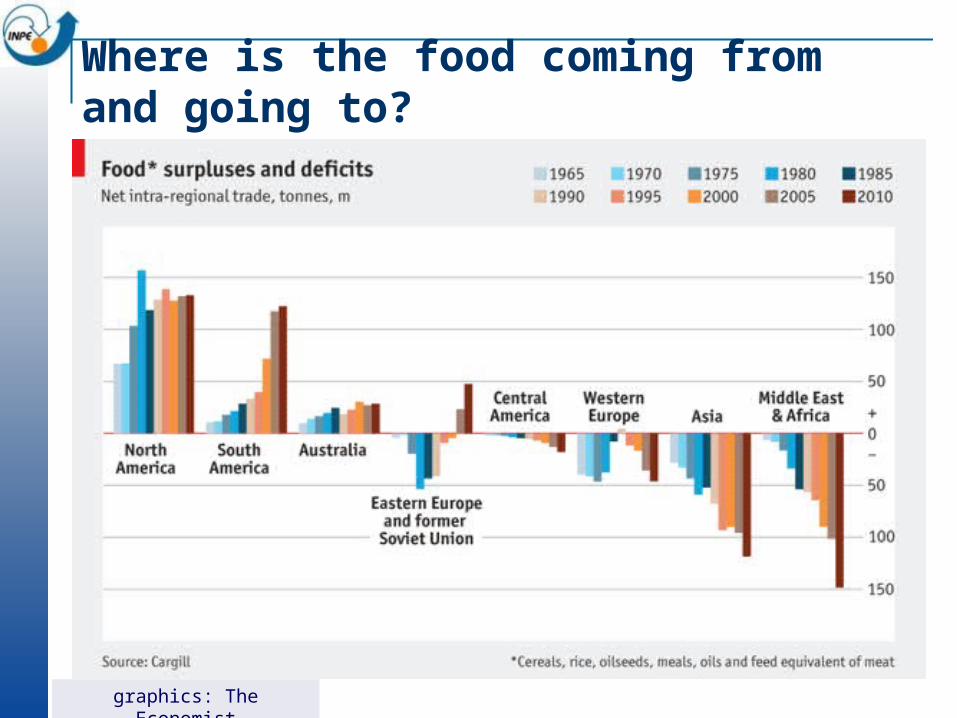
Where is the food coming from and going to?
graphics: The Economist
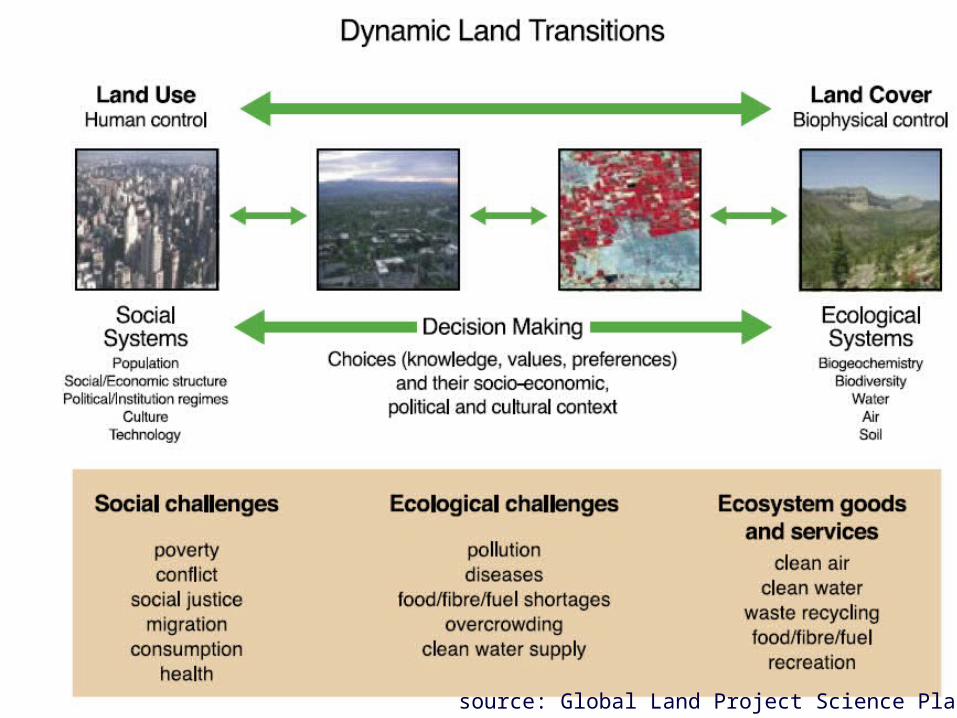
source: Global Land Project Science Plan (IGBP)
Global Change
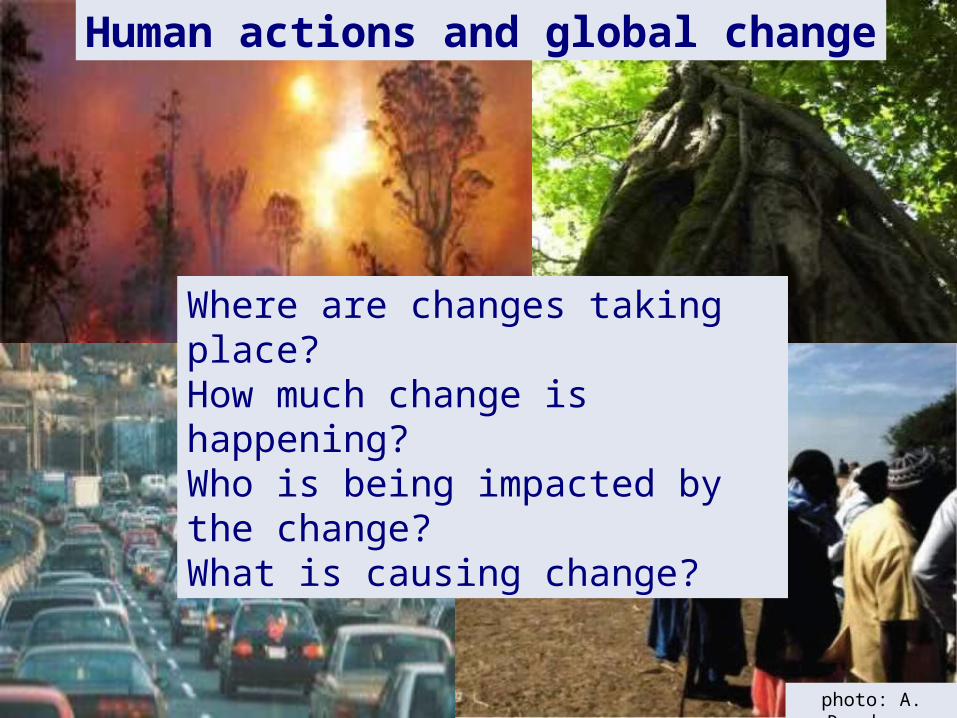
Where are changes taking place?How much change is happening? Who is being impacted by the change?What is causing change?
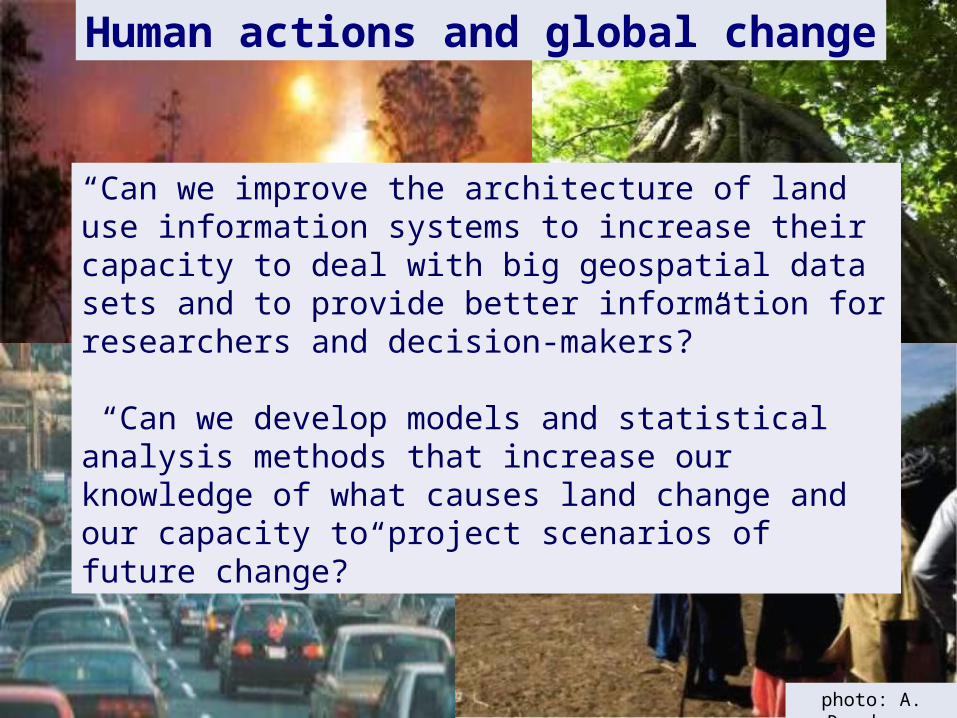
Human actions and global change
photo: A. Reenberg
Global Change
“Can we improve the architecture of land use information systems to increase their capacity to deal with big geospatial data sets and to provide better information for researchers and decision-makers?”
“Can we develop models and statistical analysis methods that increase our knowledge of what causes land change and our capacity to project scenarios of future change?”
Human actions and global change
photo: A. Reenberg
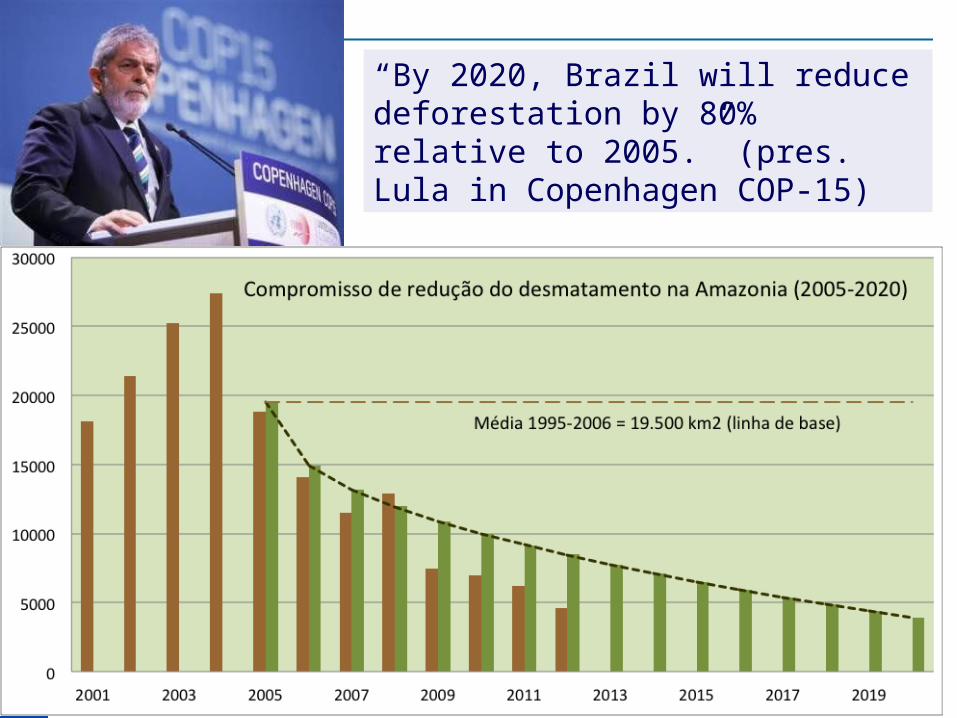
“By 2020, Brazil will reduce deforestation by 80% relative to 2005.” (pres. Lula in Copenhagen COP-15)
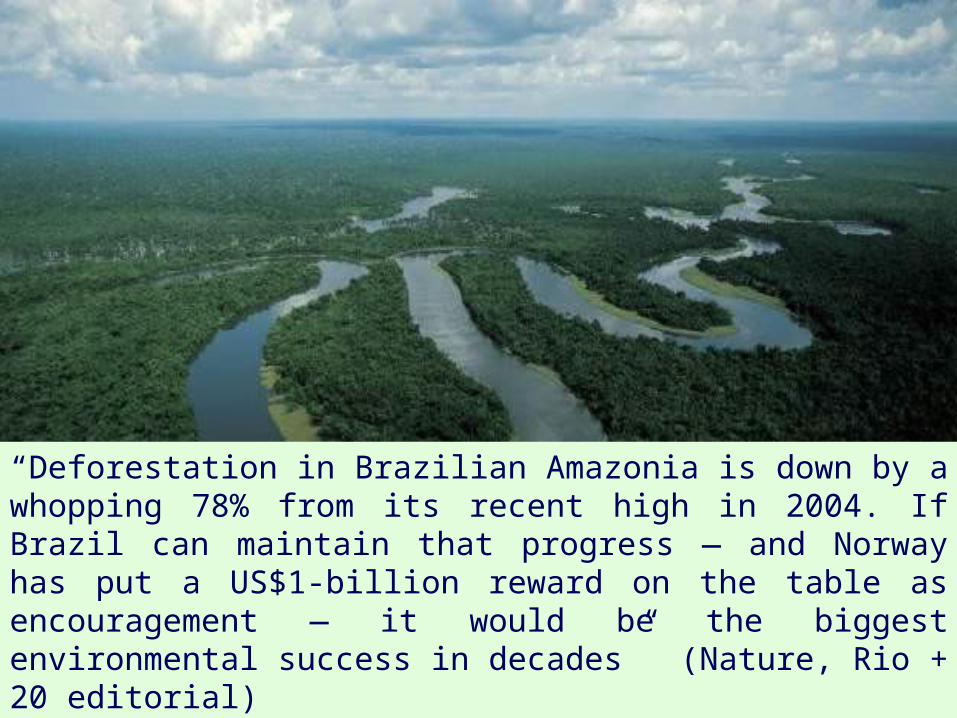
“Deforestation in Brazilian Amazonia is down by a whopping 78% from its recent high in 2004. If Brazil can maintain that progress — and Norway has put a US$1-billion reward on the table as encouragement — it would be the biggest environmental success in decades” (Nature, Rio + 20 editorial)
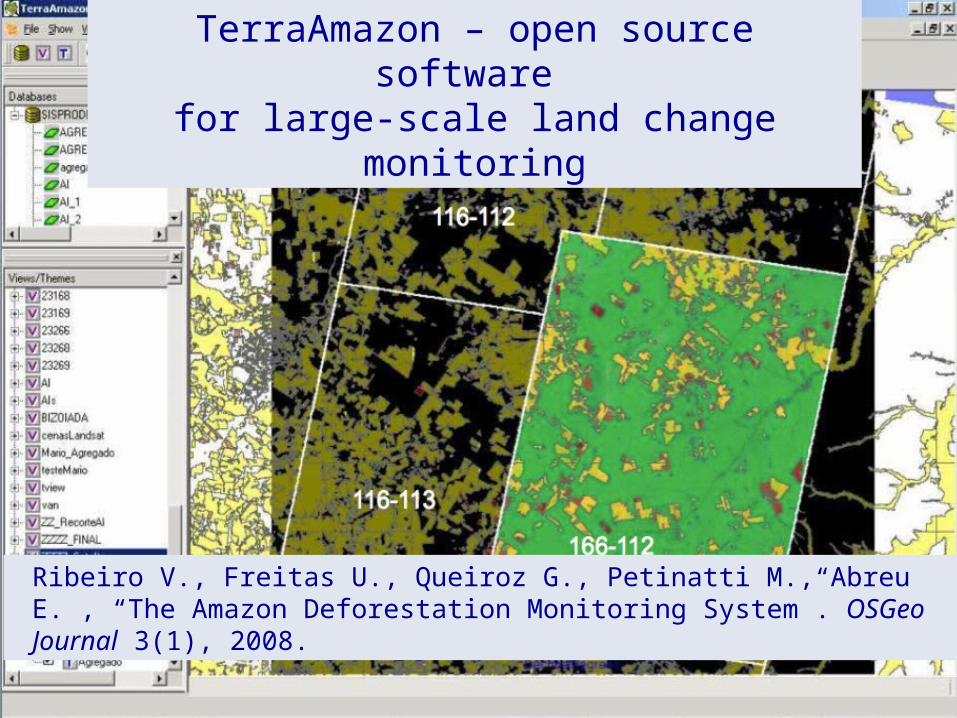
166-112
116-113
116-112
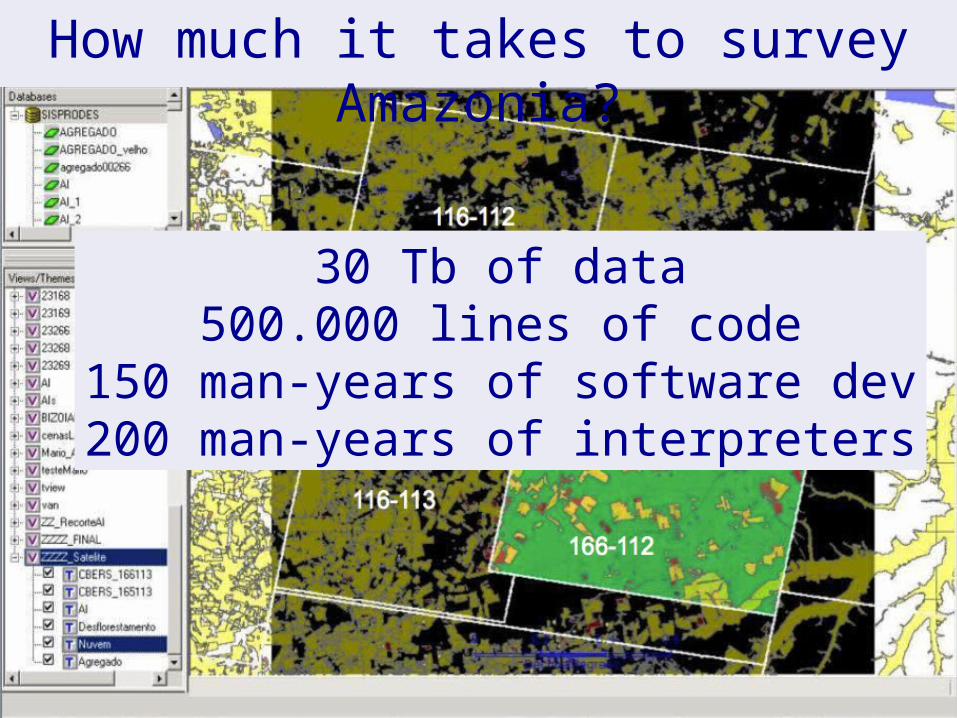
How much it takes to survey Amazonia?
30 Tb of data500.000 lines of code
150 man-years of software dev200 man-years of interpreters
166-112
116-113
116-112
TerraAmazon – open source software for large-scale land change monitoring
Ribeiro V., Freitas U., Queiroz G., Petinatti M., Abreu E. , “The Amazon Deforestation Monitoring System”. OSGeo Journal 3(1), 2008.
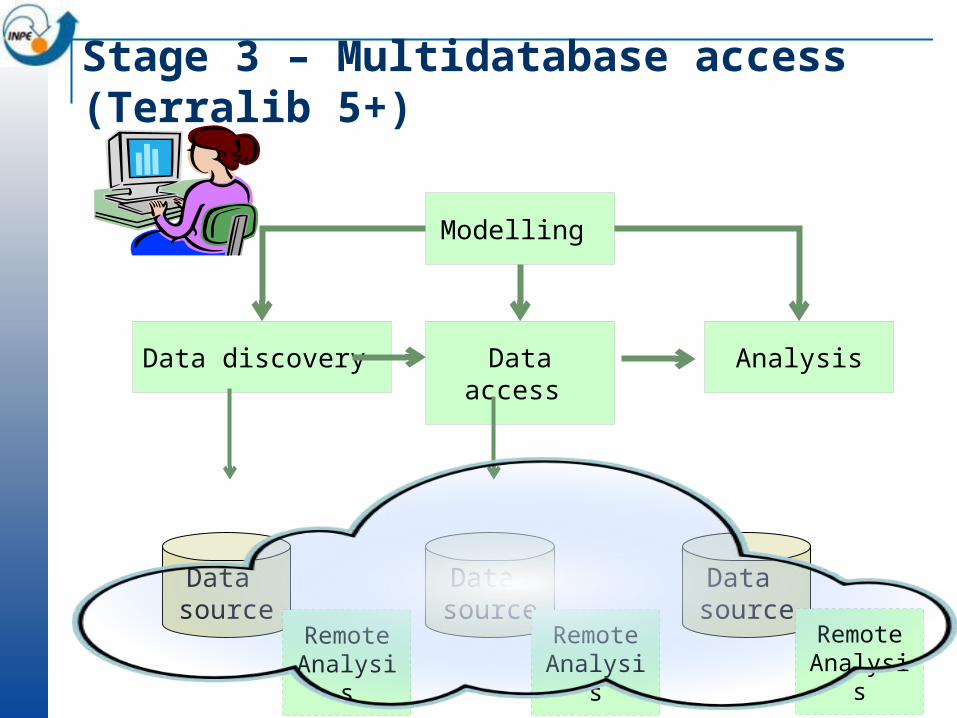
Stage 3 – Multidatabase access (Terralib 5+)
Data source
Data source
Data source
Modelling
Data discovery Data access Analysis
Remote Analysis
Remote Analysis
Remote Analysis
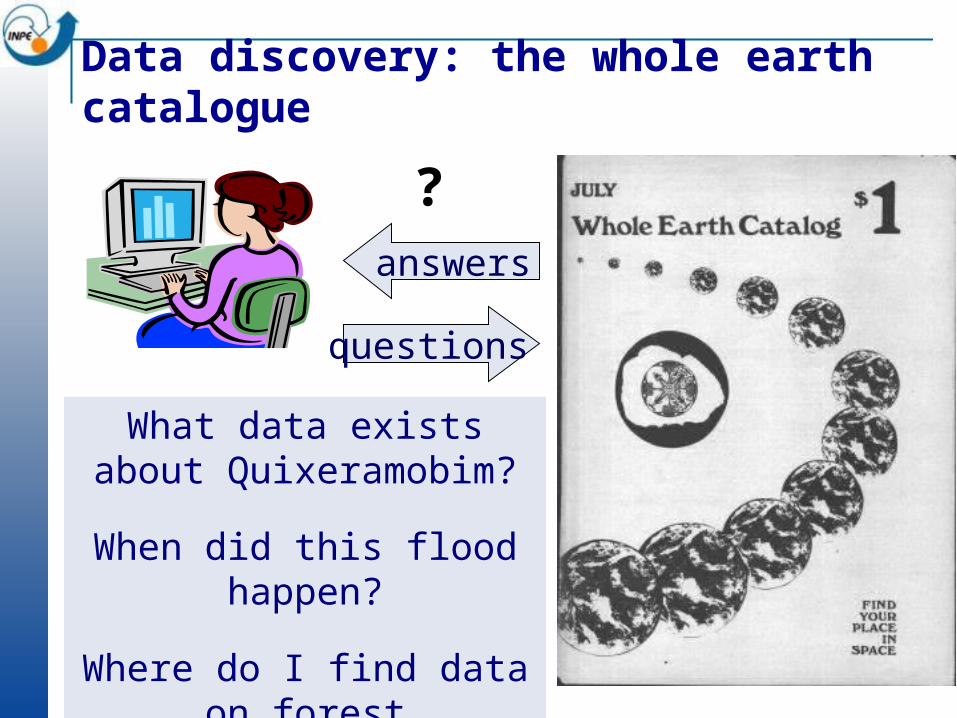
questions
answers
?
Data discovery: the whole earth catalogue
What data exists about Quixeramobim?
When did this flood happen?
Where do I find data on forest degradation?
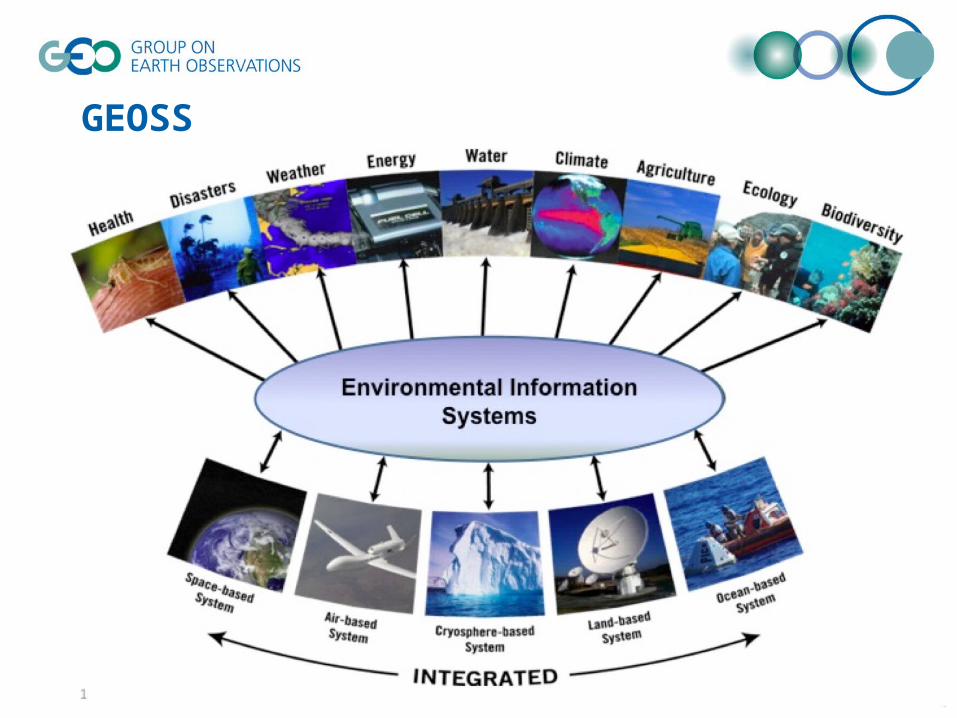
GEOSS
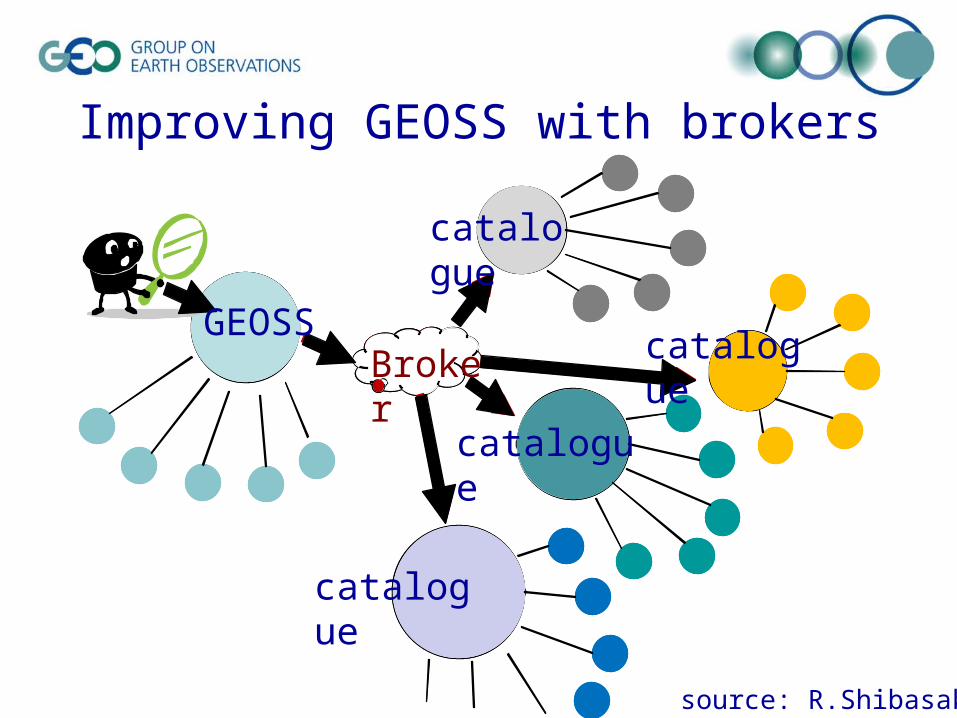
catalogue
GEOSS Broker catalogue
catalogue
catalogue
Improving GEOSS with brokers
source: R.Shibasaki
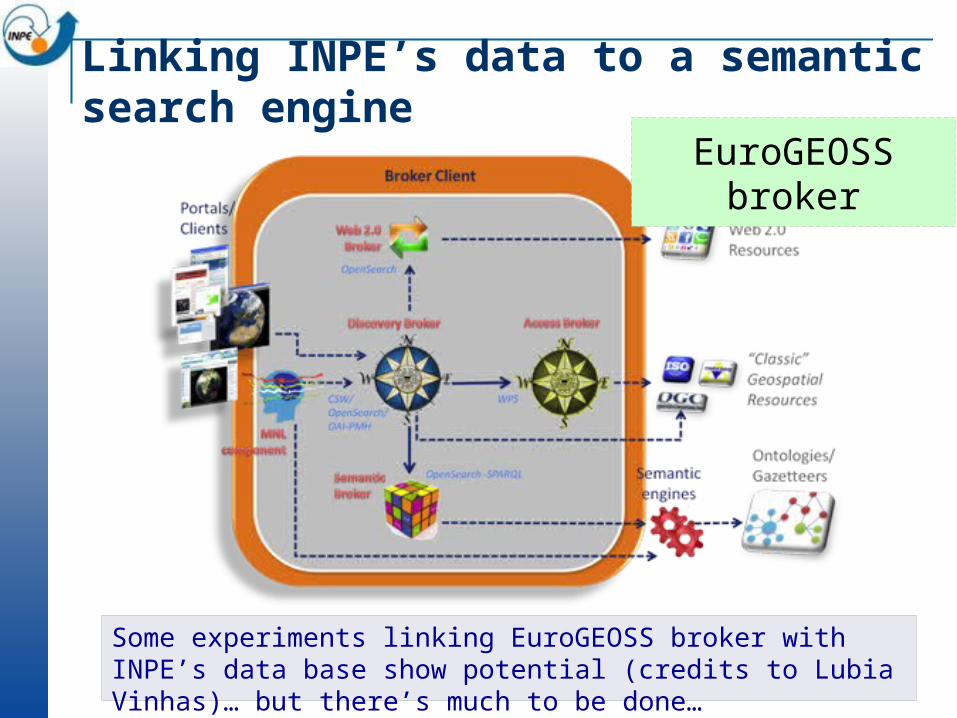
Linking INPE’s data to a semantic search engine
Some experiments linking EuroGEOSS broker with INPE’s data base show potential (credits to Lubia Vinhas)… but there’s much to be done…
EuroGEOSS broker
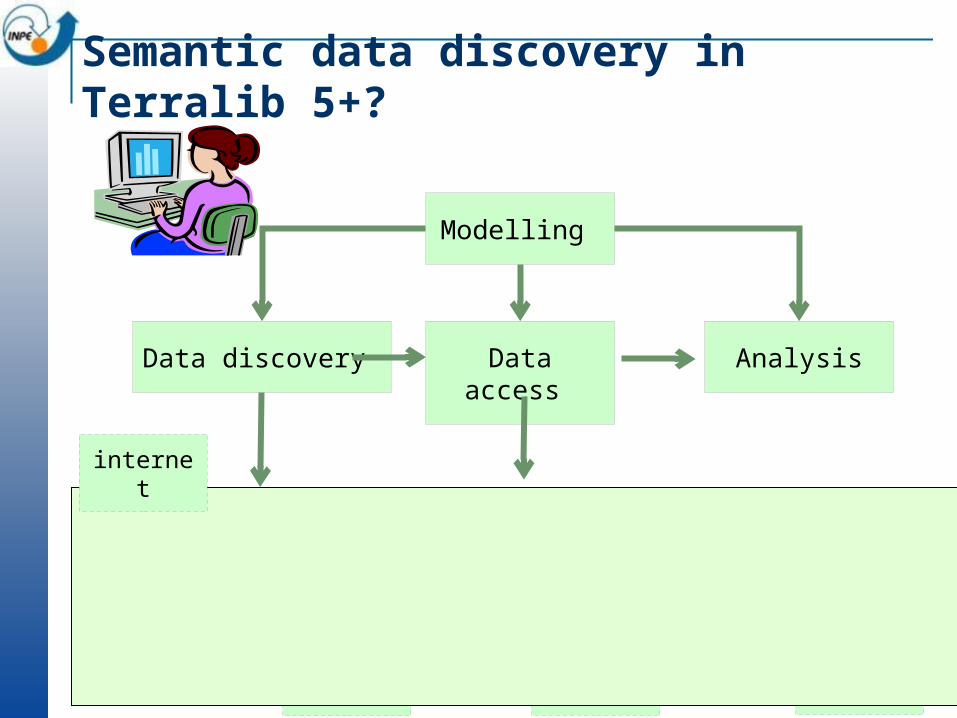
Semantic data discovery in Terralib 5+?
Data source
Data source
Data source
Modelling
Data discovery Data access Analysis
Remote Analysis
Remote Analysis
Remote Analysis
internet
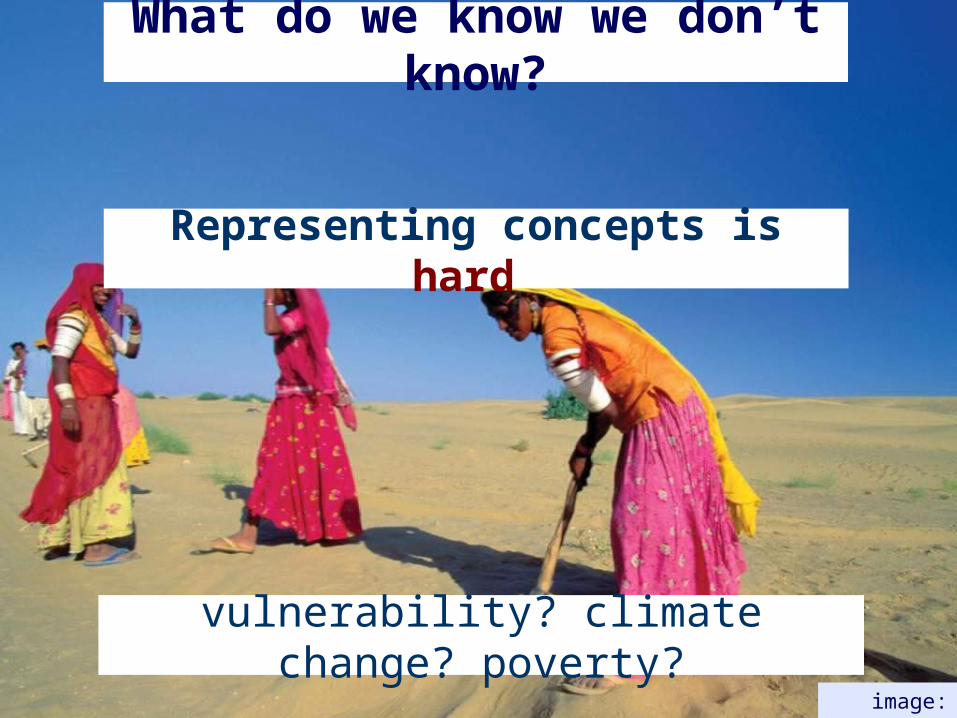
Representing concepts is hard
image: WMO
vulnerability? climate change? poverty?
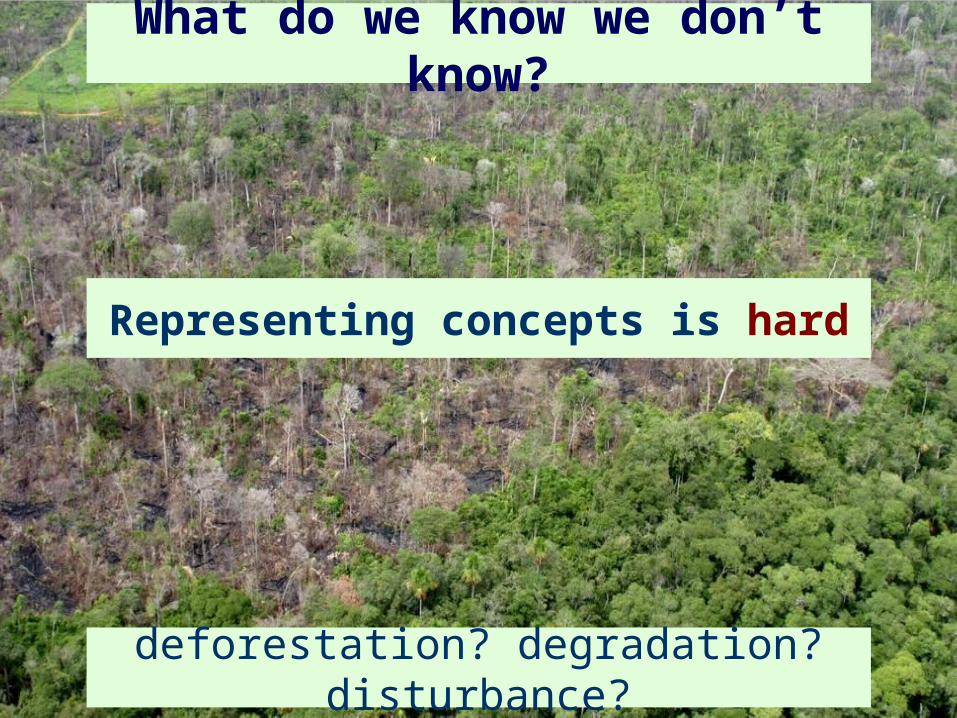
What do we know we don’t know?
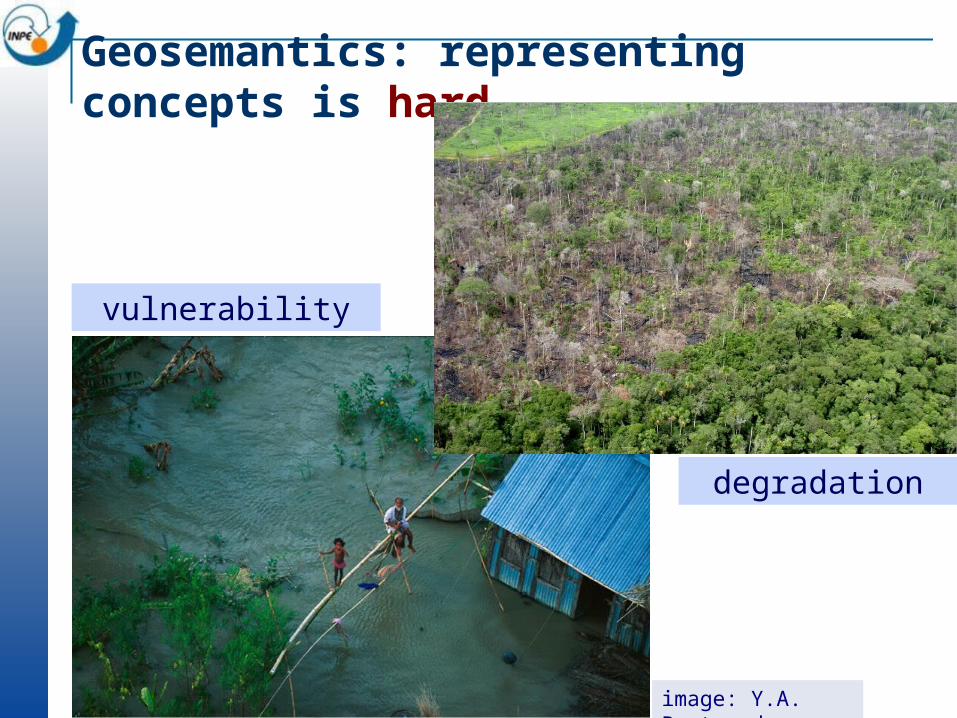
degradation
We’re bad at representing meaning
deforestation? degradation? disturbance?
Representing concepts is hard
What do we know we don’t know?
degradation
Geosemantics: representing concepts is hard
vulnerability
image: Y.A. Bertrand
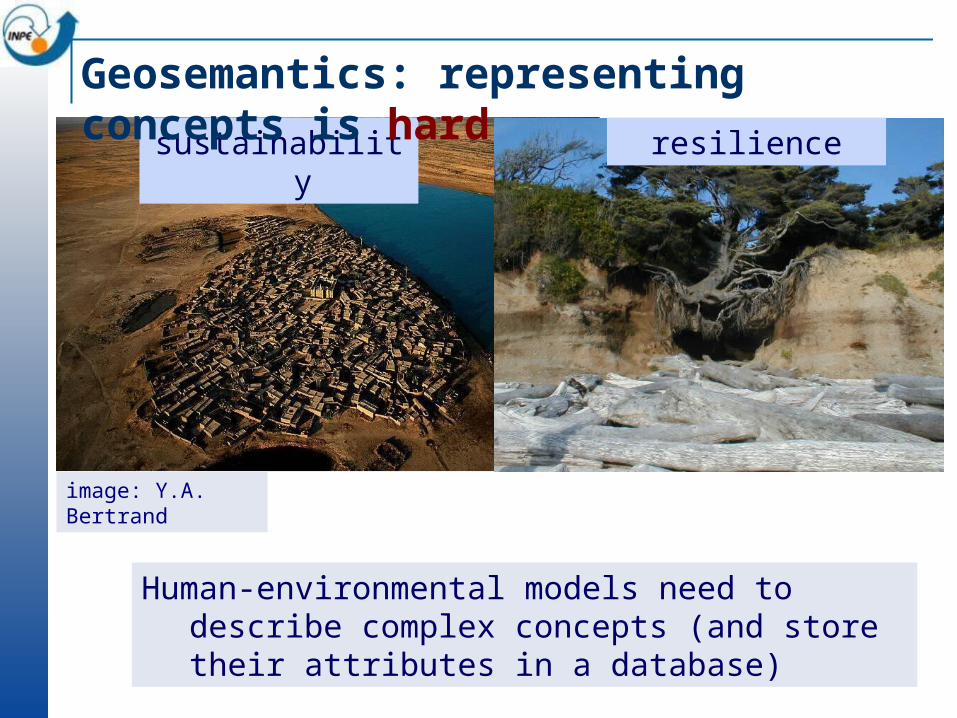
Human-environmental models need to describe complex concepts (and store their attributes in a database)
sustainability
Geosemantics: representing concepts is hard
image: Y.A. Bertrand
resilience

Representing change is very hard
What do we know we don’t know?
images: USGS
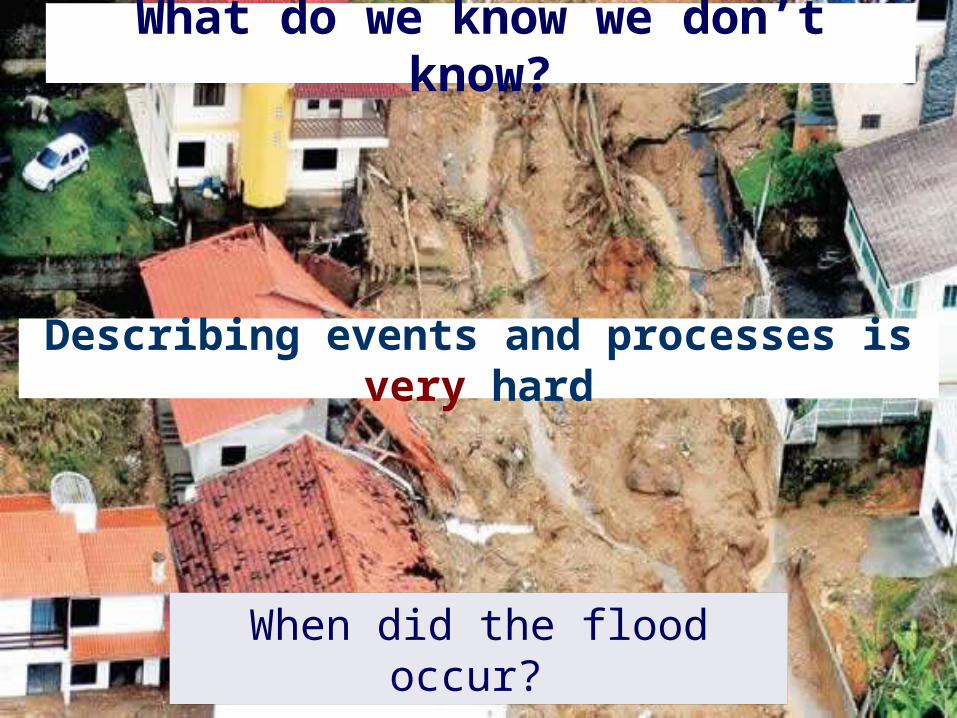
Describing events and processes is very hard
When did the flood occur?
What do we know we don’t know?
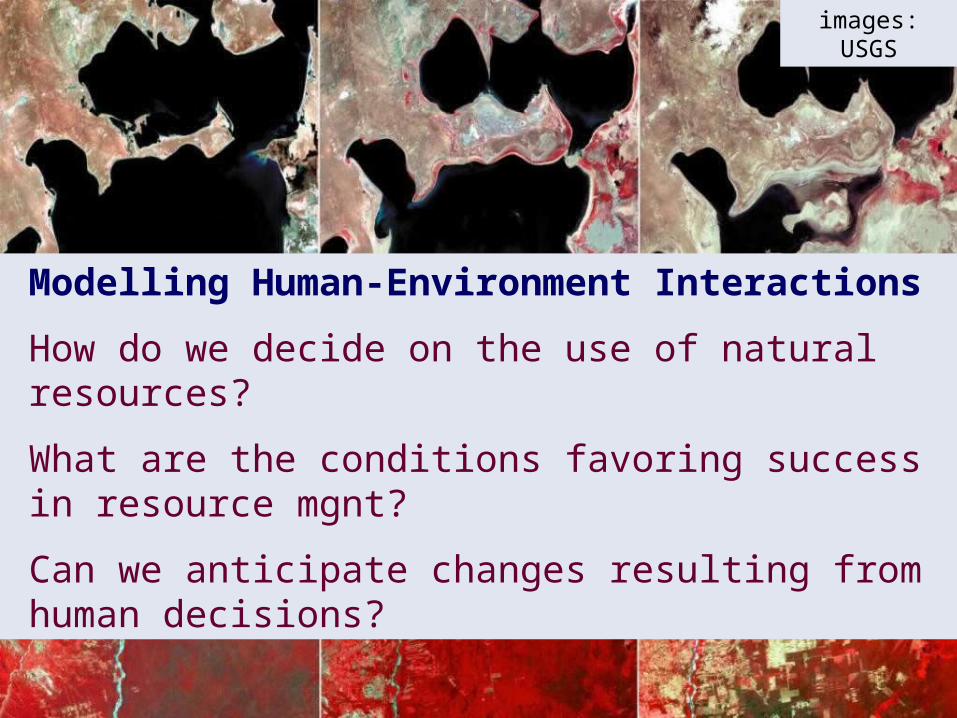
Slides from LANDSAT
Aral Sea 1973 1987 2000
images: USGS
Modelling Human-Environment Interactions
How do we decide on the use of natural resources?
What are the conditions favoring success in resource mgnt?
Can we anticipate changes resulting from human decisions?
Land Use Change in Amazonia: Institutional analysis and modeling at multiple temporal and spatial scales
Gilberto Câmara, Ana Aguiar, Roberto Araújo, Patrícia Pinho, Luciano Dutra, Corina Freitas, Leila Fonseca, Isabel Escada, Silvana Amaral, Pedro Andrade-Neto
FAPESP Climate Change Program Workshop 2011

Agent-Based Modelling: Computing approaches to complex systems
Goal
Environment
Representations
Communication
ActionPerception
Communication
source: Nigel Gilbert
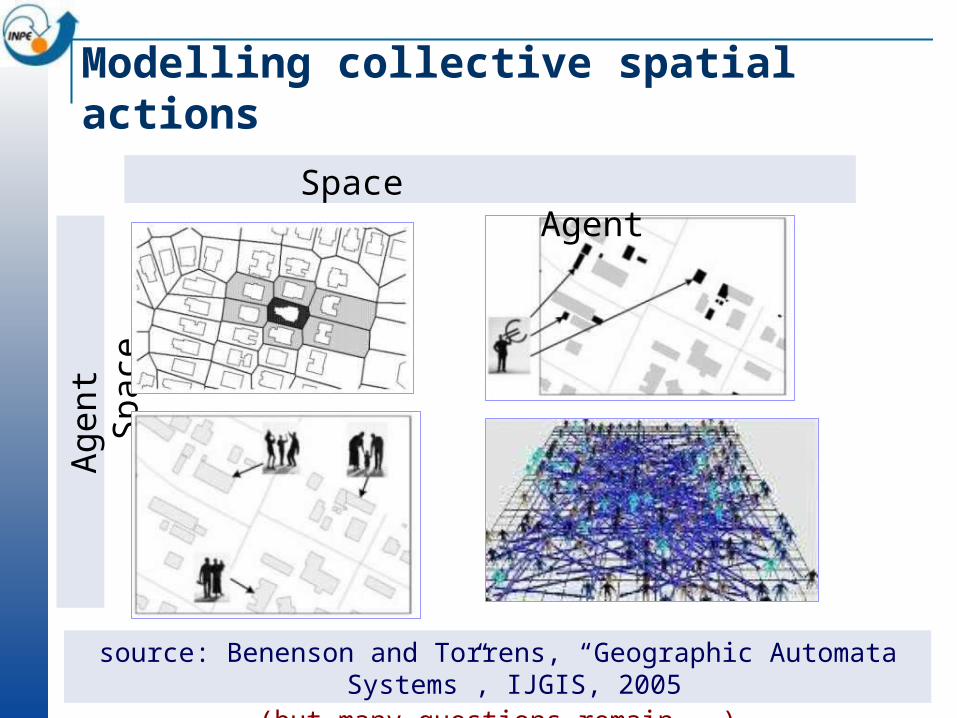
Agen
t
Spa
ce
Space Agent
source: Benenson and Torrens, “Geographic Automata Systems”, IJGIS, 2005(but many questions remain...)
Modelling collective spatial actions
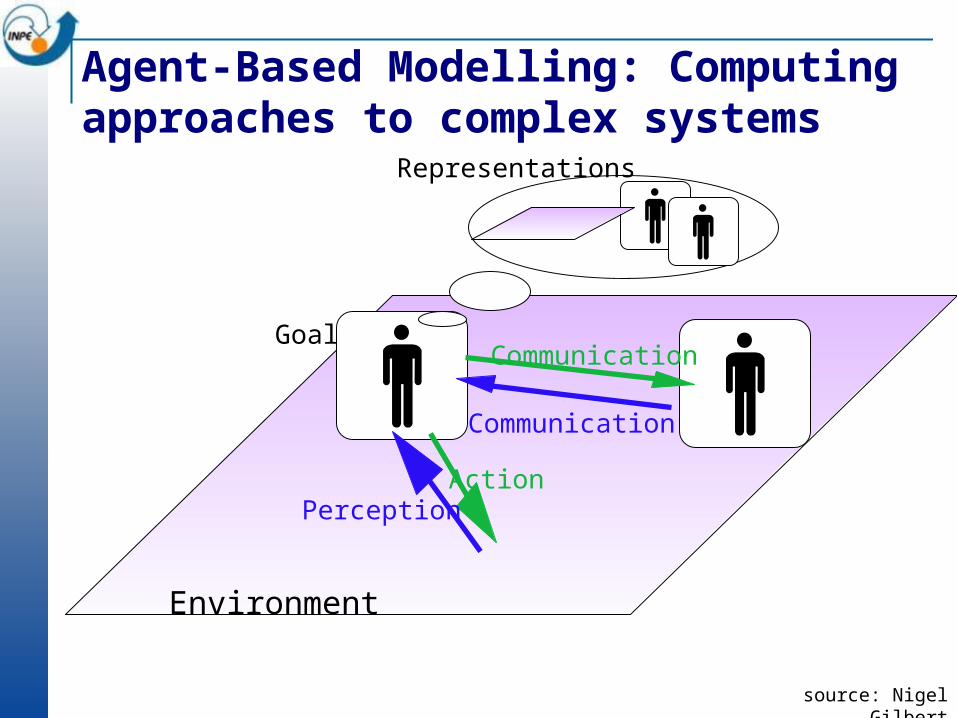
Agent-Based Modelling: Computing approaches to complex systems
Goal
Environment
Representations
Communication
ActionPerception
Communication
source: Nigel Gilbert
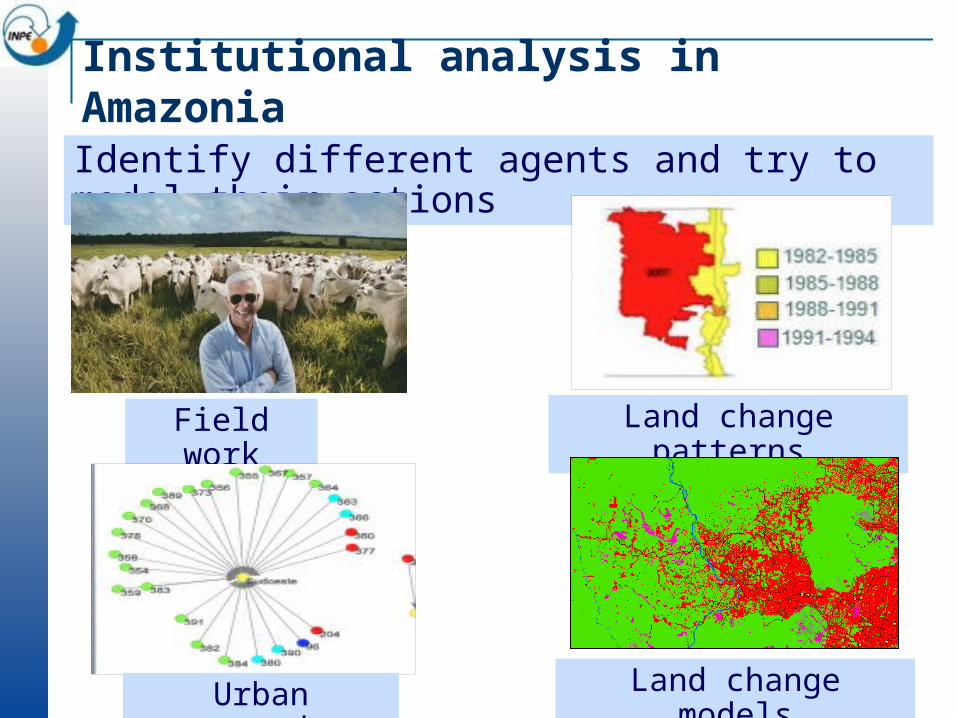
Institutional analysis in Amazonia
Identify different agents and try to model their actions
Field work Land change patterns
Land change modelsUrban networks
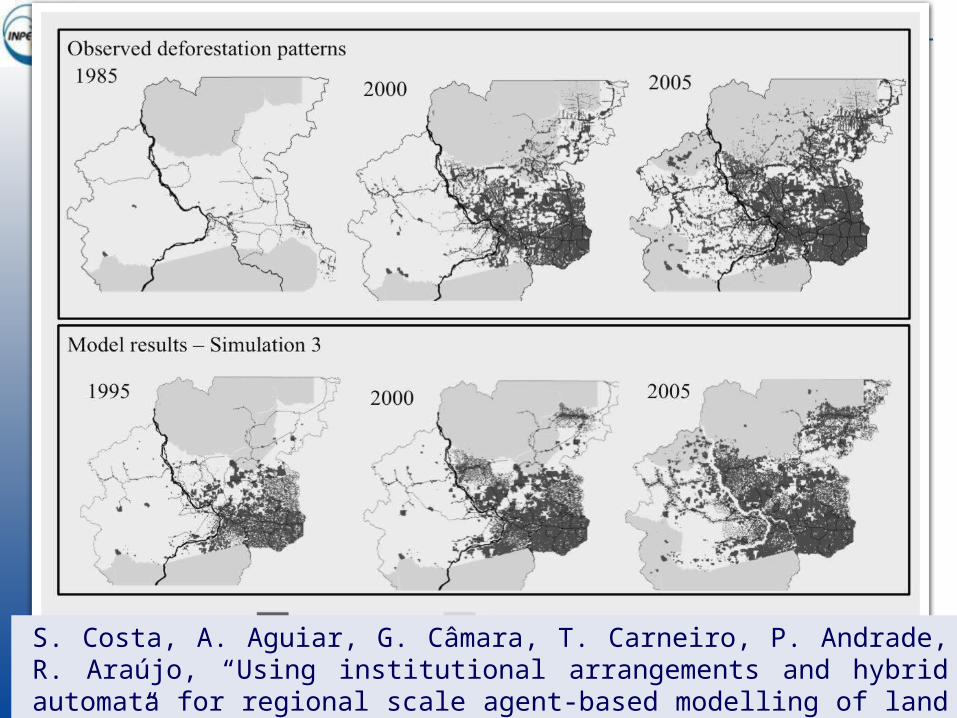
Modelling collective spatial actions
S. Costa, A. Aguiar, G. Câmara, T. Carneiro, P. Andrade, R. Araújo, “Using institutional arrangements and hybrid automata for regional scale agent-based modelling of land change” (under review), 2012.
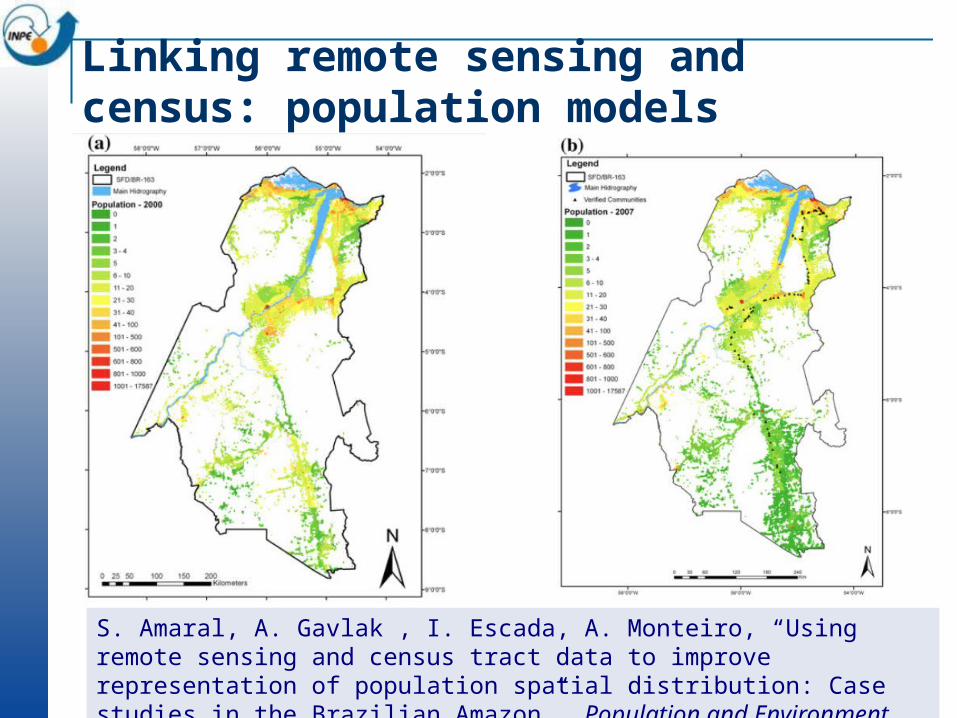
Linking remote sensing and census: population models
S. Amaral, A. Gavlak , I. Escada, A. Monteiro, “Using remote sensing and census tract data to improve representation of population spatial distribution: Case studies in the Brazilian Amazon”. Population and Environment, 34(1): 142-170, 2012.
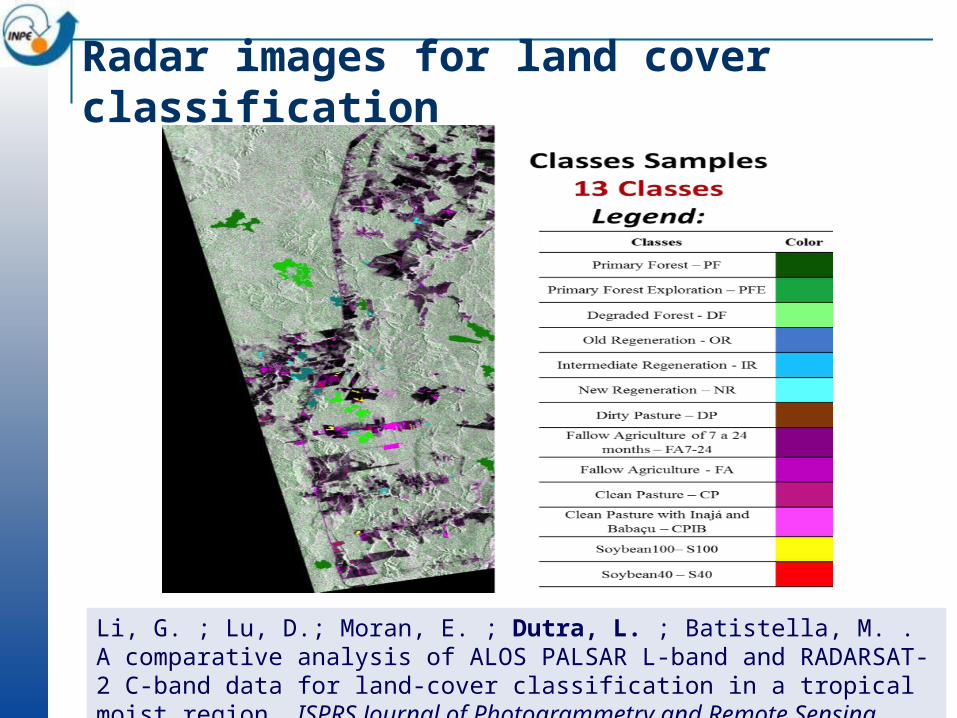
Radar images for land cover classification
Li, G. ; Lu, D.; Moran, E. ; Dutra, L. ; Batistella, M. . A comparative analysis of ALOS PALSAR L-band and RADARSAT-2 C-band data for land-cover classification in a tropical moist region. ISPRS Journal of Photogrammetry and Remote Sensing, 70:26-38, 2012.
REDD+ and Land Use Policy Assessment Centre
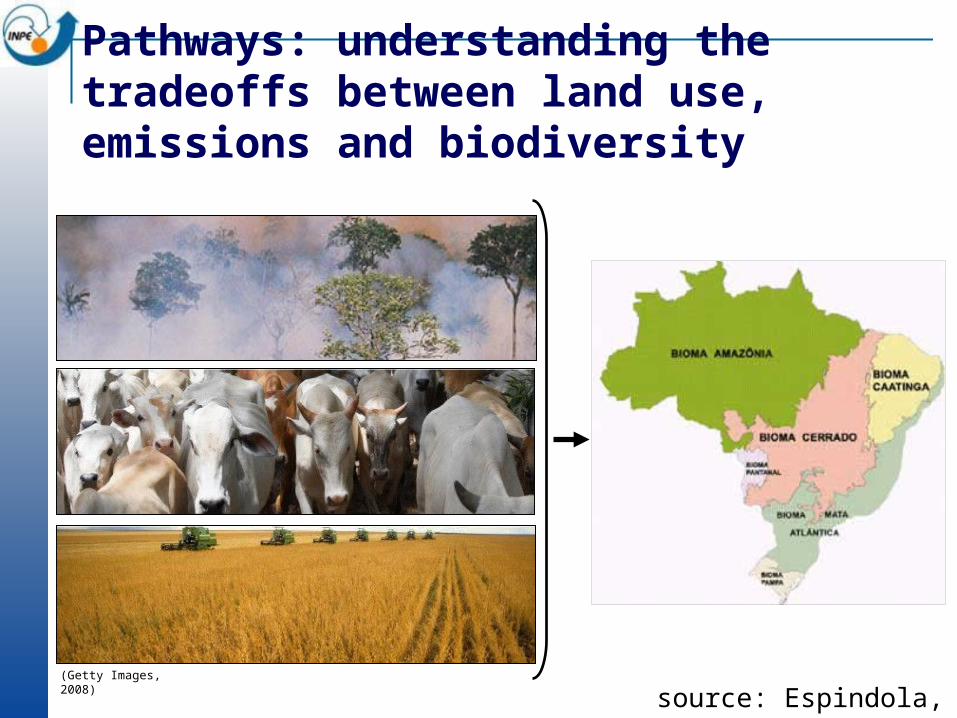
(Getty Images, 2008)
(PRODES, 2008)
source: Espindola, 2012
Pathways: understanding the tradeoffs between land use, emissions and biodiversity
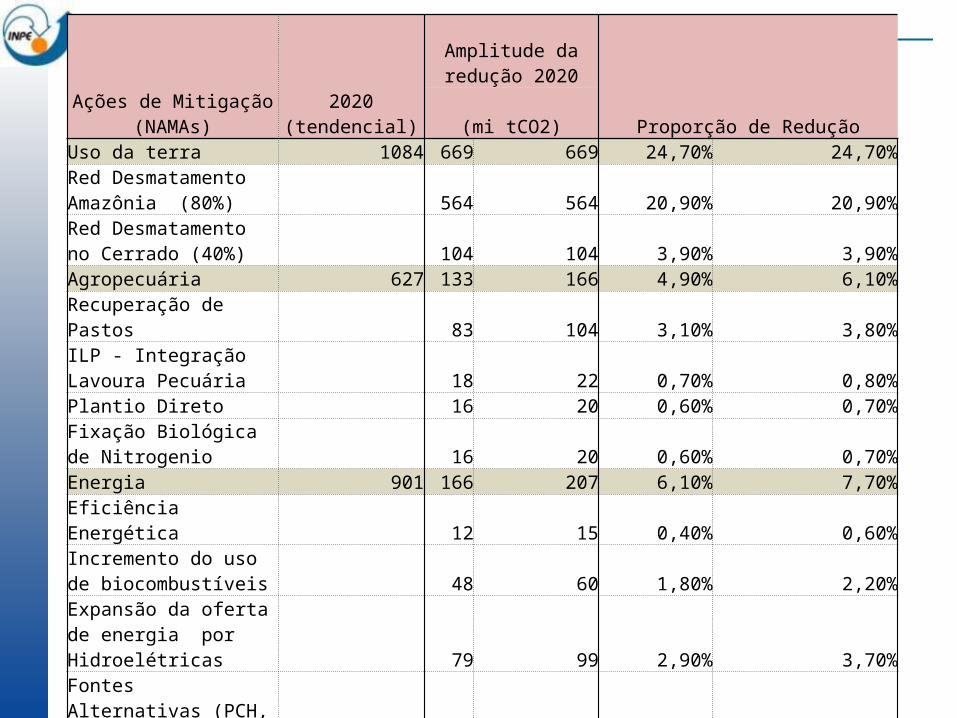
Ações de Mitigação (NAMAs) 2020 (tendencial)
Amplitude da redução 2020
Proporção de Redução(mi tCO2)Uso da terra 1084 669 669 24,70% 24,70%Red Desmatamento Amazônia (80%) 564 564 20,90% 20,90%Red Desmatamento no Cerrado (40%) 104 104 3,90% 3,90%Agropecuária 627 133 166 4,90% 6,10%Recuperação de Pastos 83 104 3,10% 3,80%ILP - Integração Lavoura Pecuária 18 22 0,70% 0,80%Plantio Direto 16 20 0,60% 0,70%Fixação Biológica de Nitrogenio 16 20 0,60% 0,70%Energia 901 166 207 6,10% 7,70%Eficiência Energética 12 15 0,40% 0,60%Incremento do uso de biocombustíveis 48 60 1,80% 2,20%Expansão da oferta de energia por Hidroelétricas 79 99 2,90% 3,70%Fontes Alternativas (PCH, Bioeletricidade, eólica) 26 33 1,00% 1,20%Outros 92 8 10 0,30% 0,40%
Siderurgia – substituir carvão de desmate por plantado 8 10 0,30% 0,40%Total 2703 975 1052 36,10% 38,90%
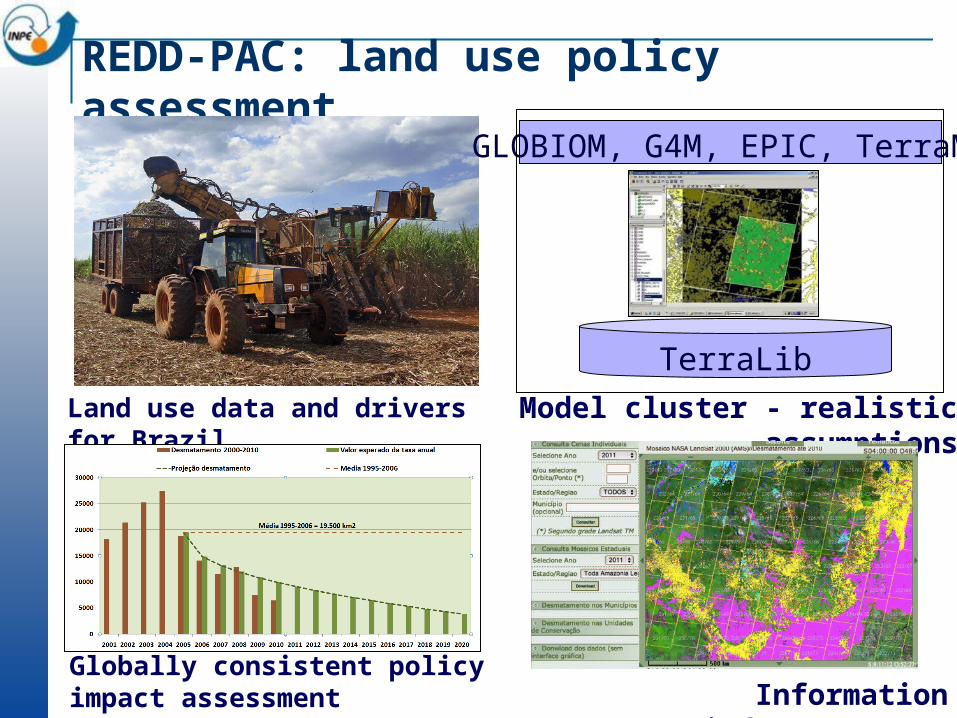
REDD-PAC: land use policy assessment
Land use data and drivers for Brazil Model cluster - realistic assumptions
Globally consistent policy impact assessment Information infrastructure
GLOBIOM, G4M, EPIC, TerraME
TerraLib
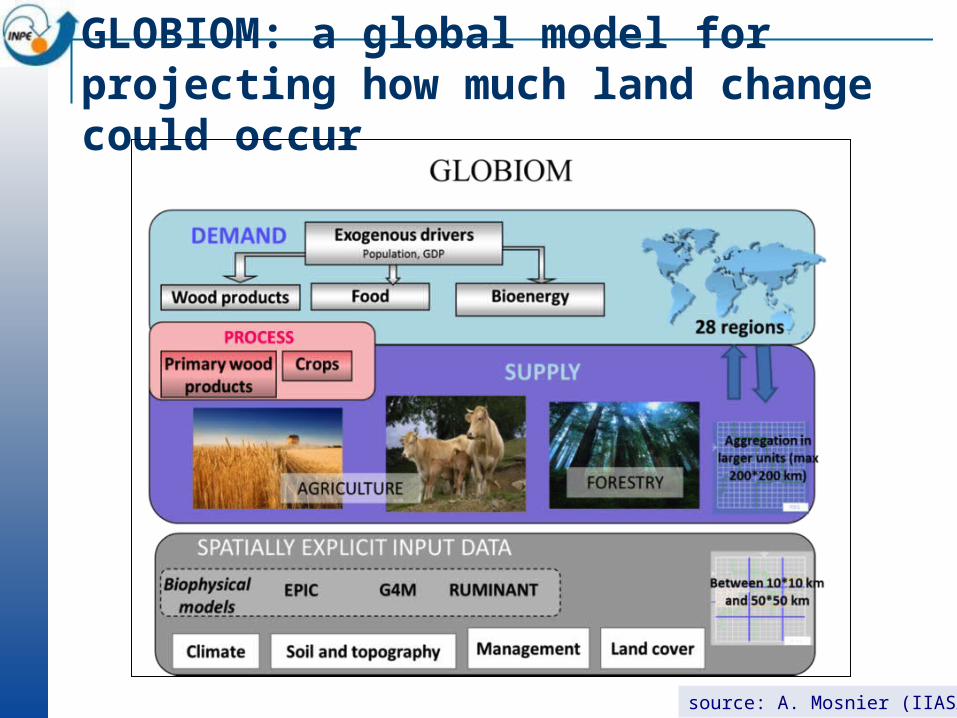
GLOBIOM: a global model for projecting how much land change could occur
source: A. Mosnier (IIASA)
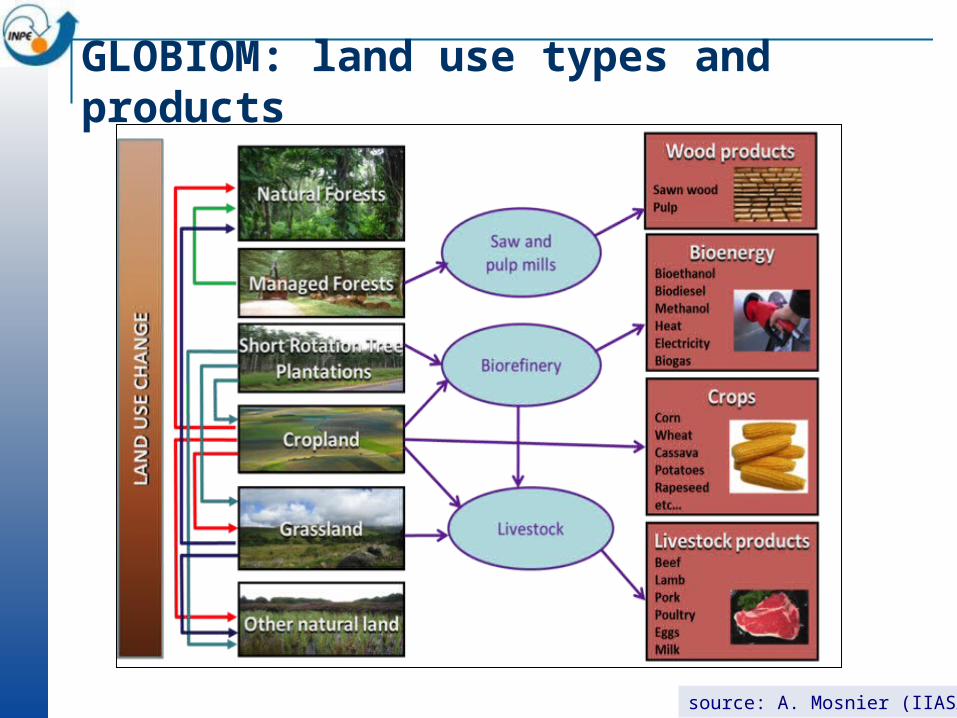
GLOBIOM: land use types and products
source: A. Mosnier (IIASA)
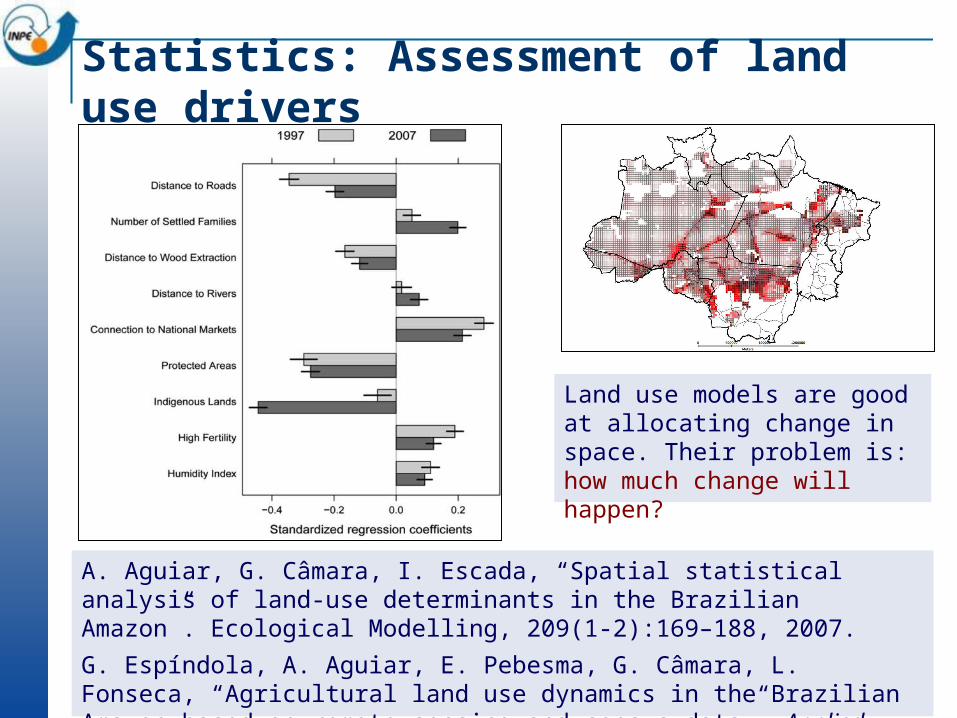
Statistics: Assessment of land use drivers
A. Aguiar, G. Câmara, I. Escada, “Spatial statistical analysis of land-use determinants in the Brazilian Amazon”. Ecological Modelling, 209(1-2):169–188, 2007.
G. Espíndola, A. Aguiar, E. Pebesma, G. Câmara, L. Fonseca, “Agricultural land use dynamics in the Brazilian Amazon based on remote sensing and census data”, Applied Geography, 32(2):240-252, 2012.
Land use models are good at allocating change in space. Their problem is: how much change will happen?
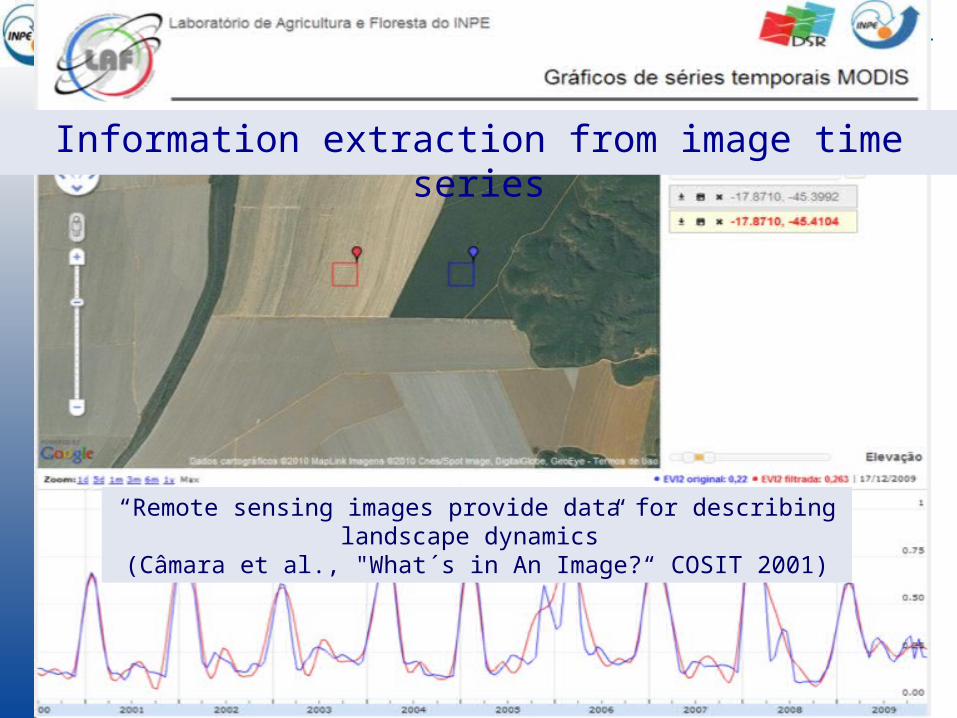
Information extraction from image time series
“Remote sensing images provide data for describing landscape dynamics” (Câmara et al., "What´s in An Image?“ COSIT 2001)
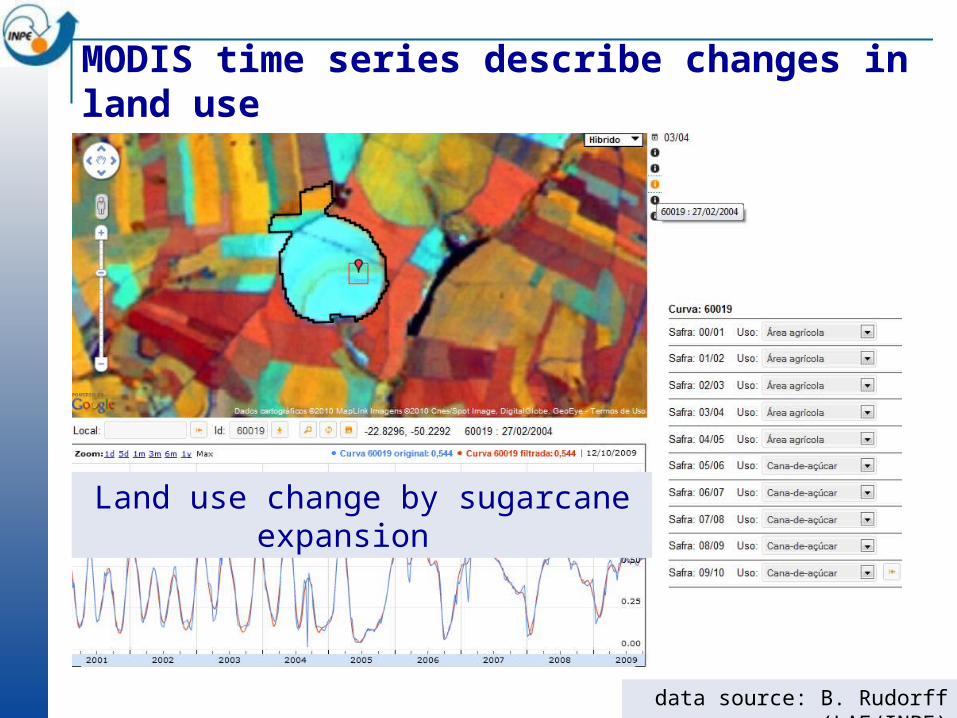
data source: B. Rudorff (LAF/INPE)
MODIS time series describe changes in land use
Land use change by sugarcane expansion
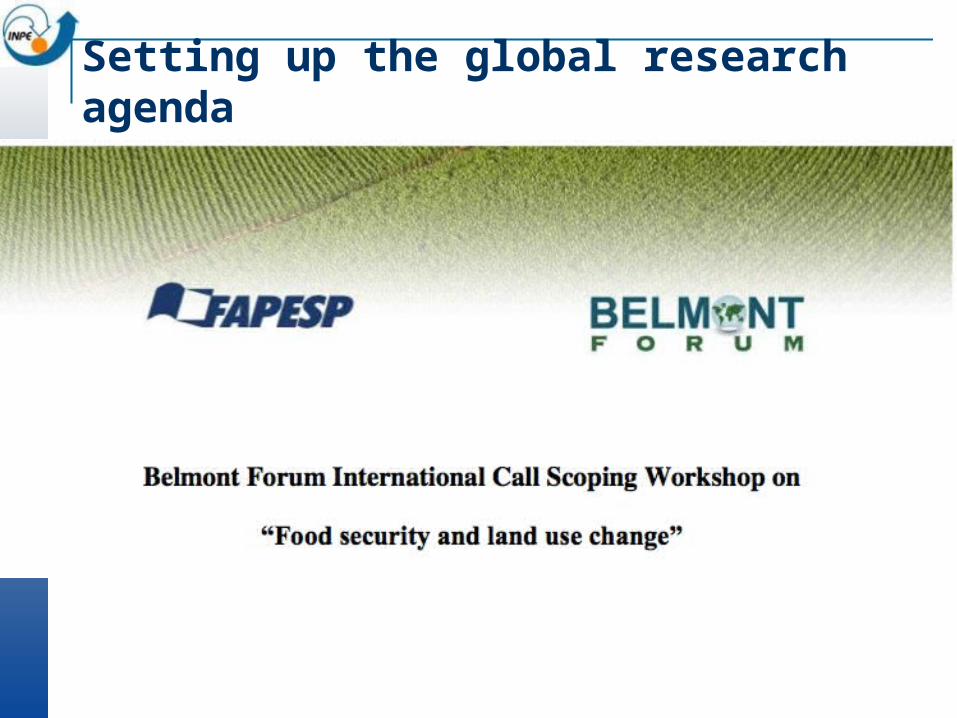
Setting up the global research agenda
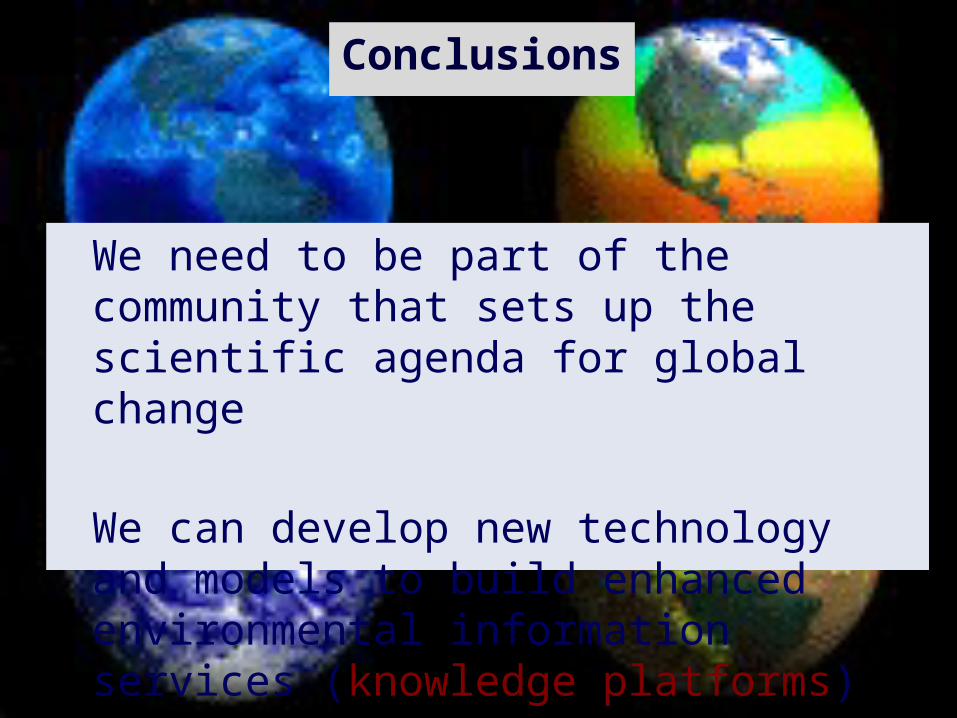
We need to be part of the community that sets up the scientific agenda for global change
We can develop new technology and models to build enhanced environmental information services (knowledge platforms)
Conclusions