Embed Size (px)
Citation preview
Data Management and Visualization with Tableau
Rachel Lewellen, University of
Massachusetts Amherst
Martha Kyrillidou, Association of
Research Libraries
March 17, 2015

Webcast Series
• March 3, 2015: Sarah Anne Murphy, Ohio State University
• March 10, 2015: Jeremy Buhler, University of British Columbia
• March 17, 2015: Rachel Lewellen, University of Massachusetts Amherst
• April 21, 2015: Discussion and Q&A
UMass Amherst Libraries
Tableau at UMass Amherst Libraries
Rachel Lewellen Assessment Librarian University of Massachusetts Amherst [email protected]
2 UMass Amherst Libraries
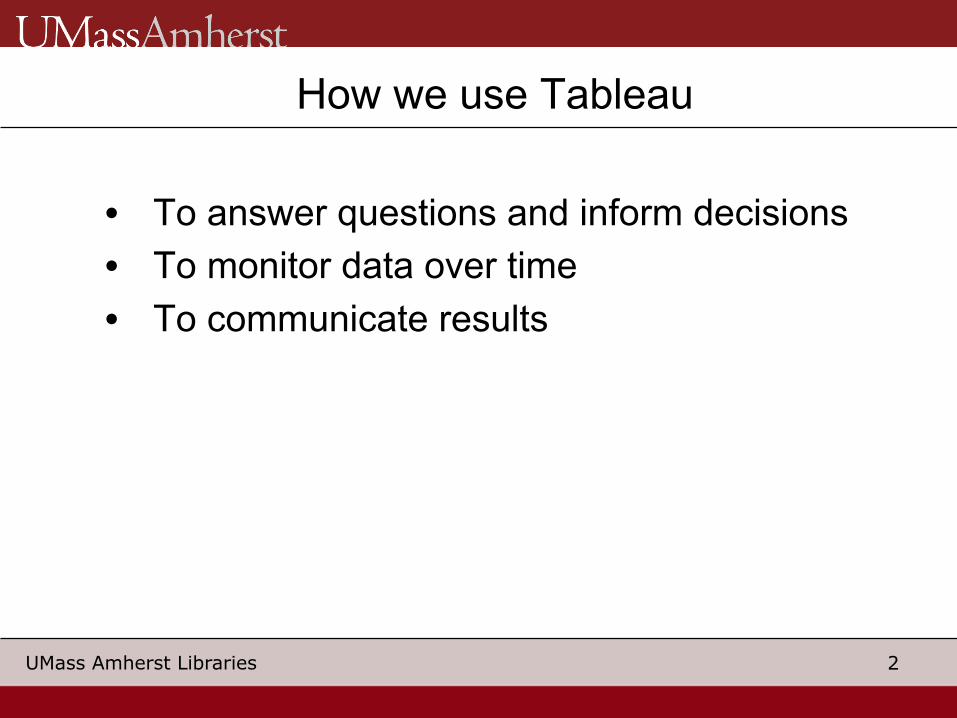
How we use Tableau
• To answer questions and inform decisions • To monitor data over time • To communicate results
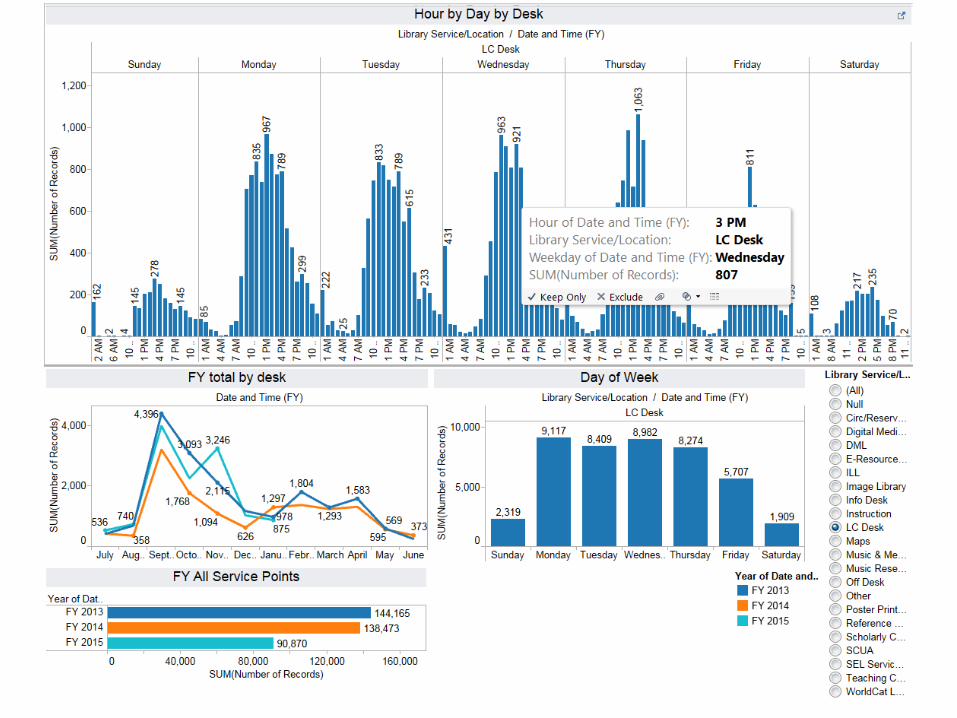
LibAnalyics Service Desk Statistics
Excel Data
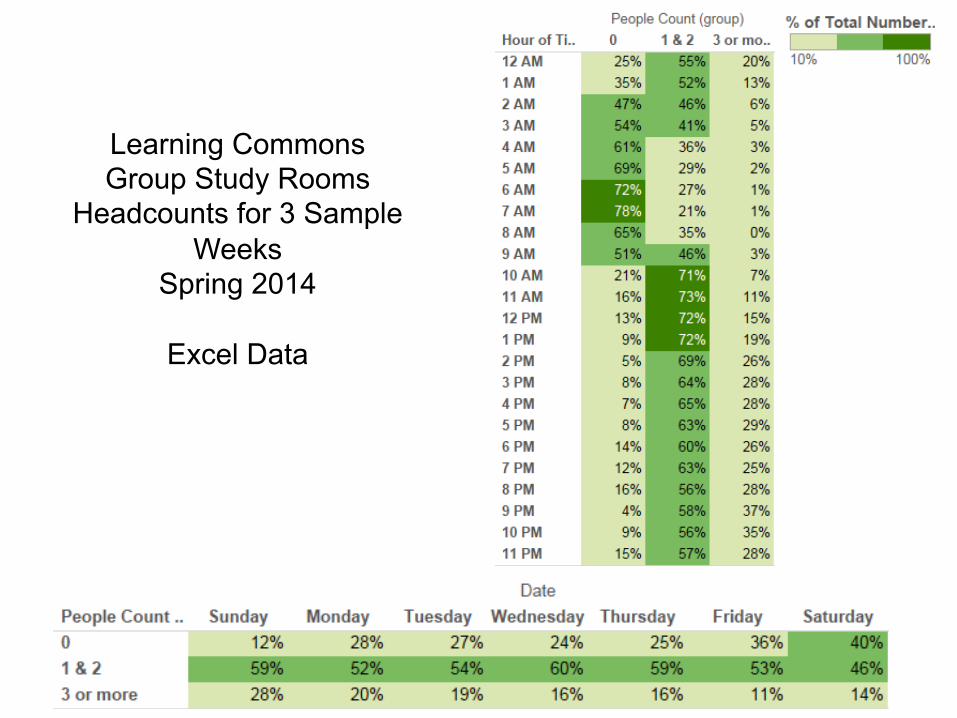
Learning Commons Group Study Rooms
Headcounts for 3 Sample Weeks
Spring 2014
Excel Data
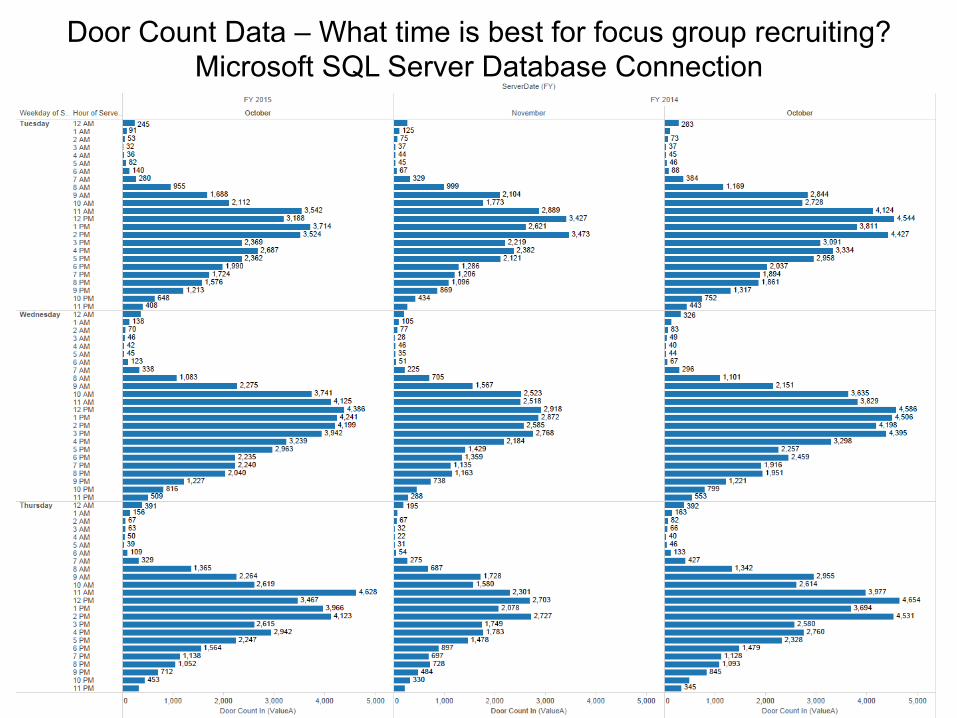
Door Count Data – What time is best for focus group recruiting? Microsoft SQL Server Database Connection
Aleph - Oracle Database Connection
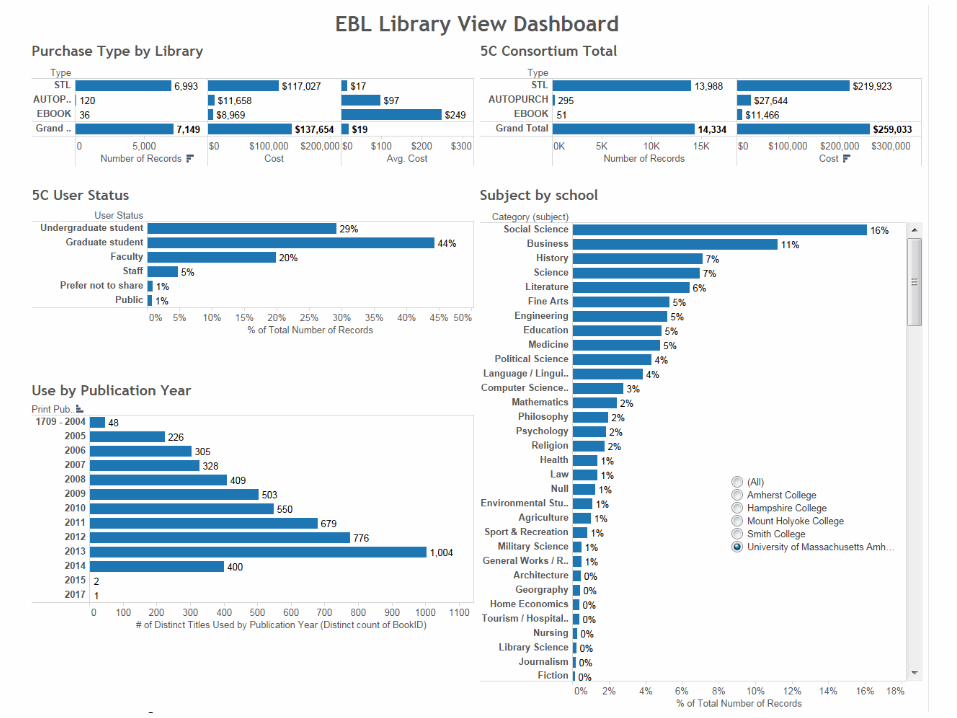
Five College Consortium EBL Pilot Project – Excel Data
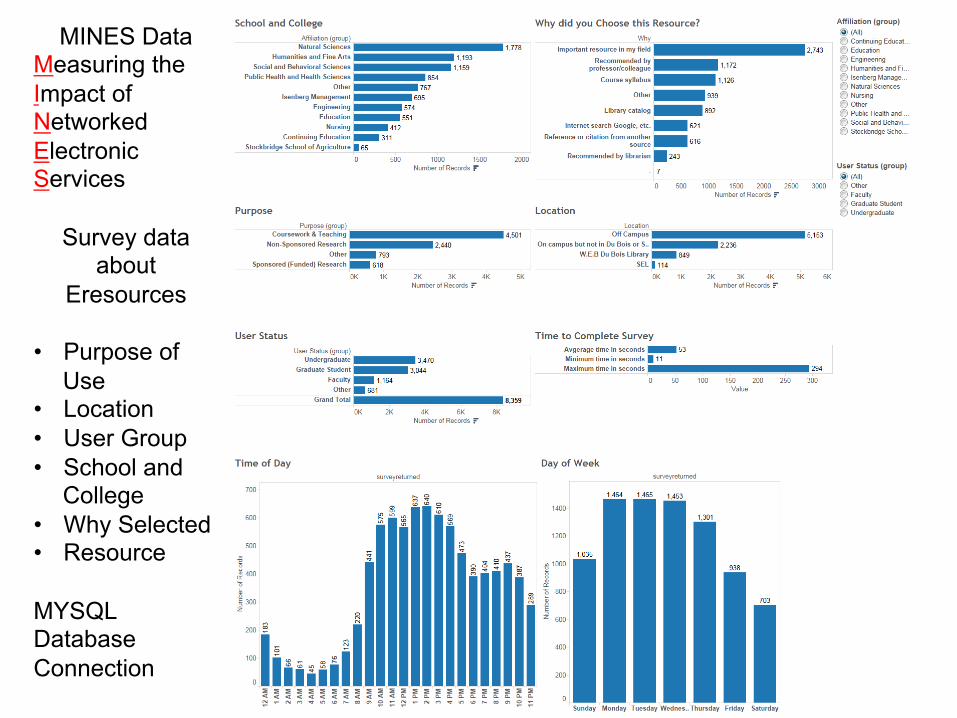
MINES Data Measuring the Impact of Networked Electronic Services
Survey data
about Eresources
• Purpose of
Use • Location • User Group • School and
College • Why Selected • Resource MYSQL Database Connection
9 UMass Amherst Libraries
How we share results
• Publish to Tableau Public • Publish to Tableau Server • Print views or PDF’s • Email images • Work collaboratively with Desktop
Professional
10 UMass Amherst Libraries
Questions
If you are using Tableau or other data analytics platforms, please join and post your examples in
ARL-ASSESS Google group


![Tableau Presantation.ppt [Kompatibilitetstilstand] · Why Tableau Tableau a great Tool for visualization, BI and data analytics. • Ideal for complex visualization • Interactive](https://img.pdfslide.net/doc/110x75/5ec5464447074405911878d3/tableau-kompatibilitetstilstand-why-tableau-tableau-a-great-tool-for-visualization.jpg)