Embed Size (px)
Citation preview
Data Session: October 19, 2015
www.psesd.org
WaKIDS Leadership Alliance
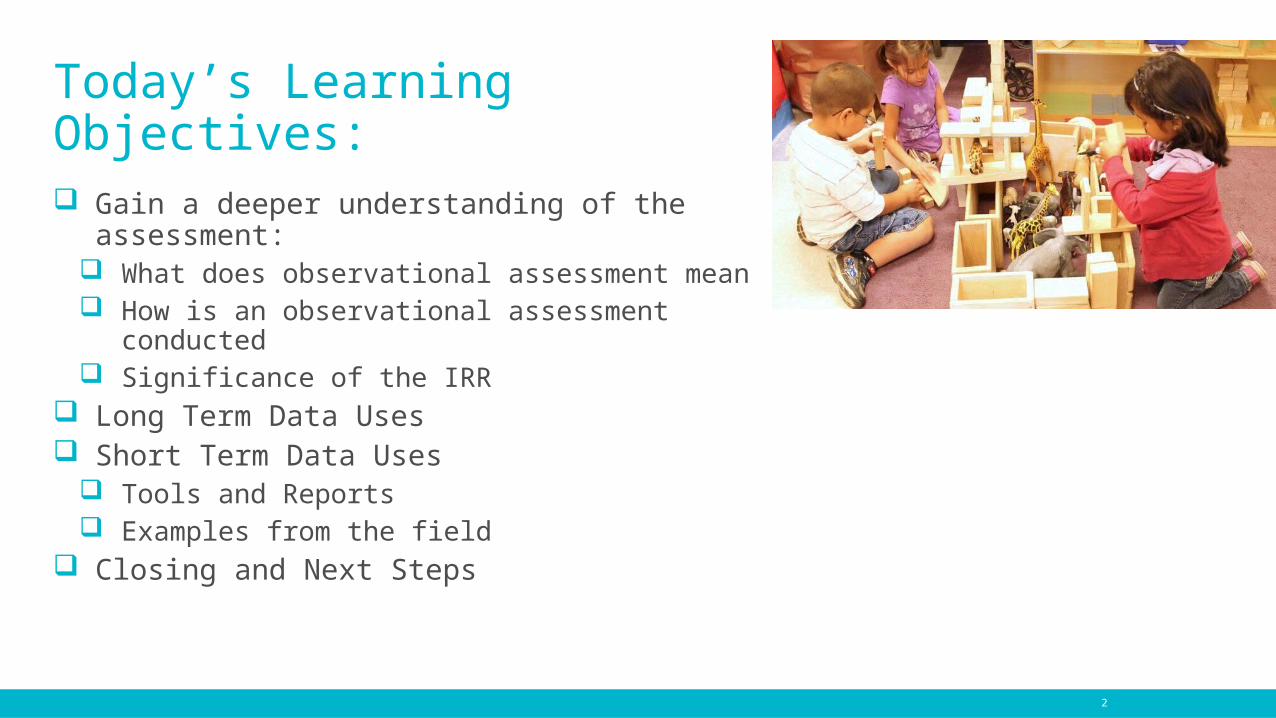
Today’s Learning Objectives: Gain a deeper understanding of the
assessment: What does observational assessment mean How is an observational assessment
conducted Significance of the IRR
Long Term Data Uses Short Term Data Uses
Tools and Reports Examples from the field
Closing and Next Steps
2
3
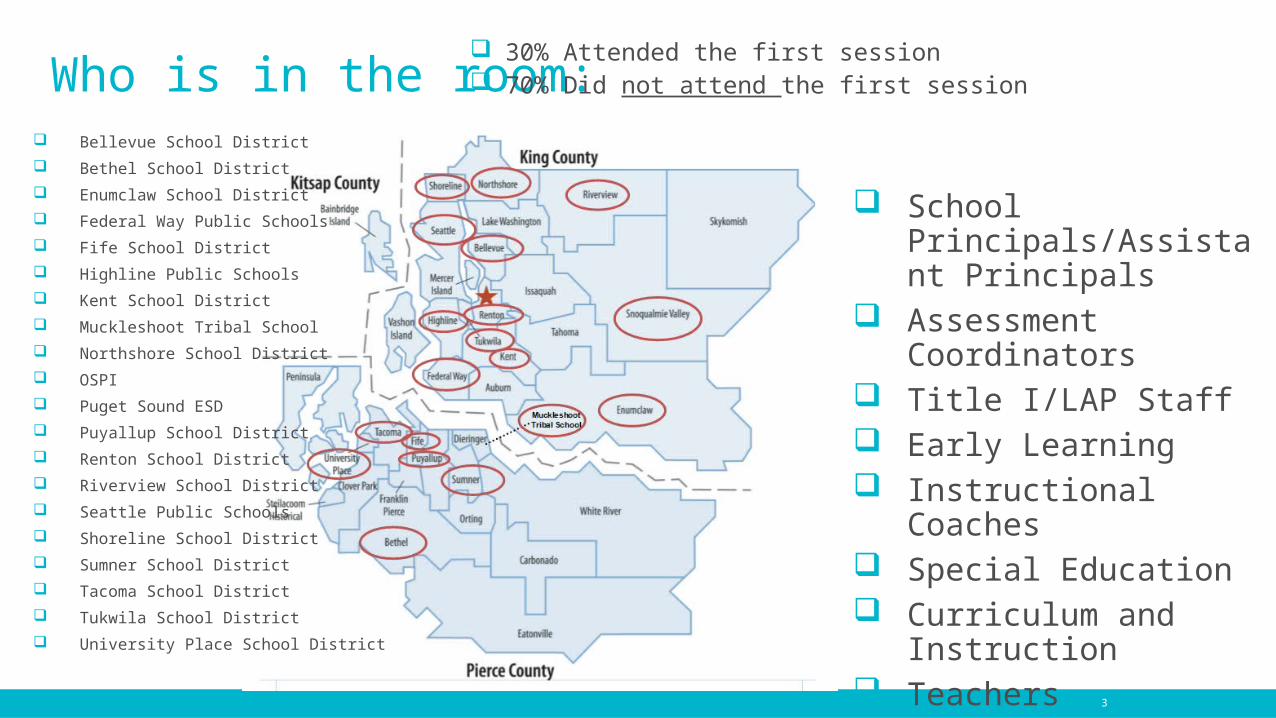
Who is in the room:
School Principals/Assistant Principals
Assessment Coordinators
Title I/LAP Staff Early Learning Instructional Coaches Special Education Curriculum and
Instruction Teachers
Bellevue School District
Bethel School District
Enumclaw School District
Federal Way Public Schools
Fife School District
Highline Public Schools
Kent School District
Muckleshoot Tribal School
Northshore School District
OSPI
Puget Sound ESD
Puyallup School District
Renton School District
Riverview School District
Seattle Public Schools
Shoreline School District
Sumner School District
Tacoma School District
Tukwila School District
University Place School District
30% Attended the first session 70% Did not attend the first session
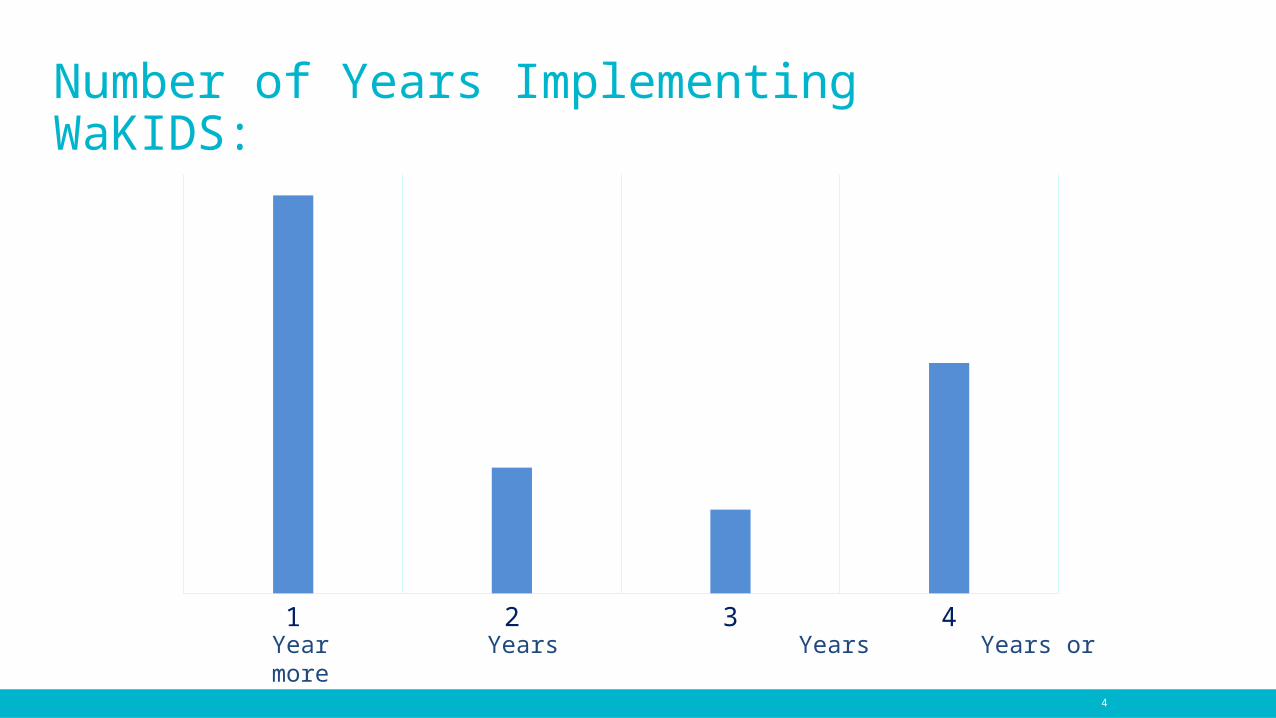
Number of Years Implementing WaKIDS:
4
1 2 3 4
48%
15%10%
28%
Year Years Years Years or more
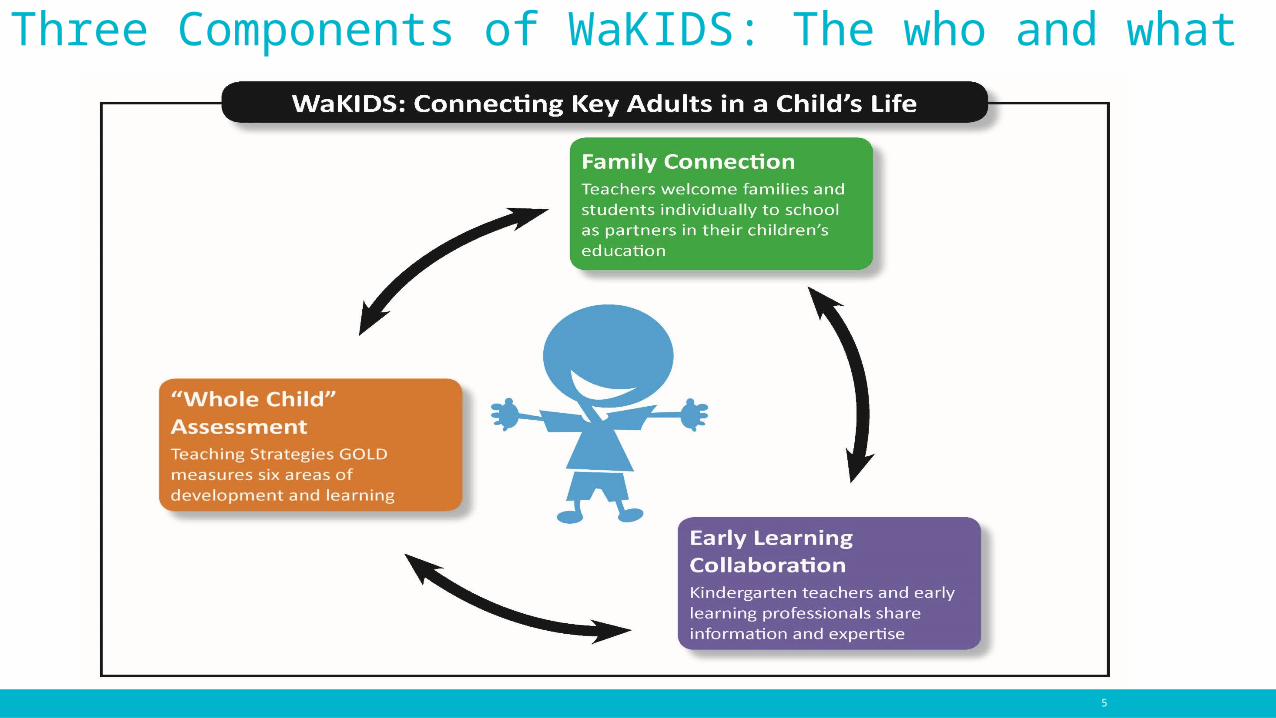
Three Components of WaKIDS: The who and what
5

6
WaKIDS Uses a Whole Child Assessment Collecting data in 6 areas of development and learning
Physical
Cognitive
Language
Literacy
Math
Social-Emotional
Recognizes that learning is interconnected
WaKIDS Uses GOLD as its whole child assessment tool
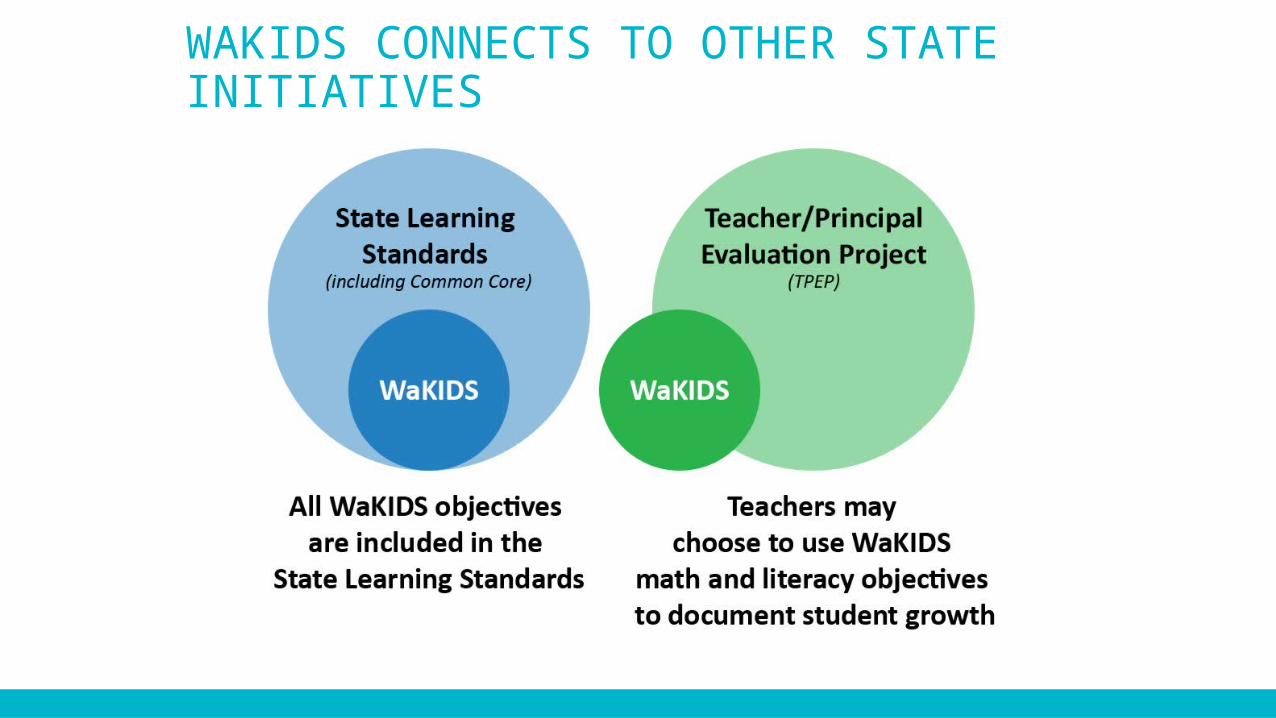
WAKIDS CONNECTS TO OTHER STATE INITIATIVES
8
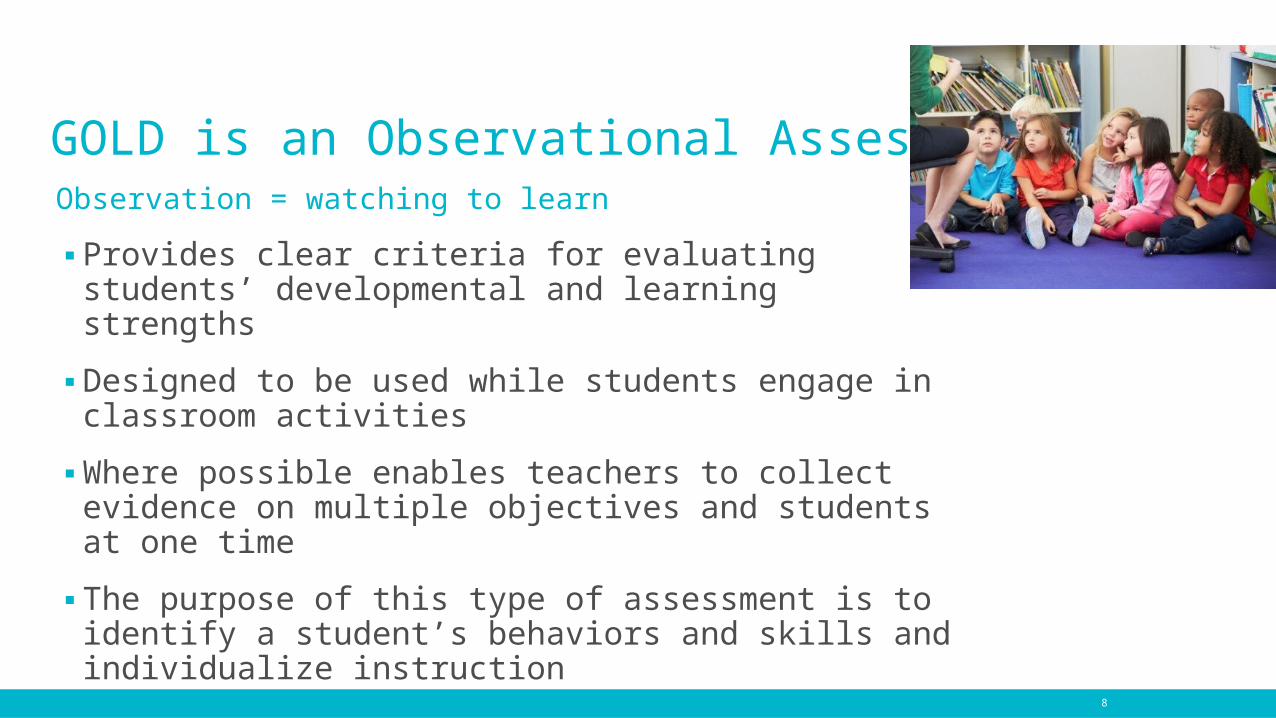
GOLD is an Observational AssessmentObservation = watching to learn
▪ Provides clear criteria for evaluating students’ developmental and learning strengths
▪ Designed to be used while students engage in classroom activities
▪ Where possible enables teachers to collect evidence on multiple objectives and students at one time
▪ The purpose of this type of assessment is to identify a student’s behaviors and skills and individualize instruction
9
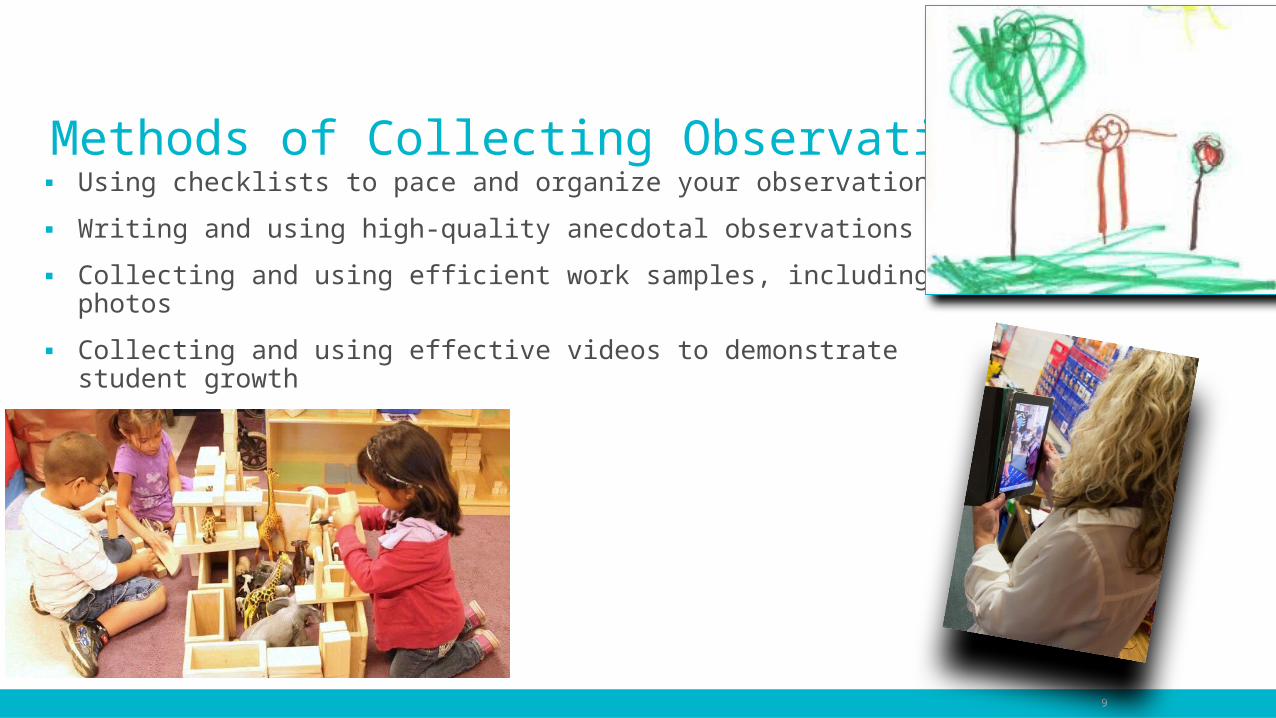
Methods of Collecting Observational Data▪ Using checklists to pace and organize your observations
▪ Writing and using high-quality anecdotal observations
▪ Collecting and using efficient work samples, including photos
▪ Collecting and using effective videos to demonstrate student growth
Digging Deeper in to GOLD
Natalie HanniP-3 Systems Coach, PSESD
11
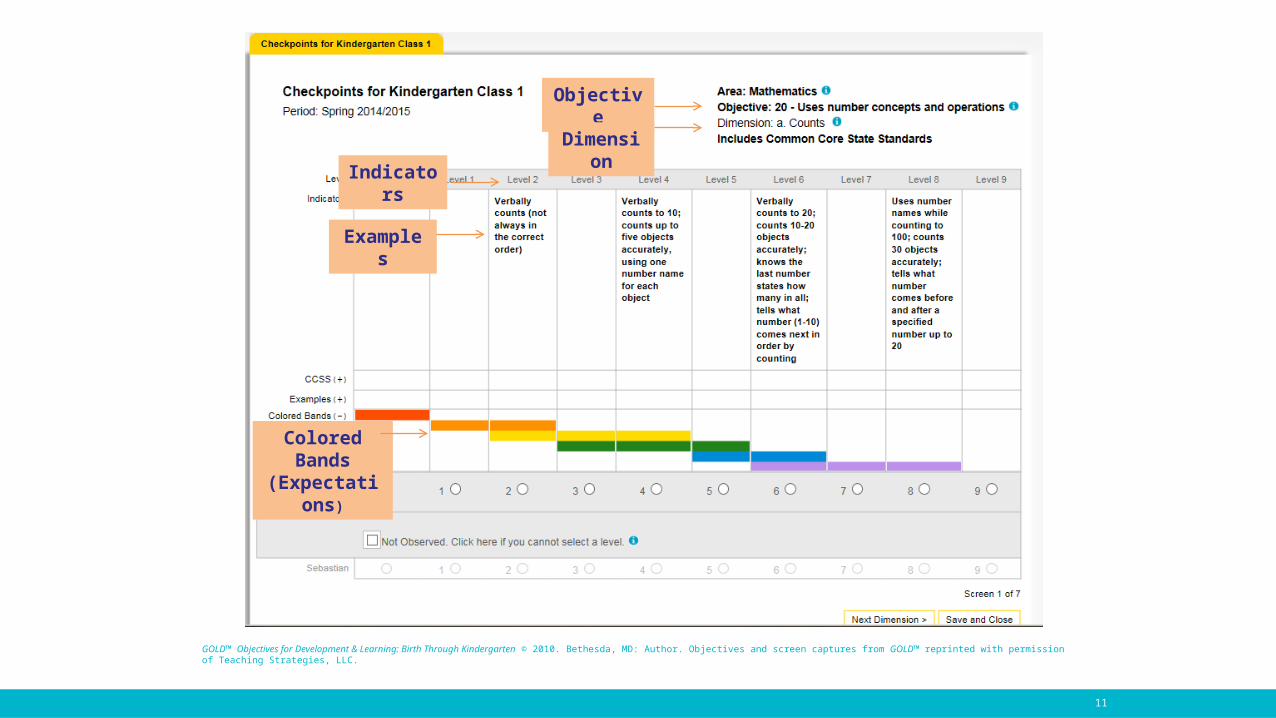
Objective
Dimension
Examples
Indicators
Colored Bands(Expectations)
GOLD™ Objectives for Development & Learning: Birth Through Kindergarten © 2010. Bethesda, MD: Author. Objectives and screen captures from GOLD™ reprinted with permission of Teaching Strategies, LLC.
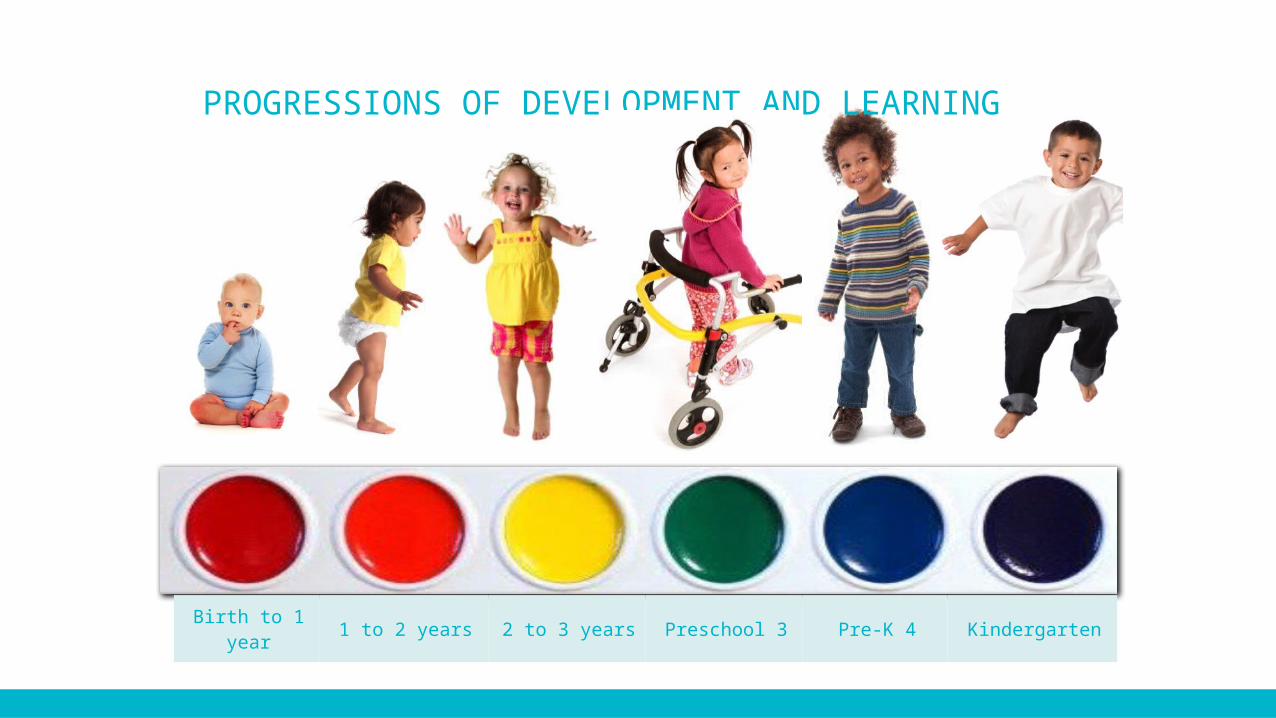
Birth to 1 year 1 to 2 years 2 to 3 years Preschool 3 Pre-K 4 Kindergarten
PROGRESSIONS OF DEVELOPMENT AND LEARNING
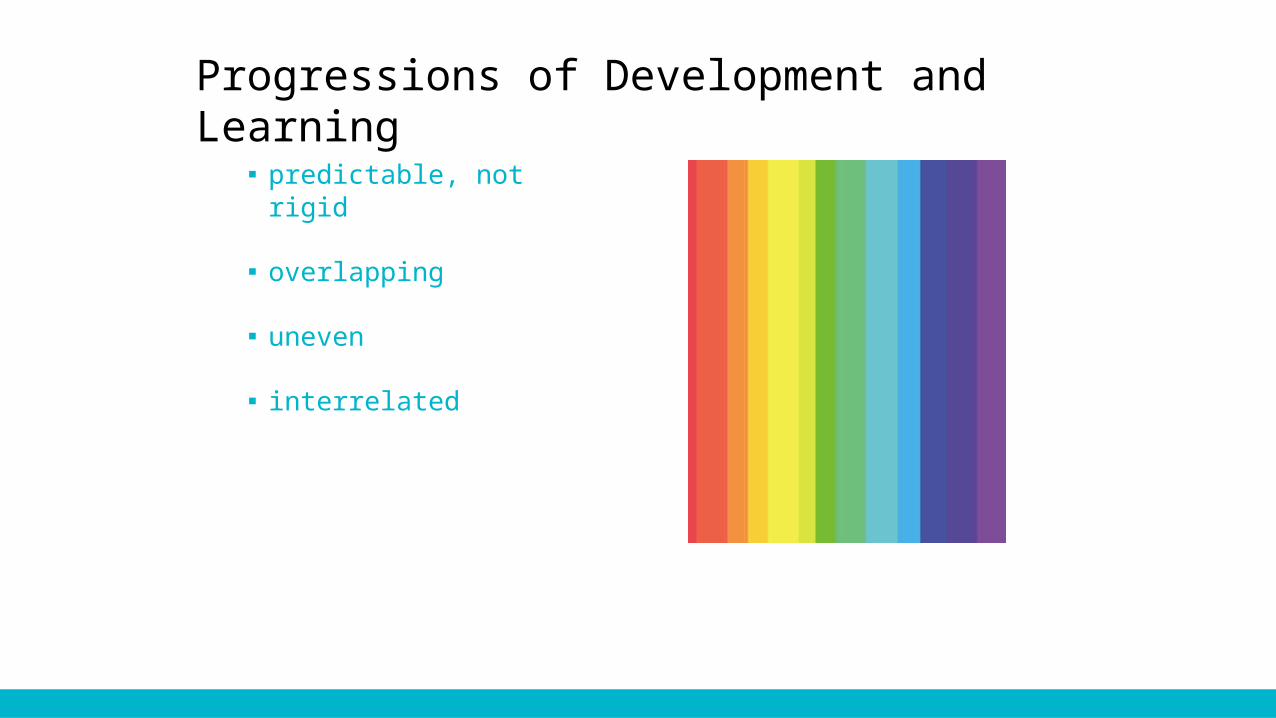
▪ predictable, not rigid
▪ overlapping
▪ uneven
▪ interrelated
Progressions of Development and Learning
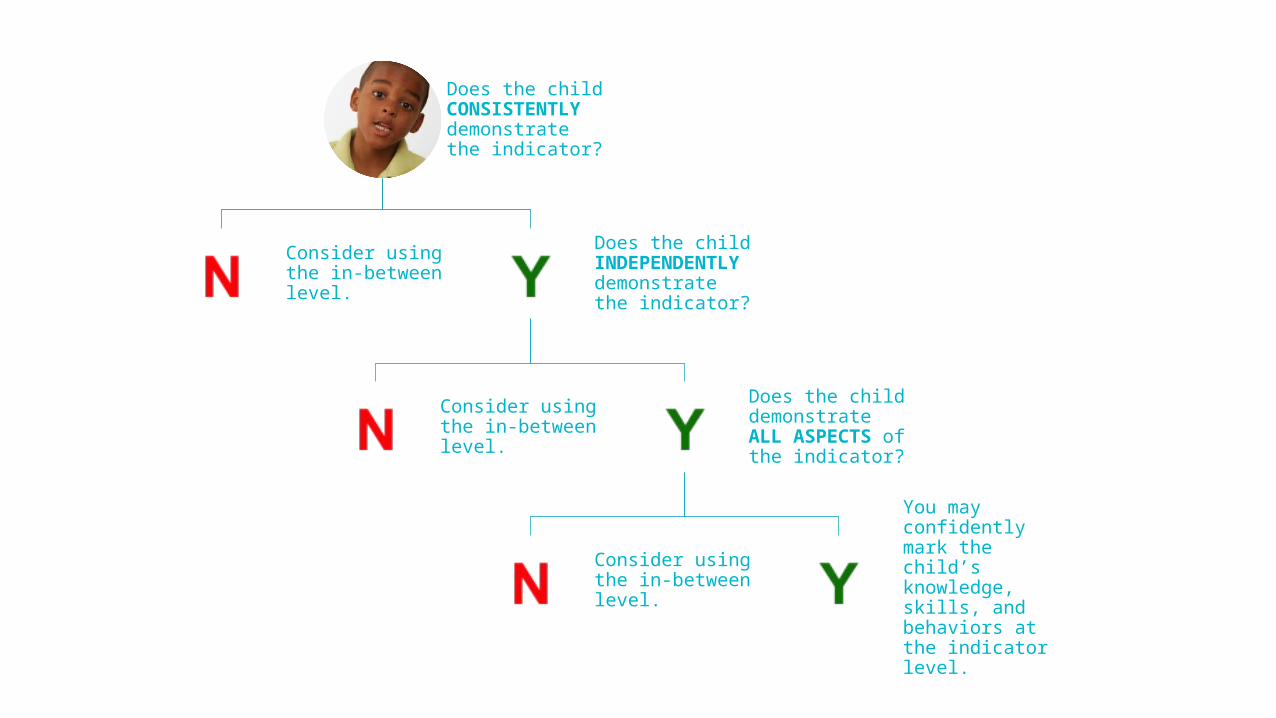
Does the child CONSISTENTLY demonstrate the indicator?
Consider using the in-between level.
Does the child INDEPENDENTLY demonstrate the indicator?
Consider using the in-between level.
Does the child demonstrate ALL ASPECTS of the indicator?
Consider using the in-between level.
You may confidently mark the child’s knowledge, skills, and behaviors at the indicator level.

15
Objective
Dimension
Examples
Indicators
Colored Bands(Expectations)
GOLD™ Objectives for Development & Learning: Birth Through Kindergarten © 2010. Bethesda, MD: Author. Objectives and screen captures from GOLD™ reprinted with permission of Teaching Strategies, LLC.
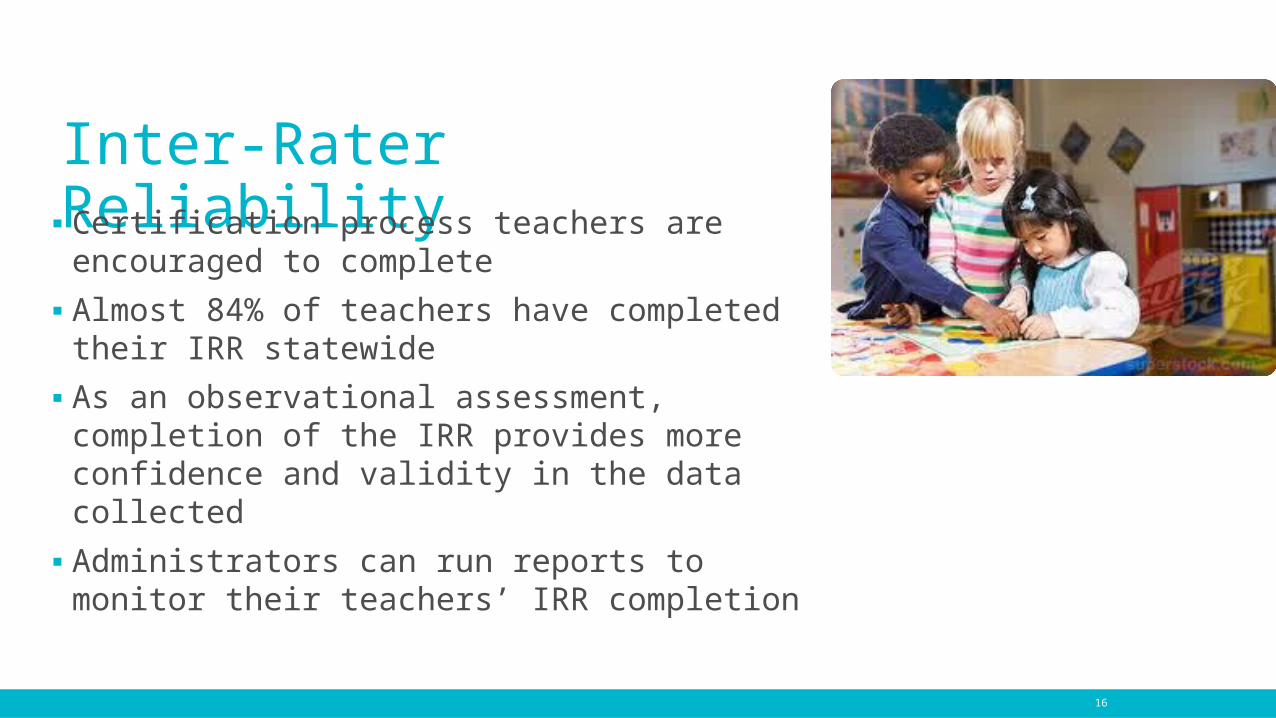
Inter-Rater Reliability
16
▪ Certification process teachers are encouraged to complete
▪ Almost 84% of teachers have completed their IRR statewide
▪ As an observational assessment, completion of the IRR provides more confidence and validity in the data collected
▪ Administrators can run reports to monitor their teachers’ IRR completion
Long Term Uses of WaKIDS Data
Natalie HanniP-3 Systems Coach, PSESD
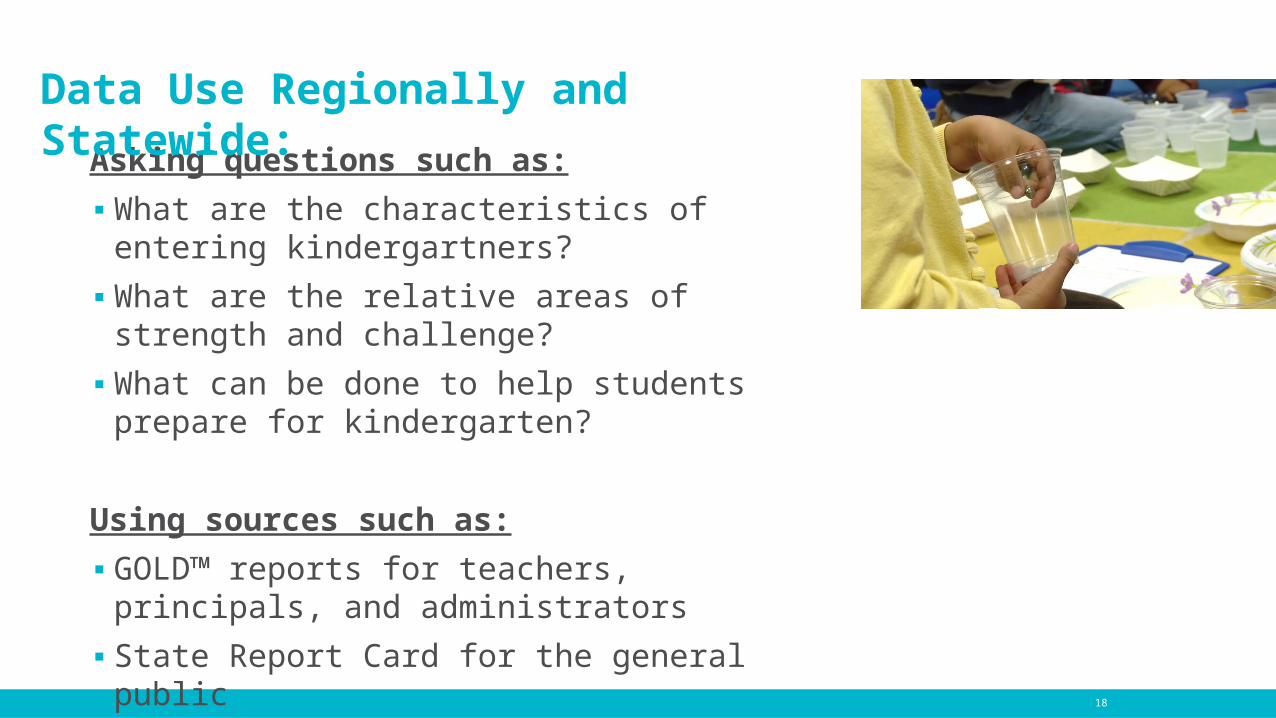
Asking questions such as:
▪ What are the characteristics of entering kindergartners?
▪ What are the relative areas of strength and challenge?
▪ What can be done to help students prepare for kindergarten?
Using sources such as:
▪ GOLD™ reports for teachers, principals, and administrators
▪ State Report Card for the general public 18
Data Use Regionally and Statewide:
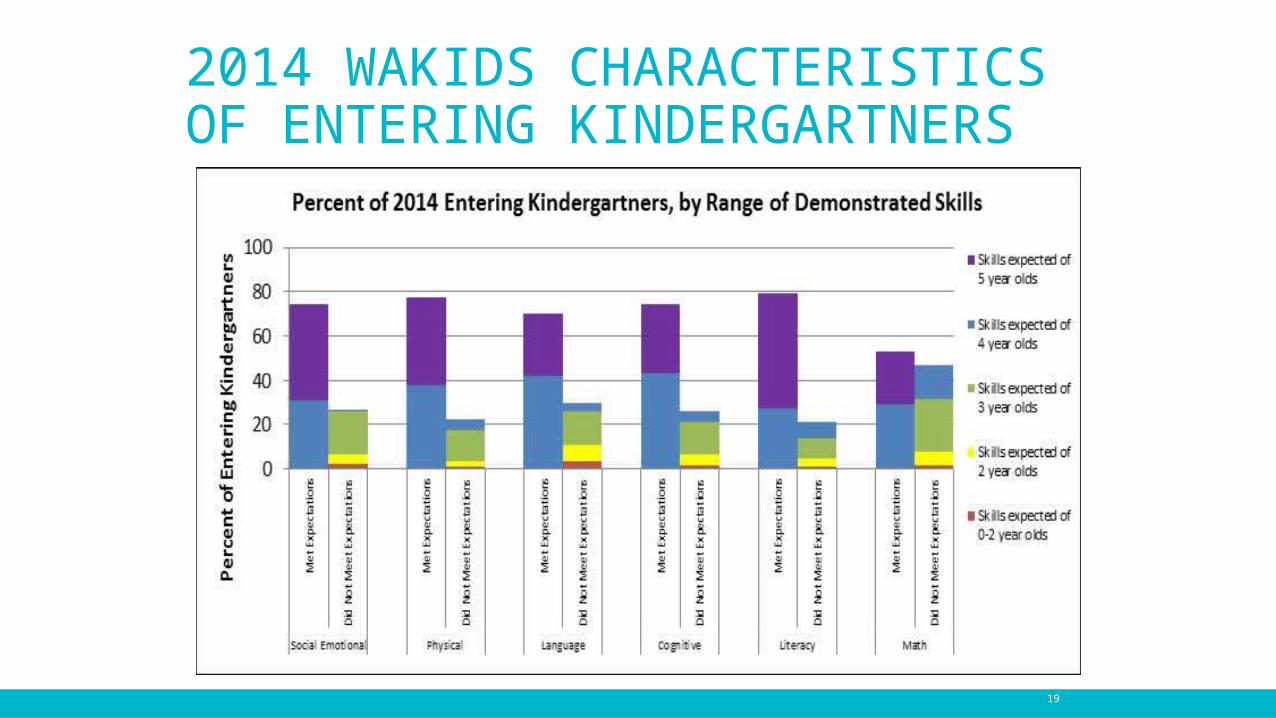
2014 WAKIDS CHARACTERISTICS OF ENTERING KINDERGARTNERS
19
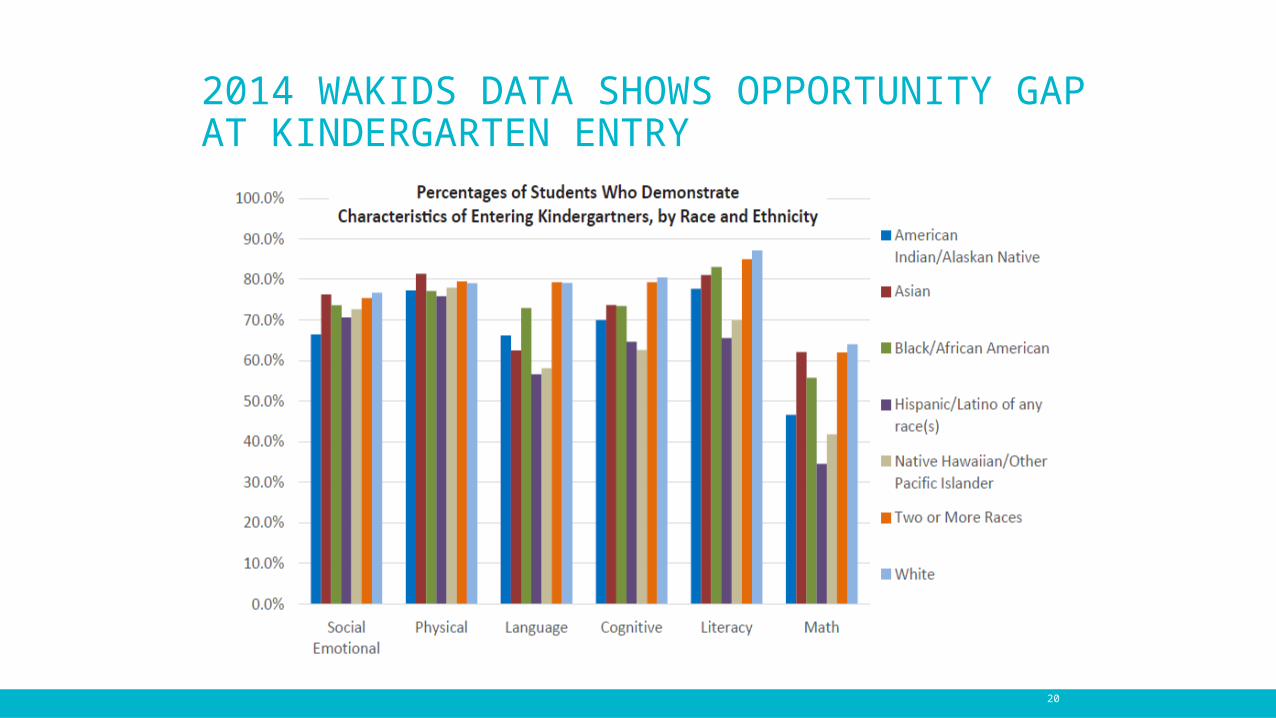
2014 WAKIDS DATA SHOWS OPPORTUNITY GAP AT KINDERGARTEN ENTRY
20
In Practice:
Laurie SjolundP-3 Literacy and Early Learning Program Administrator, Sumner School District
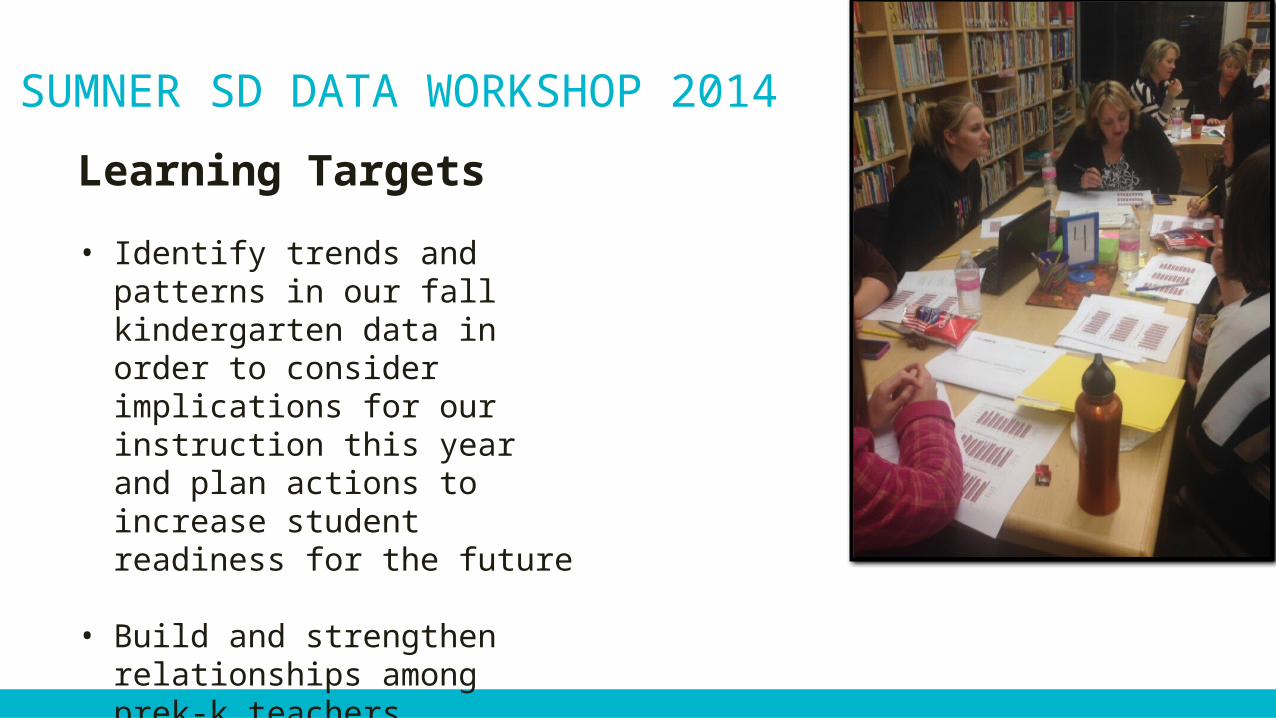
SUMNER SD DATA WORKSHOP 2014
Learning Targets
• Identify trends and patterns in our fall kindergarten data in order to consider implications for our instruction this year and plan actions to increase student readiness for the future
• Build and strengthen relationships among prek-k teachers
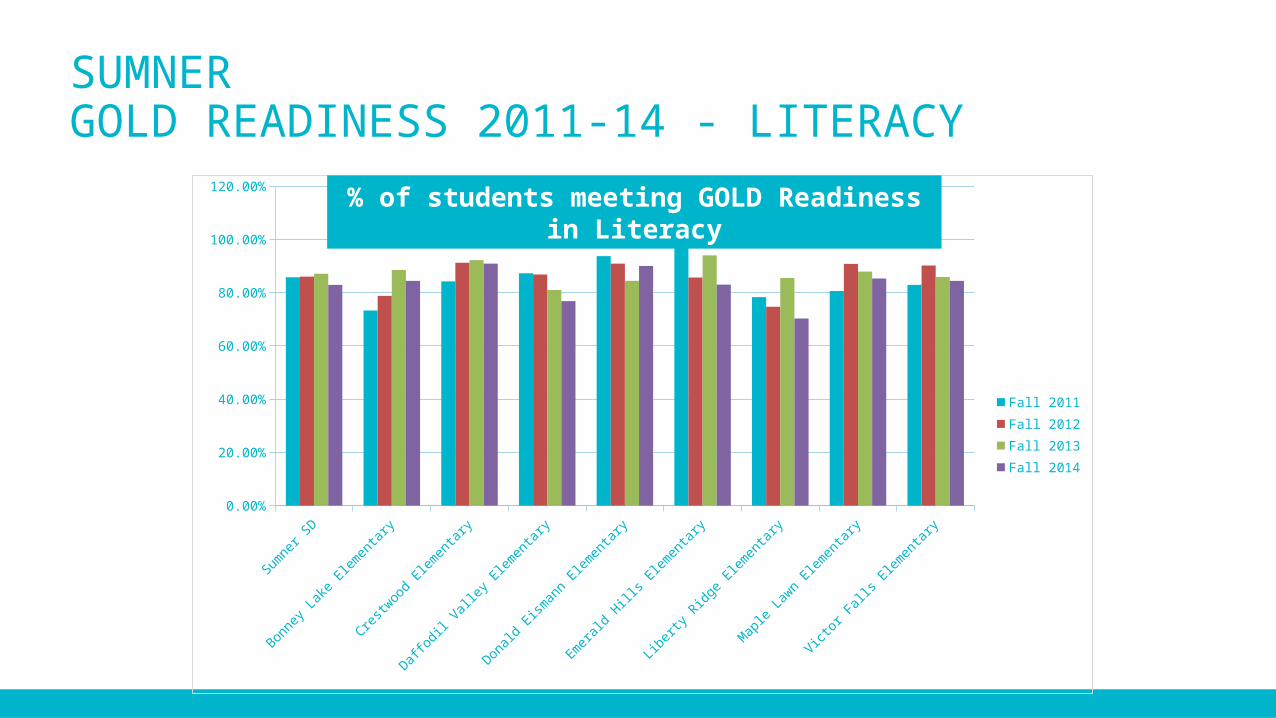
SUMNERGOLD READINESS 2011-14 - LITERACY
Sumner
SD
Bonney La
ke El
emen
tary
Crestw
ood Elem
entar
y
Daffodil V
alley
Elem
entar
y
Donald Ei
sman
n Elem
entar
y
Emera
ld Hills El
emen
tary
Libert
y Ridge
Elem
entar
y
Maple
Lawn El
emen
tary
Victor F
alls E
lemen
tary
0.00%
20.00%
40.00%
60.00%
80.00%
100.00%
120.00%
Fall 2011Fall 2012Fall 2013Fall 2014
% of students meeting GOLD Readiness in Literacy
Short Term Uses of WaKIDS Data
Natalie HanniP-3 Systems Coach, PSESD
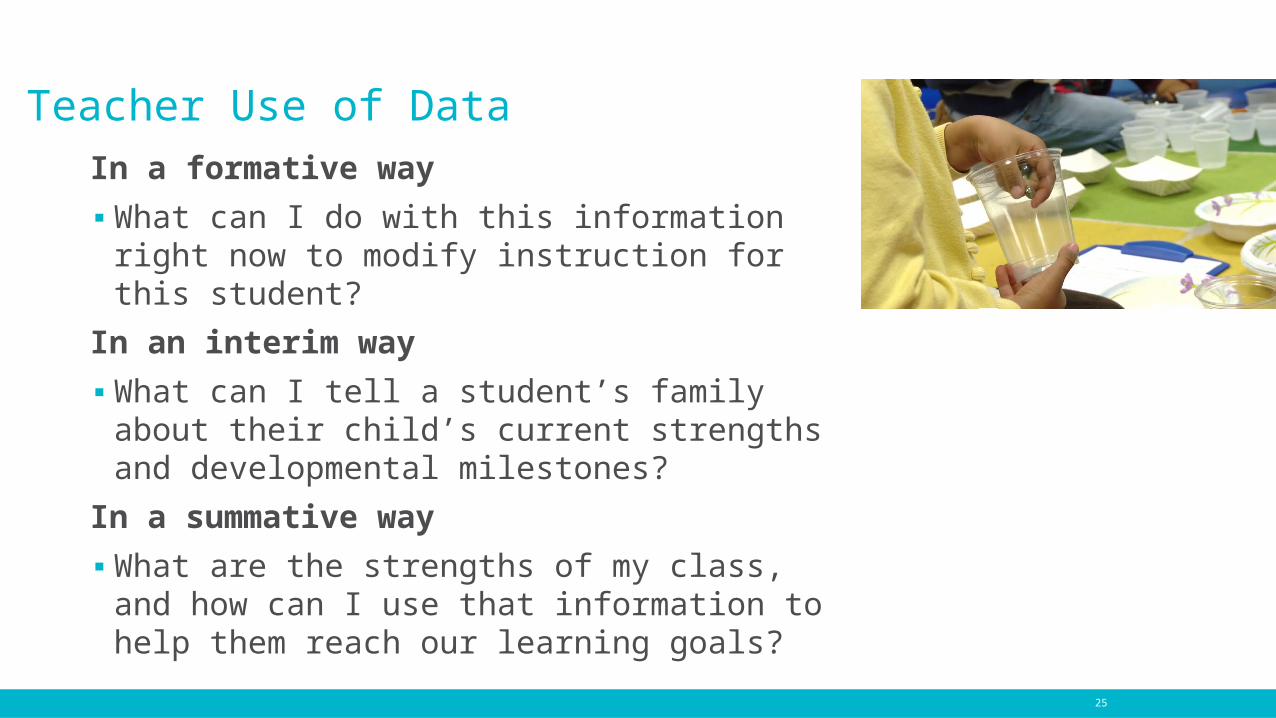
Teacher Use of DataIn a formative way
▪ What can I do with this information right now to modify instruction for this student?
In an interim way
▪ What can I tell a student’s family about their child’s current strengths and developmental milestones?
In a summative way
▪ What are the strengths of my class, and how can I use that information to help them reach our learning goals?
25
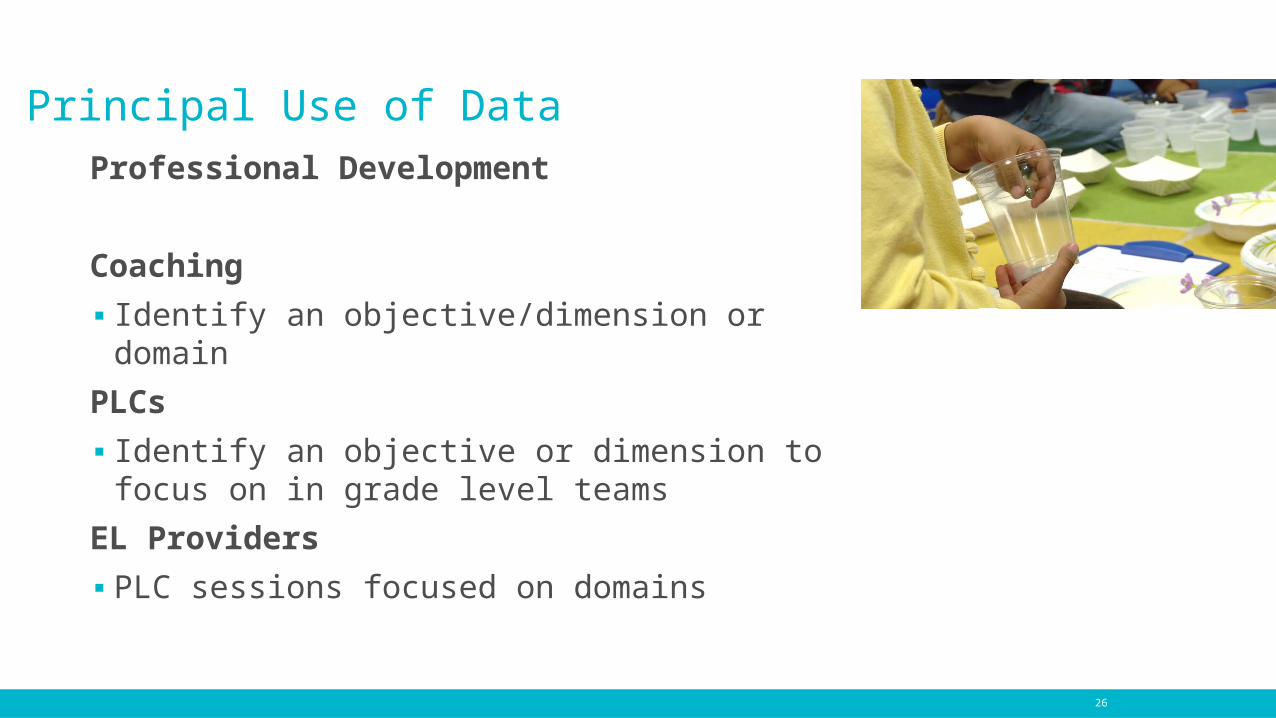
Principal Use of DataProfessional Development
Coaching
▪ Identify an objective/dimension or domain
PLCs
▪ Identify an objective or dimension to focus on in grade level teams
EL Providers
▪ PLC sessions focused on domains
26
Reports Overview
Nubia LopezProject Manager, Early Learning
28
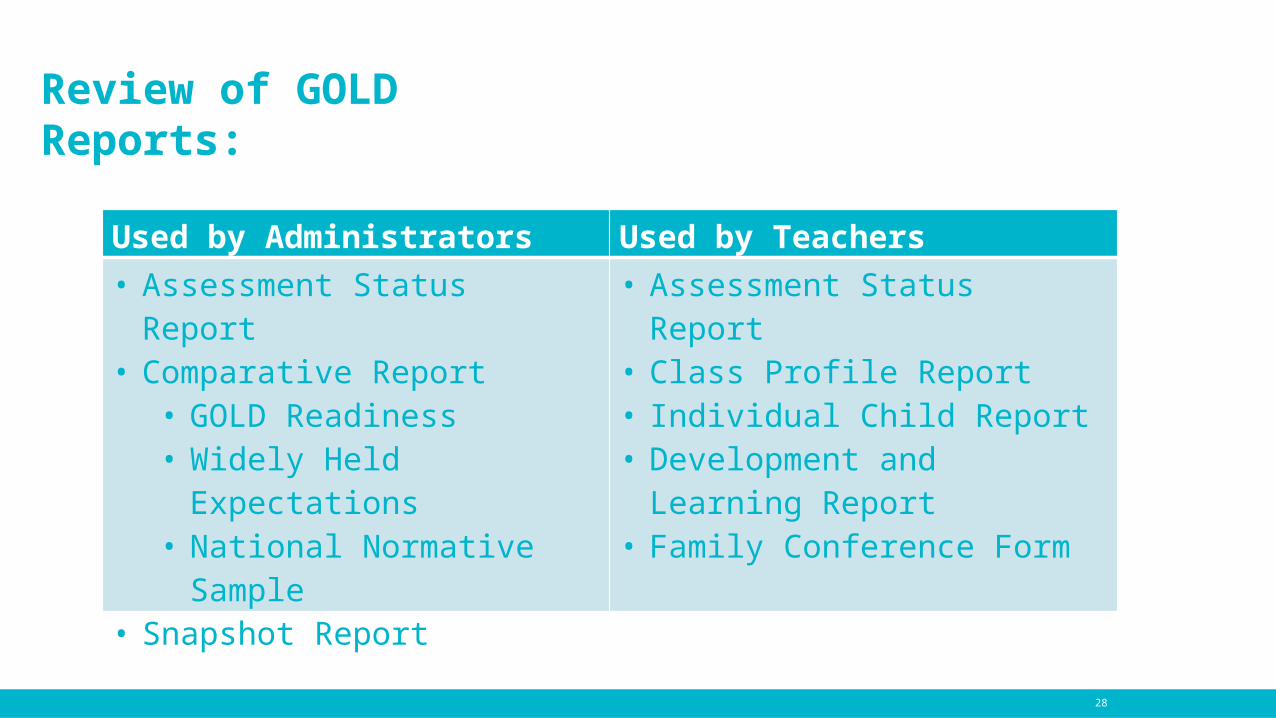
Review of GOLD Reports:
Used by Administrators Used by Teachers
• Assessment Status Report• Comparative Report
• GOLD Readiness • Widely Held Expectations• National Normative Sample
• Snapshot Report
• Assessment Status Report• Class Profile Report• Individual Child Report• Development and Learning Report• Family Conference Form
29
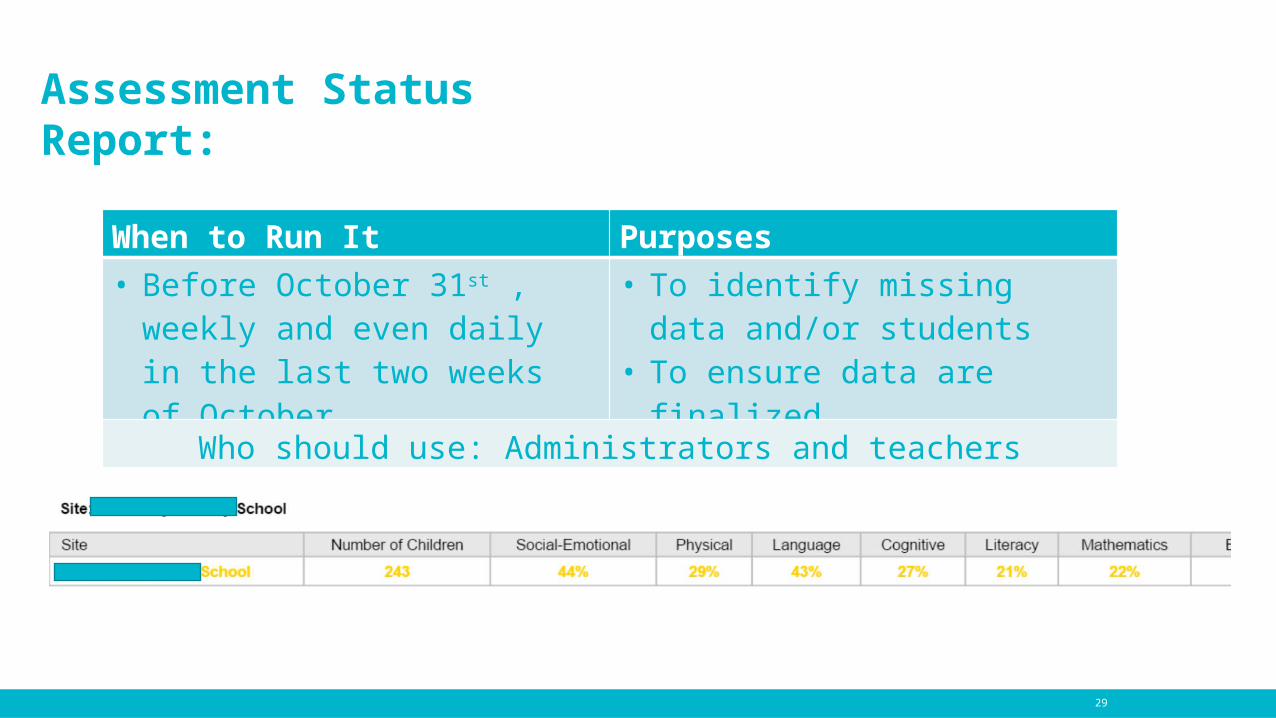
Assessment Status Report:
When to Run It Purposes
• Before October 31st , weekly and even daily in the last two weeks of October
• To identify missing data and/or students
• To ensure data are finalized
Who should use: Administrators and teachers
30
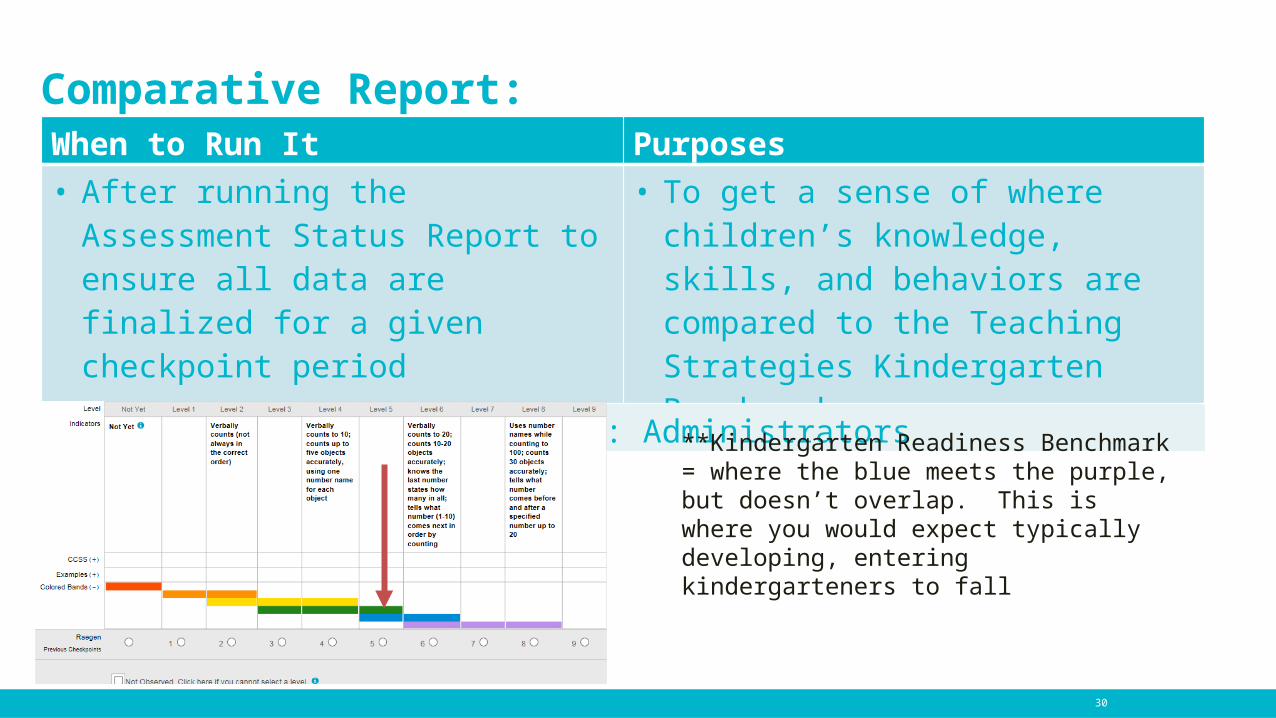
Comparative Report: When to Run It Purposes
• After running the Assessment Status Report to ensure all data are finalized for a given checkpoint period
• To get a sense of where children’s knowledge, skills, and behaviors are compared to the Teaching Strategies Kindergarten Benchmark
Who should use: Administrators
**Kindergarten Readiness Benchmark = where the blue meets the purple, but doesn’t overlap. This is where you would expect typically developing, entering kindergarteners to fall
31
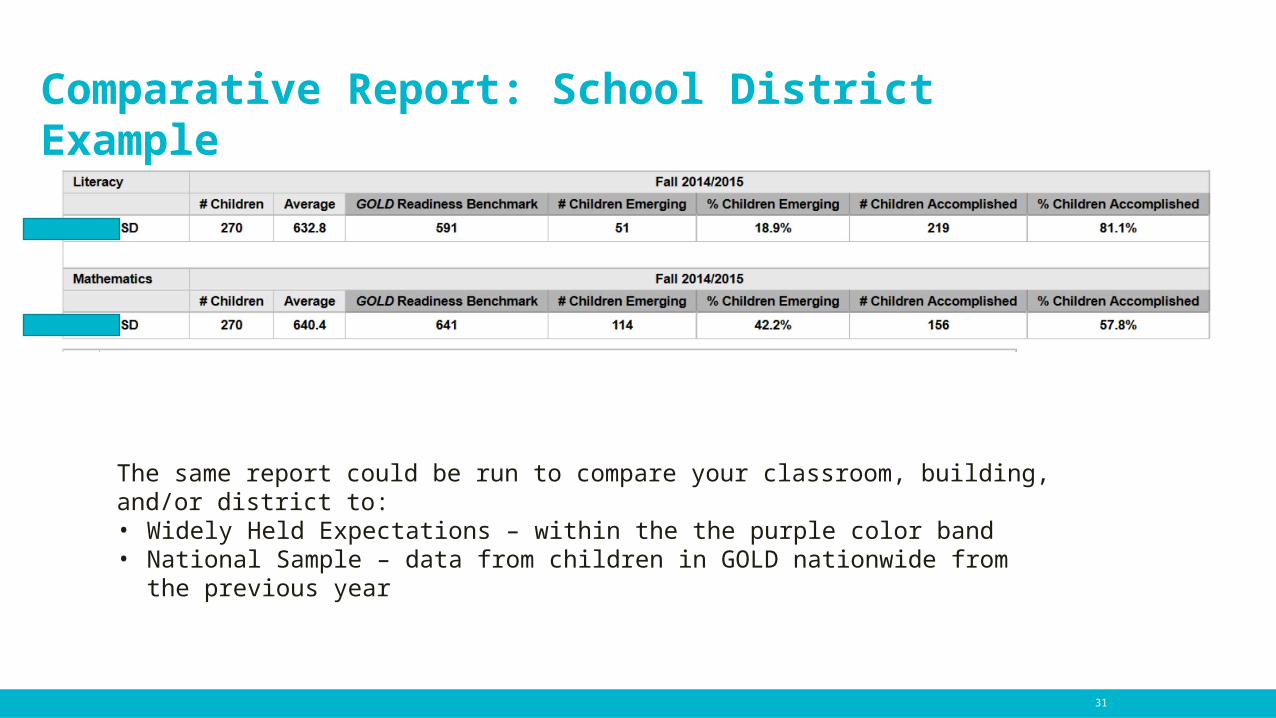
Comparative Report: School District Example
The same report could be run to compare your classroom, building, and/or district to:• Widely Held Expectations – within the the purple color band• National Sample – data from children in GOLD nationwide from the previous
year
32
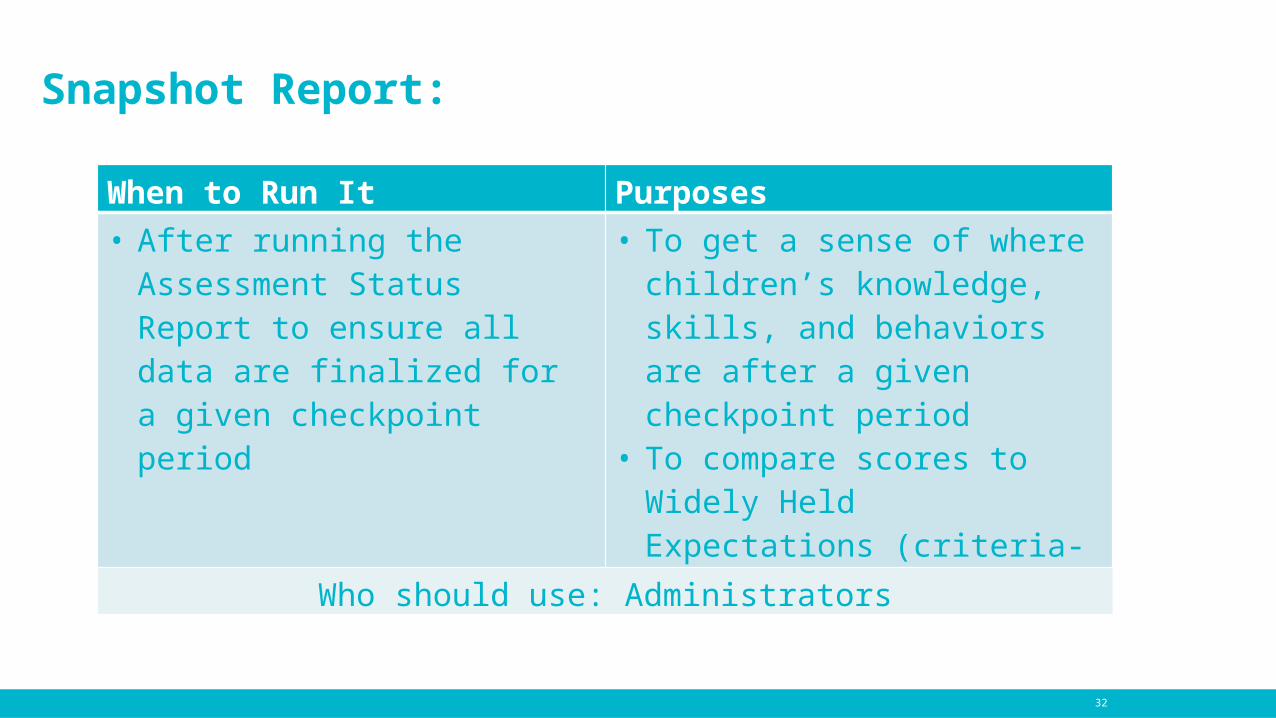
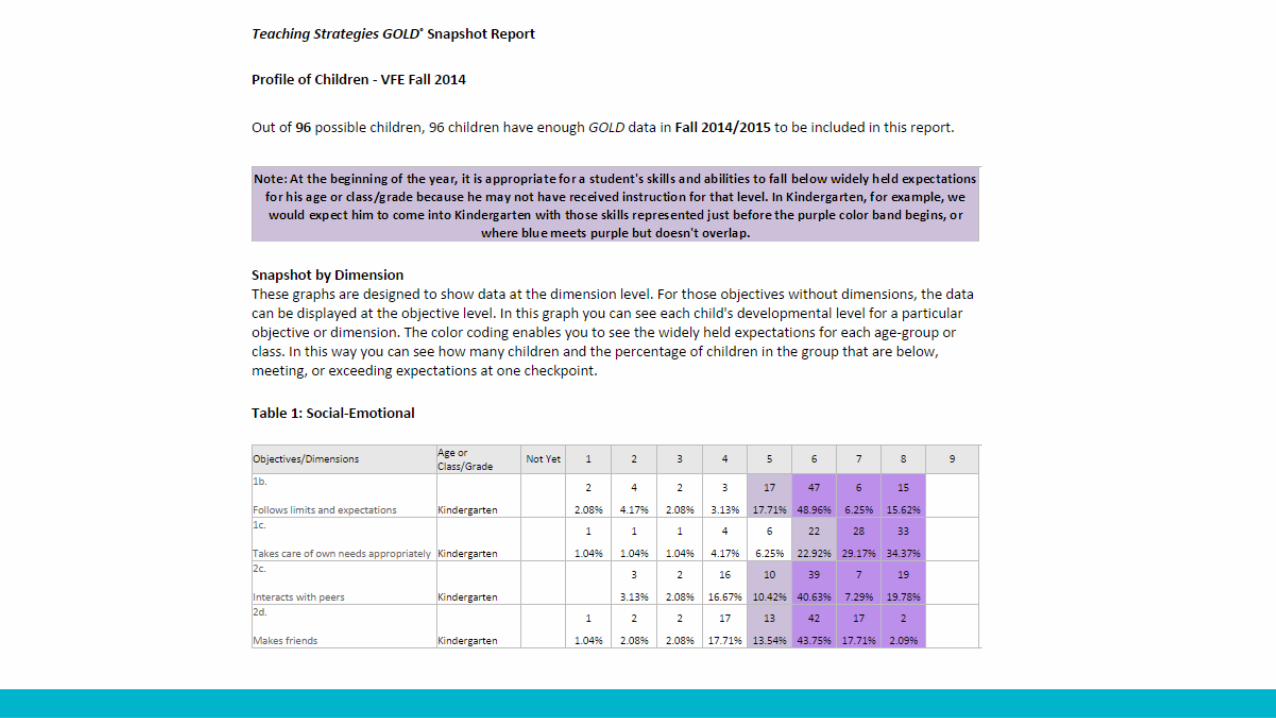
Snapshot Report:
When to Run It Purposes
• After running the Assessment Status Report to ensure all data are finalized for a given checkpoint period
• To get a sense of where children’s knowledge, skills, and behaviors are after a given checkpoint period
• To compare scores to Widely Held Expectations (criteria-referenced)
Who should use: Administrators
33
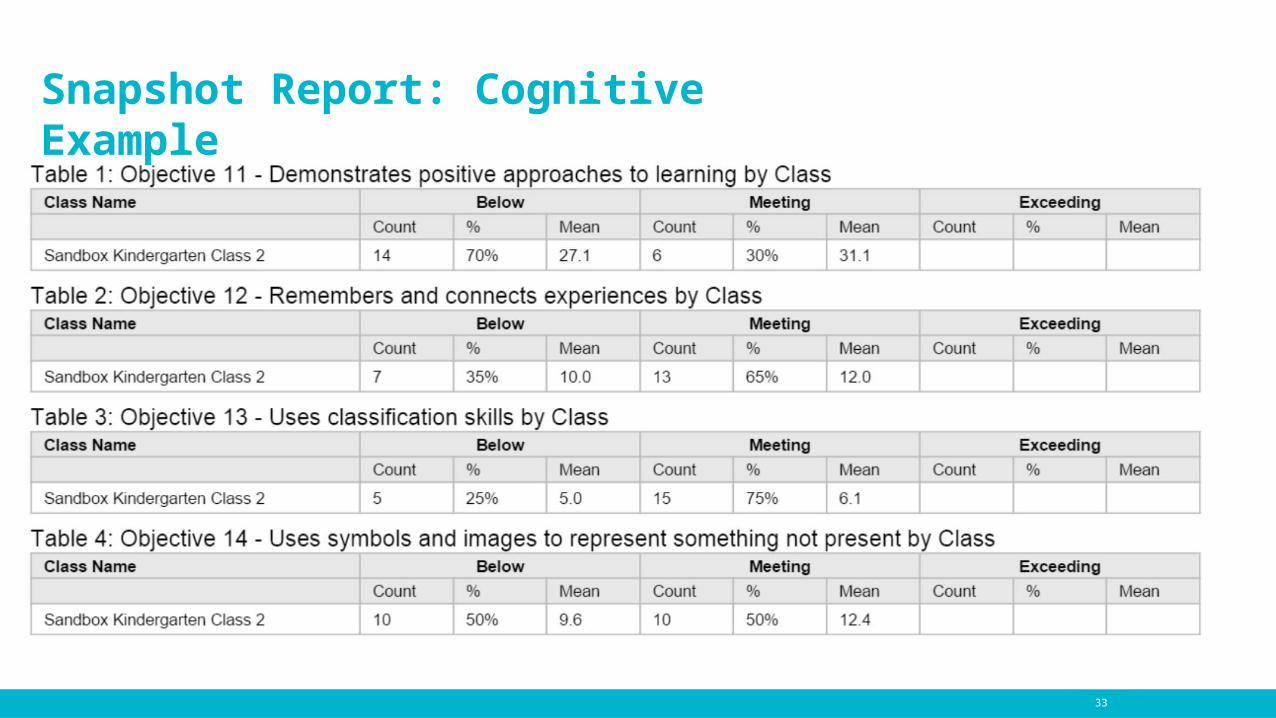
Snapshot Report: Cognitive Example
34
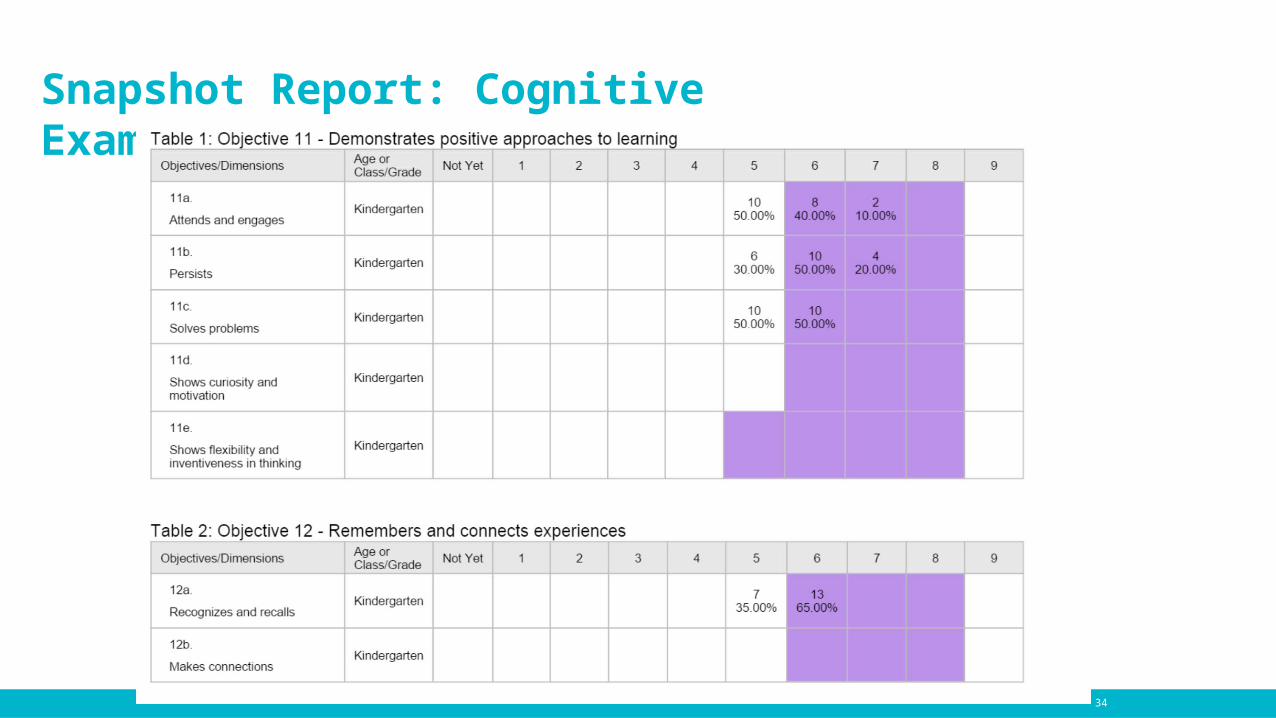
Snapshot Report: Cognitive Example
35
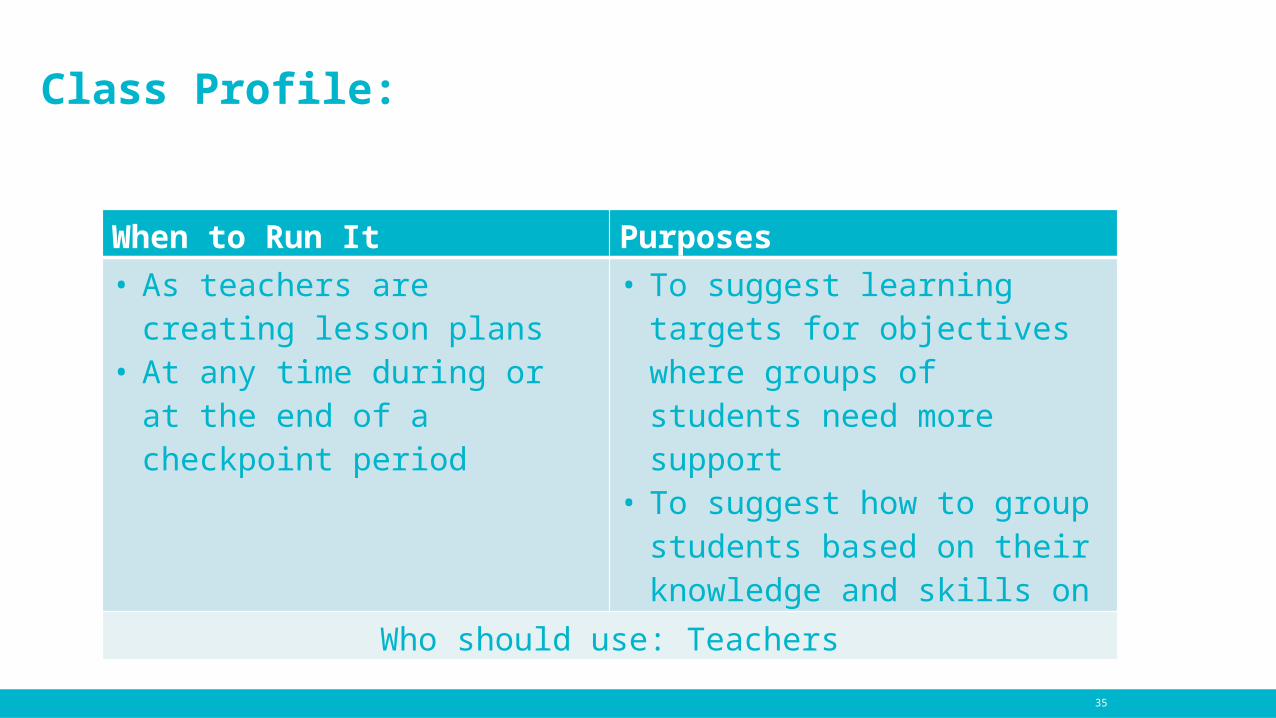
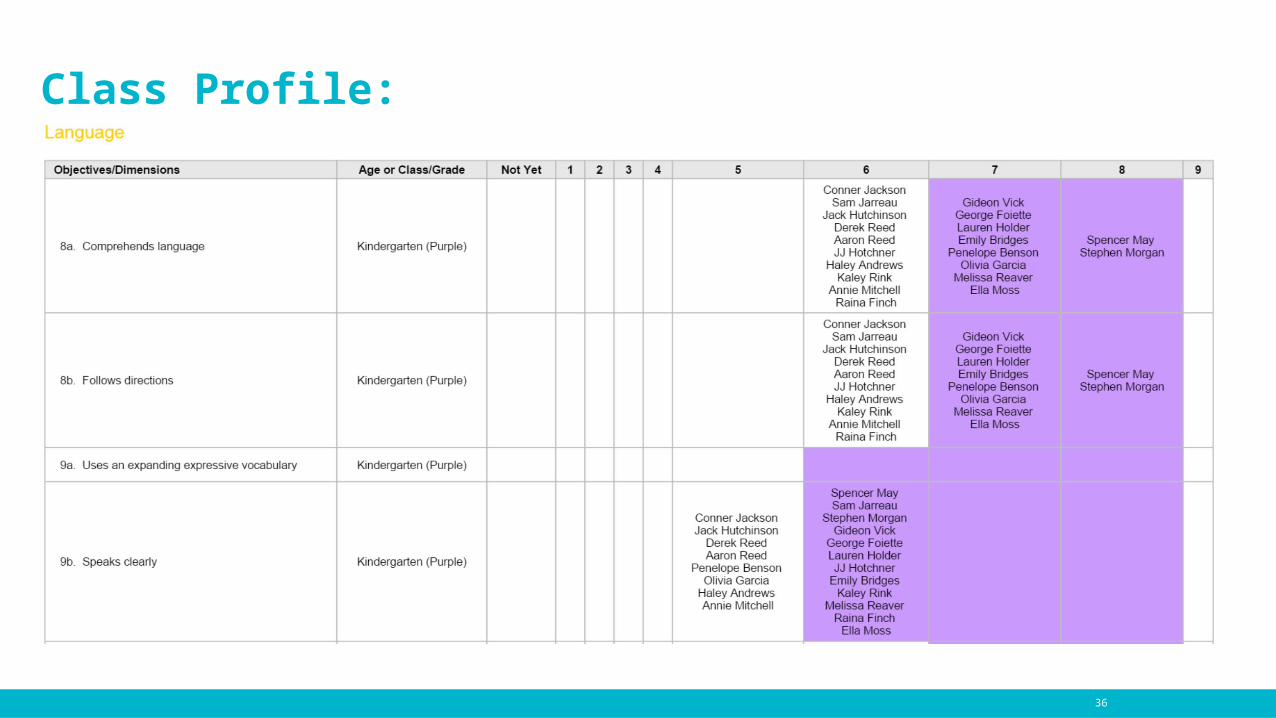
Class Profile:
When to Run It Purposes
• As teachers are creating lesson plans
• At any time during or at the end of a checkpoint period
• To suggest learning targets for objectives where groups of students need more support
• To suggest how to group students based on their knowledge and skills on a particular objective
Who should use: Teachers
36
Class Profile:
37
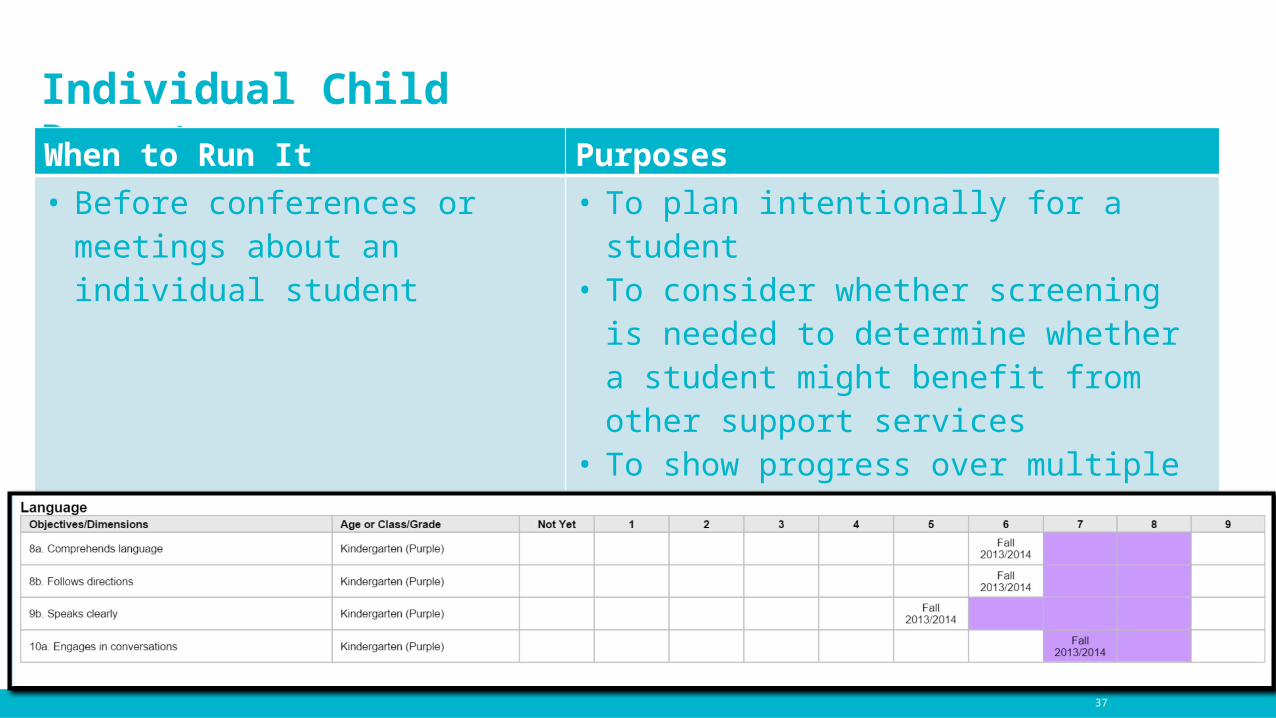
Individual Child Report: When to Run It Purposes
• Before conferences or meetings about an individual student
• To plan intentionally for a student• To consider whether screening is needed to
determine whether a student might benefit from other support services
• To show progress over multiple checkpoint periods
Who should use: Teachers
38
Development and Learning Report and Family Conference Form: When to Run It Purposes
• As teachers are creating lesson plans
• At any time during or at the end of a checkpoint period
• To share detailed information with families or administrators regarding a student’s current and next step of development and learning for a particular objective
• To identify activities helpful for advancing a student’s knowledge and skills related to a particular objective (Development and Learning)
• To discuss next steps for the student’s development and learning • To provide personalized examples of the student’s knowledge and skills
with a signature line to serve as an accountability measure (Family Conference Form)
Who should use: Teachers

39
Development and Learning Report and Family Conference Form:
In Practice:
Michelle Rahl-LewisEarly Learning Coordinator, Tacoma School
District
In Practice: Dabble Into WaKIDS
Alice HumphresEarly Learning Coordinator, Kent School
District
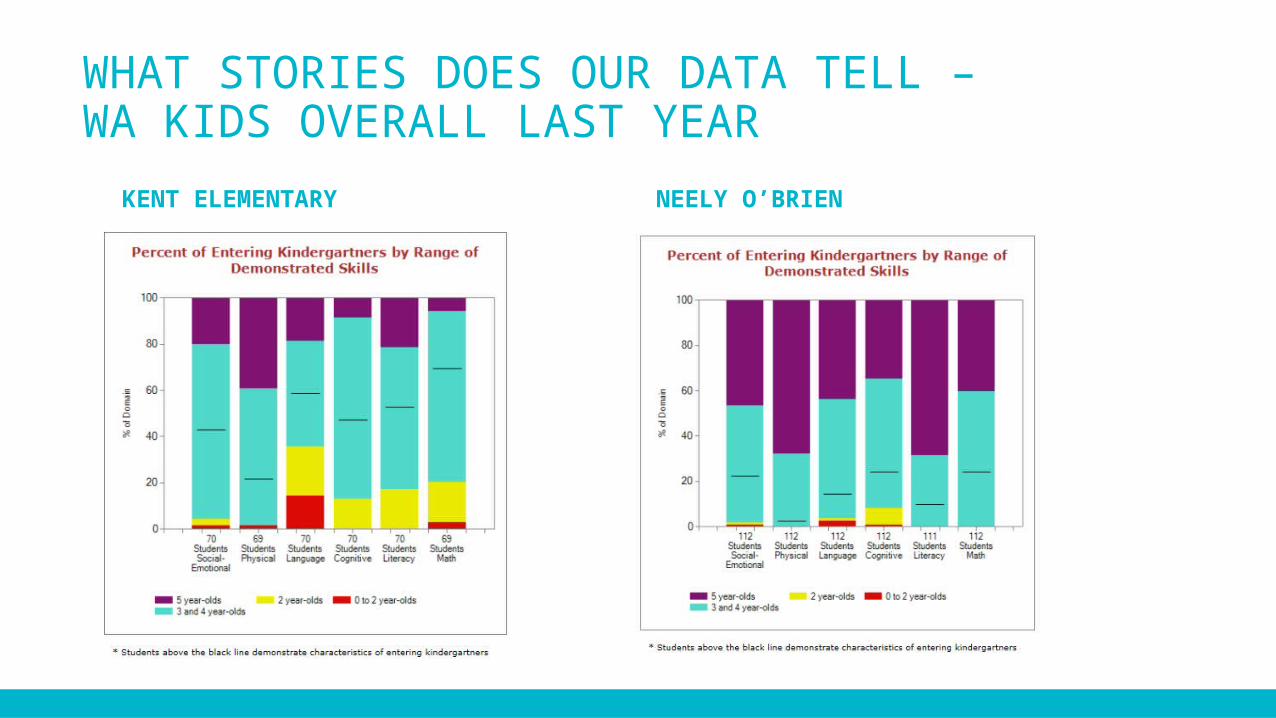
WHAT STORIES DOES OUR DATA TELL – WA KIDS OVERALL LAST YEAR
KENT ELEMENTARY NEELY O’BRIEN
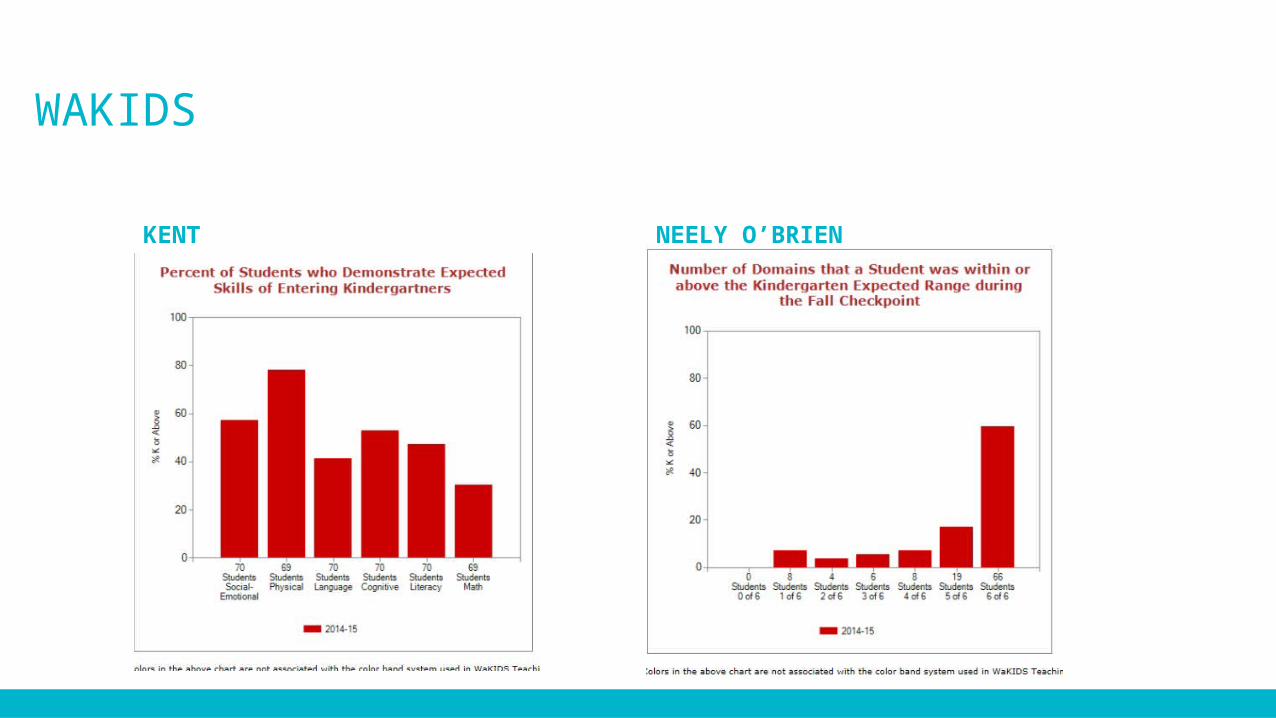
WAKIDS
KENT NEELY O’BRIEN
In Practice:
Kay GalloPrincipal, Sumner School District
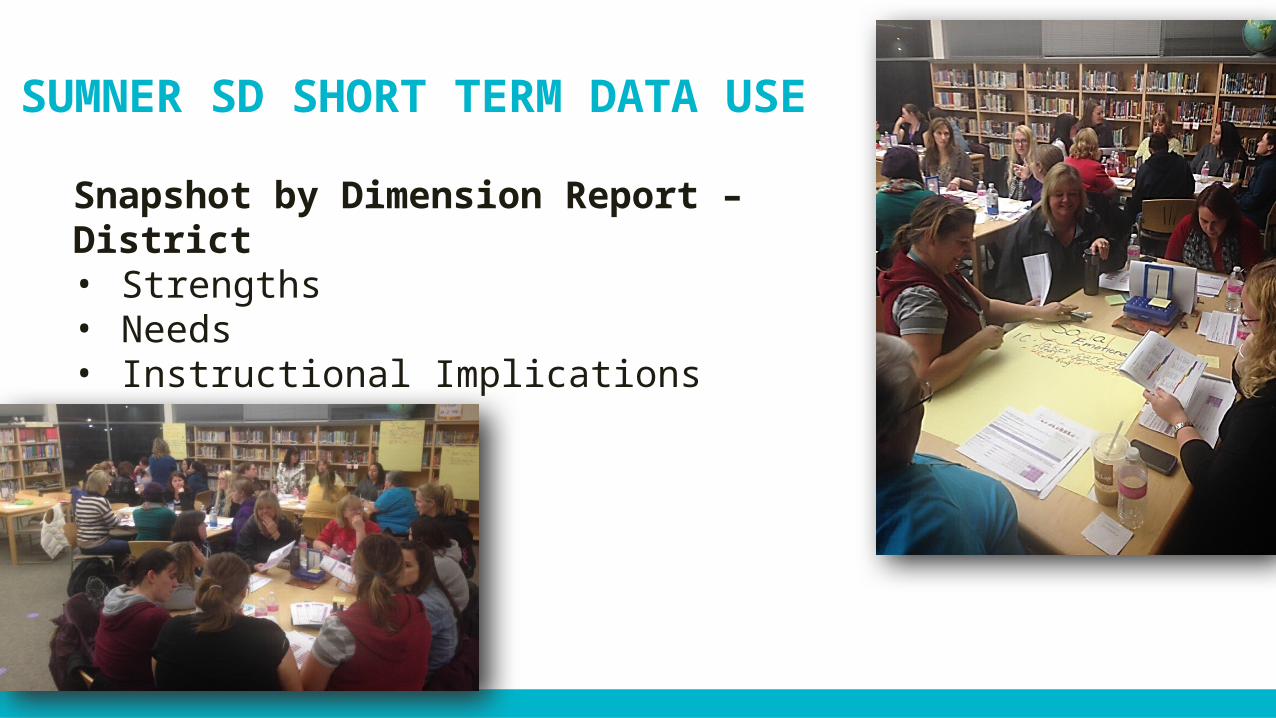
SUMNER SD SHORT TERM DATA USE
Snapshot by Dimension Report – District• Strengths• Needs• Instructional Implications
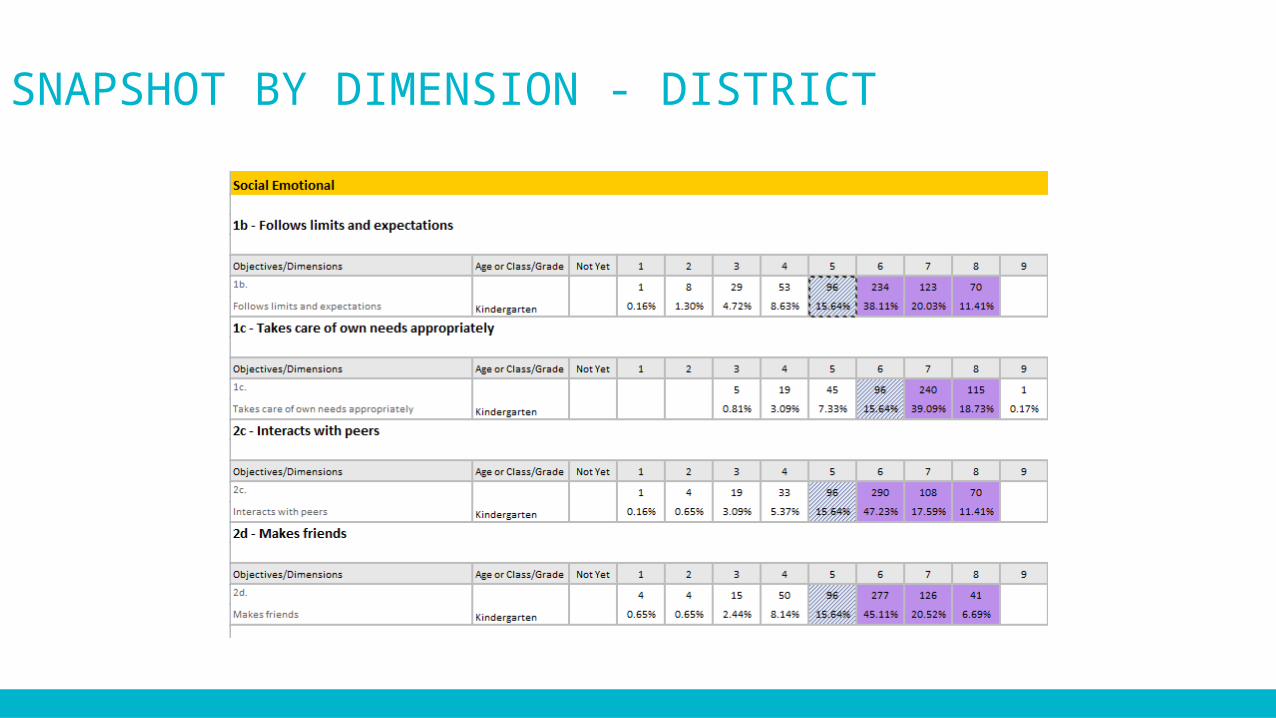
SNAPSHOT BY DIMENSION - DISTRICT
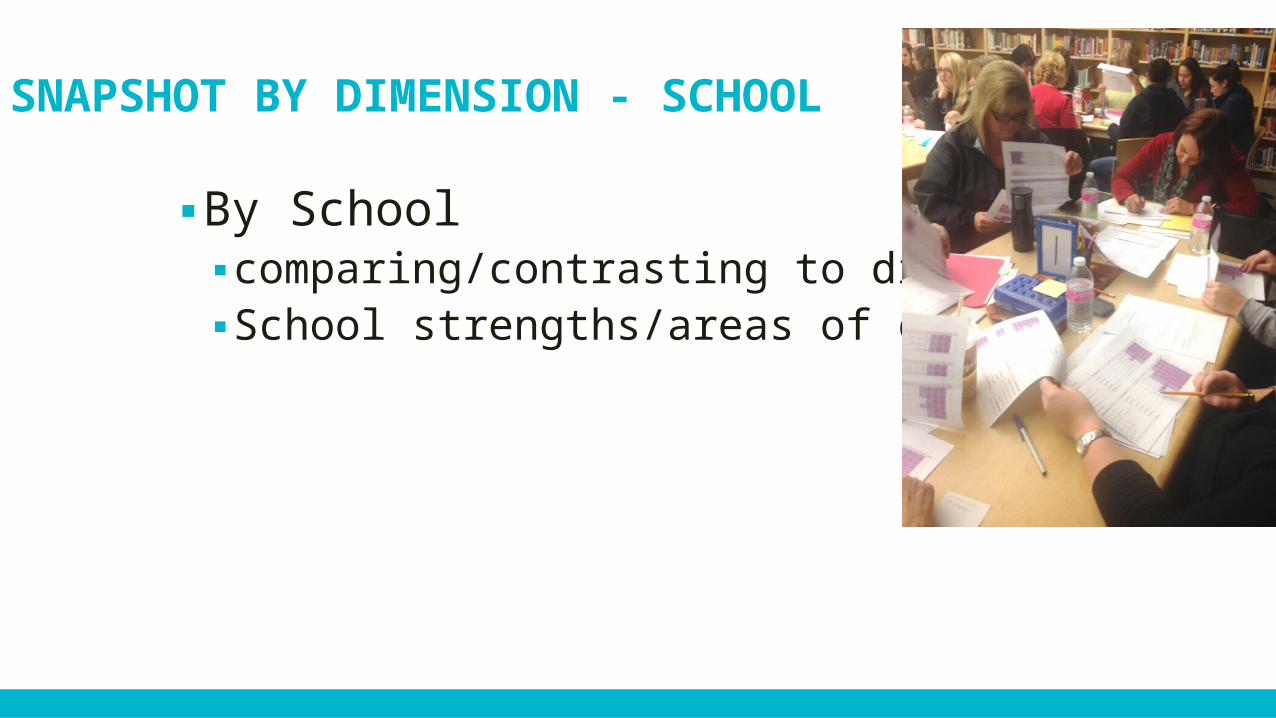
SNAPSHOT BY DIMENSION - SCHOOL
▪By School ▪ comparing/contrasting to district▪ School strengths/areas of concern
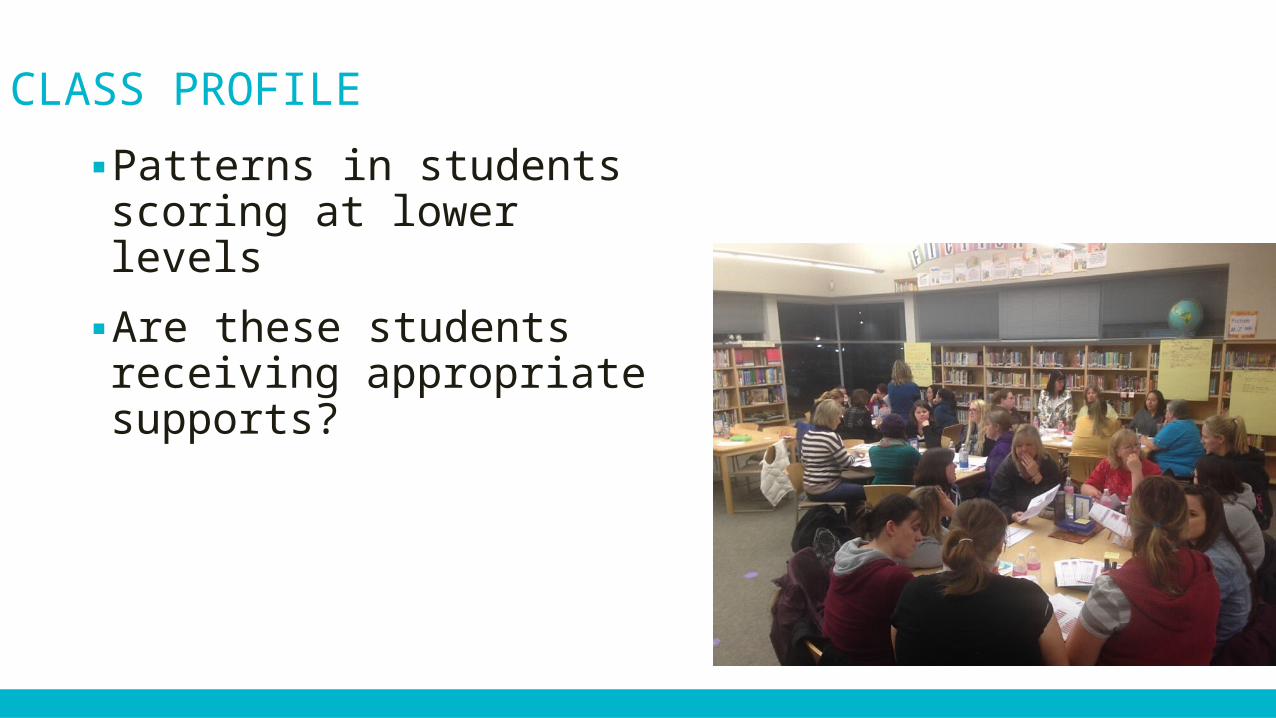
CLASS PROFILE
▪ Patterns in students scoring at lower levels
▪ Are these students receiving appropriate supports?
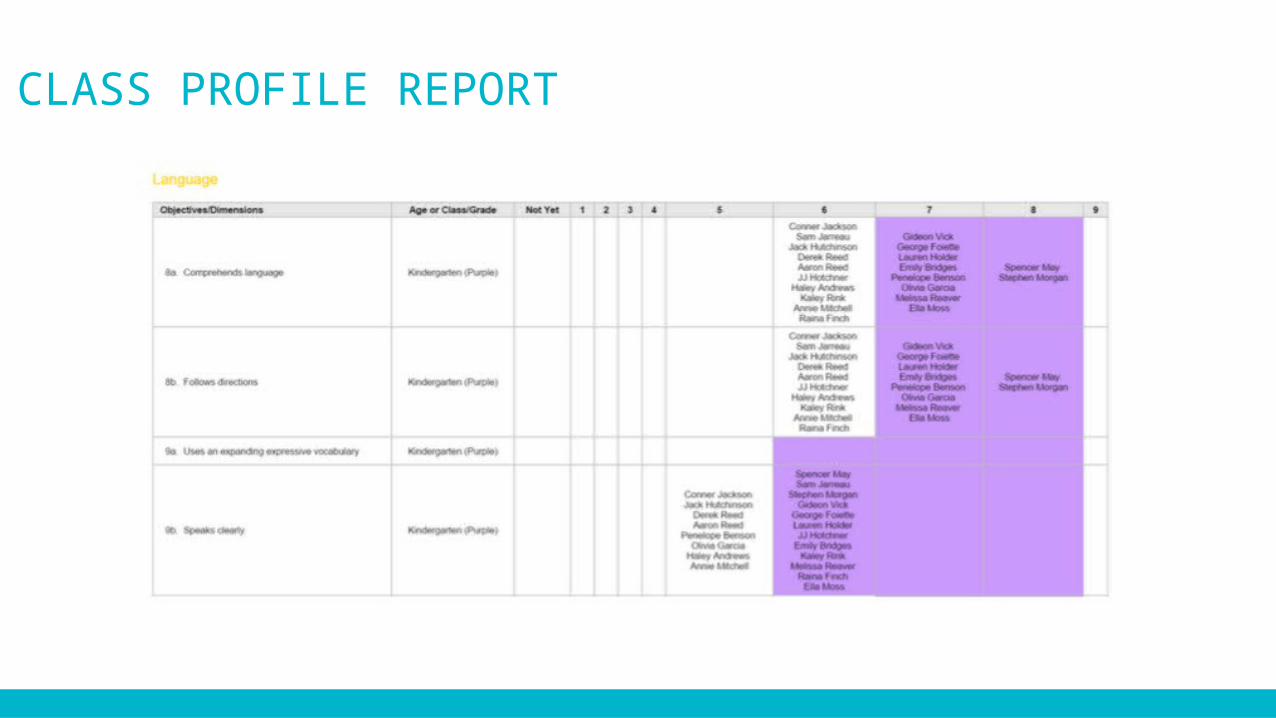
CLASS PROFILE REPORT
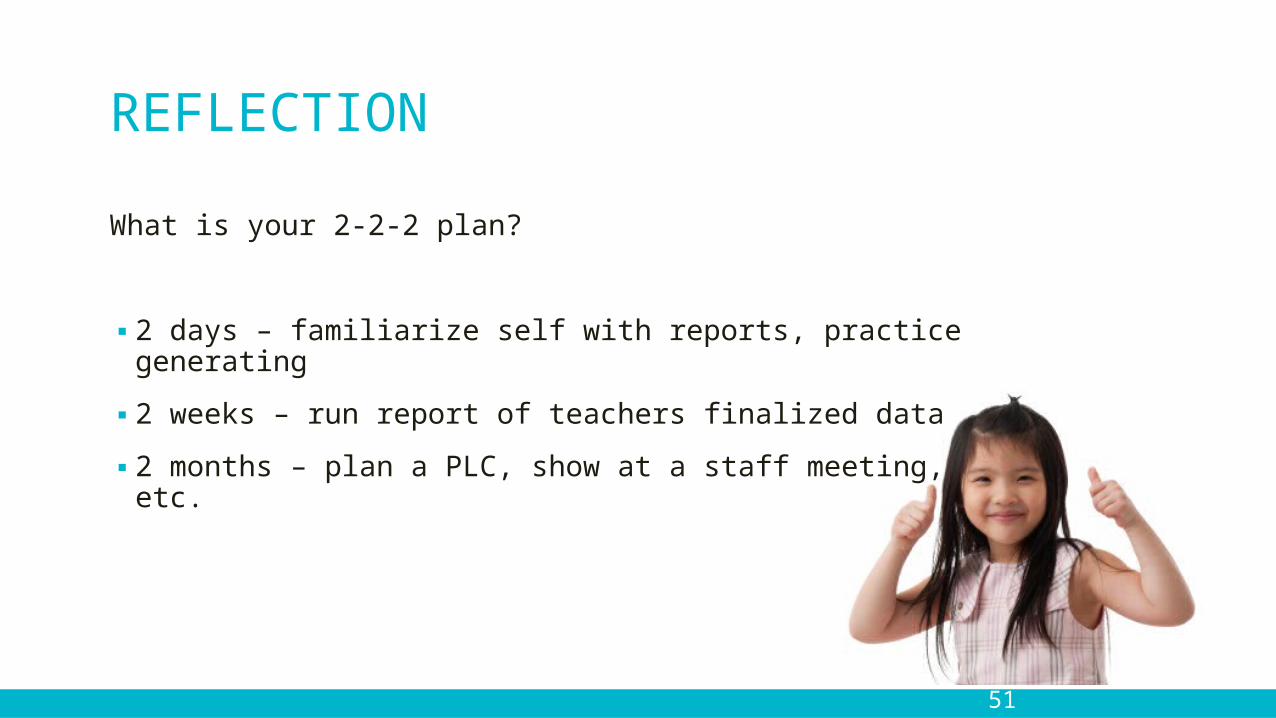
REFLECTION
What is your 2-2-2 plan?
▪ 2 days – familiarize self with reports, practice generating
▪ 2 weeks – run report of teachers finalized data
▪ 2 months – plan a PLC, show at a staff meeting, etc.
51
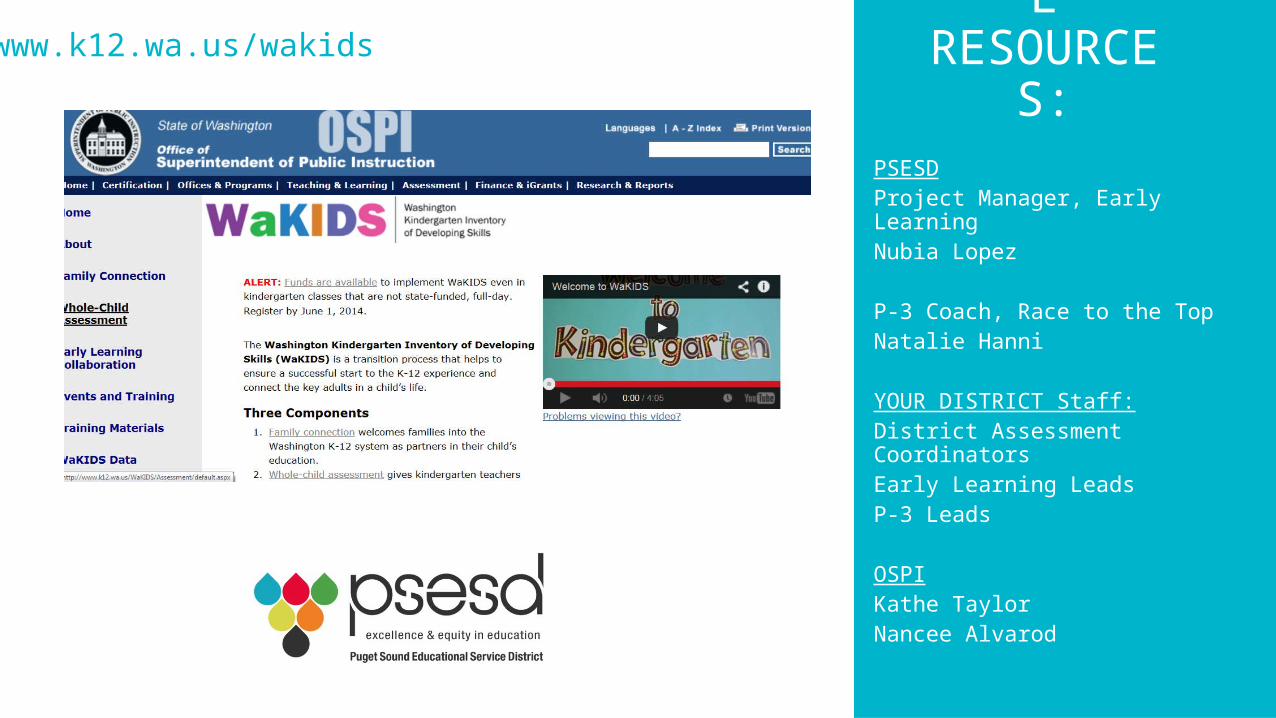
AVAILABLE
RESOURCES:
PSESDProject Manager, Early Learning Nubia Lopez
P-3 Coach, Race to the Top Natalie Hanni
YOUR DISTRICT Staff:District Assessment CoordinatorsEarly Learning LeadsP-3 Leads
OSPIKathe TaylorNancee Alvarod
www.k12.wa.us/wakids