Embed Size (px)
Citation preview

ContentsAbbreviations ...............................................................................................4
Acknowledgements........................................................................................5
Introduction ...............................................................................................6
What is Footprints in Time?............................................................................7Objective of the study................................................................................................7Who is involved?........................................................................................................7Funding ........................................................................................................8Ethics ........................................................................................................8Survey Methodology..................................................................................................9Footprints in Time sample selection........................................................................11Footprints in Time study sites..................................................................................12Study development and testing...............................................................................13Study informants.....................................................................................................14
Data collection.............................................................................................16Consent process ......................................................................................................16Fieldwork periods.....................................................................................................16Fieldwork Response.................................................................................................17
New entrants..................................................................................................17Interview length ......................................................................................................18
Questionnaire content overview...................................................................19
Using the datasets.......................................................................................22Locating variables....................................................................................................22Variable Naming Convention...................................................................................22Identifiers ......................................................................................................23Cohort ......................................................................................................23Geographic variables...............................................................................................23Household Form ......................................................................................................23Direct assessments of child development................................................................24
Who Am I? ......................................................................................................24Renfrew Word Finding Vocabulary Test..........................................................24PAT-R – Progressive Achievement Tests in Reading........................................25Matrix reasoning.............................................................................................26Child height and weight..................................................................................26
Scales ......................................................................................................27Temperament.................................................................................................27Brief Infant-Toddler Social and Emotional Assessment (BITSEA).....................28Strengths and Difficulties Questionnaire (SDQ)...............................................29
Qualitative data ......................................................................................................30Other - specify responses........................................................................................30Missing data coding.................................................................................................31Merging datasets.....................................................................................................31Confidentialisation...................................................................................................31Data access ......................................................................................................32
Data linkage – the Australian Early Development Index (AEDI)........................33About the AEDI ......................................................................................................33
National implementation.................................................................................34

Confidentialisation..........................................................................................34List of AEDI variables......................................................................................36
Getting more information.............................................................................39
References .............................................................................................40
Appendix A .............................................................................................42Data dictionary ......................................................................................................42
Appendix B .............................................................................................43Qualitative free text questions/variable labels.........................................................43
Appendix C .............................................................................................48Examples of merging in Stata..................................................................................48

ABBREVIATIONSABS – Australian Bureau of Statistics
AEDI – Australian Early Development Index
ARIA - Accessibility/Remoteness Index of Australia
ATSI – Aboriginal and Torres Strait Islander
BMI – Body Mass Index
CAPI – Computer Assisted Personal Interview
FaHCSIA – Department of Families, Housing, Community Services and Indigenous Affairs
ERP – Estimated Resident Population
ESL – English as a Second Language
HILDA – Household, Income and Labour Dynamics in Australia Survey
HREC – Human Research Ethics Committee
ICC – Indigenous Coordination Centre
LBOTE – Language Background Other Than English
LORI – Levels of Relative Isolation
LSAC – Longitudinal Study of Australian Children
LSAG – Longitudinal Studies Advisory Group
LSIC – Longitudinal Study of Indigenous Children (also known as Footprints in Time)
P1 – Parent 1
P2 – Parent 2
PAT-R – Progressive Achievement Tests in Reading
PLE – Parent Living Elsewhere
RAO - Research Administration Officer
SC – Study Child
SDQ – Strengths and Difficulties Questionnaire
TC – Teacher/carer
WHO – World Health Organization
WISC-IV – Wechsler Intelligence Scale for Children (4th edition)

ACKNOWLEDGEMENTSFootprints in Time—the Longitudinal Study of Indigenous Children (LSIC) was initiated and is funded by the Australian Government Department of Families, Housing, Community Services and Indigenous Affairs (FaHCSIA).
The study would never have been possible without the support and trust of the Aboriginal and Torres Strait Islander families who open their doors to the researchers and generously give their time to talk openly about their lives. Our gratitude goes to them, and to the leaders and Elders of their communities who are active guardians of their people’s wellbeing.
The study brings together people committed to making a positive difference in the lives of Aboriginal and Torres Strait Islander children.

INTRODUCTIONThe purpose of this document is to provide a comprehensive reference for data users of Footprints in Time, the Longitudinal Study of Indigenous Children (LSIC).
This document aims to provide what the data users need to know to use the LSIC datasets– such as the background to the Study, sample selection, study sites, research design, study development and testing, consent processes, questionnaire design and piloting, file structures, variable naming conventions and missing data coding.
Other useful documentation for data users are the mark up questionnaires and the Data Dictionary.
The Data User Guide, mark up questionnaires and Data Dictionary are available on the Study website, <http://www.fahcsia.gov.au/lsic>
We welcome any feedback you have about this Data User Guide. If there is something that you expected to find in this manual and didn’t, or if you had difficulty understanding any section, please let us know by emailing [email protected].

WHAT IS FOOTPRINTS IN TIME?Footprints in Time is the name given to the Longitudinal Study of Indigenous Children (LSIC). Footprints in Time aims to improve the understanding of, and policy response to, the diverse circumstances faced by Aboriginal and Torres Strait Islander children, their families and communities. The study provides a data resource that can be drawn on by all levels of government, researchers, service providers, parents and communities.
The study collects important information about the lives of Aboriginal and Torres Strait Islander children, covering areas including:
the children—their physical and mental health, how they develop socially and cognitively, their place in their family and community, and significant events in their life;
the children’s families—their health, work, lifestyle, and family and community connectedness;
the children’s communities—facilities, services, and social and community issues;
services—child care, education, health and other services used by the child’s family.
Objective of the studyThe main objective of the study is to provide high quality data that can be used to provide a better insight into how a child’s early years affect their development. It is hoped that this information can be drawn upon to help close the gap in life circumstances between Indigenous and non-Indigenous Australians.
Footprints in Time has four key research questions, formulated under the guidance of the Steering Committee, which were designed to achieve this objective. These are:
What do Aboriginal and Torres Strait Islander children need to have the best start in life to grow up strong?
What helps Aboriginal and Torres Strait Islander children to stay on track or get them to become healthier, more positive and strong?
How are Aboriginal and Torres Strait Islander children raised?
What is the importance of family, extended family and community in the early years of life and when growing up?
Also of interest is the role that service use and support plays in the lives of Aboriginal and Torres Strait Islander children:
How can services and other types of support make a difference to the lives of Aboriginal and Torres Strait Islander children?
Who is involved?Footprints in Time is funded by the Australian Government and managed by FaHCSIA.

The LSIC Steering Committee has been chaired by Professor Mick Dodson since 2003. The Steering Committee oversees the design, development and implementation of the study. Its members are drawn from academic and community backgrounds, covering a wide range of disciplines such as health and education. Subcommittees of the Steering Committee are formed to deal with particular issues as required.
Strategic guidance and leadership on future content, operation and analysis of Footprints in Time is also provided by the Longitudinal Studies Advisory Group (LSAG). The primary objective of the LSAG is to provide advice to the Longitudinal Study for Australian Children (LSAC), Footprints in Time (LSIC) and the Household, Income and Labour Dynamics in Australia (HILDA) studies and thereby assist in maximising their strategic importance to the Australian Government.
Footprints in Time interviews are conducted primarily by FaHCSIA employed Aboriginal and Torres Strait Islander Research Administration Officers (RAOs).
Roy Morgan Research was contracted for Waves 1 to 4 of the study to produce the data collection instruments according to FaHCSIA design, assist in the management of pilot and live fieldwork, capture and compile survey data and report on fieldwork procedures, as well as response and non-response patterns.
FaHCSIA’s LSIC section manages the project from the National Office.
FundingThe 2003–04 Federal Budget provided the initial resources for the Footprints in Time study. The first phase, from September 2003 to June 2004, involved extensive consultation with Indigenous peoples and communities about the study. The design and development of the study commenced in December 2005, with pilot testing continuing through 2006 and 2007.
LSIC received funding in the 2007-08 budgets for Waves 1-4 of the study. The study is now classified as an ongoing measure and will continue as long as the sample retention enables the study to remain viable.
EthicsEthical clearance for the study has been obtained from the Australian Government Department of Health and Ageing Departmental Ethics Committee which has been chosen as the primary Human Research Ethics Committee (HREC) for the study.
In addition state/territory and/or regional ethics clearance and support was obtained for Footprints in Time sites through state and territory HRECs or their equivalents (in accordance with the National Health and Medical Research Council, 2003 and Australian Institute of Aboriginal and Torres Strait Islander Studies guidelines). State and Territory departments of education and Catholic dioceses are also consulted to gain permission and support for pre-school and school teachers to complete questionnaires about the children involved in the study. State and Territory departments managing out-of-home care were also consulted.

Survey MethodologyFootprints in Time employs an accelerated cross-sequential design, involving two cohorts of Indigenous children aged from 6 months to 2 years (Baby cohort, or B cohort) and from 3 years 6 months to 5 years (Child cohort, or K cohort) in Wave 1. The design allows the data covering the first nine or ten years of Aboriginal and Torres Strait Islander children’s lives to be collected in six years.
Aboriginal and Torres Strait Islander children born between December 2003 and November 2004 (Child cohort) or between December 2006 and November 2007 (Baby cohort) are the sample units in the study. The majority of families in the study were recruited using addresses provided by Centrelink and Medicare Australia. Other informal means of contact such as word of mouth, local knowledge and study promotion were also used to supplement the number of children in the study. In practice, the Child cohort consists of children born in 2003, 2004 and 2005 and the Baby cohort consists of children born in 2006, 2007 and 2008. Table 1 shows the ages of each cohort throughout the study.
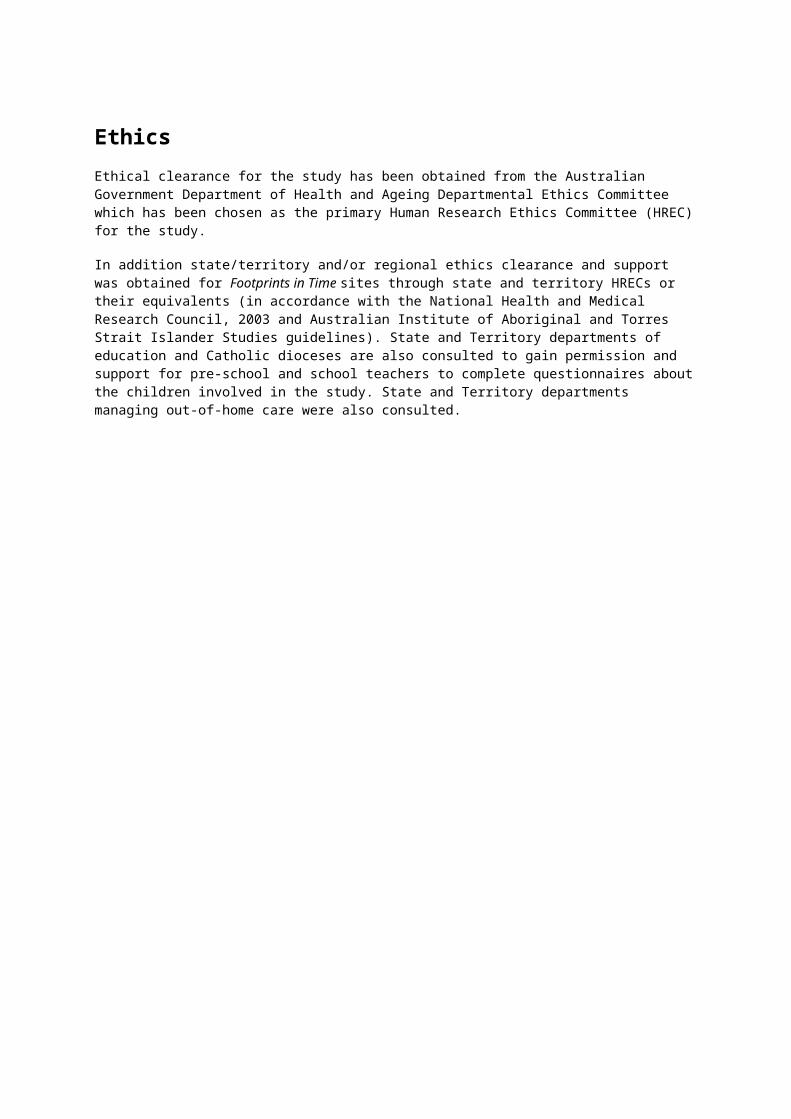
Table 1:Ages of each cohort throughout the study
Year 2004 2005 2006 2007 2008 2009 2010 2011 2012 2013 2014 2015 2016
Wave 1 2 3 4 5 6 7 8 9
Baby(B) cohort age
(years)Born ½-2 1½-3 2½-4 3½-5 4½-6 5½-7 6½-8 7½-10 8½-11
Child(K) cohort age
(years)Born 3½- 5 4½- 6 5½- 7 6½- 8 7½-9 8½-10 9½-11 10½-12 11½-13
LSIC Data User Guide – January 2013 10
Footprints in Time sample selectionFootprints in Time uses a non-random purposive sampling design from which eligible families were approached and voluntary consent obtained. The study focuses on eleven sites chosen, in part, to cover the range of socioeconomic and community environments where Aboriginal and Torres Strait Islander children live. Agreement and approval to participate in the study was sought from communities and Elders in these sites before research within the communities began.
The Footprints in Time sites were chosen to:
ensure approximately equal representation of urban, regional and remote areas, thus enabling some geographical comparison
represent the concentration of Aboriginal and Torres Strait Islander people around Australia
contain a substantial Aboriginal and Torres Strait Islander population in the core and surrounding areas
include locations engaged in the pilot of the study where existing relationships could be built upon
be located near an Indigenous Coordination Centre (ICC), if possible, where Research Administration Officers (RAOs) could be based.
Footprints in Time was designed to select approximately 150 children in each site, providing a sample of up to 1,650 children. This number represents 5-10% of Aboriginal and Torres Strait Islander children of the appropriate ages. As such, most interviewers were required to find a large proportion of the total number of children in each birth cohort and these children were spread across a wide geographical area, usually within a predominantly non-Indigenous population. An exception to this were remote areas where the proportion of Aboriginal and Torres Strait Islander people was high but the population numbers, particularly within the targeted age ranges, were low. Due to difficulties in sample recruitment related to small resident populations and geographic spread, for some sites it was not possible to find sufficient numbers of children to meet the study’s targets. In other sites the number of eligible children was in excess of the required sample.
The same families who were interviewed in Wave 1 were approached again for interviews in subsequent waves. However, a proportion of families could not be interviewed again because they could not be located, had moved substantial distances, refused interviews, or could not be interviewed for other reasons. However, the reduction in the number of study children was partially offset in Wave 2 by recruiting 88 additional children from the eleven sites into the sample. These children were from families who had either missed out on or refused to participate in Wave 1 but were available and willing to participate in Wave 2 and potentially for subsequent waves.
Footprints in Time study sitesThe LSIC sample is not nationally representative; however it reflects fairly well the distribution of Aboriginal and Torres Strait Islander children aged between 0 and 5 years in the states and territories and among urban, regional and remote areas. Following are the selected study sites:
LSIC Data User Guide – January 2013 11

New South Wales (NSW)
Western Sydney (from Campbelltown to Riverston)
NSW South Coast (from Kiama to Eden )
Dubbo (including Gilgandra, Wellington and Narromine)
Victoria (Vic)
Greater Shepparton (including Wangaratta, Seymour, Bendigo, Cobram and Barmah and areas in between)
Queensland (Qld)
South East Queensland (including Brisbane, Ipswich, Logan, Inala, Gold Coast and Bundaberg)
Mount Isa and remote Western Queensland (including Mornington Island, Doomadgee, Normanton and Cloncurry)
Torres Strait Islands and Northern Peninsula Area (NPA)
Western Australia (WA)
Kimberley region (including Derby, Fitzroy Crossing, Broome and Ardiyooloon (One Arm Point)
South Australia (SA)
Adelaide (including Port Augusta)
Northern Territory (NT)
Alice Springs (and some surrounding communities)
NT Top End (including Darwin, Katherine, Minyerri and Galiwin’ku)
Apart from site names, Footprints in Time reports use the Level Of Relative Isolation (LORI) to describe geographical characteristics of families in the study. Site names are not released with the data for reasons of confidentiality but LORI is available on the datasets.
Box 1: Level Of Relative IsolationFootprints in Time uses a classification system of remoteness known as the Level Of Relative Isolation (LORI). Previously used in the Western Australian Aboriginal Child Health Survey (Zubrick et al. 2004), LORI is based on an extension of the 18-point ARIA (Accessibility/Remoteness Index of Australia) called ARIA++. Five categories of isolation have been defined, ranging from None (such as the Brisbane metropolitan area) to Low (for example, Shepparton), Moderate (for example, Derby), High (for example, Bamaga) and Extreme (for example, some Torres Strait islands).
Figure 1 shows the geographic spread of study children in Wave 1.
LSIC Data User Guide – January 2013 12

Figure 1: Footprints in Time sample distribution, Parent 1 interviews
Study development and testingThe design of the study and the content was developed based on extensive consultations with urban, regional and remote Indigenous communities, organisations and service providers across Australia. The overriding goal of consultations was to ensure the design of the research reflected the interests of Aboriginal and Torres Strait Islander peoples, communities and service providers and that the data would genuinely benefit the children and their families.
Piloting of qualitative interviews and community engagement strategies was conducted from September 2004 to December 2005 in the Torres Strait and Northern Peninsula Area (NPA) and in the ACT/Queanbeyan region.
Content rationales were developed based on these consultations, as well as other research such as the Western Australian Aboriginal Child Health Survey (for example, Zubrick et al. 2003) and the National Aboriginal and Torres Strait Islander Health and Social Survey. These rationales were workshopped in November 2005 with members of the Steering Committee and other stakeholders and then used to develop draft questionnaires and computer assisted personal interview (CAPI) instruments.
Piloting of the design, sampling strategy and Wave 1 survey content was undertaken in partnership with the ABS. The ABS tested the questionnaire and field procedures in the first pilot sites in 2006. A number of content areas were adapted to be more culturally
LSIC Data User Guide – January 2013 13

appropriate and/or better understood by respondents before testing the questionnaires and field procedures again in 2007.
Initially six full-time Indigenous RAOs were employed and trained to manage the community engagement activities for the pilot research, including consent processes, data collection and dissemination of information in pilot communities.
Study informantsThe study collects or has collected data from multiple informants as below:
Parent 1 (P1) - was defined in Wave 1 as the primary caregiver who knew the Study Child best. In most cases this was the child’s biological mother but in some cases it was the child’s father or another guardian. In subsequent waves RAOs interviewed the same P1 if they were available and caring for the child and if not, the person who knew the study child best at time of interview.
RAOs undertake an extensive interview with the primary carer of every study child, containing questions about the Study Child, Parent 1 and the household. It is a face-to-face interview (all waves).
Parent 2 (P2) - is Parent 1’s partner or another adult with a parent or carer relationship to the Study Child. In most cases this is the biological father, but step-fathers are also common. Although the surveys were designed to be answered by Grandmas or Aunties or other family who had a caring role there were few respondents who were not fathers. Sometimes Parent 2 is a parent not living with the Study Child, most commonly the biological father after separating from the biological mother (Waves 1 and 2).
RAOs undertook a face-to-face interview or a telephone interview (depending on preferences of Parent 2) after completing Parents 1’s consent and if Parent 2 was willing to participate and able to be contacted (Waves 1 and 2).
With the focus on Parent 1 and the Study Child, response rates for Parent 2 were quite low in Waves 1 and 2 and so Wave 3 data were not collected from Parent 2. The survey was reinstated for Wave 4 after consideration of the matter by the Steering Committee and data collected will be made available in a forthcoming release. However, the Wave 4 interviews were redesigned to focus only on Dads (either fathers or men performing a father-like role in a study child’s life) because the majority of respondents in Waves 1 and 2 were Dads.
The Study Child themselves – complete the vocabulary assessments, practical exercises (such as “Who am I?”) and child height and weight. It includes both face-to-face interview questions and direct assessments.
Teachers and childcare workers – Some teachers and carers completed questionnaires that included their observations of the study children (all waves). These records are relatively few in number. Teacher and carer data collected from Waves 1 to 3 were included in Release 3.1, and wave 4 data will be included in a forthcoming release.
LSIC Data User Guide – January 2013 14

DATA COLLECTIONConsent processThe process for gathering informed consent from the study child’s parents or carers and their family, teachers and carers forms an integral part of the study.
Prior to being interviewed parents were provided with an introductory letter and a DVD describing the study and the consent process. At the interview RAOs went through each consent form with the participant/s and explained what permission was being sought. This enabled parents to make informed consent about their participation in the study. A plain language statement was also available for parents who preferred to read about the study. Parents gave consent on behalf of the Study child.
As well as seeking permission to take part in the study participants were separately asked for consent to:
be voice recorded for the interview
allow the other parent or another carer to be contacted
allow the child’s teacher or child care worker to be contacted
allow the Study child to be photographed
At the conclusion of the consent process participants were given a summary sheet that recorded what they had agreed to. This sheet included contact details for the ethics committee and FaHCSIA. Participants were informed that they could change their consent and are able to withdraw from the study at any time.
With Release 2.0, the records of six Study Children and their families were removed from the Wave 1 datasets because of irregularities in their administrative records. With Release 3.1, one of the six Study Children removed from Release 2.0 was placed back into the datasets, however another Study Child was removed from the datasets upon the request of their primary carer.
Fieldwork periodsThe Wave 4 pilot was conducted in October 2010 and the main round of interviews were conducted between 7 March 2011 and 18 December 2011. Although it is the aim of the study to interview participants at 12 month intervals, this is not always possible because of the availability of respondents and the logistics of interviewers’ travel arrangements and scheduling. Nonetheless, the average intervening time between Waves 3 and 4 interviews was 11.4 months. Table 2 shows the fieldwork periods for Waves 1 to 4.
LSIC Data User Guide – January 2013 15

Table 2: Fieldwork periods
Wave Pilot Main
1 2006-2007 and Jan 2008 21 April 2008 to 23 Feb 2009
2 Nov 2008 3 March to 17 Dec 2009
3 Oct 2009 3 March to 23 Dec 2010
4 Oct 2010 7 March to 18 Dec 2011
Fieldwork ResponseOut of the 1,404 families who participated in Wave 3, Footprints in Time interviewers successfully interviewed 1,150 families in Wave 4, achieving an overall response rate of 82 per cent between the two waves. Table 3 shows fieldwork responses for Waves 1 to 4.
Table 3: Fieldwork response from Wave 1 to Wave 4
Wave Previous wave respondents interviewed
Additional interviews
Total interviews
% of retention from previous wave
1 n/a n/a 1,671 n/a2 1,435 88* 1,523 85.93 1,312 92** 1,404 86.14 1,150 133** 1,283 81.9* New entrants in Wave 2** Interviewed in the current wave, but not the wave priorn/a Not applicableNotes: New entrants were admitted into study in Wave 2, but not in subsequent waves.
Table excludes children removed from Release 2 and Release 3 datasets for administrative reasons.
New entrantsIn order to maintain the viability of the sample in remote regions and meet the requests of a small number of families who expressed a strong wish to be part of the study, Footprints in Time added 88 new entrant families to the study in Wave 2. With the addition of 88 new entrant families, the total number of responses achieved in Wave 2 was 1,523. Seventy-three of the 88 new entrant P1s answered questions specifically directed to new entrants and a further six of those new entrants later answered those questions in Wave 3 (however these responses were merged back into the Wave 2 data file). The other nine Wave 2 new entrants have missing data for new entrant questions, however they did respond to the P1 questions that were asked of continuing participants.
LSIC Data User Guide – January 2013 16

Interview lengthRoy Morgan Research has estimated the time taken for Waves 2, 3 and 4 interviews based on a combination of anecdotal evidence and on the computer-captured data excluding those cases that appeared implausible.
Table 4: Length of Interviews by Cohort and Wave
Cohorts Range W2
Average length W2
Range W3
Average length W3
Range W4
Average length W4
Study Child B Cohort
5-50 minutes
10 minutes 5-47 minutes
10 minutes
2-39 minutes
16 minutes
Study Child K Cohort
5-50 minutes
17 minutes 5-49 minutes
19 minutes
3-58 minutes
24 minutes
Parent 1 B Cohort
Half an hour to 3 hours
1 hour Half an hour to 3 hours
52 minutes
20 minutes to 2 hours
56 minutes
Parent 1 K Cohort
Half an hour to 3 hours
1 hour Half an hour to 3 hours
57 minutes
20 minutes to 2 hours
52 minutes
Parent 2 B Cohort
10-60 minutes
Half an hour
n/a n/a 12-60 minutes
Half an hour
Parent 2 K Cohort
10-60 minutes
Half an hour
n/a n/a 16-59 minutes
33 minutes
Source – Roy Morgan Research Reports
LSIC Data User Guide – January 2013 17

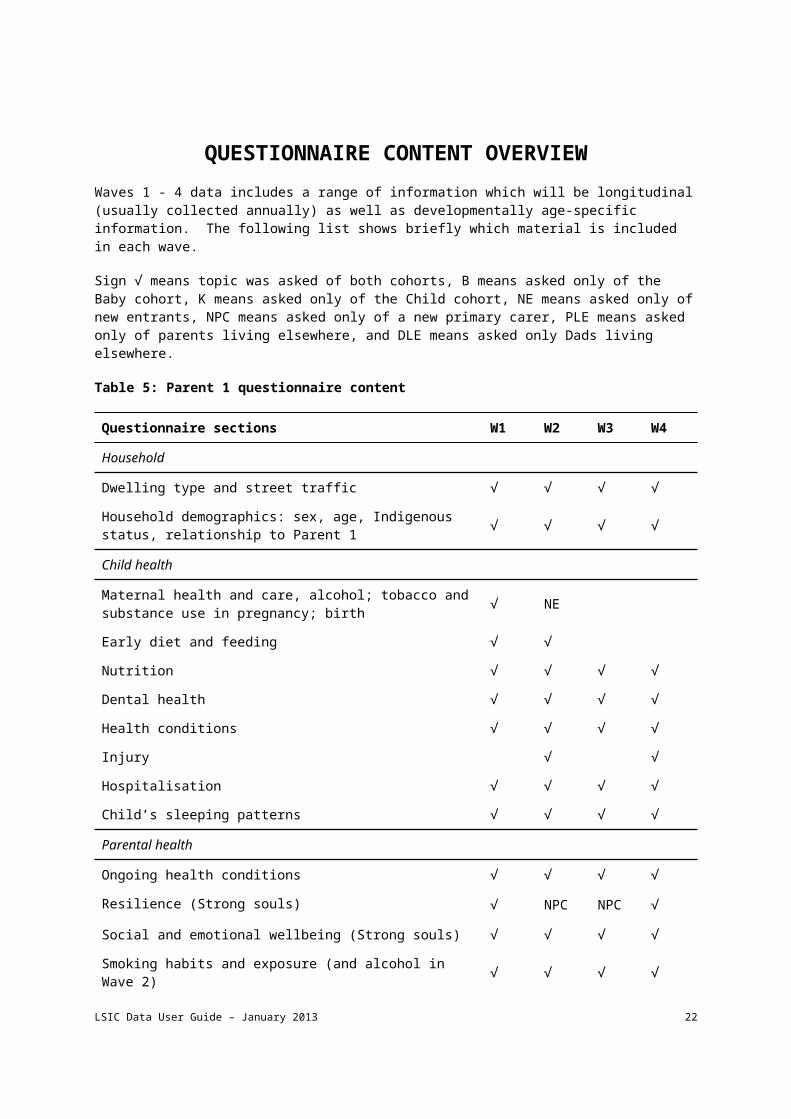
QUESTIONNAIRE CONTENT OVERVIEWWaves 1 - 4 data includes a range of information which will be longitudinal (usually collected annually) as well as developmentally age-specific information. The following list shows briefly which material is included in each wave.
Sign √ means topic was asked of both cohorts, B means asked only of the Baby cohort, K means asked only of the Child cohort, NE means asked only of new entrants, NPC means asked only of a new primary carer, PLE means asked only of parents living elsewhere, and DLE means asked only Dads living elsewhere.
Table 5: Parent 1 questionnaire content
Questionnaire sections W1 W2 W3 W4
Household
Dwelling type and street traffic √ √ √ √Household demographics: sex, age, Indigenous status, relationship to Parent 1 √ √ √ √
Child health
Maternal health and care, alcohol; tobacco and substance use in pregnancy; birth √ NE
Early diet and feeding √ √Nutrition √ √ √ √Dental health √ √ √ √Health conditions √ √ √ √Injury √ √Hospitalisation √ √ √ √Child’s sleeping patterns √ √ √ √Parental health
Ongoing health conditions √ √ √ √Resilience (Strong souls) √ NPC NPC √Social and emotional wellbeing (Strong souls) √ √ √ √Smoking habits and exposure (and alcohol in Wave 2) √ √ √ √Gambling √Parents relationship √Stolen generations √Parent living elsewhere √ √ √ √Child and family functioning
LSIC Data User Guide – January 2013 18

Child social, emotional development K BStrengths and Difficulties © Robert Goodman √ KPhysical ability √ √ √Child temperament KBrief Infant Toddler Social and Emotional Assessment BParent concerns about language and development √ √ √ BParental warmth, monitoring, consistency K B K BMajor life events √ √ √ √Socio-demographics
Participant language, culture and religion √ NPC NPC NPCChild languages, cultural practices √ NEParental education √ NPC NPCWork √ √ √ √Partner’s work, education √ √Financial stress and income √ √ √ √Child support and maintenance √ √Housing and mobility √ √ √ √Child care and early education √ √ √ BSchool K K KActivities √ √ √ √Interviewer questions √ √ √
Table 6: Study Child direct measures
Questionnaire sections W1 W2 W3 W4
Vocabulary - expressive K K K BVocabulary checklist for babies B B BWho Am I? K K K BFavourite things KSchool K KHeight and weight √ √ √ √Drawing task KMATRIX reasoning (from WISC-IV) KProgressive Achievement Tests in Reading (PAT-R) K
LSIC Data User Guide – January 2013 19

Table 7: Parent 2 (Dads in Wave 4) questionnaire content
Questionnaire sections W1 W2 W4
Household
Dwelling type and street traffic PLE PLE DLEHousehold form PLE PLE DLEParental health √ √ √Ongoing health conditions √ √ √Strong souls √ NPC √Social and emotional wellbeing √ √ √Smoking habits and exposure √ √ √Childhood and parenting
Stolen generations √Parent living elsewhere DLEChild and family functioning
Parent warmth, monitoring, consistency K K KMajor life events PLE PLESocio-demographics
Parental language and religion √ NPC √Teaching culture √ √Parental education √ √ √Work √ √ √Financial stress and income √ √ DLEChild support and maintenance PLE DLEHousing and mobility PLE PLE DLEChild care, early education and school √Involvement with study child √Activities P2 does with study child √ √ √
LSIC Data User Guide – January 2013 20

USING THE DATASETSTable 8 shows the number of records in each file in Release 4.
Table 8: Number of records for each file
Dataset Wave1 Wave 2 Wave 3 Wave 4
Parent 1 1,671 1,523 1,404 1,283Parent 2 257 269 n/a 211Study Child 1,469 1,472 1,394 1,269Teacher/carer 45 163 329 431Note: Numbers in the datasets may vary from previous releases either because of administrative
irregularities or if participants have requested that their data be removed from the study.
Locating variablesTo locate variables of interest, look through the mark up questionnaires and/or the Data Dictionary. The mark up questionnaires give the full wording and sequencing of all questions, and the variable names and answer categories for all variables. The Data Dictionary is an Excel workbook providing details of all variables in the LSIC datasets. There is a separate sheet for each survey instrument: P1, P2, SC and TC. Each worksheet contains the variables for all released waves of data. The Data Dictionary can be searched using filters to find variables of interest.
A description of each of the columns in the Data Dictionary can be found at Appendix A.
Variable Naming ConventionThe variable naming convention was developed so that variables have predictable names across waves and informants, and so that thematically linked variables have similar names wherever possible. LSIC variables are a maximum of eight characters in length. The variable name is divided into four parts and provides information on the content of the variable.
First character – Wave identifier, with a=Wave 1, b=Wave 2, c=Wave 3 and d=Wave 4.
Second character – Subject/informant with a=Parent 1, b=Parent 2, c=Study Child, and d=Teacher/carer.
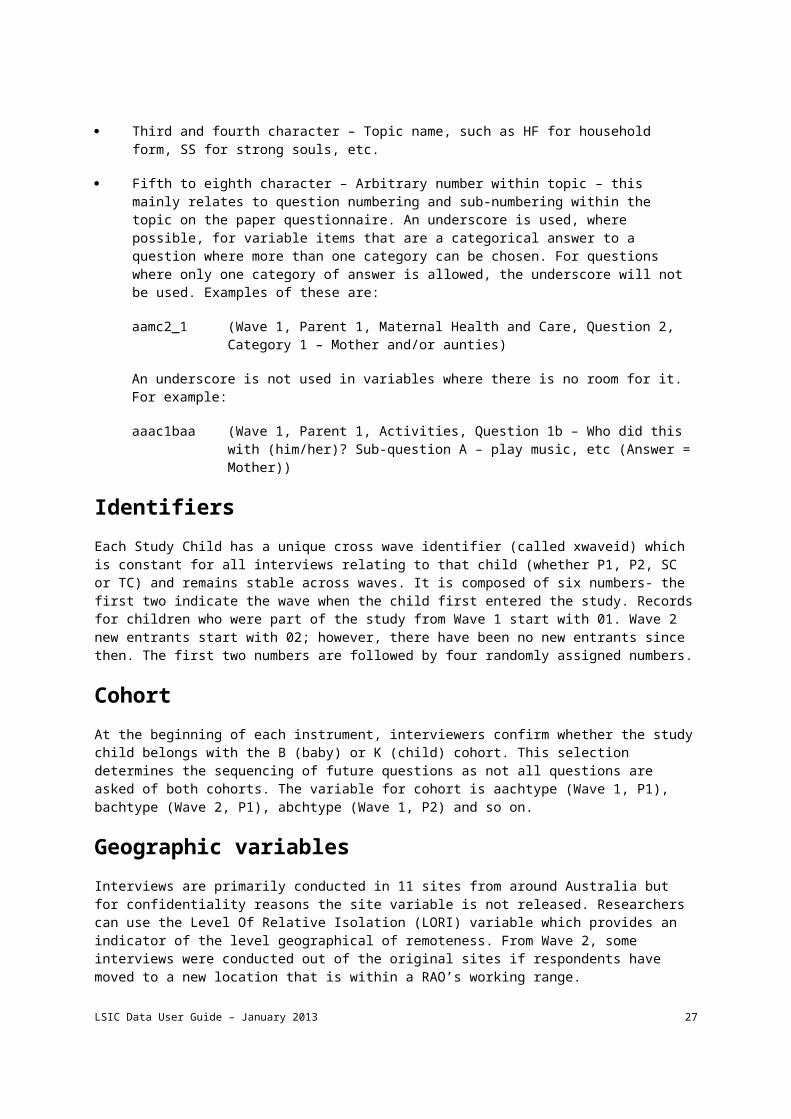
Third and fourth character – Topic name, such as HF for household form, SS for strong souls, etc.
Fifth to eighth character – Arbitrary number within topic – this mainly relates to question numbering and sub-numbering within the topic on the paper questionnaire. An underscore is used, where possible, for variable items that are a categorical answer to a question where more than one category can be chosen. For questions where only one category of answer is allowed, the underscore will not be used. Examples of these are:
LSIC Data User Guide – January 2013 21
aamc2_1 (Wave 1, Parent 1, Maternal Health and Care, Question 2, Category 1 – Mother and/or aunties)
An underscore is not used in variables where there is no room for it. For example:
aaac1baa (Wave 1, Parent 1, Activities, Question 1b – Who did this with (him/her)? Sub-question A – play music, etc (Answer = Mother))
IdentifiersEach Study Child has a unique cross wave identifier (called xwaveid) which is constant for all interviews relating to that child (whether P1, P2, SC or TC) and remains stable across waves. It is composed of six numbers- the first two indicate the wave when the child first entered the study. Records for children who were part of the study from Wave 1 start with 01. Wave 2 new entrants start with 02; however, there have been no new entrants since then. The first two numbers are followed by four randomly assigned numbers.
CohortAt the beginning of each instrument, interviewers confirm whether the study child belongs with the B (baby) or K (child) cohort. This selection determines the sequencing of future questions as not all questions are asked of both cohorts. The variable for cohort is aachtype (Wave 1, P1), bachtype (Wave 2, P1), abchtype (Wave 1, P2) and so on.
Geographic variablesInterviews are primarily conducted in 11 sites from around Australia but for confidentiality reasons the site variable is not released. Researchers can use the Level Of Relative Isolation (LORI) variable which provides an indicator of the level geographical of remoteness. From Wave 2, some interviews were conducted out of the original sites if respondents have moved to a new location that is within a RAO’s working range.
Household FormThe household form in the P1 instrument collects basic demographic information (age, sex, Indigenous status and relationship to P1) of all members of the household. Prior to Release 1.2 the information for P1, P2 and Study Child were entered into the first three places and other household members could be enumerated in any order. This meant that a particular individual could be member 4 in Wave 1 and member 6 in Wave 2. As researchers are not given access to the names of household members, it would be impossible to analyse movements of individuals in and out of households.
To overcome this problem, the household data was reorganised from Release 1.2 so that each individual has a permanent household member number/position. All data is missing if the member is not present in that wave. The Study Child is always member 1. The P1 in Wave 1 is always member 2, even if they are no longer the P1. The P2 in Wave 1 is member 3 (if there was a P2 in the household). Other household members take positions 4 onwards. If a new member joins the household they are given the next free position. Separate variables identify the member numbers of P1 and P2 (if present) in each wave.
The household form collects date of birth rather than age for the Study Child (and P1 and P2). As child development occurs rapidly over the early years, a variable for the study child’s age in months at the time of interview (ascagem) has been derived to enable relevant analysis.LSIC Data User Guide – January 2013 22

Direct assessments of child developmentDirect measures include the Who Am I? developmental assessment and the Renfrew Word Finding Vocabulary Test, which were undertaken by the Baby cohort in Wave 4 and the Child cohort in Waves 1 to 3. These verbal and non-verbal measures assess processes that underlie the learning of early literacy and numeracy skills. The measures start at a point where the vast majority of children experience some success and most children enjoy them. Although the measures are designed to progressively get more difficult, they are stopped when the child is unable to complete the harder items. Both of these direct assessments can provide information about the extent to which a child is ready for the early years classroom tasks that are associated with subsequent literacy and numeracy development at school.
Direct measures also include child height and weight, collected for both cohorts across all waves.
Who Am I?Who am I? (de Lemos & Doig 1999) is a developmental assessment that requires the child to write their name, copy shapes, write letters, numbers and words in a small booklet, with simple instructions and encouragement from the interviewer. Who am I? is not language dependent and is suitable for children with limited English. The assessment takes about 10 minutes to complete and is suitable for preschool children and children in the first two years of school.
Renfrew Word Finding Vocabulary TestThe Renfrew Word Finding Vocabulary Test (Renfrew 1998) assesses children’s expressive vocabulary – compared, for instance, with the Peabody Picture Vocabulary Test (Dunn & Dunn 2007), which is a test of receptive vocabulary. The Renfrew Word Finding Vocabulary Test assesses a child’s ability to accurately describe images as portrayed in the 50 pictures contained in the assessment and children can respond correctly in languages other than English.
The test was chosen for LSIC, in consultation with Dr Nola Purdie of the Australian Council for Educational Research (ACER). It has been normed in the UK and in New Zealand (Renfrew 1998). The Renfrew pictures are simple and clear and often represent things from everyday life such as a cup, a kangaroo and a pineapple. All LSIC children, regardless of age, start with the first picture and are presented with one picture at a time until the child has provided no correct response to six in a row. The next six pictures are then spread out and if the child can name at least one of the next six, they are presented with the next six. No further cards are presented once the child can no longer provide at least one correct answer for the six cards on display.
A child’s vocabulary is a good predictor of later reading abilities (Biemiller, 2007) and this ability to communicate one’s ideas clearly and to understand the communication of others are vital pre-requisite skills for learning in the classroom.
LSIC Data User Guide – January 2013 23

PAT-R – Progressive Achievement Tests in ReadingThe PAT–R tests were developed by the ACER (2008) for use in Australian schools. In Wave 4 LSIC started using an adaptation of the PAT-R Comprehension tests for the K cohort.
From 2008 the K cohort saw the Renfrew cards in Waves 1, 2 and 3. By Wave 3 many of the children were being shown all the pictures. Steering Committee members requested a new measure that would develop with the children - that is, have progressively more difficult, age appropriate items. LSIC sought advice from Dr Nola Purdie and others at ACER about measures for assessing LSIC children’s educational development. ACER advised that the PAT Reading Comprehension test would indicate how well each child was learning to read English and would probably be a good indicator of how well a child was doing at school in general.
Members of the LSIC Steering Committee raised concerns that the tests: would be given to children who might feel shamed if they could not answer, were not culturally relevant or fun and would not be administered at school but afterwards when the children would be tired and not do as well. Accordingly the LSIC versions of the PAT-R Comprehension test were amended as follows:
questions are asked in order of difficulty (based on Australian norms);
the children are sequenced out after a prescribed number of incorrect responses; and
questions are programmed on to the interviewers’ touch screen computers so the children can answer themselves on screen which children find more fun than the pen and paper versions.
In Wave 4 all the K cohort children started with the PAT-P, designed for beginning readers in the first and second years of formal schooling. The PAT-P asks questions about literacy concepts, letters, sounds and blends, matching words to pictures, pictures to words and sentences to pictures. Unless the children answered three in a row or three out of any four incorrectly they progressed to the PAT-1, designed for children in Prep, Year 1 and Year 2. The PAT-1 has a couple of short passages, the first with pictures, followed by multiple choice questions. Again children were sequenced out if they answered three in a row or three out of any four incorrectly.
The PAT questions are not visible in the mark up copy as they are copyrighted to ACER. Further information about the PAT tests, including sample questions can be seen at: https://shop.acer.edu.au/acer-shop/group/PAT4. Raw scores are not available to data users. ACER have produced scaled scores for the LSIC children who undertook the measure. The scaled scores will be comparable across waves so that it will be possible for data users to assess progress over time as well as compare students within LSIC waves. LSIC PAT scores should not be compared with general PAT scores or norms. Scores are only provided for children who attempted at least ten questions.
LSIC Data User Guide – January 2013 24

Matrix reasoningIn Wave 4 K cohort children undertook the Matrix Reasoning test (Wechsler 2003) from the Wechsler Intelligence Scale for Children, 4th edition (WISC-IV,)1. It was chosen for LSIC because it is a non-verbal measure of abstract reasoning ability, so not language dependent and had been used successfully in the Longitudinal Study of Australian Children (AIFS 2011).
The children are shown an incomplete set of pictures or designs on the touchscreen laptop and then choose the picture that completes the set from five different options. Children are sequenced out if they provide an incorrect answer for 4 in a row, or 4 out of 5 in a row. The instrument has 35 items of increasing complexity. LSIC children all start with 3 practice questions.
The data file includes only scaled scores. The scale is scored based on the number of correct items and the scores are then standardised based on age norms given in the WISC-IV manual. Scores can range between 1 and 19.
Child height and weightChild height and weight data have been collected at every wave, however these data were not released prior to Release 3.1 because of concerns about their quality. Difficulties in measuring babies or small children, and interviewer inexperience and/or equipment problems, meant that data quality was worst in Wave 1 but better in subsequent waves as the children grew older and interviewer training, equipment and experience improved. Despite the improvement over time, a significant data cleaning effort was required before releasing the height and weight data to users. Birth weight data were of better quality and were released prior to Release 3.1, but still benefited from further data cleaning.
For Release 3.1, Australian National University postgraduate student Katherine Thurber generously donated her time to improve height and weight data quality through a cleaning process as described below:
The World Health Organization (WHO) Anthro and WHO Anthro Plus programs (available from http://www.who.int/childgrowth/software/en/ and http://www.who.int/growthref/tools/en/) were used to translate weight and height measurements to weight-for-age, height-for-age, and Body Mass Index (BMI)-for-age z-scores, based on the WHO Child Growth Standards. These Standards are based on the results of the WHO Multicentre Growth Reference Study, which included 8,440 healthy infants from eight countries (Brazil, Ghana, India, Norway, Oman and the United States) (WHO 2006).
Children were classified as thin, healthy weight, overweight, or obese according to WHO and International Obesity Taskforce cut-off points for BMI-for-age z-scores. For all children, a BMI-for-age z-score below -2 represents Grade 2 Thinness (Cole et al. 2007). For children between the ages of five and 19 years, a BMI-for-age z-score between -2 and +1 indicates a healthy weight, a z-score between +1 and +2 indicates overweight, and a z-score exceeding +2 indicates obesity (de Onis & Lobstein 2010). The cut-off points for children zero to five years of age are more conservative: a BMI-for-age z-score between -2 and +1 indicates a healthy weight, a z-score between +1 and +2 indicates a risk of overweight, a z-score between +2
1 The ‘Wechsler Intelligence Scale for Children – Fourth Edition’ is copyrighted by HarcourtAssessment, Inc., 2004.
LSIC Data User Guide – January 2013 25

and +3 indicates overweight, and a z-score exceeding +3 indicates obesity (de Onis & Lobstein 2010).
Weights and heights were re-coded to “implausible value” if they fell outside the range of values deemed plausible by the WHO (WHO 2012). Weights and weight-for-age z-scores were re-coded to implausible if the weight-for-age z-score or BMI-for-age z-score fell outside ± 5. Heights and height-for-age z-scores were re-coded to implausible if the height-for-age z-score fell outside ± 6 or the BMI-for-age z-score fell outside ± 5. BMI values and BMI-for-age z-scores were re-coded to implausible if the BMI-for-age z-score fell outside ± 5 or either weight-for-age or height-for-age z-scores were outside of their respective plausible ranges. Measurements representing implausible variation within children over time were also excluded. Decreases in height between waves were considered physiologically impossible, and criteria were used to identify the values to re-code to “implausible value.” Decreases in weight between waves are physiologically possible, especially in the case of illness or trauma, so a more conservative cleaning process was applied to the weight data. Decreases in weight between waves that were associated with a decrease in weight-for-age z-score greater than 3 were eligible for exclusion, based on a predetermined set of criteria.
For birth weight data, a nationally representative reference of Australian birth weights from 1998 to 2007 (Dobbins et al. 2012) was used to calculate z-scores. Birth weights in the Footprints in Time sample were compared to the median birth weight of infants of the same gestational age and gender. Birth weights were recoded to “implausible value” if their birth weight for gestational age z-score was greater than +3 or less than -3 after undergoing a data cleaning process. Infants were classified as small-for-gestational age if their birth weight was in the lowest decile of birth weights for infants of the same gender and gestational age, equivalent to a z-score less than -1.28. Infants were classified as large-for-gestational age if their birth weight was in the highest decile of birth weights for infants of the same gender and gestational age, equivalent to a z-score greater than +1.28. Infants with a z-score between -1.28 and +1.28 were classified as appropriate-for-gestational age.
ScalesThe questionnaires include sets of questions (scales) which have been designed to measure a specific trait or attribute of the respondent or study child, such as child temperament, social and emotional development, child strengths and difficulties, parenting style, social and emotional wellbeing of the parent and degree of social support. In some cases, the questions have been asked exactly as designed and used in other studies. In other cases questions have been adapted to the Indigenous context or shortened to meet time constraints. A number of scores or sub-scores have been derived in LSIC using established methods.
TemperamentThe Short Temperament Scale for Children is a set of questions developed to measure aspects of a child’s personality (Sanson et al.1987). An abridged form of 13 questions was asked of the Child cohort LSIC children in Wave 2 and will be asked of Baby cohort children in Wave 5. The Longitudinal Study of Australian Children uses 12 of the questions. Three facets of temperament are assessed by the questions: approach/sociability – how comfortable children are with new people and situations; persistence – the ability to remain focussed on an activity or task; and reactivity – the intensity/volatility with which a child reacts to certain events. Sub-scales are derived for
LSIC Data User Guide – January 2013 26
each aspect of temperament – these are the average of four scores after reverse coding some variables as follows:
Table 9: Short Temperament Scale for Children sub-scales
Sub-scale Variable name
Calculation
Sociability bapa4soc mean of bapa4_a, bapa4_d bapa4_g and bapa4_j, with bapa4_a and bapa4_d reverse coded
Persistence
bapa4per mean of bapa4_b, bapa4_e bapa4_h and bapa4_l, with bapa4_l reverse coded
Reactivity bapa4rea mean of bapa4_c, bapa4_f bapa4_i and bapa4_k, with bapa4_c reverse coded
A sub-scale is not derived if three or more components are missing.
Brief Infant-Toddler Social and Emotional Assessment (BITSEA)The BITSEA (Briggs-Gowan et al. 2004) is designed to be used as a screening tool to assess child development and identify possible social–emotional and behavioural problems or delays in children aged 12 to 36 months. The BITSEA gathers information on the parent’s perception about a wide range of social, emotional, and behaviour problems and competencies. Parents answered whether each statement was not true (rarely), somewhat true (sometimes) or very true (often) of their child’s behaviour over the last month.
The BITSEA questions cover the two domains of social–emotional behaviour—problems and competencies. Social–emotional problems include externalising problems, internalising problems, problems of dysregulation, maladaptive behaviours, and atypical behaviours. The questions regarding competencies are about attention, compliance, mastery motivation, pro-social peer relations, empathy, imitation/play skills, and social relatedness. The BITSEA data can be used by researchers to identify early social and emotional problems in children.
Questions from the BITSEA were asked of parents of the Baby cohort in Wave 2.
Two sub-score variables have been derived in LSIC as follows:
Table 10: BITSEA sub-scales
Sub-scale Variable name
Calculation
Competency
bapatotc sum of bapa5* where * is 1, 5, 10, 13, 15, 19, 20, 22, 25, 29, and 31
Problem bapatotp sum of bapa5* where * is 2, 3, 4, 6, 7, 8, 9, 11, 14, 16, 17, 18, 21, 23, 24, 26, 27, 28, 30, 32, 33 and 34
A sub-scale is not derived if five or more components are missing.
LSIC Data User Guide – January 2013 27

Strengths and Difficulties Questionnaire (SDQ)The SDQ is a 25-item behavioural screening questionnaire for 3 to 16 year olds (see http://www.sdqinfo.com). It can be used by clinicians as an initial assessment of child and adolescent emotional and behavioural difficulties, highlighting areas of difficulty that need further investigation. It is also used to evaluate the effect of specific treatments/programs and in estimating prevalence of behaviours in specific sub-populations.
The SDQ is available in a number of versions with some variation in wording to suit different aged children and for specific counties. The SDQ asks about both positive and negative attributes which can be grouped into five scales. These are: emotional symptoms, conduct problems, hyperactivity/inattention, peer relationship problems and prosocial behaviour. The first four scales are then added to produce a total difficulties score.
The SDQ was asked of parents of both cohorts in wave 3, and the Child cohort in wave 4. The SDQ was also asked of teachers and carers of study children (both cohorts in wave 3 and wave 4 plus the Child cohort in wave 2).
The sub-scales derived in LSIC are as follows:
Table 11: Strengths and Difficulties Questionnaire sub-scales
Sub-scale Variable name
Calculation
Emotional symptoms
casqemot mean of non-missing variables casq* where * is 3, 8, 13, 16 and 24, multiplied by 5
Conduct Problems
casqcond mean of non-missing variables casq* where * is 5, 7, 12, 18 and 22, multiplied by 5
Hyperactivity Score
casqhype mean of non-missing variables casq* where * is 2, 10, 15, 21 and 25, multiplied by 5
Peer Problem casqpeer mean of non-missing variables casq* where * is 6, 11, 14, 19 and 23, multiplied by 5
Prosocial casqpros mean of non-missing variables casq* where * is 1, 4, 9, 17 and 20, multiplied by 5
Total Difficulties casqdiff sum of casqemot, casqcond, casqhype and casqpeer
The sub-scales are not derived if 2 or more components are missing, while the Total Difficulties score requires all non-missing components.
The Footprints in Time Key Summary Report from Wave 3 contains analysis of the SDQ by cohort, sex, family type and child’s position within the family. It also compares responses to the parent rated SDQ with responses to the Teacher rated SDQ.
Qualitative dataA range of qualitative data items are collected as part of Footprints in Time in the form of free text responses to a number of open-ended questions in the survey. Free text entry responses to open-ended questions are included in the data releases, with references to places, individuals, employers, clans, family names and languages suppressed. LSIC Data User Guide – January 2013 28

References to rare circumstances that may have been of sufficient noteworthiness to be known by the wider community are also suppressed. The risk of identification is expected to be low given the confidentialised status of these data, however data users need to be mindful at all times of their responsibility to not risk identification of respondents. For the purposes of keeping data files to a manageable size, free text entries in the data releases are truncated to a maximum character length, with any remaining characters discarded. The full responses can be viewed in Excel worksheets which can be requested from the LSIC Data Team ([email protected]). A list of these free text variables are provided at Appendix B.
Data users are permitted to directly quote free text responses on the basis that such usage poses no risk of the respondent being rendered identifiable. Quotes can be accompanied by relevant unit record data such as age or occupation if these details are required for meaningful interpretation but the unit record data used should be the minimum required for the data user’s purpose and should manifestly carry no risk of identifying the respondent. For example, it is acceptable to report that ‘One mother who has a Bachelor degree commented “I want him to go to university and have a good career”’ but it is not acceptable to use to report that ‘One mother, who works as a Professor of Indigenous Studies at a university, commented “I want him to go to university and have a good career”’.
Other - specify responsesThe LSIC questionnaire is unusual in permitting interviewers to enter an “Other- specify” response for many of the questions. This enabled interviewers to type in a response to the question when there was no obviously appropriate category. This simplifies survey design by limiting the number of answer categories that are needed. It also means that the survey design team becomes aware of any important answer category that have been missed and are able to amend the questionnaire if the question was repeated in a later wave to include this new category. For some variables, responses entered in “Other- specify” have been back coded to existing categories where appropriate, but the majority have not.
The “Other- specify” category is of limited use to researchers without the accompanying text file. It was decided to code all "Other- specify” responses to “-1” for ease of use. They can be easily included or excluded from analysis, and do not cause confusion when variables are numeric quantities (e.g. Age, number of weeks, etc.) or Leichardt scales. The only exception to this is for multiple response questions, when a respondent can legitimately select both “Other- specify” as well as another response category. In these cases there is a separate variable indicating whether “Other- specify” was selected.
Missing data codingThe convention for dealing with missing data in LSIC is similar to, but not the same as, either of the conventions used by the LSAC and HILDA survey. Missing data is coded “-2” to “-9”, as per the table below.-1 Other (When explicitly available as an option in the questionnaire)-2 Don’t know (When explicitly available as an option in the questionnaire)-3 Refused (When explicitly available as an option in the questionnaire)-4 Refused section (When explicitly available as an option in the questionnaire.
Used both for the screener question for a section that can be refused as well as all the variables within that section)
-5 Not asked (Indicates a question that has been skipped due to normal sequencing or a free text or numeric answer category which has been intentionally left blank)
-6 Not asked of this cohort (Some questions are only asked of B cohort or K LSIC Data User Guide – January 2013 29

-1 Other (When explicitly available as an option in the questionnaire)cohort)
-7 Implausible value (Indicates where value has been deleted during cleaning- e.g. 800kg person)
-8 Missing data (Data not collected where it might be expected. Used where an answer is not provided, although based on sequencing and programming an answer should have been provided)
-9 Non-responding person (for items from merged datasets- eg. where a respondent has completed a P1 survey but not a SC survey)
Merging datasetsDatasets can be merged across waves or within the wave (e.g. P1 and P2 for wave 1) by one-to-one matching on the unique identifier (xwaveid). The code to do this will be specific to the analysis package used. Two examples of merging in Stata are provided at Appendix C. If researchers are experiencing difficulty merging datasets, they should contact the LSIC Data Team at <[email protected]>.
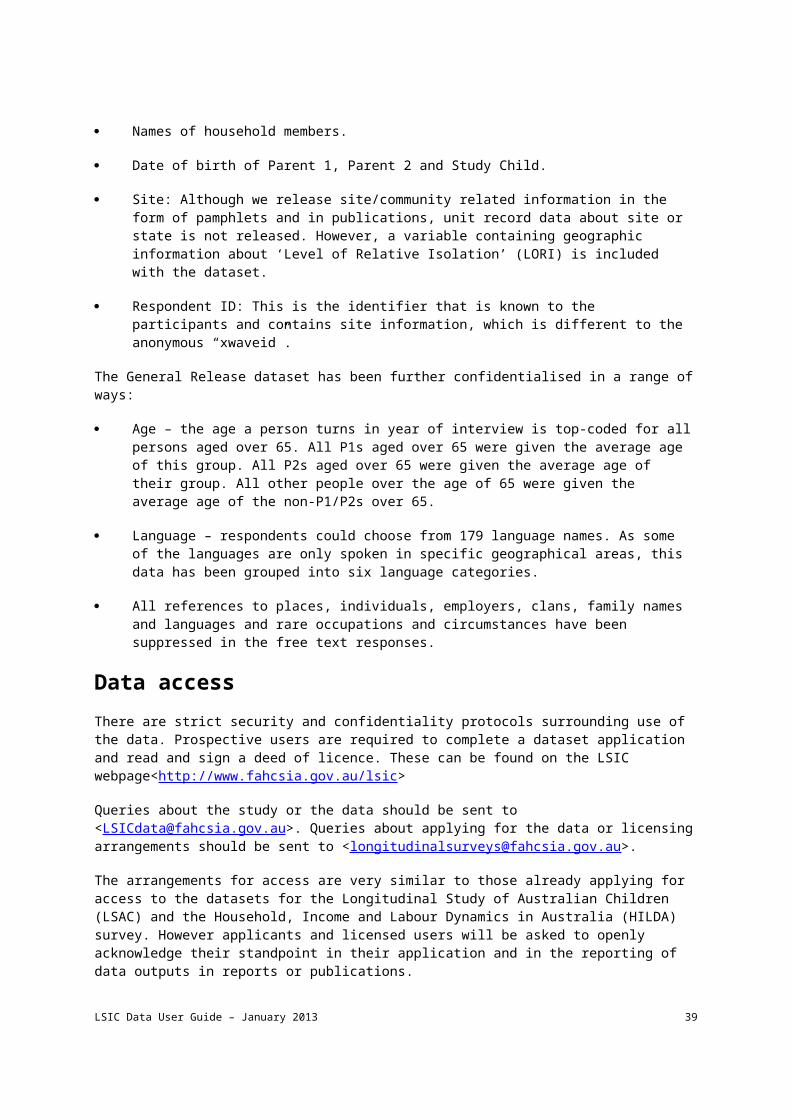
ConfidentialisationA number of variables have been removed from the data as these could easily compromise the identity of the respondent. These include:
Names of household members.
Date of birth of Parent 1, Parent 2 and Study Child.
Site: Although we release site/community related information in the form of pamphlets and in publications, unit record data about site or state is not released. However, a variable containing geographic information about ‘Level of Relative Isolation’ (LORI) is included with the dataset.
Respondent ID: This is the identifier that is known to the participants and contains site information, which is different to the anonymous “xwaveid”.
The General Release dataset has been further confidentialised in a range of ways:
Age – the age a person turns in year of interview is top-coded for all persons aged over 65. All P1s aged over 65 were given the average age of this group. All P2s aged over 65 were given the average age of their group. All other people over the age of 65 were given the average age of the non-P1/P2s over 65.
Language – respondents could choose from 179 language names. As some of the languages are only spoken in specific geographical areas, this data has been grouped into six language categories.
All references to places, individuals, employers, clans, family names and languages and rare occupations and circumstances have been suppressed in the free text responses.
Data accessThere are strict security and confidentiality protocols surrounding use of the data. Prospective users are required to complete a dataset application and read and sign a
LSIC Data User Guide – January 2013 30

deed of licence. These can be found on the LSIC webpage<http://www.fahcsia.gov.au/lsic>
Queries about the study or the data should be sent to <[email protected]>. Queries about applying for the data or licensing arrangements should be sent to <[email protected]>.
The arrangements for access are very similar to those already applying for access to the datasets for the Longitudinal Study of Australian Children (LSAC) and the Household, Income and Labour Dynamics in Australia (HILDA) survey. However applicants and licensed users will be asked to openly acknowledge their standpoint in their application and in the reporting of data outputs in reports or publications.
Those who are interested in applying for the Footprints in Time(LSIC) data should read Section 9 and Appendix A in the Manual for the access to and use of FaHCSIA longitudinal survey datasets(link found at <http://www.fahcsia.gov.au/lsic>) before completing their application.
LSIC Data User Guide – January 2013 31

DATA LINKAGE – THE AUSTRALIAN EARLY DEVELOPMENT INDEX (AEDI)
The Australian Early Development Index (AEDI) is a nation-wide assessment of development of young children. Between 1 May and 31 July 2009, teachers completed the AEDI checklist for children in their first year of full time school. The AEDI measured five areas of early childhood development: physical health and wellbeing, social competence, emotional maturity, language and cognitive skills (school-based), and communications skills and general knowledge.
The next AEDI data collection will take place from May to July 2012, with results expected in 2013. Further information is available from the website: http://www.rch.org.au/aedi
Two types of data linkage with AEDI scores are available or are being developed for LSIC:
1. Aggregated AEDI data for LSIC children is in the Parent 1 Wave 2 Release 3.1 dataset. This dataset is based on the suburb that the child lived in at their Wave 2 LSIC interview. The aggregated dataset includes the average AEDI scores across the five areas of early childhood development by suburb, the proportion of ‘developmentally vulnerable’ children in that suburb, as well as some demographic information. This data relates to children (Indigenous and non-Indigenous) living in the suburb in their first year of school whose teachers completed the AEDI checklist. This may or may not include the study child.
2. We also sought permission from parents of K cohort children to link specifically to their child’s AEDI data. Where parental permission was obtained and an AEDI was completed by a teacher, LSIC will link that child’s AEDI data to LSIC data, in a separate data set and will be available for the data users in a later release. Additional requirements for access to such data may be required.
About the AEDI[The following information was provided to FaHCSIA with the aggregated (community level) 2009 AEDI data. For further information visit the AEDI website http://www.rch.org.au. Content in square brackets has been added by FaHCSIA]
The Australian Early Development Index (AEDI), based on the Canadian Early Development Instrument, is a population measure of young children’s development. Like a census, it involves collecting information to help create a snapshot of early childhood development in communities across Australia.
Teachers complete a checklist for children in their first year of full-time school. The checklist measures five key areas, or domains, of child development:
• physical health and wellbeing
• social competence
LSIC Data User Guide – January 2013 32

• emotional maturity
• language and cognitive skills (school-based)
• communication skills and general knowledge.
These are important areas of child development and also good predictors of adult health, education and social outcomes.
As a population measure, the AEDI places the focus on all children in the community; it examines early childhood development across the whole community. Moving the focus of effort from the individual child to all children in the community can make a bigger difference in supporting efforts to create optimal early childhood development.
While the AEDI is completed by teachers, results are reported for the communities where children live, not where they go to school. The initial AEDI results allow communities to see how local children are doing relative to, or compared to other children in their community, and across Australia.
National implementation In 2009, the AEDI was completed nationwide for the first time. Between 1 May and 31 July, information was collected on 261,147 children (97.5 per cent of the estimated national five-year-old population). This involved 15,522 teachers from 7,422 Government, Catholic and Independent schools around Australia.
A follow-up data collection occurred in some small areas in 2010. AEDI results are now available for 96 per cent of Australian communities.
Following the success of the first national implementation of the AEDI, the Australian Government has made a commitment to collect this important data every three years. The AEDI commitment represents a total investment of $51.2 million over five years (or $28 million per collection cycle). The ongoing AEDI funding will ensure that governments and communities continue to have the information they need to make a difference in the lives of young children and their families.
Confidentialisation ‘Rule of Three’ For all data except AEDI developmental variables, the lowest number that can be published is four. For example, data showing that there are two Indigenous children in an area should not be published but replaced with ≤3.
If this rule is breached, AEDI data cannot be released without some action to ensure identification is unlikely. In this extract, cells have been replaced with <= 3 and <= nn% where the actual cell value is less than or equal to three. Conversely, where the number of children not included in a cell (i.e. the remainder) is less than or equal to three, the cells have been replaced with >= nn and >= nn%.
LSIC Data User Guide – January 2013 33

Disclosure of information about all members of a group when developmentally vulnerable Cells replaced with >= 90.0% indicate that confidentialisation took place, due to at least 90% of the children in that domain scoring in the developmentally vulnerable category.
Insufficient number of children for a Domain Cells replaced with < 15 and N/A indicate that confidentialisation took place, due to less than 15 children being available for domain calculations.
Risks associated with the release of this extract Overall, the risk assessment for releasing this extract is moderate, due to significant data at a Local Community level being made public for the first time:
The demographic cells for ATSI, Special Needs, ESL, Language and LBOTE have not previously been made public at a Local Community level.
The sub-domain vulnerable cells have only been made public for the Physical health and wellbeing domain. This is the first time the sub-domain vulnerability results have been released for the Social competence, Emotional maturity and Language and cognitive skills (school-based) domains.
The following should be noted:
The formulae for sub-domain vulnerable and domain vulnerable are distinct. It is possible for a child to be vulnerable on a number of sub-domains, yet not be developmentally vulnerable at the domain level. The actual details of these formulae are confidential by licence with the Canadian Early Development Instrument.
ERP Guideline
To determine this calculation the numerator is the number of children from the local community surveyed for the AEDI and the denominator is the Australian Bureau of Statistics ERP (Estimated Resident Population 2009) of 5-year-olds.
Where the AEDI Local Community does not match its ABS estimate, it is recommended to be used with the following considerations:
60-79% ERP – view with caution. < 60% of ERP – this sample may not accurately represent the population of
children. [% ERP figures should be viewed as indicative only. The reason that some
percentages are over 100, is mostly due to unavoidable boundary differences. Also AEDI was administered to 4 and 6 year olds if they were in their first year of school, but ABS figures are only for 5 year olds.]
Data notes for this extract The Average Age is displayed for the Community level, not the Local Community
level. This corresponds to data published in the AEDI Community Profiles. There are 51 [LSIC wave 2 respondents] without associated AEDI data. This was
due to their Local Community being: o Not public (that is, it has failed the public results test of >= 15 children, >=
2 teachers and >= 80% children in domain denominator) LSIC Data User Guide – January 2013 34

o Not surveyed (there were no resident children in that location who participated in the AEDI)
o Unknown (the two records have no match in the AEDI geography).
Rules guiding usage of AEDI data For the full documentation relevant to the use of AEDI data, please refer to our web pages:
Using AEDI Data. http://www.rch.org.au/aedi/research.cfm?doc_id=13767
Unpublished AEDI Data http://www.rch.org.au/aedi/research.cfm?doc_id=13670
In keeping with the AEDI National Implementation Data Protocol the release of tabulated data, through reports, publications, presentations etc must be provided to the AEDI Strategic Policy Committee at least one month prior to its intended release date for approval.
List of AEDI variablesTable 12 lists the AEDI variables that have been merged into Release 4. Full details can be found in the Data Dictionary.
Table 12: Aggregrated data at the suburb level for suburbs where LSIC children lived in Wave 2.
Variable Description
bdi_d1 AEDI Dems: % of total AEDI children based on ABS ERP
bdi_d2 AEDI Dems: Average age (months) calculated at the Community level
bdi_d3 AEDI Dems: % children who are boys
bdi_d4 AEDI Dems: % children who are girls
bdi_d5 AEDI Dems: % children who are Aboriginal or Torres Strait Islanders
bdi_d6 AEDI Dems: % children who are Special Needs
bdi_d7 AEDI Dems: % children who are English as a Second Language
bdi_d8 AEDI Dems: % children who speak a language other than English
bdi_d9 AEDI Dems: % children with a language background other than English
bdi_d10 AEDI Dems: ABS % people who have completed year 12 or equivalent
bdi_d11 AEDI Dems: ABS % persons who lived at a different address one year ago
bdi_d12 AEDI Dems: ABS % young people who are single parents < 25 years
bdi_d13 AEDI Dems: ABS % the labour force unemployed
LSIC Data User Guide – January 2013 35

bdi_pds AEDI PHYS: Average domain score Physical health & wellbeing
bdi_pvul AEDI PHYS: % children developmentally vulnerable on domain PHYS
bdi_pv1 AEDI PHYS_1 Physical readiness for school day: % children vulnerable
bdi_pv2 AEDI PHYS_2 Physical dependence: % children vulnerable
bdi_pv3 AEDI PHYS_3 Gross and fine motor skills: % children vulnerable
bdi_sds AEDI SOC: Average domain score Social competence
bdi_svul AEDI SOC: % children developmentally vulnerable on domain SOC
bdi_sv1 AEDI SOC_1 Overall social competence: % children vulnerable
bdi_sv2 AEDI SOC_2 Responsibility and respect: % children vulnerable
bdi_sv3 AEDI SOC_3 Approaches to learning: % children vulnerable
bdi_sv4 AEDI SOC_4 Readiness to explore new things: % children vulnerable
bdi_eds AEDI EMOT: Average domain score Emotional maturity
bdi_evul AEDI EMOT: % children developmentally vulnerable on domain EMOT
bdi_ev1 AEDI EMOT_1 Pro-social and helping behaviour: % children vulnerable
bdi_ev2 AEDI EMOT_2 Anxious and fearful behaviour: % children vulnerable
bdi_ev3 AEDI EMOT_3 Aggressive behaviour: % children vulnerable
bdi_ev4 AEDI EMOT_4 Hyperactivity and inattention: % children vulnerable
bdi_lds AEDI LANGCOG: Average domain score Language & cognitive skills
bdi_lvulAEDI LANGCOG: % children developmentally vulnerable on domain LANGCOG
bdi_lv1 AEDI LANGCOG_1 Basic literacy: % children vulnerable
bdi_lv2 AEDI LANGCOG_2 Interest in literacy/numeracy: % children vulnerable
bdi_lv3 AEDI LANGCOG_3 Advanced literacy: % children vulnerable
bdi_lv4 AEDI LANGCOG_4 Basic numeracy: % children vulnerable
bdi_cdsAEDI COMGEN: Average domain score Communication skills & gen. knowledge
bdi_cvulAEDI COMGEN: % children developmentally vulnerable on domain COMGEN
bdi_vul1 AEDI: % children developmentally vulnerable on one or more domain/s
LSIC Data User Guide – January 2013 36

bdi_vul2 AEDI: % children developmentally vulnerable on two or more domains
LSIC Data User Guide – January 2013 37

GETTING MORE INFORMATIONMore information on Footprints in Time and its progress can be found on the LSIC website: <http://www.fahcsia.gov.au/lsic>
Further enquiries can be directed to <[email protected]> or by contacting:
Jason BrandrupLSIC Data ManagerPO Box 7576, Canberra Business CentreACT 2610Tel: +61 2 6146 2341Fax: +61 2 6204 4726
LSIC Data User Guide – January 2013 38
REFERENCESAustralian Council for Educational Research 2008, Progressive Achievement Tests in Reading (PAT-R) 4th Ed. ACER Press.
Australian Institute of Family Studies 2011, Longitudinal Study of Australian Children Data User Guide – August 2011, Melbourne.
Biemiller, A 2007, The influence of vocabulary on reading acquisition. In Encyclopedia of Language and Literacy Development, published on website by the Canadian Language and Literacy Center: http://literacyencyclopedia.ca/index.php?fa=items.show&topicId=19#comments
Briggs-Gowan, MJ, Carter, AS, Irwin, JR, Watchtel, K & Cicchetti, DV 2004, ‘The Brief Infant-Toddler Social and Emotional Assessment: screening for social-emotional problems and delays in competence’, Journal of Pediatric Psychology, vol. 29, no. 2, pp. 143-155.
Cole, TJ, Flegal, KM, Nicholls, D, Jackson, AA 2007, ‘Body mass index cut offs to define thinness in children and adolescents: international survey’, British Medical Journal, vol. 335, issue 7880, p. 194.
de Lemos, M & Doig, B 1999, Who Am I? Developmental Assessment Manual, ACER, Melbourne.
de Onis, M, Lobstein, T 2010, ‘Defining obesity risk status in the general childhood population: Which cut-offs should we use?’, International Journal of Pediatric Obesity, vol. 5, no. 2, pp. 458-60.
Dobbins, TA, Sullivan, EA, Roberts, CL, Simpson, JM 2012, Australian national birthweight percentiles by sex and gestational age, 1998-2007’, Medical Journal of Australia, vol. 197, no. 2, p. 291.
Dunn, LM & Dunn, DM 2007, Peabody Picture Vocabulary Test, Fourth Edition, Pearson, Minneapolis.
Renfrew, C 1998, The Renfrew Language Scale: Word Finding Vocabulary test, Speechmark, Milton Keynes.
Sanson, A, Prior, MR, Garino E, Oberklaid, F & Sewell, J, 1997, ‘The structure of infant temperament: factor analysis of the revised infant temperament questionnaire’, InfantBehaviour and Development; vol. 10, 97–104.
Wechsler, D 2003, Wechsler Intelligence Scale for Children-Fourth Edition. Administration and scoring manual. San Antonio, TX: Harcourt Assessment, Inc.
World Health Organization 2006, WHO Child Growth Standards: Methods and development: Length/height-for-age, weight-for-age, weight-for-length, weight-for-height and body mass index-for-age, Geneva.
World Health Organization 2012, The standard analysis and reporting for the WHO Global Database differs as follows depending on whether the NCHS/WHO reference or the WHO standards are used, [06/03/2012], available from: http://www.who.int/nutgrowthdb/software/Differences_NCHS_WHO.pdf.
LSIC Data User Guide – January 2013 39

Zubrick, SR, Lawrence, DM, Silburn, SR, Blair, E, Milroy, H, Wilkes T, Eades S, Antoine H, Read A, Ishiguchi P& Doyle S, 2004,The Western Australian Aboriginal Child Health Study: The Health of Aboriginal Children and Young People, Telethon Institute for Child Health Research, Perth.
LSIC Data User Guide – January 2013 40

APPENDIX AData dictionaryHeadings Description
Variable Indicates the variable name in the dataset (without the first letter which pertains to wave).
Variable label Indicates the variable label as used in the dataset.Question Gives the exact question wording used in the questionnaire.Value label Indicates the answer categories available in the questionnaire
together with the numeric value used in the dataset.Wave & cohort Indicate which questions were asked of each cohort in each the year.Person label Indicates whether the respondent is P1 (parent one), P2 (parent two),
SC (study child) or a teacher or carer (TC).Variable type Indicates whether a variable is categorical, ordinal, text, numerical or
multiple responses.Derived variables
Indicates variables derived from information collected through the survey instruments.
Questionnaire Section Code
Indicates the two initials which designate which section of the questionnaire the question comes from, also appears in the variable name, e.g. HH or SS.
Questionnaire Section name
Indicates the name of the section in which the question appears in the questionnaire, e.g. Household Form or Strong Souls.
Population (see also 'Cohort')
Indicates whether sequencing affects the population of whom each question was asked. e.g. if question is only asked of birth mothers.
Topic The topic is either the root question for multiple responses, or the scale (for example, Renfrew), or is otherwise identical (or derived from) to the variable name.
Theme Shows some thematic links between questions in different parts of the questionnaire.
Notes Provides extra information that might be useful in interpreting the data, e.g. Variations in question wording for different cohorts or information on how some variables were derived.
LSIC Data User Guide – January 2013 41

APPENDIX BQualitative free text questions/variable labelsQuestion/variable label Variable
Name(excluding first letter indicating wave)
Wave 1 Wave 2
Wave 3
Wave 4
Bush tucker eaten – text anu4_t P1Bush tucker eaten – text anu7_t P1SC’s health condition has affected family life – text
ahc4_t P1
Reason for hospitalisation of SC – REASON 1 - text
aho1a1t P1 P1 P1 P1
Reason for hospitalisation of SC – REASON 2 - text
aho1a2t P1 P1 P1 P1
Reason for hospitalisation of SC – REASON 3 - text
aho1a3t P1 P1 P1 P1
Reason for hospitalisation of SC – REASON 4 - text
aho1a4t P1 P1 P1
Reason for hospitalisation of SC – REASON 5 - text
aho1a5t P1
What happens before sleep – text
acs4_t P1
What happens before sleep – text
acs1_t P1
P1 plays sport or exercises – text
aoc4_t P1
SC gets involved in P1’s sport or exercise – text
aoc5_t P1
P1 is getting help with that (depression) - text
asw13_t P1
Any other speech difficulties - text
ald5_9t P1 P1 P1
Concerns about how Study child uses hands and fingers to do things.
ald8_t P1 P1 P1
Concerns about how Study child uses arms or legs.
ald9_t P1 P1 P1
Concerns about how Study child behaves.
ald10_t P1 P1 P1
LSIC Data User Guide – January 2013 42

Question/variable label Variable Name(excluding first letter indicating wave)
Wave 1 Wave 2
Wave 3
Wave 4
Concerns about how Study child gets along with others.
ald11_t P1 P1 P1
Concerns about how Study child is learning pre-school and school skills.
ald12_t P1 P1 P1
Concerns about how Study child is learning to do things for himself/herself.
ald13_t P1 P1 P1
Concerns about Study child’s learning or development.
ald14_t P1 P1 P1
SC is receiving treatment for speech difficulty - text
ald15_t P1 P1
SC is receiving treatment for understanding difficulty – text
ald16_t P1 P1
What other major events or stressful situations happened to you, your family or (STUDY CHILD) since this time last year?
ame16_t, bme16_t
P1, P2 P1, P2 P1 P1
What do you do to cope with stress - text
ame17_t, bme17_t
P1 P1, P2 P1
Issues about passing Indigenous culture on to SC – text
apl32_t P1
P1 main field of study - text ape4_t, bpe4_t P1, P2 P1 P1P1 main job - text awo3_t P1 P1 P1P1’s main tasks and duties at work – text
awo9_t P1
P1's partner's main job – text
awo14_t P1 P1
P1’s partner’s main tasks and duties at work - text
awo15_t P1
How did seeing a financial counsellor help – text
afi8_t P1
Income management has caused changes to community – positive changes – text
afi111t P1 P1
LSIC Data User Guide – January 2013 43

Question/variable label Variable Name(excluding first letter indicating wave)
Wave 1 Wave 2
Wave 3
Wave 4
Income management has caused changes to community – negative changes – text
afi112t P1 P1
Are there any new major things that need fixing - text
ahm7_t, bhm7_t P1, P2 P1
Why do you feel [this community] is unsafe/dangerous?
ahm13_t, bhm13_t
P1, P2 P1, P2 P1 P1
Is there anything else you want to say about your community?
ahm14_t, bhm14_t
P1, P2 P1
Do you know where to get help?
ahm17_t P1
P1 has transport problems - text
ahm36_t P1
SC attend playgroup or baby group – text
ace1_t P1 P1 P1 P1
SC has been bullied at preschool/school because they are Indigenous – text
ace23_t P1 P1
How P1 deal with racist bullying of SC – text
ace24_t P1
Describe bullying experienced by SC – text
ace51_t P1
Are there family rules about television?
aac29_t P1
Whether at home or away what are a couple of things you enjoy doing with the Study Child?
aac8_t, bac8_t P1, P2 P1, P2
Whether at home or away what are a couple of things Study Child enjoys doing with you?
aac9_t, bac9_t P1, P2 P1, P2
Apart from health and happiness what do you want for your Study Child?
aac10_t, bac10_t P1, P2 P1
LSIC Data User Guide – January 2013 44

Question/variable label Variable Name(excluding first letter indicating wave)
Wave 1 Wave 2
Wave 3
Wave 4
What is it about Aboriginal or Torres Strait Islander culture that will help Study Child grow up strong?
aac11_t, bac11_t P1, P2
Anything else P1 wants to tell us
aac12_t, bac12_t P1, P2 P1, P2 P1 P1
Good education for SC aac18_t P1What P1 hopes that SC will do or learn next year
aac19_t P1 P1
SC has done organised sport or dancing in the last month
aac22_t P1
Things SC enjoys doing aac24_t P1 P1Something that’s happened for the SC since last year
brt1_t P2
What would a good education be for SC
bac32_t P2
Thinking about the next year, what are you hoping SC will do or learn?"
bac33_t P2
Renfrew vocabulary- Alternative words provided in English
crf1_1t-crf1_50t SC SC SC SC
Who am I – Year level at school
cwi3 SC SC
Things SC likes to do at preschool/school
cfv5_t SC
SC's favourite thing to do at preschool/school
csc13_t SC SC
What SC wants to be when grown up
csc14_t SC SC
Reason why PAT-R (reading game) was not completed
dcpr2_t SC
Other activities school is doing to strengthen Indigenous education focus
dsc9_t TC
Describe Indigenous training dbg15_t TC TC TCWhat SC does particularly well
dcc35_t TC
LSIC Data User Guide – January 2013 45

Question/variable label Variable Name(excluding first letter indicating wave)
Wave 1 Wave 2
Wave 3
Wave 4
Benefits of having SC in your classroom
dcc36_t TC
Activities SC enjoys dcc37_t TC TC TCComments about SC or ATSI children
dcc38_t TC TC TC
LSIC Data User Guide – January 2013 46

APPENDIX CExamples of merging in Stata
*Stata example of merging P1 wave 1 and P1 wave 2 data
version 11 /*merge syntax is slightly different for earlier versions of stata*/
use "[Substitute folder name here]\lsicp1w1_20c.dta", clear
merge 1:1 xwaveid using ///
"[Substitute folder name here]\lsicp1w2_20c.dta.dta"
*Stata example of merging P1 wave 2 and P2 wave 2 data
version 11 /*merge syntax is slightly different for earlier versions of stata*/
use "[Substitute folder name here]\lsicp1w2_20c.dta", clear
merge 1:1 xwaveid using ///
"[Substitute folder name here]\lsicp2w2_20c.dta.dta
LSIC Data User Guide – January 2013 47