Embed Size (px)
Citation preview

Data visualisation with HighChart or D3
Vasilij Nevlev – Aviva Health
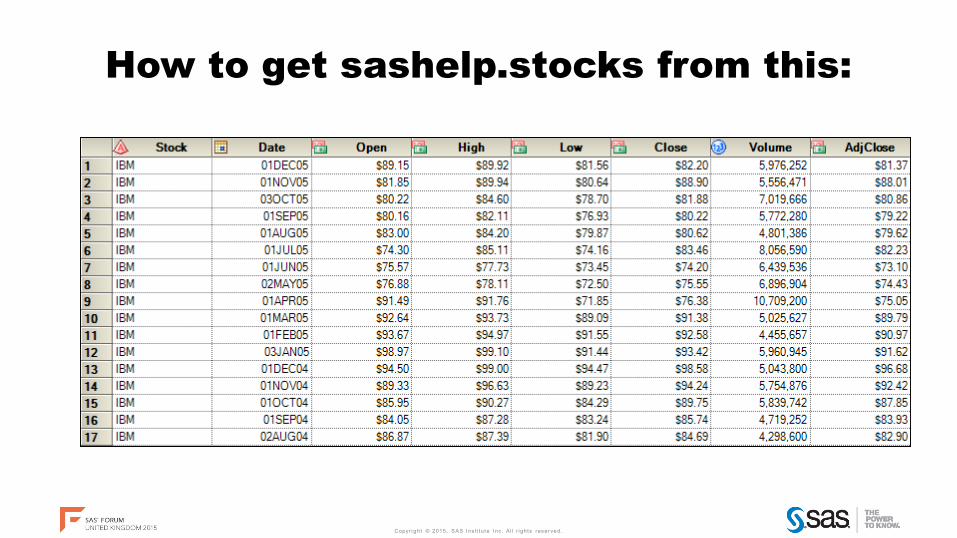
How to get sashelp.stocks from this:
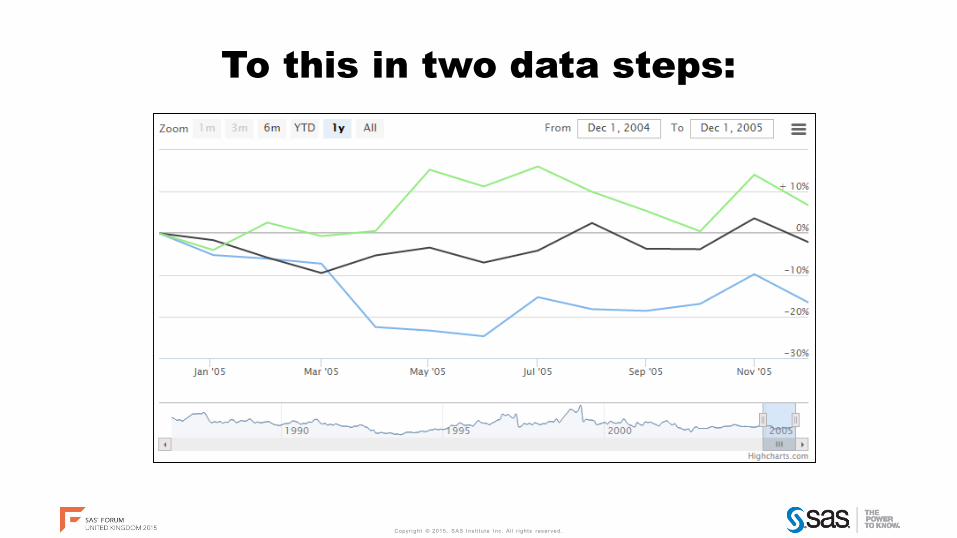
To this in two data steps:
Agenda
• Introduction
• Why to visualise with HighCharts or D3?
• What do you need to have?
• What do you need to know?
• One of many ways of doing it
• Questions
Introduction
• Role: Financial Loss Analyst (Fraud)
• Project: Fraud detection framework
• Tool: Complex web portal build on:
• SAS Stored Processes
• JavaScript/HTML/CSS
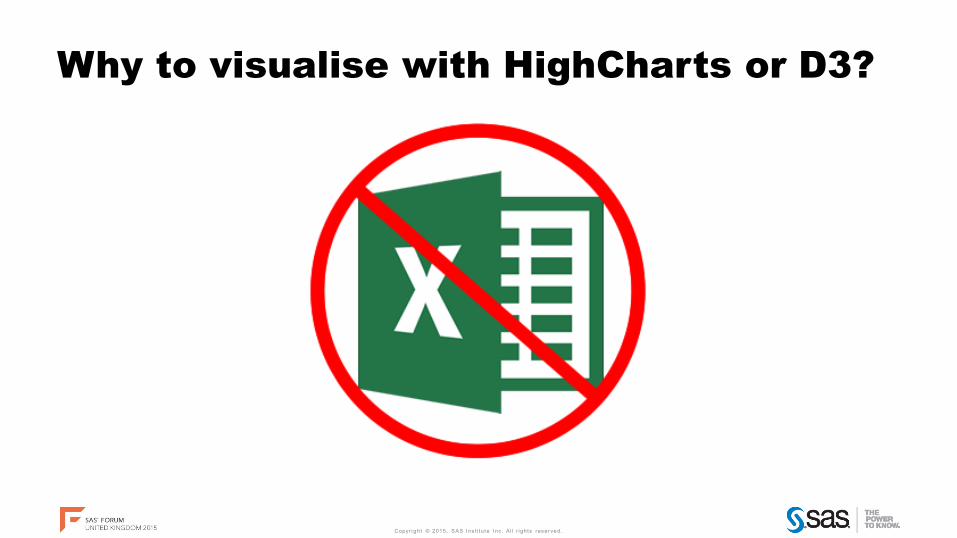
Why to visualise with HighCharts or D3?
Ok, so what exactly is HighCharts or D3?
• Simple, small, but powerful JavaScript Library
• That’s it, there is nothing else to it
• And yes, there is a lot of other great libraries
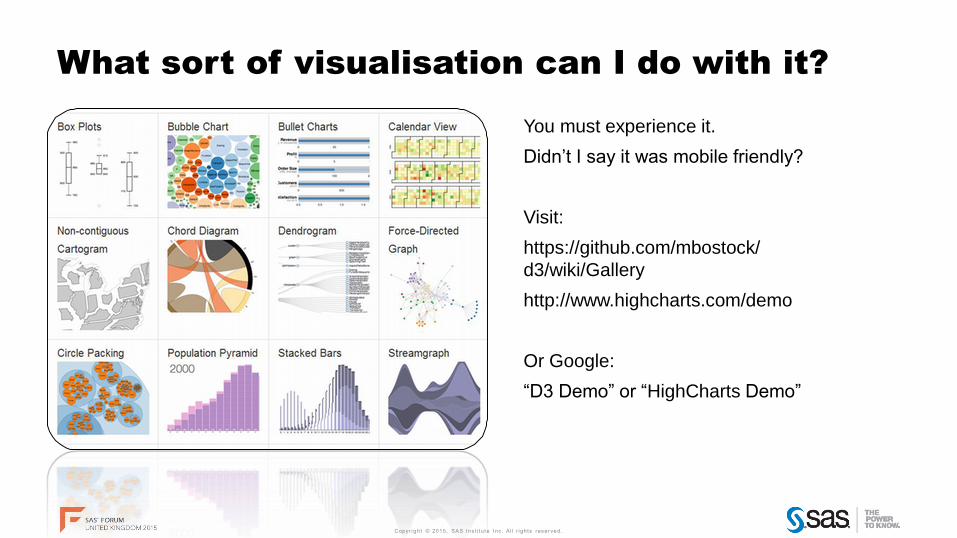
What sort of visualisation can I do with it?
You must experience it.
Didn’t I say it was mobile friendly?
Visit:
https://github.com/mbostock/
d3/wiki/Gallery
http://www.highcharts.com/demo
Or Google:
“D3 Demo” or “HighCharts Demo”

Questions so far?
So what do I need to have?
• SAS Base server
• SAS Stored Process web app and server
• Somewhere to store your JS libraries with access
over HTTP(S)
What do I need to know?
• SAS Base programming
• How to work with macro variables
• How to design Stored Processes
• Basic understanding of JavaScript/HTML/CSS
Can we start doing it already?
• This example is using sashelp.stocks data table
• We will turn that into stocks visualisation that allows
dynamically adjust time periods of the time series data
• The example is based on Model and View principle, so
first stored process visualises the data, and another
Stored Process provides the actual data on demand.
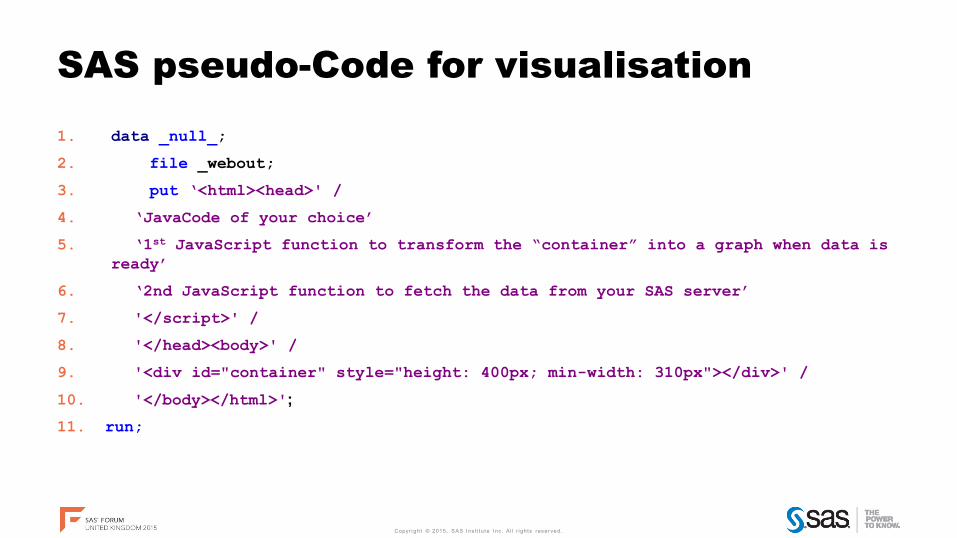
SAS pseudo-Code for visualisation
1. data _null_;
2. file _webout;
3. put ‘<html><head>' /
4. ‘JavaCode of your choice’
5. ‘1st JavaScript function to transform the “container” into a graph when data is
ready’
6. ‘2nd JavaScript function to fetch the data from your SAS server’
7. '</script>' /
8. '</head><body>' /
9. '<div id="container" style="height: 400px; min-width: 310px"></div>' /
10. '</body></html>';
11. run;
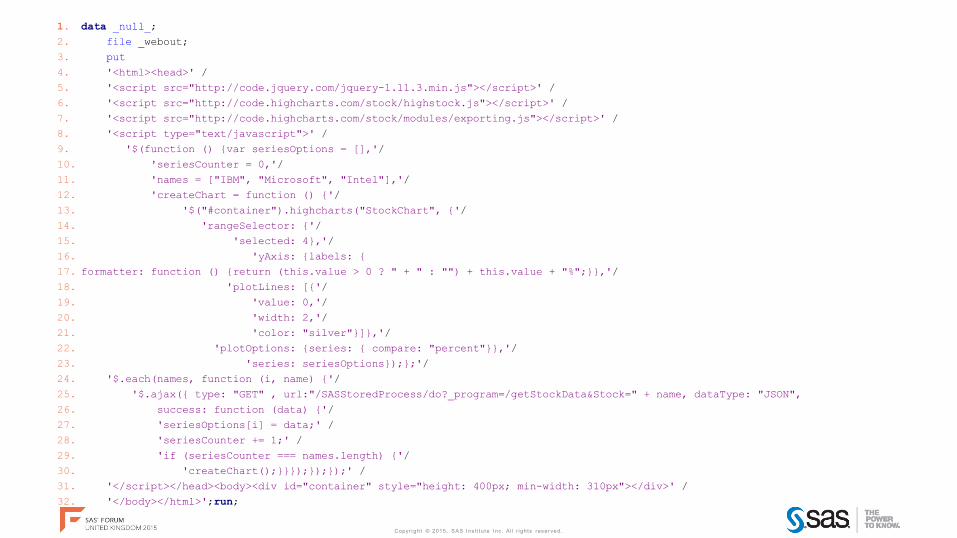
1. data _null_;
2. file _webout;
3. put
4. '<html><head>' /
5. '<script src="http://code.jquery.com/jquery-1.11.3.min.js"></script>' /
6. '<script src="http://code.highcharts.com/stock/highstock.js"></script>' /
7. '<script src="http://code.highcharts.com/stock/modules/exporting.js"></script>' /
8. '<script type="text/javascript">' /
9. '$(function () {var seriesOptions = [],'/
10. 'seriesCounter = 0,'/
11. 'names = ["IBM", "Microsoft", "Intel"],'/
12. 'createChart = function () {'/
13. '$("#container").highcharts("StockChart", {'/
14. 'rangeSelector: {'/
15. 'selected: 4},'/
16. 'yAxis: {labels: {
17. formatter: function () {return (this.value > 0 ? " + " : "") + this.value + "%";}},'/
18. 'plotLines: [{'/
19. 'value: 0,'/
20. 'width: 2,'/
21. 'color: "silver"}]},'/
22. 'plotOptions: {series: { compare: "percent"}},'/
23. 'series: seriesOptions});};'/
24. '$.each(names, function (i, name) {'/
25. '$.ajax({ type: "GET" , url:"/SASStoredProcess/do?_program=/getStockData&Stock=" + name, dataType: "JSON",
26. success: function (data) {'/
27. 'seriesOptions[i] = data;' /
28. 'seriesCounter += 1;' /
29. 'if (seriesCounter === names.length) {'/
30. 'createChart();}}});});});' /
31. '</script></head><body><div id="container" style="height: 400px; min-width: 310px"></div>' /
32. '</body></html>';run;
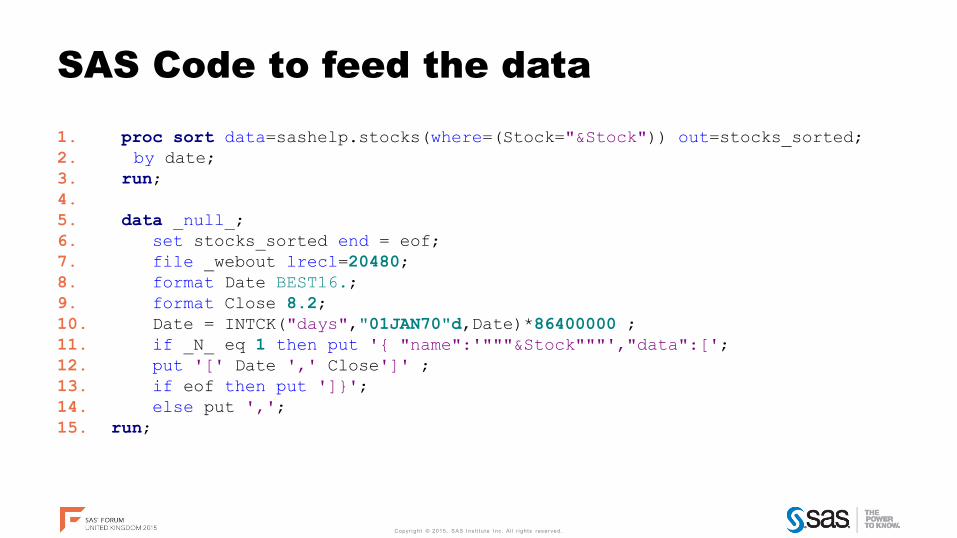
SAS Code to feed the data
1. proc sort data=sashelp.stocks(where=(Stock="&Stock")) out=stocks_sorted;
2. by date;
3. run;
4.
5. data _null_;
6. set stocks_sorted end = eof;
7. file _webout lrecl=20480;
8. format Date BEST16.;
9. format Close 8.2;
10. Date = INTCK("days","01JAN70"d,Date)*86400000 ;
11. if _N_ eq 1 then put '{ "name":'"""&Stock"""',"data":[';
12. put '[' Date ',' Close']' ;
13. if eof then put ']}';
14. else put ',';
15. run;
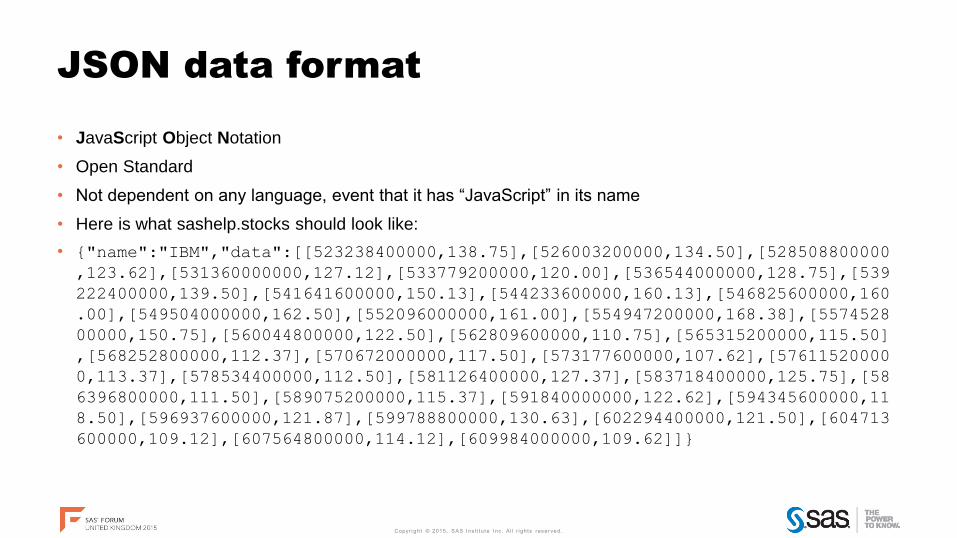
JSON data format
• JavaScript Object Notation
• Open Standard
• Not dependent on any language, event that it has “JavaScript” in its name
• Here is what sashelp.stocks should look like:
• {"name":"IBM","data":[[523238400000,138.75],[526003200000,134.50],[528508800000
,123.62],[531360000000,127.12],[533779200000,120.00],[536544000000,128.75],[539
222400000,139.50],[541641600000,150.13],[544233600000,160.13],[546825600000,160
.00],[549504000000,162.50],[552096000000,161.00],[554947200000,168.38],[5574528
00000,150.75],[560044800000,122.50],[562809600000,110.75],[565315200000,115.50]
,[568252800000,112.37],[570672000000,117.50],[573177600000,107.62],[57611520000
0,113.37],[578534400000,112.50],[581126400000,127.37],[583718400000,125.75],[58
6396800000,111.50],[589075200000,115.37],[591840000000,122.62],[594345600000,11
8.50],[596937600000,121.87],[599788800000,130.63],[602294400000,121.50],[604713
600000,109.12],[607564800000,114.12],[609984000000,109.62]]}
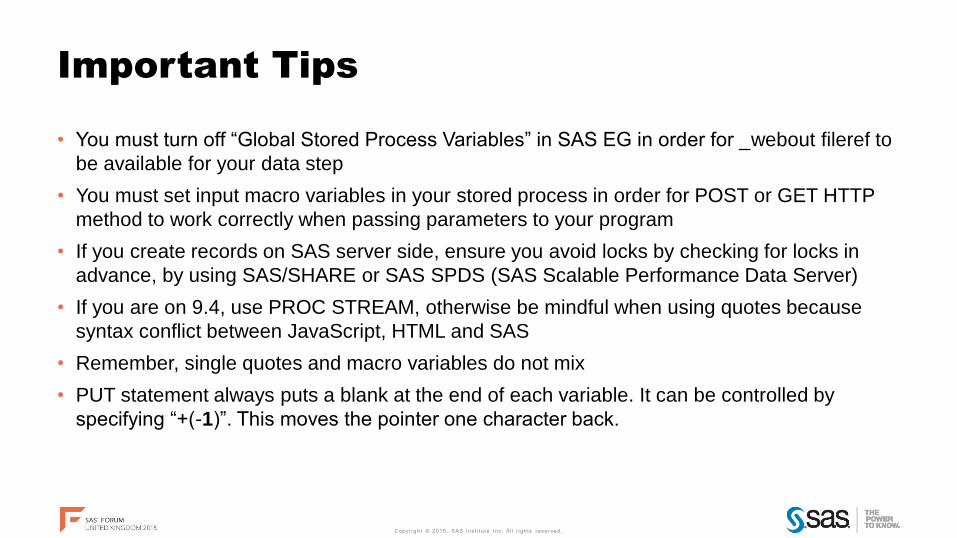
Important Tips
• You must turn off “Global Stored Process Variables” in SAS EG in order for _webout fileref to
be available for your data step
• You must set input macro variables in your stored process in order for POST or GET HTTP
method to work correctly when passing parameters to your program
• If you create records on SAS server side, ensure you avoid locks by checking for locks in
advance, by using SAS/SHARE or SAS SPDS (SAS Scalable Performance Data Server)
• If you are on 9.4, use PROC STREAM, otherwise be mindful when using quotes because
syntax conflict between JavaScript, HTML and SAS
• Remember, single quotes and macro variables do not mix
• PUT statement always puts a blank at the end of each variable. It can be controlled by
specifying “+(-1)”. This moves the pointer one character back.

That is it. Questions?
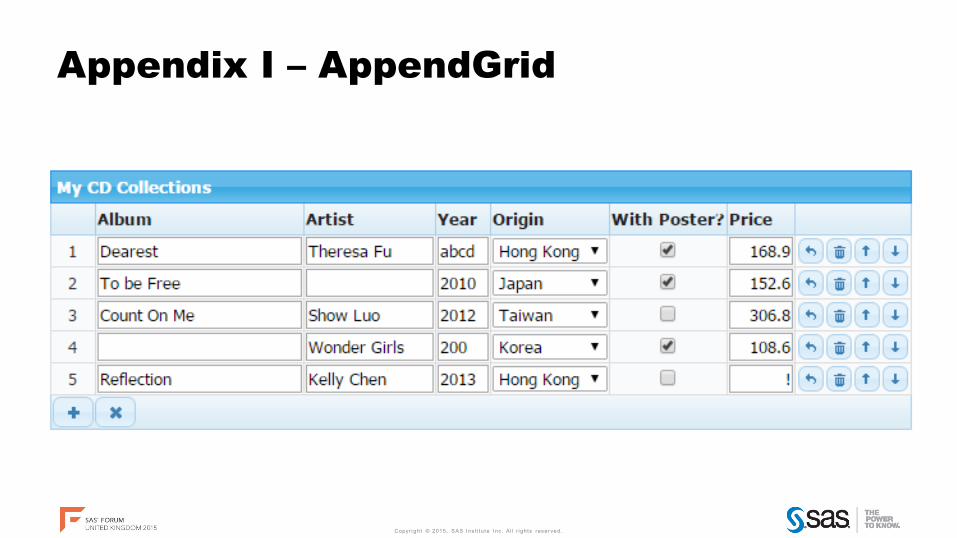
Appendix I – AppendGrid
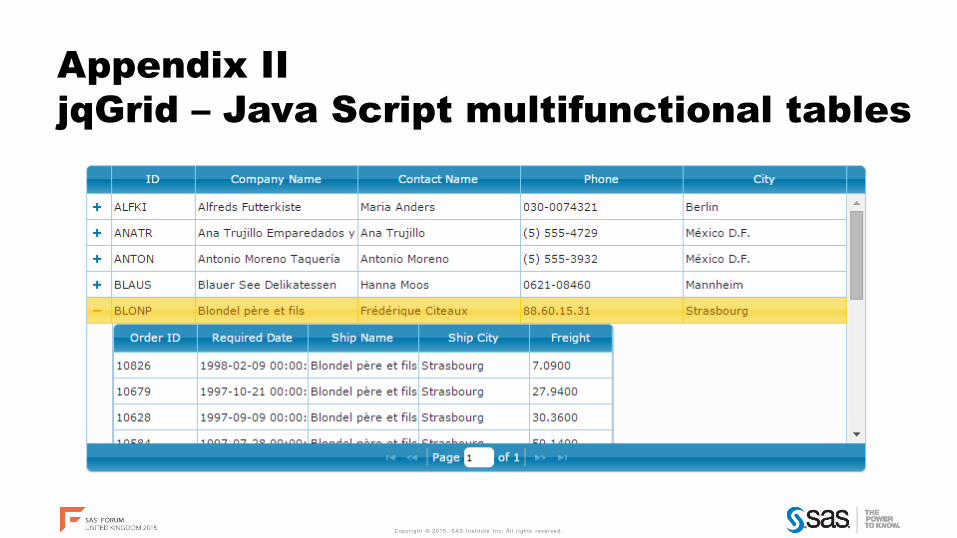
Appendix II
jqGrid – Java Script multifunctional tables
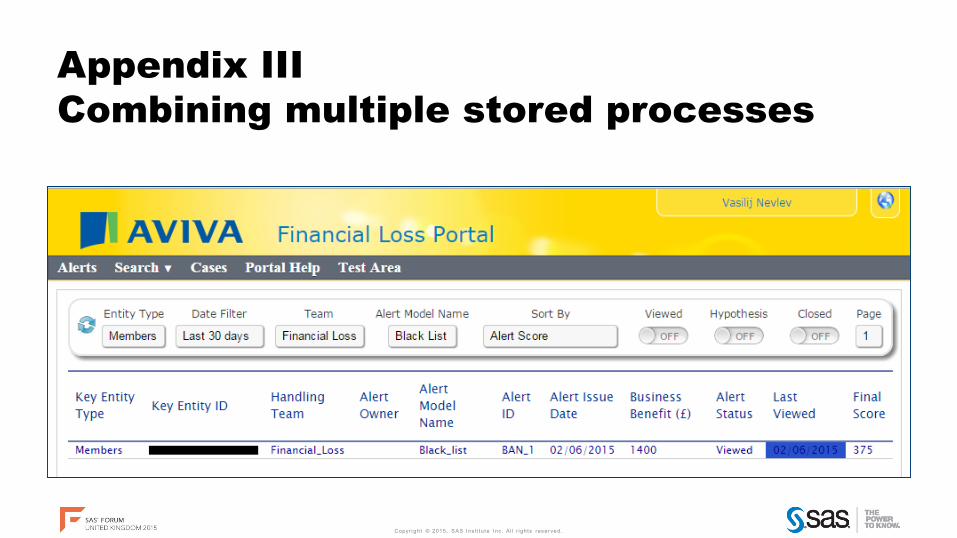
Appendix III
Combining multiple stored processes