Embed Size (px)
Citation preview
Official documents are in Italian
DATALOGIC GROUP Consolidated Financial Report as at September 30, 2006 GROUP STRUCTURE pag. 1 COMPOSITION OF CORPORATE GOVERNANCE BODIES pag. 2 MANAGEMENT REPORT pag. 3 QUARTERLY FINANCIAL STATEMENTS Balance Sheet – Assets pag. 20 Balance Sheet – Liabilities pag. 21 Profit & Loss Account pag. 22 Consolidated cash flow summary pag. 23 Statement of Changes in Equity pag. 24 NOTES TO THE CONSOLIDATATED FINANCIAL STATEMENTS Information on performance pag. 25
Balance Sheet information pag. 45 Information on P&L account pag. 70 Information by segment pag .78 ANNEXES
1
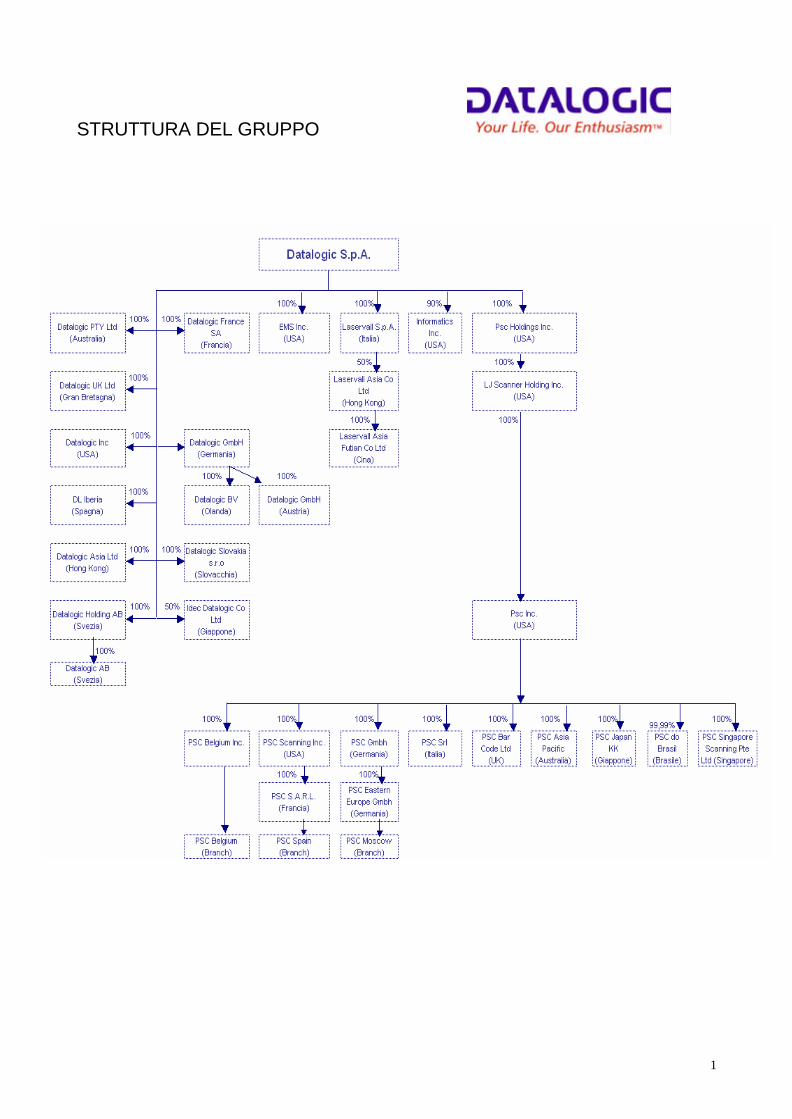
STRUTTURA DEL GRUPPO
2
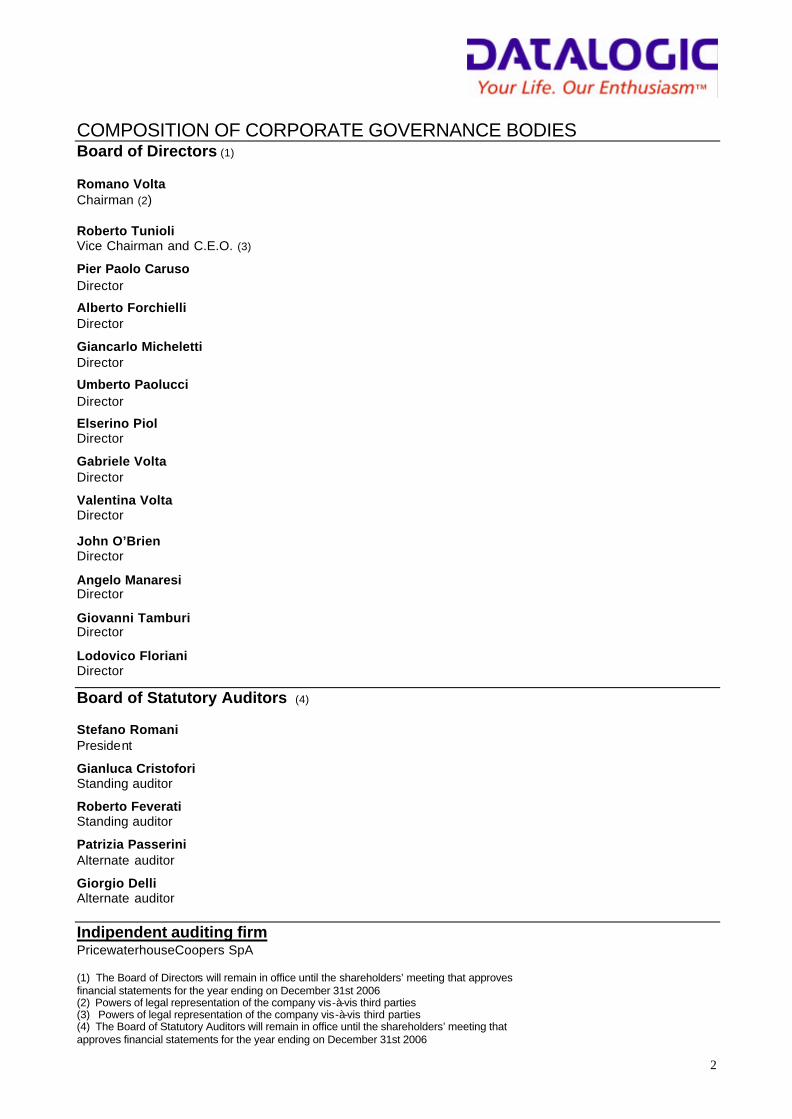
COMPOSITION OF CORPORATE GOVERNANCE BODIES Board of Directors (1)
Romano Volta Chairman (2)
Roberto Tunioli Vice Chairman and C.E.O. (3) Pier Paolo Caruso Director Alberto Forchielli Director Giancarlo Micheletti Director Umberto Paolucci Director Elserino Piol Director Gabriele Volta Director Valentina Volta Director John O’Brien Director
Angelo Manaresi Director
Giovanni Tamburi Director
Lodovico Floriani Director Board of Statutory Auditors (4) Stefano Romani President Gianluca Cristofori Standing auditor Roberto Feverati Standing auditor Patrizia Passerini Alternate auditor Giorgio Delli Alternate auditor
Indipendent auditing firm PricewaterhouseCoopers SpA (1) The Board of Directors will remain in office until the shareholders’ meeting that approves financial statements for the year ending on December 31st 2006 (2) Powers of legal representation of the company vis-à-vis third parties (3) Powers of legal representation of the company vis-à-vis third parties (4) The Board of Statutory Auditors will remain in office until the shareholders’ meeting that approves financial statements for the year ending on December 31st 2006
Datalogic Group
Consolidated Quarterly Report at 30/09/06 – Management Report
3
MANAGEMENT REPORT To Our Shareholders,
The report for the period ending on 30 September 2006, which we herewith submit to you for review, has
been prepared in compliance with the instructions accompanying the Regulations issued by Borsa Italiana
SpA.
More specifically, consolidated financial statements apply the approach envisaged by international
accounting standards (IAS/IFRS) adopted by the European Union.
OPERATING AND FINANCIAL RESULTS
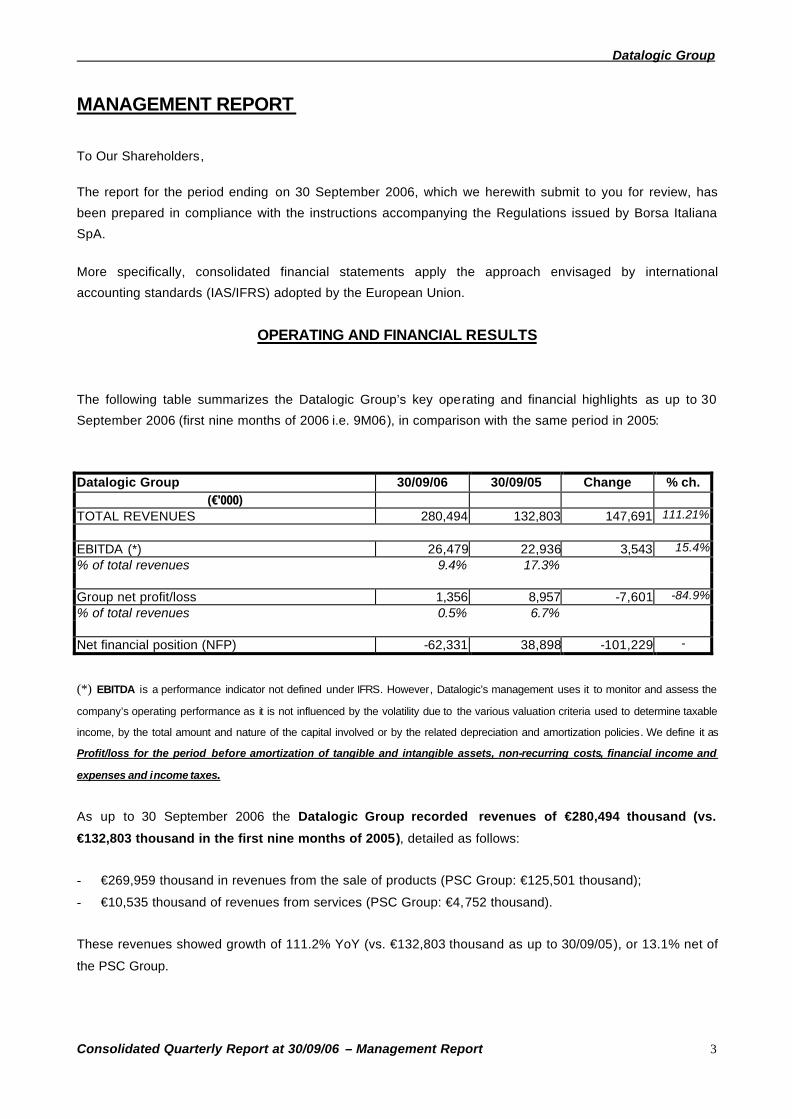
The following table summarizes the Datalogic Group’s key operating and financial highlights as up to 30
September 2006 (first nine months of 2006 i.e. 9M06), in comparison with the same period in 2005:
Datalogic Group 30/09/06 30/09/05 Change % ch.
(€'000) TOTAL REVENUES 280,494 132,803 147,691 111.21% EBITDA (*) 26,479 22,936 3,543 15.4%% of total revenues 9.4% 17.3% Group net profit/loss 1,356 8,957 -7,601 -84.9%% of total revenues 0.5% 6.7% Net financial position (NFP) -62,331 38,898 -101,229 -
(*) EBITDA is a performance indicator not defined under IFRS. However, Datalogic’s management uses it to monitor and assess the
company’s operating performance as it is not influenced by the volatility due to the various valuation criteria used to determine taxable
income, by the total amount and nature of the capital involved or by the related depreciation and amortization policies. We define it as
Profit/loss for the period before amortization of tangible and intangible assets, non-recurring costs, financial income and
expenses and income taxes.
As up to 30 September 2006 the Datalogic Group recorded revenues of €280,494 thousand (vs.
€132,803 thousand in the first nine months of 2005), detailed as follows:
- €269,959 thousand in revenues from the sale of products (PSC Group: €125,501 thousand);
- €10,535 thousand of revenues from services (PSC Group: €4,752 thousand).
These revenues showed growth of 111.2% YoY (vs. €132,803 thousand as up to 30/09/05), or 13.1% net of
the PSC Group.

Datalogic Group
Consolidated Quarterly Report at 30/09/06 – Management Report
4
Group EBITDA was €26,479 thousand (PSC Group: €4,229 thousand), a 9.4% margin on total
revenues (14.8% net of the PSC Group). The increase YoY totalled €3,543 thousand (+15.4% vs.
€22,936 thousand at 30 September 2005, -3% net of the PSC Group).
Compared with the same period in 2005, the scope of consolidation has changed due to the acquisition, on
30 November 2005, of the American company PSC which has been consolidated since December 2005.
Net profit as up to 30 September 2006 totalled €1,356 thousand. This result is positive despite the negative
performance (due largely to extraordinary and non-recurring activities, details of which are given below)
posted by PSC (net profit of €-6,244 thousand as up to 30 September 2006). The table below details the key
operating results (including costs relating to the acquisition and intersegment revenues of €535 thousand)
recorded as up to 30 September 2006.
(€'000) 30/09/06
PSC 30/09/06
Acquisition costs 30/09/06
Provisions to Restructuring Fund
30/09/06 PSC net of
acquisition costs Total revenues 130,253 130,253
Cost of sales (81,455) (81,455)
Gross profit 48,798 0 0 48,798
Other revenues 0 0Research and development expenses
(8,990) (8,990)
Distribution expenses (30,973) (30.973)General & administrative expenses
(7,207) (7,207)
Other operating costs (766) (766)
Earnings before interests, taxes, acquisition and not recurring (EBITANR)
862 0 0 862
Non-recurring costs and revenues
(5,434) 3,476 1,907 (51)
Depreciation & amortization due to acquisitions
(1,825) 1,825 0
EBIT (6,397) 5,301 1,907 811% of total revenues -4.91% 0.62%
Depreciation of tangible assets (2,671) (2,671)Amortization of intangible assets (696) (696)
EBITDA 4,229 0 0 4,229% of total revenues 3.25% 3.25%

Datalogic Group
Consolidated Quarterly Report at 30/09/06 – Management Report
5
On the whole, Datalogic's expenses for the acquisition came to €5,301 thousand, as follows:
- adjustment of assets and liabilities to market value as of the date of acquisition (€980 thousand);
- amortization of intangible assets due to the allocation of the differences between PSC's purchase price
and net equity (€1,825 thousand gross of taxes);
- other costs related to the PSC acquisition (€2,496 thousand).
In addition, a provision of €1,907 thousand was made to help pay for a restructuring and development plan,
one effect of which is that 60 staff members have been cut for eventual savings of over 4.4 million dollars per
year.

Datalogic Group
Consolidated Quarterly Report at 30/09/06 – Management Report
6
A return to profitability for PSC is one of Datalogic's top priorities. This year has already given comforting
results in terms of improved profitability, thanks to the restructuring of the company. In the third quarter
EBITDA was €2,597 thousand (6% of sales) compared with €350 thousand (1% of sales) and €1,282
thousand (3% of sales) respectively in the first and second quarters of the current financial year.
Below, a more precise picture of PSC's ordinary profitability during the nine months is provided in the form of
an adjusted income statement, which factors out the effects of the restructuring on the assumption that the
savings in operating costs (4.4 million dollars per year) already applied to the first nine months of the year:
ADJUSTED INCOME STATEMENT
(€'000) 30/09/06
PSC net of acquisition costs
30/09/06 PSC adjustment
30/09/06 Adjusted PSC
Total revenues 130,253 130.253
Cost of sales (81,455) 68 (81,387)
Gross profit 48,798 68 48,866
Other revenues 0 0 Research and development expenses (8,990) 112 (8,878) Distribution expenses (30,973) 912 (30,061) General & administrative expenses (7,207) 87 (7,120) Other operating costs (766) (766)
Earnings before interests, taxes, acquisition and not recurring (EBITANR)
862 1,180 2,042
Non-recurring costs and revenues (51) (51) Depreciation & amortization due to acquisitions
0 0
EBIT 811 1,180 1,991 % of total revenues 0.62% 1.53%
Depreciation of tangible assets (2,671) (2,671) Amortization of intangible assets (696) (696)
EBITDA 4,229 1,180 5,409 % of total revenues 3.25% 4.15%
Datalogic Group
Consolidated Quarterly Report at 30/09/06 – Management Report
7
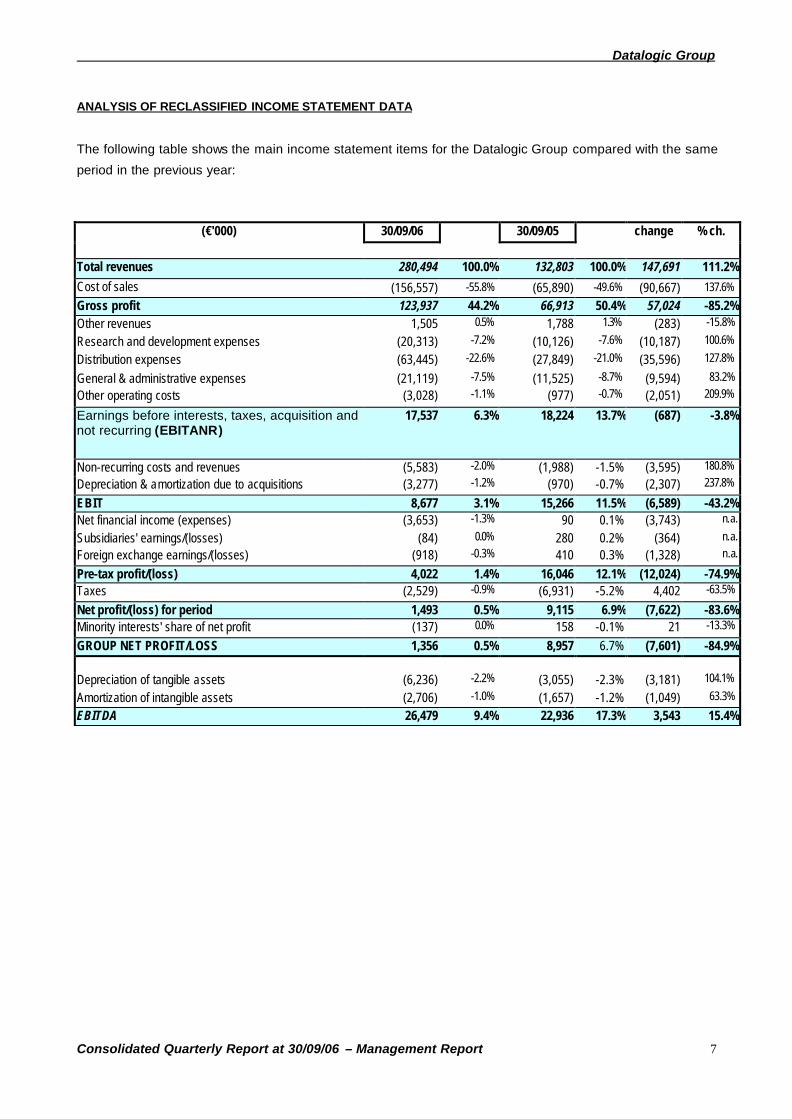
ANALYSIS OF RECLASSIFIED INCOME STATEMENT DATA
The following table shows the main income statement items for the Datalogic Group compared with the same
period in the previous year:
(€'000) 30/09/06 30/09/05 change % ch.
Total revenues 280,494 100.0% 132,803 100.0% 147,691 111.2%
Cost of sales (156,557) -55.8% (65,890) -49.6% (90,667) 137.6%
Gross profit 123,937 44.2% 66,913 50.4% 57,024 -85.2% Other revenues 1,505 0.5% 1,788 1.3% (283) -15.8%
Research and development expenses (20,313) -7.2% (10,126) -7.6% (10,187) 100.6%
Distribution expenses (63,445) -22.6% (27,849) -21.0% (35,596) 127.8%
General & administrative expenses (21,119) -7.5% (11,525) -8.7% (9,594) 83.2%
Other operating costs (3,028) -1.1% (977) -0.7% (2,051) 209.9%
Earnings before interests, taxes, acquisition and not recurring (EBITANR)
17,537 6.3% 18,224 13.7% (687) -3.8%
Non-recurring costs and revenues (5,583) -2.0% (1,988) -1.5% (3,595) 180.8%
Depreciation & amortization due to acquisitions (3,277) -1.2% (970) -0.7% (2,307) 237.8%
EBIT 8,677 3.1% 15,266 11.5% (6,589) -43.2% Net financial income (expenses) (3,653) -1.3% 90 0.1% (3,743) n.a.
Subsidiaries' earnings/(losses) (84) 0.0% 280 0.2% (364) n.a.
Foreign exchange earnings/(losses) (918) -0.3% 410 0.3% (1,328) n.a.
Pre-tax profit/(loss) 4,022 1.4% 16,046 12.1% (12,024) -74.9% Taxes (2,529) -0.9% (6,931) -5.2% 4,402 -63.5%
Net profit/(loss) for period 1,493 0.5% 9,115 6.9% (7,622) -83.6% Minority interests' share of net profit (137) 0.0% 158 -0.1% 21 -13.3%
GROUP NET PROFIT/LOSS 1,356 0.5% 8,957 6.7% (7,601) -84.9%
Depreciation of tangible assets (6,236) -2.2% (3,055) -2.3% (3,181) 104.1%
Amortization of intangible assets (2,706) -1.0% (1,657) -1.2% (1,049) 63.3%
EBITDA 26,479 9.4% 22,936 17.3% 3,543 15.4%
Datalogic Group
Consolidated Quarterly Report at 30/09/06 – Management Report
8
Following the introduction of IAS/IFRS, non-recurring or extraordinary costs are no longer shown separately
in financial statements below the operating line but are included in ordinary operating figures.
In order to assure better representation of the Group’s ordinary profitability, we have preferred – in all tables
in this section concerning information on operating performance – to show an operating result before the
impact of non-recurring costs/income and of depreciation and amortization due to acquisitions, which we
have called EBITANR (Earnings before interests, taxes, acquisition and not recurring). To permit comparability with
detailed official accounting statements, we have in any case included a further intermediate profit margin
(called “Operating result”) that includes non-recurring costs/income and depreciation and amortization due to
acquisitions and matches figure reported in year-end financial statements.
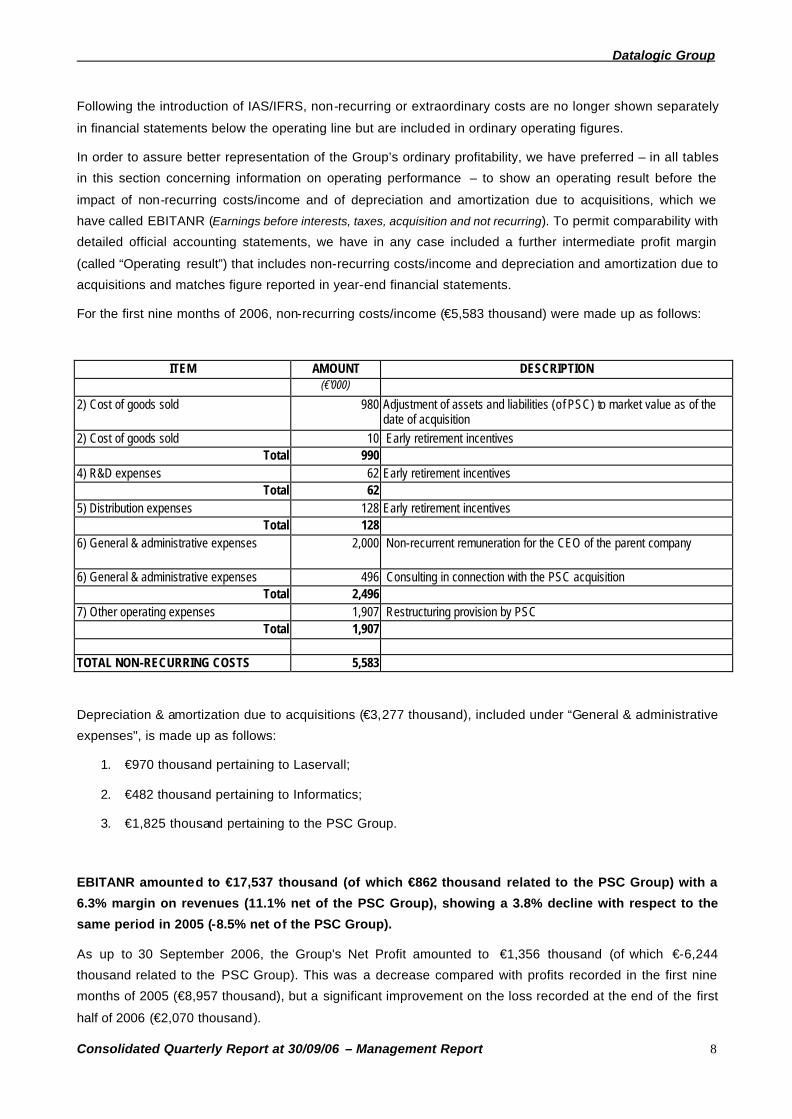
For the first nine months of 2006, non-recurring costs/income (€5,583 thousand) were made up as follows:
ITEM AMOUNT DESCRIPTION (€'000)
2) Cost of goods sold 980 Adjustment of assets and liabilities (of PSC) to market value as of the date of acquisition
2) Cost of goods sold 10 Early retirement incentives Total 990
4) R&D expenses 62 Early retirement incentives Total 62
5) Distribution expenses 128 Early retirement incentives Total 128
6) General & administrative expenses 2,000 Non-recurrent remuneration for the CEO of the parent company
6) General & administrative expenses 496 Consulting in connection with the PSC acquisition Total 2,496
7) Other operating expenses 1,907 Restructuring provision by PSC Total 1,907
TOTAL NON-RECURRING COSTS 5,583
Depreciation & amortization due to acquisitions (€3,277 thousand), included under “General & administrative
expenses", is made up as follows:
1. €970 thousand pertaining to Laservall;
2. €482 thousand pertaining to Informatics;
3. €1,825 thousand pertaining to the PSC Group.
EBITANR amounted to €17,537 thousand (of which €862 thousand related to the PSC Group) with a
6.3% margin on revenues (11.1% net of the PSC Group), showing a 3.8% decline with respect to the
same period in 2005 (-8.5% net of the PSC Group).
As up to 30 September 2006, the Group's Net Profit amounted to €1,356 thousand (of which €-6,244
thousand related to the PSC Group). This was a decrease compared with profits recorded in the first nine
months of 2005 (€8,957 thousand), but a significant improvement on the loss recorded at the end of the first
half of 2006 (€2,070 thousand).
Datalogic Group
Consolidated Quarterly Report at 30/09/06 – Management Report
9
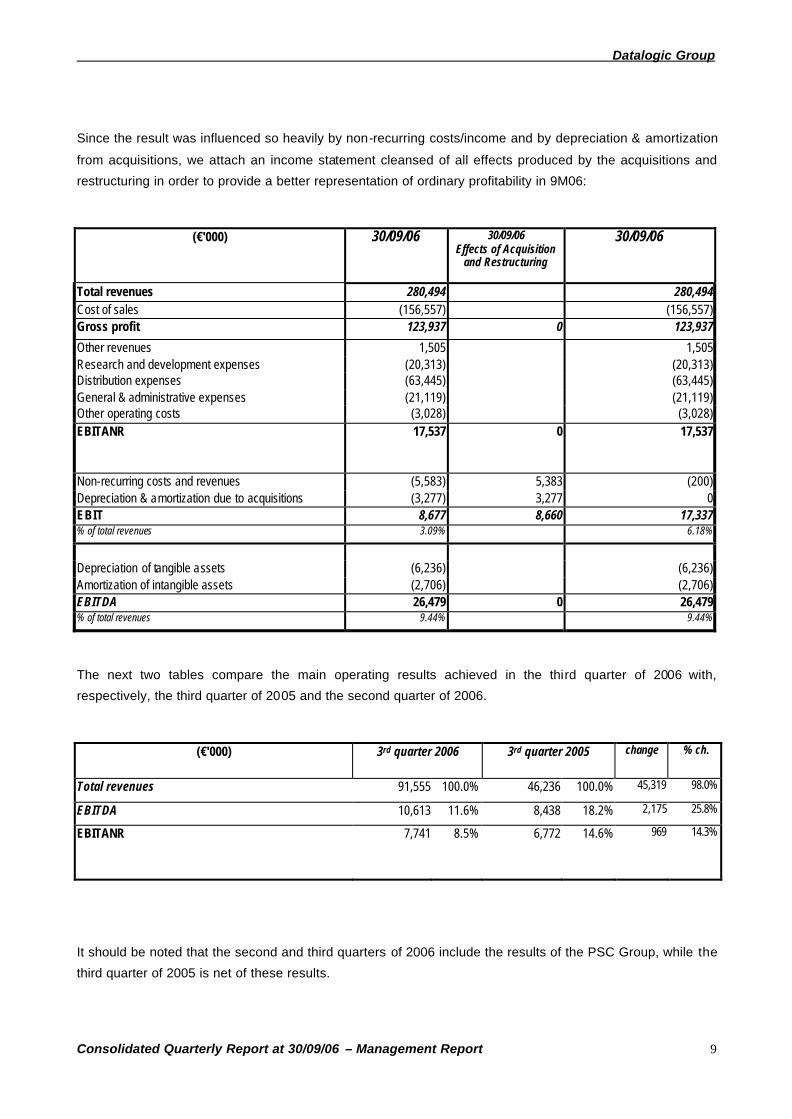
Since the result was influenced so heavily by non-recurring costs/income and by depreciation & amortization
from acquisitions, we attach an income statement cleansed of all effects produced by the acquisitions and
restructuring in order to provide a better representation of ordinary profitability in 9M06:
(€'000) 30/09/06 30/09/06 Effects of Acquisition
and Restructuring
30/09/06
Total revenues 280,494 280,494Cost of sales (156,557) (156,557)Gross profit 123,937 0 123,937
Other revenues 1,505 1,505Research and development expenses (20,313) (20,313)Distribution expenses (63,445) (63,445)General & administrative expenses (21,119) (21,119)Other operating costs (3,028) (3,028)EBITANR 17,537 0 17,537
Non-recurring costs and revenues (5,583) 5,383 (200)Depreciation & amortization due to acquisitions (3,277) 3,277 0EBIT 8,677 8,660 17,337% of total revenues 3.09% 6.18%
Depreciation of tangible assets (6,236) (6,236)Amortization of intangible assets (2,706) (2,706)EBITDA 26,479 0 26,479% of total revenues 9.44% 9.44%
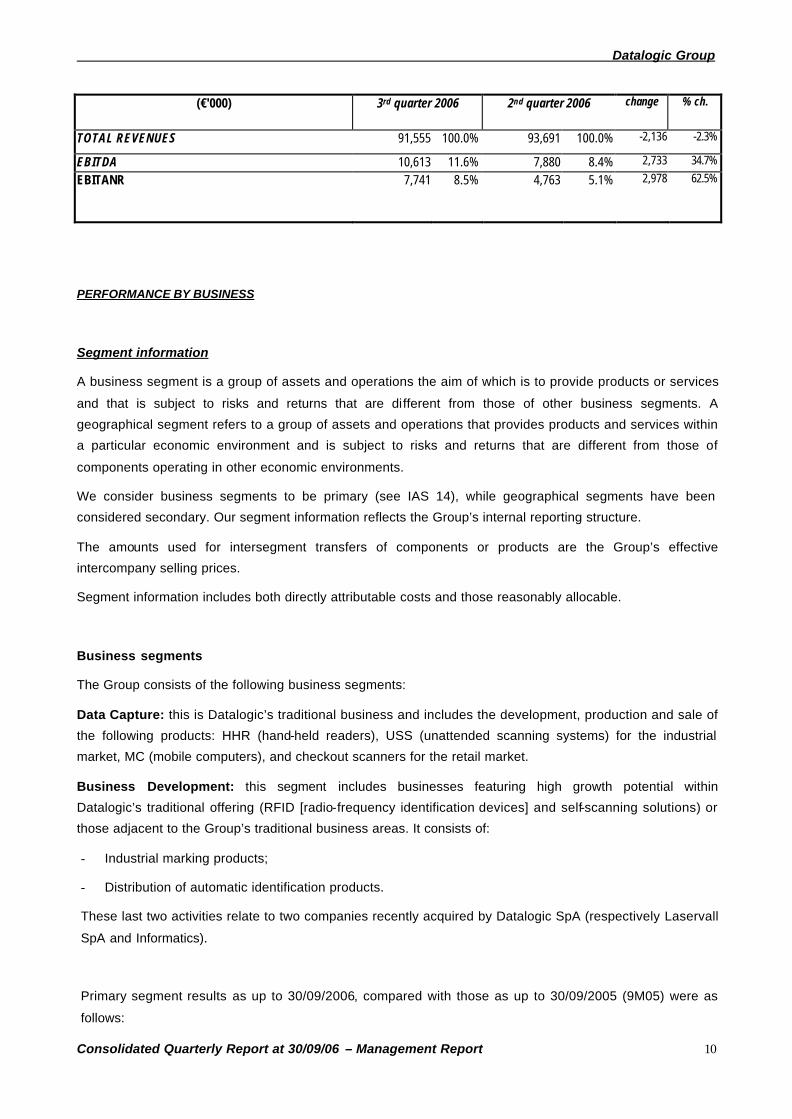
The next two tables compare the main operating results achieved in the third quarter of 2006 with,
respectively, the third quarter of 2005 and the second quarter of 2006.
(€'000) 3rd quarter 2006 3rd quarter 2005 change % ch.
Total revenues 91,555 100.0% 46,236 100.0% 45,319 98.0%
EBITDA 10,613 11.6% 8,438 18.2% 2,175 25.8%
EBITANR 7,741 8.5% 6,772 14.6% 969 14.3%
It should be noted that the second and third quarters of 2006 include the results of the PSC Group, while the
third quarter of 2005 is net of these results.
Datalogic Group
Consolidated Quarterly Report at 30/09/06 – Management Report
10
(€'000) 3rd quarter 2006 2nd quarter 2006 change % ch.
TOTAL REVENUES 91,555 100.0% 93,691 100.0% -2,136 -2.3%
EBITDA 10,613 11.6% 7,880 8.4% 2,733 34.7%
EBITANR 7,741 8.5% 4,763 5.1% 2,978 62.5%
PERFORMANCE BY BUSINESS
Segment information
A business segment is a group of assets and operations the aim of which is to provide products or services
and that is subject to risks and returns that are different from those of other business segments. A
geographical segment refers to a group of assets and operations that provides products and services within
a particular economic environment and is subject to risks and returns that are different from those of
components operating in other economic environments.
We consider business segments to be primary (see IAS 14), while geographical segments have been
considered secondary. Our segment information reflects the Group’s internal reporting structure.
The amounts used for intersegment transfers of components or products are the Group’s effective
intercompany selling prices.
Segment information includes both directly attributable costs and those reasonably allocable.
Business segments
The Group consists of the following business segments:
Data Capture: this is Datalogic’s traditional business and includes the development, production and sale of
the following products: HHR (hand-held readers), USS (unattended scanning systems) for the industrial
market, MC (mobile computers), and checkout scanners for the retail market.
Business Development: this segment includes businesses featuring high growth potential within
Datalogic’s traditional offering (RFID [radio-frequency identification devices] and self-scanning solutions) or
those adjacent to the Group’s traditional business areas. It consists of:
- Industrial marking products;
- Distribution of automatic identification products.
These last two activities relate to two companies recently acquired by Datalogic SpA (respectively Laservall
SpA and Informatics).
Primary segment results as up to 30/09/2006, compared with those as up to 30/09/2005 (9M05) were as
follows:

Datalogic Group
Consolidated Quarterly Report at 30/09/06 – Management Report
11
Data Capture
Business Development
Adjustments
Consolidated
Total (€'000) 30/09/06 30/09/05 30/09/06 30/09/05 30/09/06 30/09/05 30/09/06 30/09/05
External sales 224,697 90,959 55,797 41,844 280,494 132,803 Intersegment sales 755 35 35 28 (790) 63
-
- Total revenues 225,452 90,994 55,832 41,872 (790) 63 280,494 132,803 Cost of goods sold 130,257 44,960 26,300 20,960 (32) 156,557 65,888 Intersegment cost of goods sold 35 7 755 26 (790) (33)
- 0
Gross profit 95,160 46,027 28,777 20,886 -
2 123,937 66,915
% of revenues 42.21% 50.58% 51.54% 49.88% 0.00% -3.17% 44.19% 50.39% Other allocable revenues 1,279 1,636 226 152 1,505 1,788 Other intersegment revenues 282 222
-
- 282 222
-
- Allocable operating costs: 86,093 34,179 18,005 13,854 (282) (396) 103,816 47,637 % of revenues 38.19% 37.56% 32.25% 33.09% 35.70% 628.57% 37.01% 35.87% R&D expenses 17,262 7,642 3,063 2,484 (12) 20,313 10,126 Distribution expenses 53,707 20,098 10,008 7,967 (270) (215) 63,445 27,850 Allocable G&A costs 13,249 5,835 4,681 3,029
-(181) 17,930 8,683
Other allocable operating costs 1,875 604 253 374 2,128 978 SEGMENT RESULT 10,628 13,705 10,998 7,184
-176 21,626 21,065
% of revenues 4.71% 15.06% 19.70% 17.16% 0.00% -279.37% 7.71% 15.86% Unallocable G&A costs
- 3,189 2,841
Other unallocable operating costs
900
EBITANR 10,628 13,705 10,998 7,184 -
176 17,537 18,224
% of revenues 4.71% 15.06% 19.70% 17.16% 0.00% -279.37% 6.25% 13.72% Allocable non-recurring costs/revenues
(5,583) (311) 1,677 (5,583) (1,988)
Unallocable non-recurring costs/revenues
-
Amortization due to acquisitions (1,825) (1,452) (970) (3,277) (970) Net financial income (expenses) (4,571) 500 Share of associates’ profit (324) 57 240 223 (84) 280 Income taxes
- (2,529) (6,931)
NET PROFIT/LOSS 2,896 13,451 9,786 4,760 -
176 1,493 9,115
% of revenues 1.28% 14.78% 17.53% 11.37% 0.00% -279.37% 0.53% 6.86% Minority interests’ share of net profit/loss
137 137 158
GROUP NET PROFIT/LOSS 2,896 13,451 9,649 4,760 -
176 1,356 8,957
% of revenues 1.28% 14.78% 17.28% 11.37% 0.00% -279.37% 0.48% 6.74%
Datalogic Group
Consolidated Quarterly Report at 30/09/06 – Management Report
12
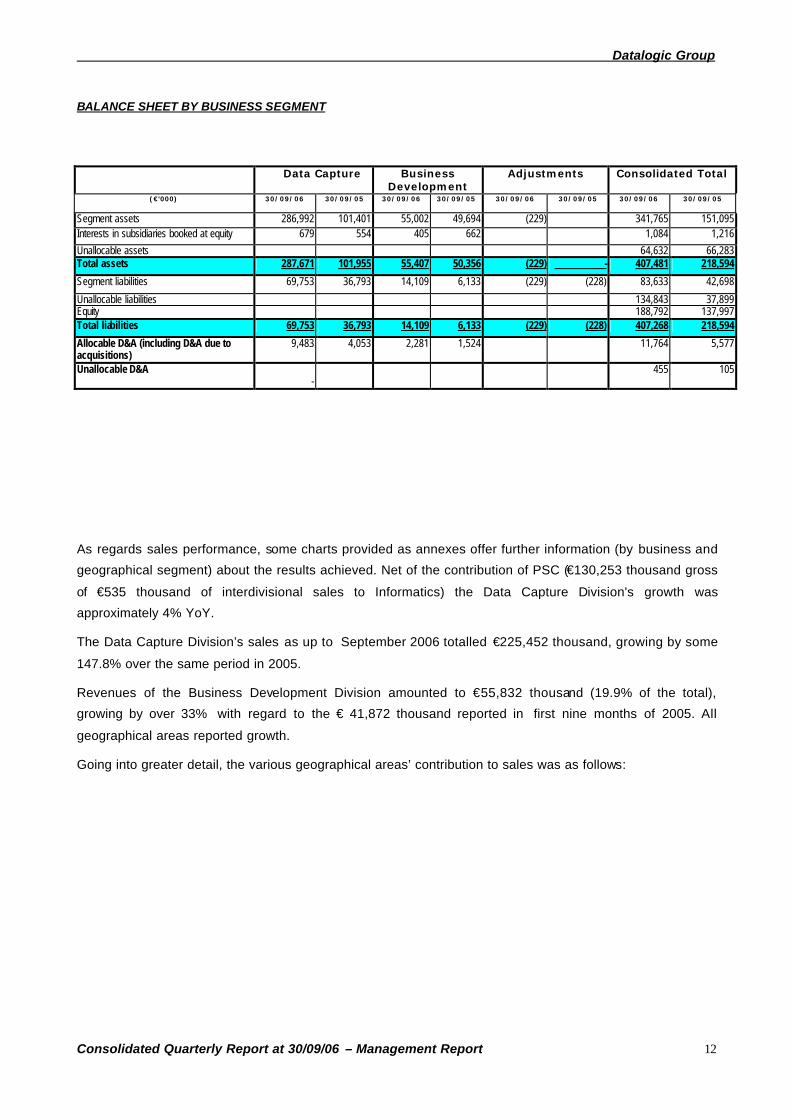
BALANCE SHEET BY BUSINESS SEGMENT
Data Capture Business
Development Adjustments Consolidated Total
(€'000) 30/09/06 30/09/05 30/09/06 30/09/05 30/09/06 30/09/05 30/09/06 30/09/05
Segment assets 286,992 101,401 55,002 49,694 (229) 341,765 151,095 Interests in subsidiaries booked at equity 679 554 405 662 1,084 1,216
Unallocable assets 64,632 66,283 Total assets 287,671 101,955 55,407 50,356 (229) - 407,481 218,594
Segment liabilities 69,753 36,793 14,109 6,133 (229) (228) 83,633 42,698
Unallocable liabilities 134,843 37,899 Equity 188,792 137,997 Total liabilities 69,753 36,793 14,109 6,133 (229) (228) 407,268 218,594
Allocable D&A (including D&A due to acquisitions)
9,483 4,053 2,281 1,524 11,764 5,577
Unallocable D&A -
455 105
As regards sales performance, some charts provided as annexes offer further information (by business and
geographical segment) about the results achieved. Net of the contribution of PSC (€130,253 thousand gross
of €535 thousand of interdivisional sales to Informatics) the Data Capture Division's growth was
approximately 4% YoY.
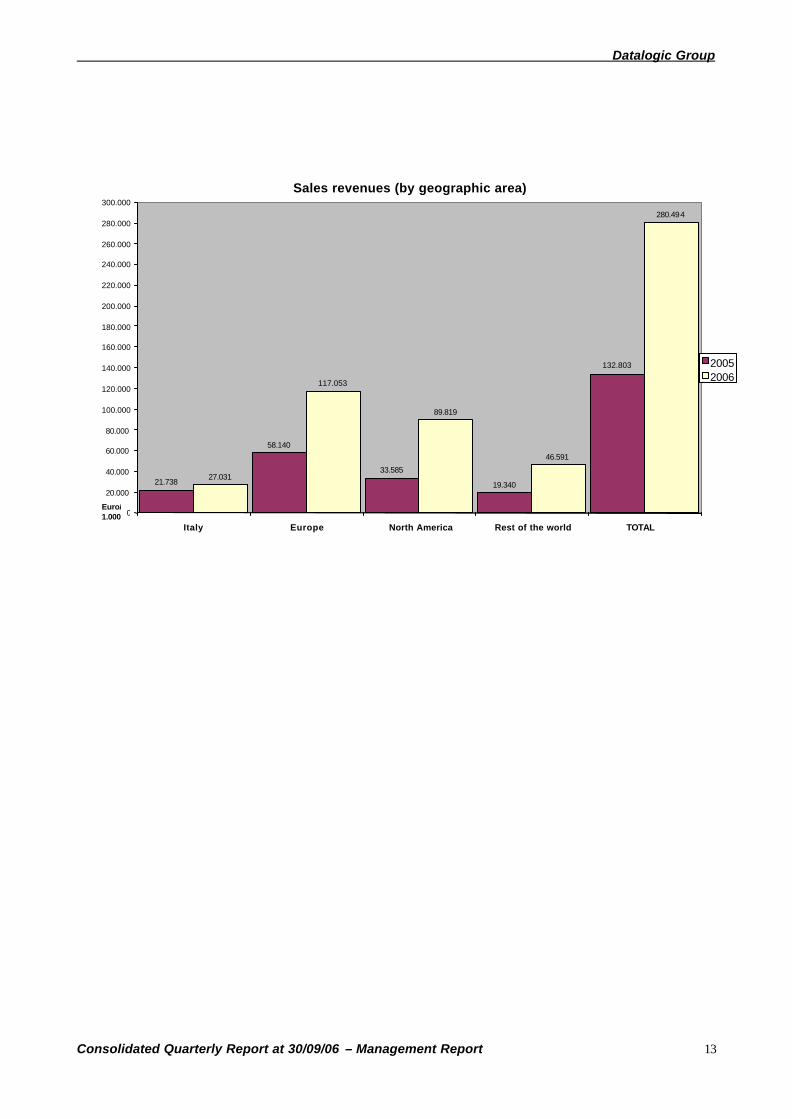
The Data Capture Division’s sales as up to September 2006 totalled €225,452 thousand, growing by some
147.8% over the same period in 2005.
Revenues of the Business Development Division amounted to €55,832 thousand (19.9% of the total),
growing by over 33% with regard to the € 41,872 thousand reported in first nine months of 2005. All
geographical areas reported growth.
Going into greater detail, the various geographical areas’ contribution to sales was as follows:
Datalogic Group
Consolidated Quarterly Report at 30/09/06 – Management Report
13
Sales revenues (by geographic area)
21.738
58.140
33.585 19.340
27.031
117.053
89.819
46.591
280.494
132.803
0
20.000
40.000
60.000
80.000
100.000
120.000
140.000
160.000
180.000
200.000
220.000
240.000
260.000
280.000
300.000
Italy Europe North America Rest of the world TOTAL
Euro/1.000
2005 2006
Datalogic Group
Consolidated Quarterly Report at 30/09/06 – Management Report
14
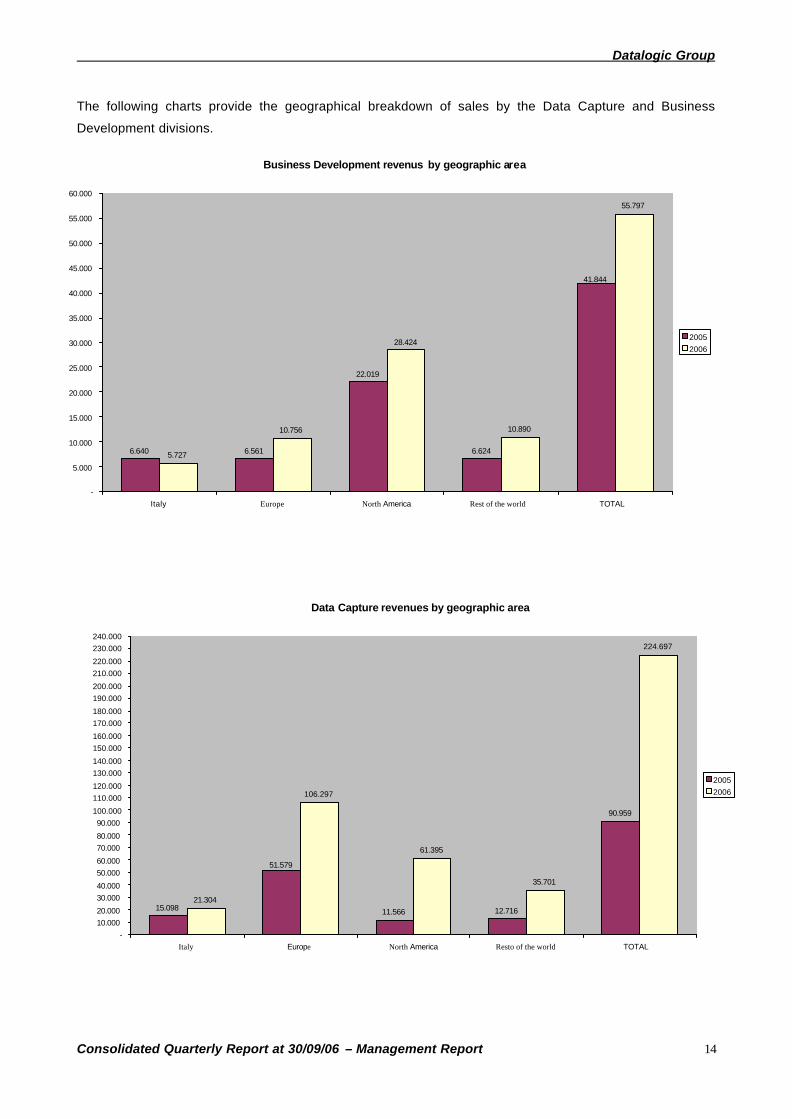
The following charts provide the geographical breakdown of sales by the Data Capture and Business
Development divisions.
Business Development revenus by geographic area
6.640 6.561
22.019
6.624 5.727
10.756
28.424
10.890
55.797
41.844
-
5.000
10.000
15.000
20.000
25.000
30.000
35.000
40.000
45.000
50.000
55.000
60.000
Italy Europe North America Rest of the world TOTAL
2005 2006
Data Capture revenues by geographic area
15.098 11.566 12.716
90.959
21.304
106.297
61.395
35.701
224.697
51.579
- 10.000 20.000 30.000 40.000 50.000 60.000 70.000 80.000 90.000
100.000 110.000 120.000 130.000 140.000 150.000 160.000 170.000 180.000 190.000 200.000 210.000 220.000 230.000 240.000
Italy Europe North America Resto of the world TOTAL
2005 2006
Datalogic Group
Consolidated Quarterly Report at 30/09/06 – Management Report
15
The cost of goods sold increased from 49.6% of sales in the same period of 2005 to 55.8%.
The main reason for this trend is the consolidation of PSC, which has a higher cost of goods sold than the
rest of the division (62.5% of PSC's revenues for the first nine months of 2006).
Gross profit increased from €66,915 thousand in 9M05 to €123,937 thousand in 9M06 (+85%). A significant
contribution was made to this result by both the Business Development division (+37.8%), and, above all, the
Data Capture division (+106.75% YoY).
Operating costs attributable to the divisions amounted to €103,816 thousand as up to 30 September 2006
(+118% compared with €47,637 thousand reported in the same period of 2005). Of this total, €86,093
thousand of costs related to the Data Capture division (+152% vs. 2005) and €18,005 thousand to the
Business Development division (+30% vs. 2005), gross of €282 thousand of interdivisional operating costs.
In greater detail, the Data Capture division featured:
• an increase in research & development expenses, which as up to 30 September 2006, totalled €17,262
thousand (of which €8,990 thousand pertaining to the PSC Group) or 7.7% of the division's total
revenues, a rise of 125.9% on the previous year (+8.2% net of PSC);
• a 127% increase in allocable general & administrative expenses (+3% net of PSC), which came to
€13,249 thousand for the period (of which €7,207 thousand pertaining to the PSC Group) compared with
€5,835 thousand in the previous year;
• a 167.2% increase in distribution expenses (+13% net of PSC), which came to €53,707 as up to 30
September 2006, compared with €20,098 thousand in the same period in 2005.
Other operating costs (totalling €1,875 thousand) were up 210% YoY, due largely to a provision for doubtful
accounts of €657 thousand.
The other unallocable operating costs are comprised of a €900 thousand provision made by the parent
company for a long-term management incentive plan due to mature in 2008.
The Business Development division featured:
• an increase in research & development expenses, which as up to 30 September 2006, totalled €3,063
thousand or 5.6% of the division's total revenues, a rise of 23.3% on the previous year;
• a 55% increase in allocable general & administrative expenses, which came to €4,681 thousand for the
period compared with €3,029 thousand in the previous year: most of the increase relates to Informatics,
due to a rise in payroll and employee benefit costs (€487 thousand) in connection with an incentive
scheme;
• a 26% increase in distribution expenses, which came to €10,008 as up to 30 September 2006, compared
with €7,967 thousand in the same period in 2005.
Datalogic Group
Consolidated Quarterly Report at 30/09/06 – Management Report
16
The Data Capture division’s segment result (i.e. before non-allocable general and administrative expenses)
amounted to €10,628 thousand, down from €13,705 thousand in 2005.
The Business Development division’s segment result totalled €10,998 thousand, strong growth (+53%) over
the €7,184 thousand reported in 2005.
Segment results do not include €900 thousand in other unallocable operating costs, and €3,189 thousand in
unallocable general and administrative costs.
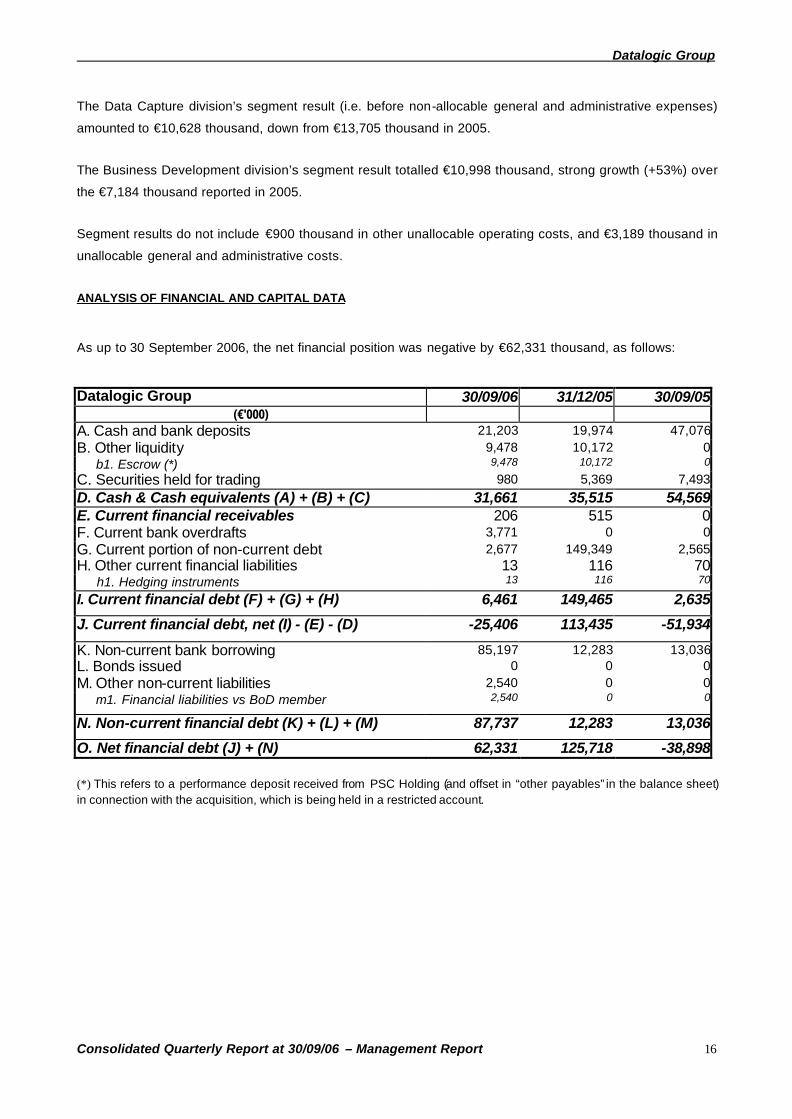
ANALYSIS OF FINANCIAL AND CAPITAL DATA As up to 30 September 2006, the net financial position was negative by €62,331 thousand, as follows: Datalogic Group 30/09/06 31/12/05 30/09/05
(€'000) A. Cash and bank deposits 21,203 19,974 47,076B. Other liquidity 9,478 10,172 0 b1. Escrow (*) 9,478 10,172 0
C. Securities held for trading 980 5,369 7,493D. Cash & Cash equivalents (A) + (B) + (C) 31,661 35,515 54,569E. Current financial receivables 206 515 0F. Current bank overdrafts 3,771 0 0G. Current portion of non-current debt 2,677 149,349 2,565H. Other current financial liabilities 13 116 70 h1. Hedging instruments 13 116 70
I. Current financial debt (F) + (G) + (H) 6,461 149,465 2,635
J. Current financial debt, net (I) - (E) - (D) -25,406 113,435 -51,934
K. Non-current bank borrowing 85,197 12,283 13,036L. Bonds issued 0 0 0M. Other non-current liabilities 2,540 0 0 m1. Financial liabilities vs BoD member 2,540 0 0
N. Non-current financial debt (K) + (L) + (M) 87,737 12,283 13,036
O. Net financial debt (J) + (N) 62,331 125,718 -38,898 (*) This refers to a performance deposit received from PSC Holding (and offset in “other payables” in the balance sheet) in connection with the acquisition, which is being held in a restricted account.
Datalogic Group
Consolidated Quarterly Report at 30/09/06 – Management Report
17
The net financial position as up to 30 September 2006 improved by €63,387 thousand with respect to 31
December 2005 (€-125,718 thousand), but worsened by €101,229 thousand year-on-year (€39,898
thousand in 9M05).
The main cause of the improvement in the first nine months of 2006 was the capital increase undertaken by
Datalogic SpA and completed in January. This involved 3,465,868 shares (13,863,472 after the split) for a
value of €76.6 million (before taxes).
In addition, dividends of €3,489 thousand were paid and treasury shares of €4,123 thousand were
purchased.
Lastly, the second and third earn-outs on the purchase of Laservall Spa were paid in the amount of €3,000.
Net working capital as up to 30 September 2006 totalled €71,910 thousand and increased by €597 thousand
with regard to 31 December 2005 (€71,313 thousand).
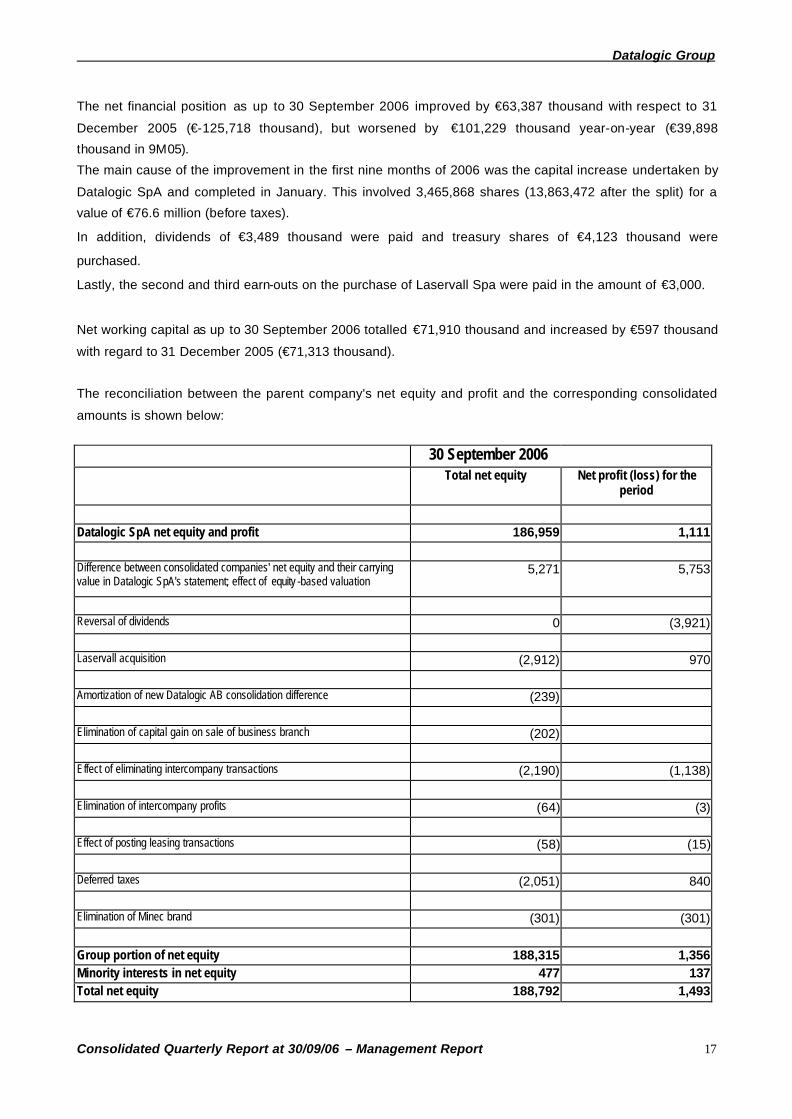
The reconciliation between the parent company's net equity and profit and the corresponding consolidated
amounts is shown below:
30 September 2006
Total net equity Net profit (loss) for the period
Datalogic SpA net equity and profit 186,959 1,111
Difference between consolidated companies' net equity and their carrying value in Datalogic SpA's statement; effect of equity -based valuation
5,271 5,753
Reversal of dividends 0 (3,921) Laservall acquisition (2,912) 970 Amortization of new Datalogic AB consolidation difference (239) Elimination of capital gain on sale of business branch (202) Effect of eliminating intercompany transactions (2,190) (1,138) Elimination of intercompany profits (64) (3)
Effect of posting leasing transactions (58) (15) Deferred taxes (2,051) 840
Elimination of Minec brand (301) (301)
Group portion of net equity 188,315 1,356 Minority interests in net equity 477 137 Total net equity 188,792 1,493
Datalogic Group
Consolidated Quarterly Report at 30/09/06 – Management Report
18
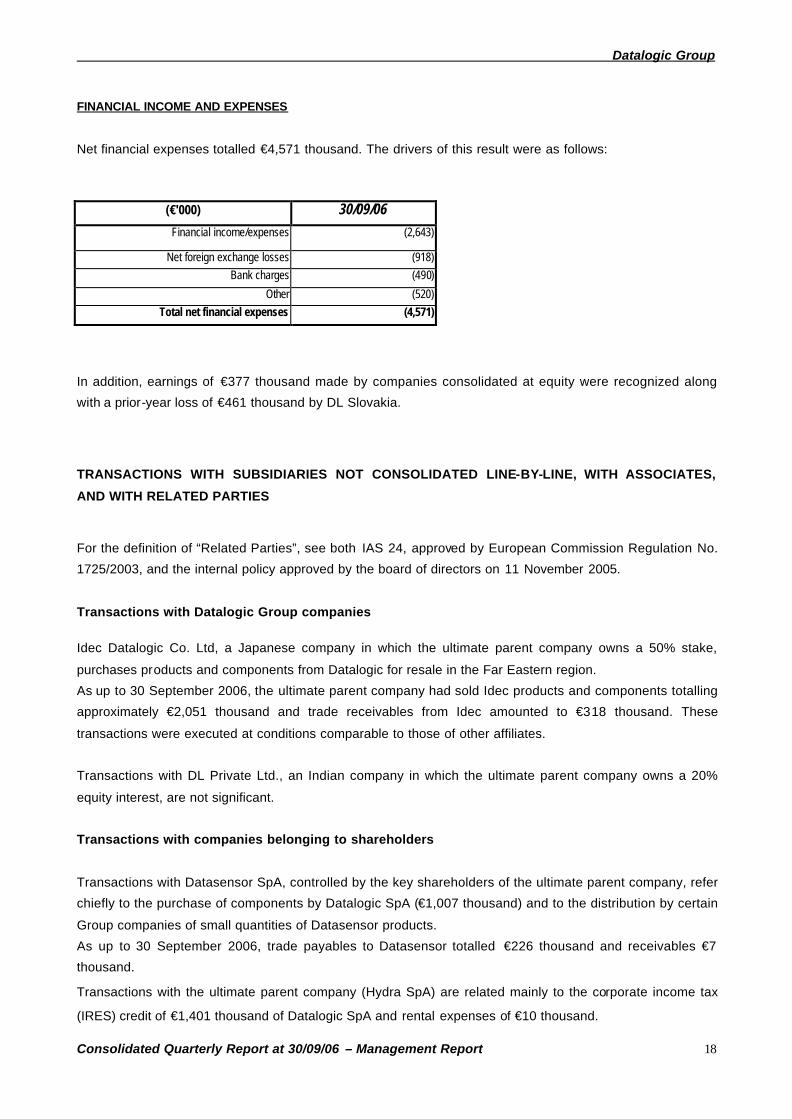
FINANCIAL INCOME AND EXPENSES
Net financial expenses totalled €4,571 thousand. The drivers of this result were as follows:
(€'000) 30/09/06 Financial income/expenses (2,643)
Net foreign exchange losses (918) Bank charges (490)
Other (520) Total net financial expenses (4,571)
In addition, earnings of €377 thousand made by companies consolidated at equity were recognized along
with a prior-year loss of €461 thousand by DL Slovakia.
TRANSACTIONS WITH SUBSIDIARIES NOT CONSOLIDATED LINE-BY-LINE, WITH ASSOCIATES,
AND WITH RELATED PARTIES
For the definition of “Related Parties”, see both IAS 24, approved by European Commission Regulation No.
1725/2003, and the internal policy approved by the board of directors on 11 November 2005.
Transactions with Datalogic Group companies
Idec Datalogic Co. Ltd, a Japanese company in which the ultimate parent company owns a 50% stake,
purchases products and components from Datalogic for resale in the Far Eastern region.
As up to 30 September 2006, the ultimate parent company had sold Idec products and components totalling
approximately €2,051 thousand and trade receivables from Idec amounted to €318 thousand. These
transactions were executed at conditions comparable to those of other affiliates.
Transactions with DL Private Ltd., an Indian company in which the ultimate parent company owns a 20%
equity interest, are not significant.
Transactions with companies belonging to shareholders
Transactions with Datasensor SpA, controlled by the key shareholders of the ultimate parent company, refer
chiefly to the purchase of components by Datalogic SpA (€1,007 thousand) and to the distribution by certain
Group companies of small quantities of Datasensor products.
As up to 30 September 2006, trade payables to Datasensor totalled €226 thousand and receivables €7
thousand.
Transactions with the ultimate parent company (Hydra SpA) are related mainly to the corporate income tax
(IRES) credit of €1,401 thousand of Datalogic SpA and rental expenses of €10 thousand.
Datalogic Group
Consolidated Quarterly Report at 30/09/06 – Management Report
19
Transactions with companies belonging to members of the Board of Directors
In the first nine months of 2006 trade transactions totalling approximately €52 thousand were carried out with
Sourcing Solution Ltd (SSG), a company owned by the director A. Forchielli.
Nebulaxis, a company held by the director John O’Brien, invoiced the parent company for €1,687 thousand
in the first nine months of 2006 for advisory services relating mainly to the acquisition of PSC.
In addition, it should be noted that under the heading "financial liabilities" are posted, in accordance with IAS
32.23, €2,540 thousand (including €38 thousand of interest accruing) pertaining to a PUT option signed by
the director John O’Brien with the parent company (which therefore has a call option) on his minority stake of
10% in Informatics Inc. This liability is offset by a negative reserve of €2,502 thousand (net of interest
accruing).
BUSINESS FORECAST FOR CURRENT YEAR AND SUBSEQUENT EVENTS
The company's plans and, in particular, the recovery in profits expected from PSC, should give the current
financial year higher revenues and EBITDA than those posted in 2005.
SECONDARY LOCATIONS
The direct parent company has two secondary locations:
- one in the town of Quinto (province of Treviso) where the MC product line’s production unit is located,
together with management offices, the design department, and staff functions of the ShopEvolution
product line;
- One in the Municipality of Castiglione di Messer Raimondo, where the USS product line’s production unit
is located.
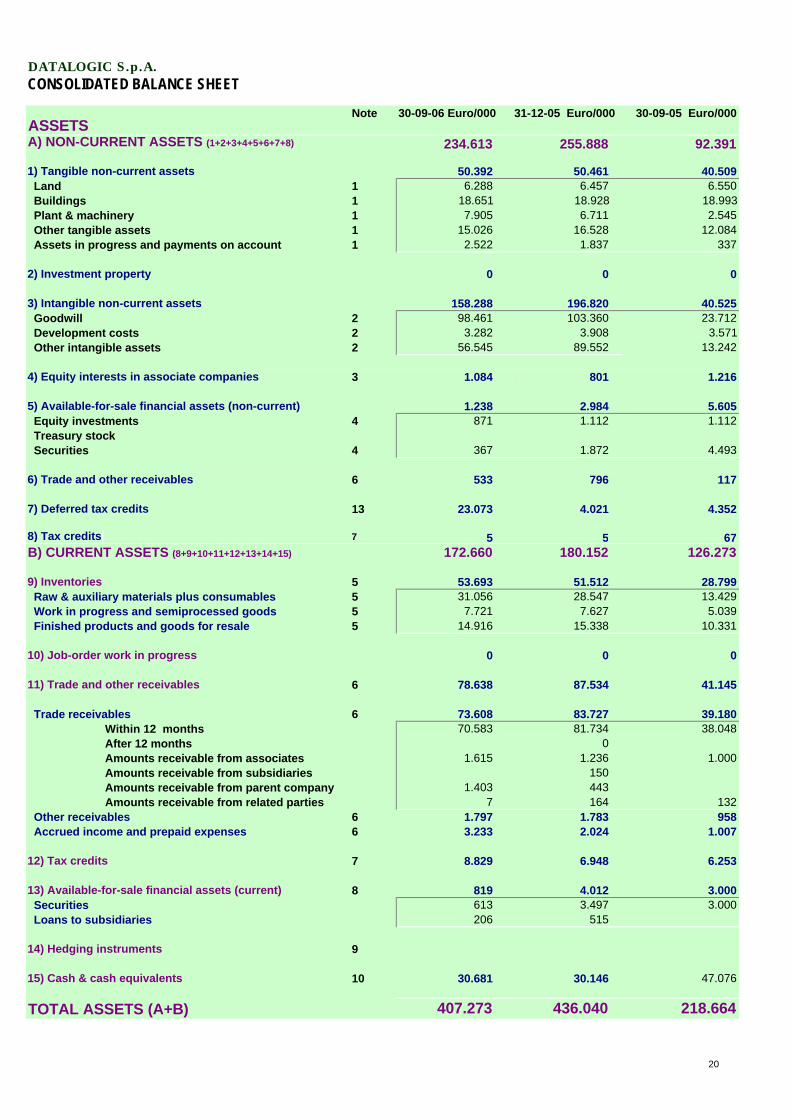
DATALOGIC S.p.A.CONSOLIDATED BALANCE SHEET
ASSETSNote 30-09-06 Euro/000 31-12-05 Euro/000 30-09-05 Euro/000
A) NON-CURRENT ASSETS (1+2+3+4+5+6+7+8) 234.613 255.888 92.391
1) Tangible non-current assets 50.392 50.461 40.509 Land 1 6.288 6.457 6.550 Buildings 1 18.651 18.928 18.993 Plant & machinery 1 7.905 6.711 2.545 Other tangible assets 1 15.026 16.528 12.084 Assets in progress and payments on account 1 2.522 1.837 337
2) Investment property 0 0 0
3) Intangible non-current assets 158.288 196.820 40.525 Goodwill 2 98.461 103.360 23.712 Development costs 2 3.282 3.908 3.571 Other intangible assets 2 56.545 89.552 13.242
4) Equity interests in associate companies 3 1.084 801 1.216
5) Available-for-sale financial assets (non-current) 1.238 2.984 5.605 Equity investments 4 871 1.112 1.112 Treasury stock Securities 4 367 1.872 4.493
6) Trade and other receivables 6 533 796 117
7) Deferred tax credits 13 23.073 4.021 4.352
8) Tax credits 7 5 5 67B) CURRENT ASSETS (8+9+10+11+12+13+14+15) 172.660 180.152 126.273
9) Inventories 5 53.693 51.512 28.799 Raw & auxiliary materials plus consumables 5 31.056 28.547 13.429 Work in progress and semiprocessed goods 5 7.721 7.627 5.039 Finished products and goods for resale 5 14.916 15.338 10.331
10) Job-order work in progress 0 0 0
11) Trade and other receivables 6 78.638 87.534 41.145
Trade receivables 6 73.608 83.727 39.180Within 12 months 70.583 81.734 38.048After 12 months 0Amounts receivable from associates 1.615 1.236 1.000Amounts receivable from subsidiaries 150Amounts receivable from parent company 1.403 443Amounts receivable from related parties 7 164 132
Other receivables 6 1.797 1.783 958 Accrued income and prepaid expenses 6 3.233 2.024 1.007
12) Tax credits 7 8.829 6.948 6.253
13) Available-for-sale financial assets (current) 8 819 4.012 3.000 Securities 613 3.497 3.000 Loans to subsidiaries 206 515
14) Hedging instruments 9
15) Cash & cash equivalents 10 30.681 30.146 47.076
TOTAL ASSETS (A+B) 407.273 436.040 218.664
20

DATALOGIC S.p.A.CONSOLIDATED BALANCE SHEET
LIABILITIES Note 30-09-06 Euro/000
31-12-05 Euro/000
30-09-05 Euro/000
A) TOTAL NET EQUITY (1+2+3+4+5) 11 188.792 129.861 137.997
1) Share capital 160.889 90.556 90.485Share capital 33.044 25.746 25.743Treasury stock -4.356 1.881 1.427Share premium reserve 127.762 58.490 58.876Demerger capital reserve 4.439 4.439 4.439
2) Reserves -7.696 1.627 86Revaluation reserves 0Consolidation reserve 0Translation reserve/(loss) -5.194 1.548Cash-flow hedge reserve 0Reserve for financial liabilitis -2.502Fair-value reserve from available-for-sale financial assets 0 79 86
3) Retained earnings/(losses carried forward) 33.766 24.346 38.500Previous years' earnings/(losses) 12.063 9.216 22.862Reserve for gain on Datasud cancellation 3.730 4.432 4.432Untaxed capital grant reserve 958 256 256Legal reserve 1.870 1.399 1.399Treasury stock reserve 6.330 0 413IAS transition reserve 8.815 9.043 9.1384 ) Profit/(loss) for period 1.356 12.997 8.9575) Minority interests 477 335 -31
B) NON-CURRENT LIABILITIES (6+7+8+9+10+11) 129.506 65.542 32.813
6) Borrowing 12 87.737 12.283 13.036
7) Tax payables 18 22 7 32
8) Deferred tax liabilities 13 27.958 40.522 10.987
9) Employee severance indemnity and retirement provision 14 7.573 6.894 6.365
10) Long-term provisions for risks and expenses 15 5.593 4.600 1.355
11) Other non-current liabilities 16 623 1.236 1.038
C) CURRENT LIABILITIES (12+13+14+15) 88.975 240.637 47.854
12) Trade and other payables 17 71.043 81.325 34.241
Trade payables 40.908 44.653 18.836Within 12 months 38.387 43.263 18.447After 12 months 0Amounts payable to associates 15Amounts payable to parent company 2.295 998Amounts payable to related parties 226 377 389Accrued liabilities and deferred income 6.579 5.766 2.531Other current payables 23.556 30.906 12.874
13) Taxes payable 18 7.685 5.528 10.720
14) Short-term provisions for risks and expenses 15 3.786 4.319 258
15) Hedging instruments 9 13 116 70
16) Short-term borrowing 12 6.448 149.349 2.565
TOTAL LIABILITIES (A+B+C) 407.273 436.040 218.664
21
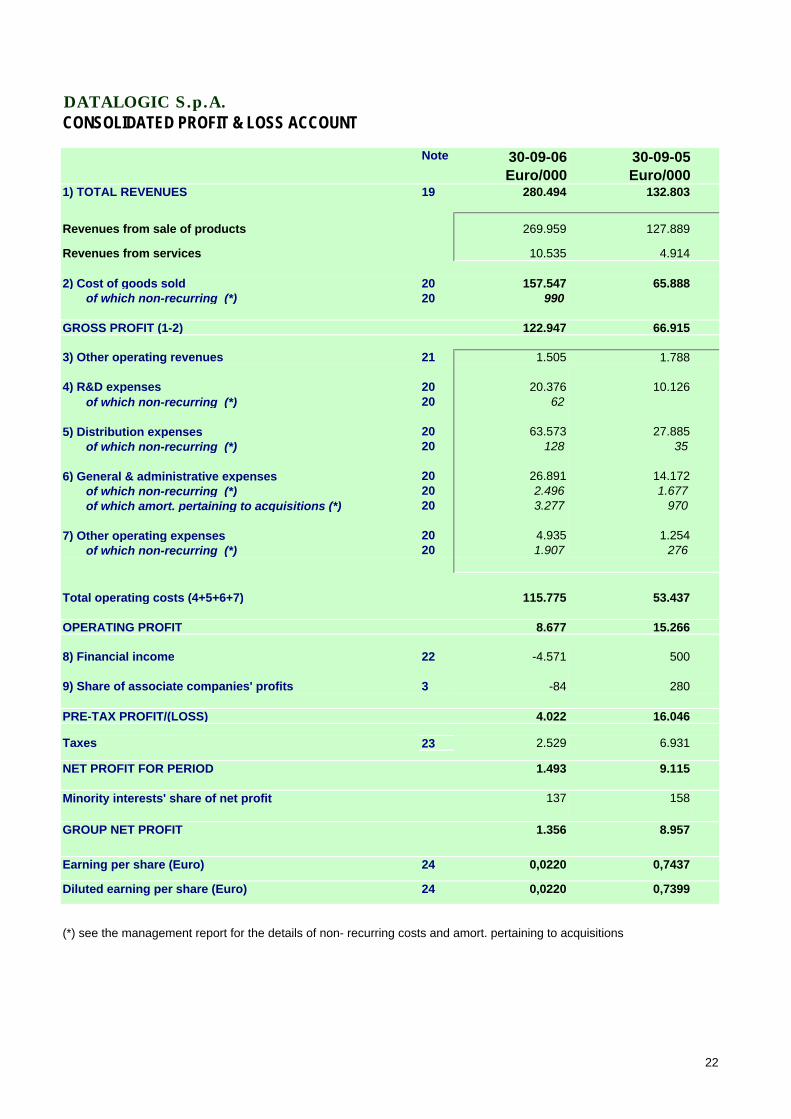
DATALOGIC S.p.A.CONSOLIDATED PROFIT & LOSS ACCOUNT
Note 30-09-06 Euro/000
30-09-05 Euro/000
1) TOTAL REVENUES 19 280.494 132.803
Revenues from sale of products 269.959 127.889
Revenues from services 10.535 4.914
2) Cost of goods sold 20 157.547 65.888 of which non-recurring (*) 20 990
GROSS PROFIT (1-2) 122.947 66.915
3) Other operating revenues 21 1.505 1.788
4) R&D expenses 20 20.376 10.126 of which non-recurring (*) 20 62
5) Distribution expenses 20 63.573 27.885 of which non-recurring (*) 20 128 35
6) General & administrative expenses 20 26.891 14.172 of which non-recurring (*) 20 2.496 1.677 of which amort. pertaining to acquisitions (*) 20 3.277 970
7) Other operating expenses 20 4.935 1.254 of which non-recurring (*) 20 1.907 276
Total operating costs (4+5+6+7) 115.775 53.437
OPERATING PROFIT 8.677 15.266
8) Financial income 22 -4.571 500
9) Share of associate companies' profits 3 -84 280
PRE-TAX PROFIT/(LOSS) 4.022 16.046
Taxes 23 2.529 6.931
NET PROFIT FOR PERIOD 1.493 9.115
Minority interests' share of net profit 137 158
GROUP NET PROFIT 1.356 8.957
Earning per share (Euro) 24 0,0220 0,7437
Diluted earning per share (Euro) 24 0,0220 0,7399
(*) see the management report for the details of non- recurring costs and amort. pertaining to acquisitions
22
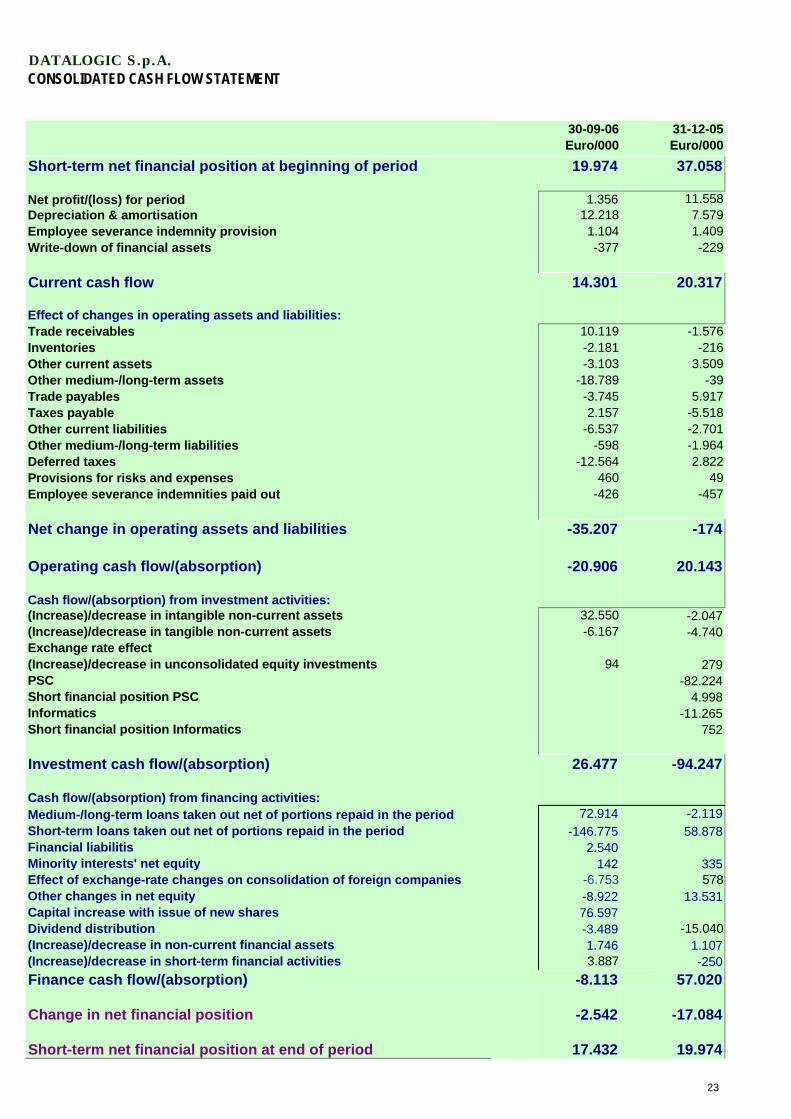
DATALOGIC S.p.A.CONSOLIDATED CASH FLOW STATEMENT
30-09-06 Euro/000
31-12-05 Euro/000
Short-term net financial position at beginning of period 19.974 37.058
Net profit/(loss) for period 1.356 11.558Depreciation & amortisation 12.218 7.579Employee severance indemnity provision 1.104 1.409Write-down of financial assets -377 -229
Current cash flow 14.301 20.317
Effect of changes in operating assets and liabilities:Trade receivables 10.119 -1.576Inventories -2.181 -216Other current assets -3.103 3.509Other medium-/long-term assets -18.789 -39Trade payables -3.745 5.917Taxes payable 2.157 -5.518Other current liabilities -6.537 -2.701Other medium-/long-term liabilities -598 -1.964Deferred taxes -12.564 2.822Provisions for risks and expenses 460 49Employee severance indemnities paid out -426 -457
Net change in operating assets and liabilities -35.207 -174
Operating cash flow/(absorption) -20.906 20.143
Cash flow/(absorption) from investment activities:(Increase)/decrease in intangible non-current assets 32.550 -2.047(Increase)/decrease in tangible non-current assets -6.167 -4.740Exchange rate effect(Increase)/decrease in unconsolidated equity investments 94 279PSC -82.224Short financial position PSC 4.998Informatics -11.265Short financial position Informatics 752
Investment cash flow/(absorption) 26.477 -94.247
Cash flow/(absorption) from financing activities:Medium-/long-term loans taken out net of portions repaid in the period 72.914 -2.119Short-term loans taken out net of portions repaid in the period -146.775 58.878Financial liabilitis 2.540Minority interests' net equity 142 335Effect of exchange-rate changes on consolidation of foreign companies -6.753 578Other changes in net equity -8.922 13.531Capital increase with issue of new shares 76.597Dividend distribution -3.489 -15.040(Increase)/decrease in non-current financial assets 1.746 1.107(Increase)/decrease in short-term financial activities 3.887 -250Finance cash flow/(absorption) -8.113 57.020
Change in net financial position -2.542 -17.084
Short-term net financial position at end of period 17.432 19.974
23
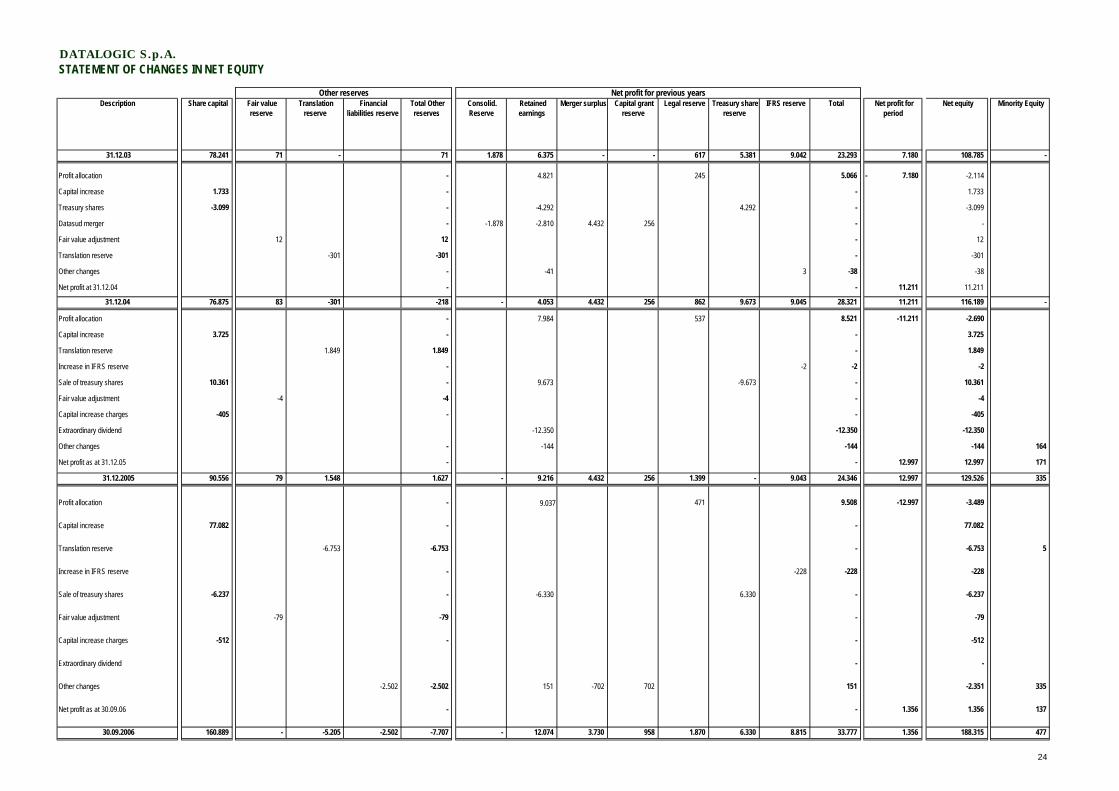
DATALOGIC S.p.A.STATEMENT OF CHANGES IN NET EQUITY
Description Share capital Fair value reserve
Translation reserve
Financial liabilities reserve
Total Other reserves
Consolid. Reserve
Retained earnings
Merger surplus Capital grant reserve
Legal reserve Treasury share reserve
IFRS reserve Total Net profit for period
Net equity Minority Equity
31.12.03 78.241 71 - 71 1.878 6.375 - - 617 5.381 9.042 23.293 7.180 108.785 -
Profit allocation - 4.821 245 5.066 - 7.180 -2.114
Capital increase 1.733 - - 1.733
Treasury shares -3.099 - -4.292 4.292 - -3.099
Datasud merger - -1.878 -2.810 4.432 256 - -
Fair value adjustment 12 12 - 12
Translation reserve -301 -301 - -301
Other changes - -41 3 -38 -38
Net profit at 31.12.04 - - 11.211 11.211
31.12.04 76.875 83 -301 -218 - 4.053 4.432 256 862 9.673 9.045 28.321 11.211 116.189 -
Profit allocation - 7.984 537 8.521 -11.211 -2.690
Capital increase 3.725 - - 3.725
Translation reserve 1.849 1.849 - 1.849
Increase in IFRS reserve - -2 -2 -2
Sale of treasury shares 10.361 - 9.673 -9.673 - 10.361
Fair value adjustment -4 -4 - -4
Capital increase charges -405 - - -405
Extraordinary dividend -12.350 -12.350 -12.350
Other changes - -144 -144 -144 164
Net profit as at 31.12.05 - - 12.997 12.997 171
31.12.2005 90.556 79 1.548 1.627 - 9.216 4.432 256 1.399 - 9.043 24.346 12.997 129.526 335
Profit allocation - 9.037 471 9.508 -12.997 -3.489
Capital increase 77.082 - - 77.082
Translation reserve -6.753 -6.753 - -6.753 5
Increase in IFRS reserve - -228 -228 -228
Sale of treasury shares -6.237 - -6.330 6.330 - -6.237
Fair value adjustment -79 -79 - -79
Capital increase charges -512 - - -512
Extraordinary dividend - -
Other changes -2.502 -2.502 151 -702 702 151 -2.351 335
Net profit as at 30.09.06 - - 1.356 1.356 137
30.09.2006 160.889 - -5.205 -2.502 -7.707 - 12.074 3.730 958 1.870 6.330 8.815 33.777 1.356 188.315 477
Other reserves Net profit for previous years
24
Datalogic Group
Consolidated quarterly report at 30/09/06 – Notes 25
Foreword
Datalogic Group S.p.A. (hereinafter “Datalogic”, the “parent company” or the “company”) is an Italian
corporation. The quarterly interim report for the period ending on 30 September 2006 comprises Datalogic
SpA.and its subsidiaries (hereinafter defined as "the Group") and the relevant share of associate companies'
profits.
The parent company is a joint-stock corporation listed on the TechStar section of the Milan Stock Exchange
and is based in Italy. The address of its registered headquarters is: Via Candini 2, Lippo di Calderara (BO),
Italy.
The parent company is a subsidiary of Hydra SpA, also based in Bologna, which is in turn controlled by the
Volta family.
These consolidated quarterly accounts were prepared for the approval the Board of Directors on 13
November 2006.
ACCOUNTING STANDARDS AND POLICIES (a) Accounting standards
Following the coming into force of EC Regulation no. 1606/2002 of the European Parliament and
Commission dated 19 July 2002, as from FY2005 companies with securities listed in a regulated market of
European Union member countries prepare consolidated accounts in compliance with the international
accounting and financial reporting standards (IAS/IFRS) endorsed by the European Commission. The
consolidated quarterly accounts for the period ending on 30 September 2006 have been drawn up in
accordance with IAS 34 and with Article 81 of the Regulations for Issuers of Public Stock. In addition, they
include all other information deemed useful in the interests of relevant and thorough disclosure.
Assets and liabilities have been valued at cost, with the exception of certain financial assets recognized at
fair value, and some property, plant and equipment that has been revalued for the transition to IFRS as
described in greater detail below. In addition, these financial statements have been prepared in compliance
with the IFRS and IFRIC (International Financial Reporting Interpretations Committee) interpretations issued
and effective at the time of its preparation. The accounting principles are described below and have been
applied uniformly to all periods for which figures are presented, except where otherwise noted. (b) Preparation criteria
The consolidated quarterly accounts are presented in thousands of euros (€'000). As mentioned above, they
have been prepared on a cost basis, with the exception of certain financial assets, liabilities and derivatives
recognized at fair value, and some property, plant and equipment that has been restated on a fair value
basis as of the transition date.
Accounting standards and policies have been uniformly applied in all Group companies and for all periods
presented.
Datalogic Group
Consolidated quarterly report at 30/09/06 – Notes 26
(c) Consolidation standards and policies
(i) Subsidiaries
Companies are defined as subsidiaries (i.e. they are "controlled") when the parent company has the power,
directly or indirectly, to influence their operations in such a way as to obtain benefits from performance of the
activity concerned. In defining control, the potential voting rights are exercisable or convertible as at reporting
date are also taken into account. In general, control is presumed to exist when the Group owns the majority
of voting rights. The accounts of subsidiaries are consolidated on a 100% line-by-line basis from the start of
exercise of control until the date of its cessation.
The subsidiaries acquired by the Group are carried using the purchase method, according to which (see
IFRS 3):
- cost is taken to be the fair value of the assets sold, considering any equity instruments issued and liabilities
incurred or assumed at the date of exchange, plus any costs directly attributable to the acquisition;
- the assets and liabilities of the acquired company are recognized at fair value;
- the excess of acquisition cost over the fair value of the Group’s share of net assets is recognized as
goodwill;
- if acquisition cost is less than the fair value of the Group’s share of the subsidiary’s net assets, the
difference is immediately recognized in the income statement.
Reciprocal payables and receivables and cost and revenue transactions between consolidated companies
and the effects of all significant transactions between them have been eliminated.
More specifically, profits not yet realized with third parties stemming from intragroup transactions, particularly
those deriving from the valuation of inventories at the reporting date, have been eliminated.
(ii) Associates
Associates are companies in which the Group has significant influence but does not exercise control over
operations. Significant influence is presumed to exist when the Group holds 20 to 50 percent of voting rights.
The consolidated quarterly accounts for the period ending on 30 September 2006 include the Group's share
of the profits and losses of associates, accounted for at equity, from the date when significant influence over
operations emerged until cessation of the same.
The Group’s share of associates’ post-acquisition profits or losses is recognized in the income statement and
its post-acquisition share of changes in reserves is recognized in reserves. Cumulative post-acquisition
changes are included in the investment’s carrying value. If the Group’s share of an associate’s losses equals
Datalogic Group
Consolidated quarterly report at 30/09/06 – Notes 27
or exceeds the value of its investment in the associate, including any other receivables, the Group does not
recognize any further losses unless it has obligations to make payments on the associate’s behalf.
Unrealized profits relating to transactions between the Group and its associates are eliminated in proportion
to the Group’s interests in such associates. Unrealized losses are also eliminated unless there is evidence of
potential impairment of the assets transferred. Accounting standards adopted by associates have been
modified when necessary to assure consistency with the policies adopted by the Group.
(d) Treatment of foreign currency items
(i) Foreign currency transactions
Transactions in foreign currencies are translated into EUR according to the exchange rate in force on the
transaction date. Monetary assets and liabilities are translated at the exchange rate in force on the balance
sheet date. Exchange differences emerging from translation at the period-end rate compared with the
transaction exchange rate are recorded in the income statement. Monetary assets and liabilities carried at
fair value are translated into EUR at the exchange rate in force on the date when fair value was determined.
(ii) Translation of foreign currency financial statements
The assets and liabilities of companies resident in countries other than those of the Eurozone, including
consolidation adjustments, goodwill, and fair-value alignment, are converted at the exchange rates in force
on the balance sheet date. The same companies’ revenues and costs are translated at the period’s average
exchange rate, which approximates exchange rates in force on individual transaction dates. Exchange
differences emerging from the translation process are directly classified in a specific equity reserve called
“Translation reserve”.
(iii) Net foreign currency investments
Exchange differences arising upon translation of net foreign currency investments – basically equity interests
in unconsolidated subsidiaries and in associates – and from any hedging of foreign exchange risk are
classified in the translation reserve. Such differences are recognized in profit or loss when the Group
disposes of the investment.
The exchange differences in relation to points (ii) and (iii) above and which originated before 1 January 2004,
the date of transition to IFRS, are presented in an equity reserve in accordance with the exemption granted
by IFRS 1.
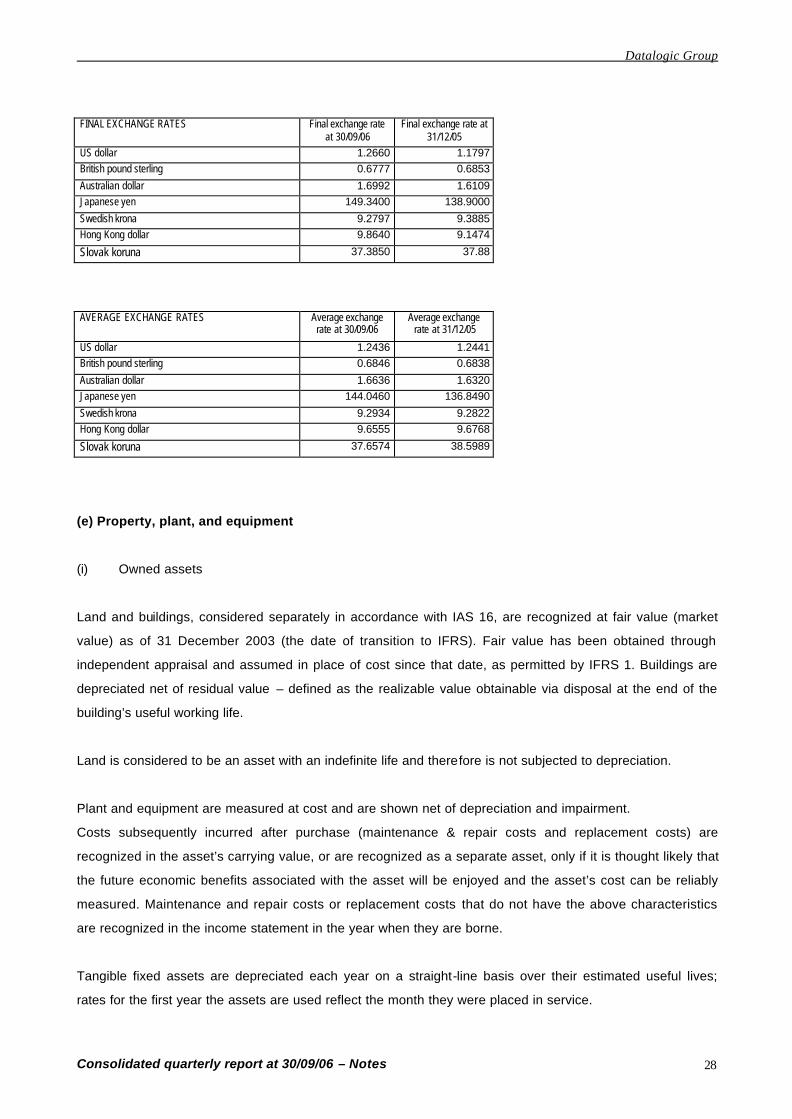
The exchange rates used are as follows:
Datalogic Group
Consolidated quarterly report at 30/09/06 – Notes 28
FINAL EXCHANGE RATES Final exchange rate
at 30/09/06 Final exchange rate at
31/12/05 US dollar 1.2660 1.1797 British pound sterling 0.6777 0.6853
Australian dollar 1.6992 1.6109 Japanese yen 149.3400 138.9000
Swedish krona 9.2797 9.3885 Hong Kong dollar 9.8640 9.1474
Slovak koruna 37.3850 37.88
AVERAGE EXCHANGE RATES Average exchange
rate at 30/09/06 Average exchange
rate at 31/12/05
US dollar 1.2436 1.2441 British pound sterling 0.6846 0.6838
Australian dollar 1.6636 1.6320 Japanese yen 144.0460 136.8490
Swedish krona 9.2934 9.2822 Hong Kong dollar 9.6555 9.6768
Slovak koruna 37.6574 38.5989
(e) Property, plant, and equipment
(i) Owned assets
Land and buildings, considered separately in accordance with IAS 16, are recognized at fair value (market
value) as of 31 December 2003 (the date of transition to IFRS). Fair value has been obtained through
independent appraisal and assumed in place of cost since that date, as permitted by IFRS 1. Buildings are
depreciated net of residual value – defined as the realizable value obtainable via disposal at the end of the
building’s useful working life.
Land is considered to be an asset with an indefinite life and therefore is not subjected to depreciation.
Plant and equipment are measured at cost and are shown net of depreciation and impairment.
Costs subsequently incurred after purchase (maintenance & repair costs and replacement costs) are
recognized in the asset’s carrying value, or are recognized as a separate asset, only if it is thought likely that
the future economic benefits associated with the asset will be enjoyed and the asset’s cost can be reliably
measured. Maintenance and repair costs or replacement costs that do not have the above characteristics
are recognized in the income statement in the year when they are borne.
Tangible fixed assets are depreciated each year on a straight-line basis over their estimated useful lives;
rates for the first year the assets are used reflect the month they were placed in service.
Datalogic Group
Consolidated quarterly report at 30/09/06 – Notes 29
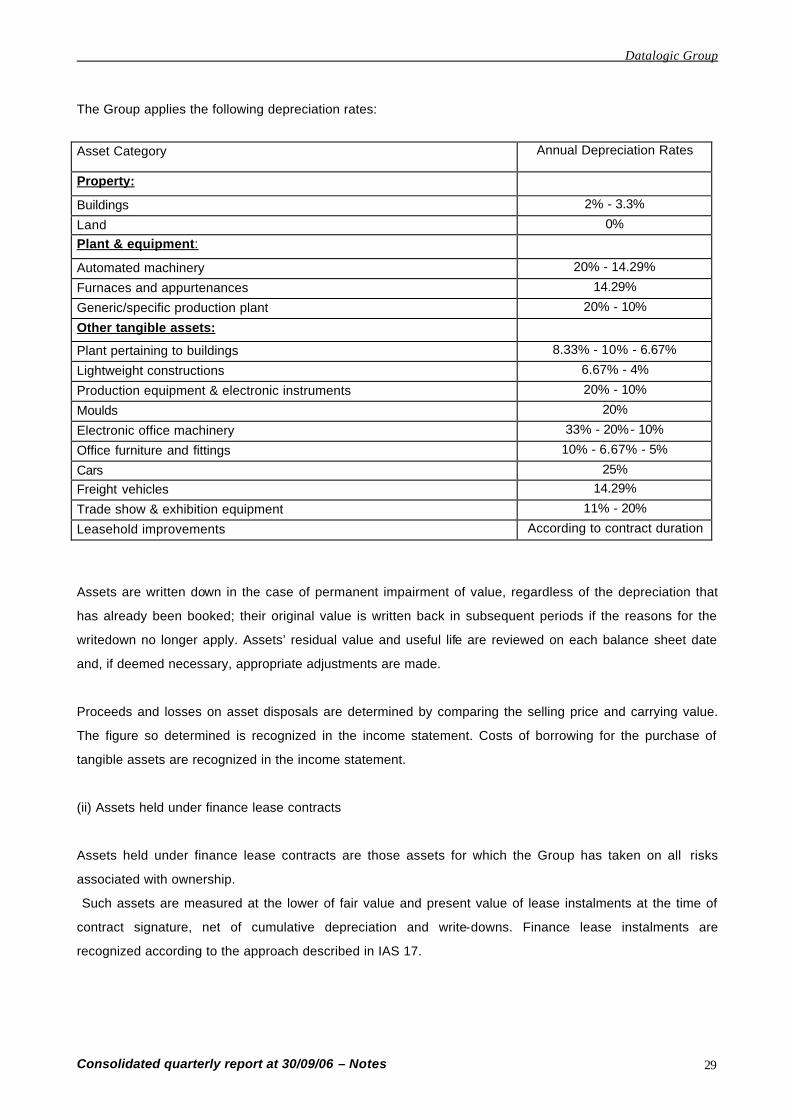
The Group applies the following depreciation rates:
Asset Category Annual Depreciation Rates
Property:
Buildings 2% - 3.3%
Land 0%
Plant & equipment:
Automated machinery 20% - 14.29%
Furnaces and appurtenances 14.29%
Generic/specific production plant 20% - 10%
Other tangible assets:
Plant pertaining to buildings 8.33% - 10% - 6.67%
Lightweight constructions 6.67% - 4%
Production equipment & electronic instruments 20% - 10%
Moulds 20%
Electronic office machinery 33% - 20%- 10%
Office furniture and fittings 10% - 6.67% - 5%
Cars 25%
Freight vehicles 14.29%
Trade show & exhibition equipment 11% - 20%
Leasehold improvements According to contract duration
Assets are written down in the case of permanent impairment of value, regardless of the depreciation that
has already been booked; their original value is written back in subsequent periods if the reasons for the
writedown no longer apply. Assets’ residual value and useful life are reviewed on each balance sheet date
and, if deemed necessary, appropriate adjustments are made.
Proceeds and losses on asset disposals are determined by comparing the selling price and carrying value.
The figure so determined is recognized in the income statement. Costs of borrowing for the purchase of
tangible assets are recognized in the income statement.
(ii) Assets held under finance lease contracts
Assets held under finance lease contracts are those assets for which the Group has taken on all risks
associated with ownership.
Such assets are measured at the lower of fair value and present value of lease instalments at the time of
contract signature, net of cumulative depreciation and write-downs. Finance lease instalments are
recognized according to the approach described in IAS 17.
Datalogic Group
Consolidated quarterly report at 30/09/06 – Notes 30
(f) Intangible assets
(i) Goodwill
Acquisitions have been recognized in accounts using the purchase method. For acquisitions completed after
1 January 2004 (IFRS transition date), goodwill is the difference between acquisition cost and the fair value
of assets and liabilities acquired.
For acquisitions completed prior to the transition date, goodwill is posted according to the accounting
standards adopted by the Italian National Council of Chartered & Registered Accountants, using the optional
exemption granted by IFRS 1.
Goodwill is recognized at cost, less impairment losses.
As from 1 January 2004 goodwill is allocated to cash generating units corresponding to the acquired
companies, and is no longer amortized. Carrying value is reviewed at least annually to check the absence of
impairment in accordance with IAS 36. Goodwill relating to unconsolidated subsidiaries, associates or other
companies is included in the equity investment’s value.
Negative goodwill originated by acquisitions is directly recognized in the income statement.
(ii) Research and development costs
Research expenses are recognized in the income statement at the time when the cost is borne as required
by IAS 38. Project costs for the development of innovative products or processes are recognized as
intangible assets when it is believed that the project will be successful, considering the product’s commercial
and technological opportunities, on condition that costs can be reliably measured and appropriate analyses
demonstrate that they will generate future economic benefits for the Group.
Other development expenses are recognized as costs as soon as they are incurred. Development costs
previously recognized as costs are not recognized as assets in subsequent accounting periods.
Development costs have a finite useful life and have been capitalized and amortized from the start of
commercial production of the products concerned, on a straight-line basis, for a period equal to the useful life
of the products to which they refer (IAS 38) – normally 5 years.
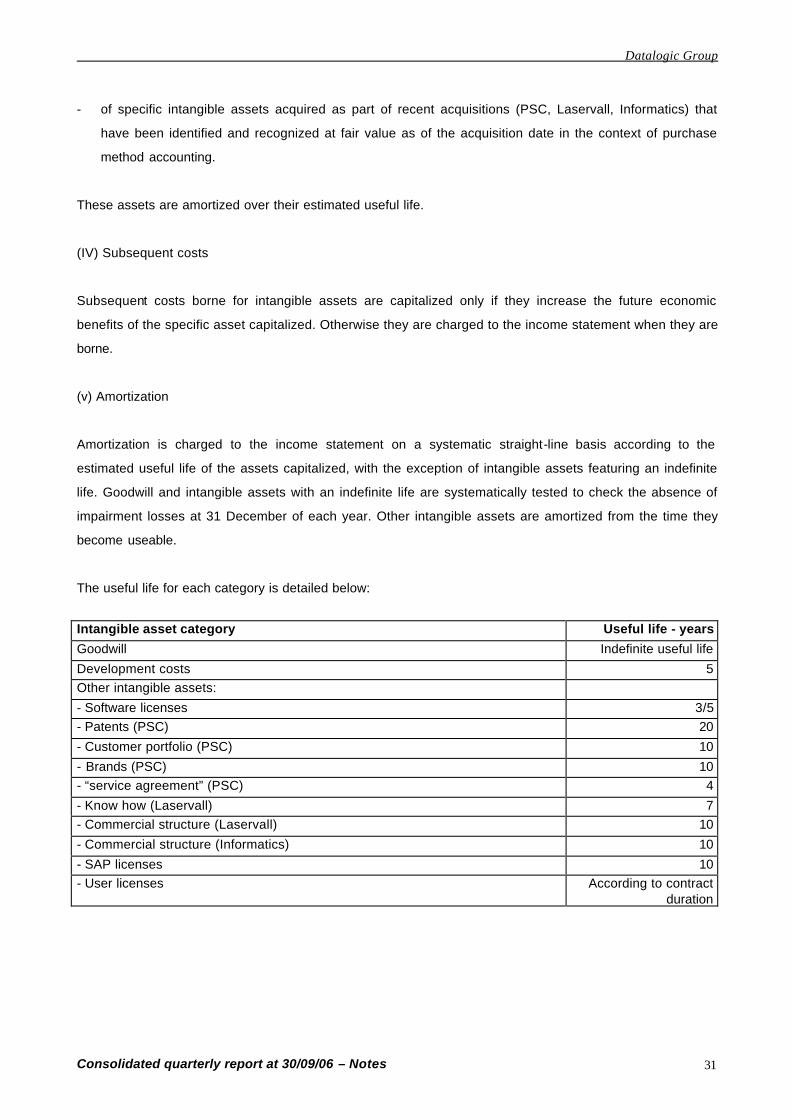
(iii) Other intangible assets
Other intangible assets are comprised:
- of software used under licence, valued at purchase cost
Datalogic Group
Consolidated quarterly report at 30/09/06 – Notes 31
- of specific intangible assets acquired as part of recent acquisitions (PSC, Laservall, Informatics) that
have been identified and recognized at fair value as of the acquisition date in the context of purchase
method accounting.
These assets are amortized over their estimated useful life.
(IV) Subsequent costs
Subsequent costs borne for intangible assets are capitalized only if they increase the future economic
benefits of the specific asset capitalized. Otherwise they are charged to the income statement when they are
borne.
(v) Amortization
Amortization is charged to the income statement on a systematic straight-line basis according to the
estimated useful life of the assets capitalized, with the exception of intangible assets featuring an indefinite
life. Goodwill and intangible assets with an indefinite life are systematically tested to check the absence of
impairment losses at 31 December of each year. Other intangible assets are amortized from the time they
become useable.
The useful life for each category is detailed below:
Intangible asset category Useful life - years
Goodwill Indefinite useful life
Development costs 5 Other intangible assets:
- Software licenses 3/5 - Patents (PSC) 20
- Customer portfolio (PSC) 10
- Brands (PSC) 10 - “service agreement” (PSC) 4
- Know how (Laservall) 7 - Commercial structure (Laservall) 10
- Commercial structure (Informatics) 10
- SAP licenses 10 - User licenses According to contract
duration
Datalogic Group
Consolidated quarterly report at 30/09/06 – Notes 32
(g) Investments in associates
Investments in associates are classified in non-current assets and are measured according to the equity
method, as envisaged by IAS 28. The portion of profits or losses stemming from application of this method is
indicated in a separate item of the income statement.
(h) Other equity investments and financial assets available for sale
Equity investments in other companies are classified as financial instruments available for sale according to
the definition provided in IAS 39, even though the Group has not expressed any plans to sell these
investments, and are carried at fair value as of the reporting date.
The fair value of listed securities is based on current market prices. If the market of a financial asset is not
active, the Group sets its fair value by using transactions taking place in proximity to the reporting date, by
referring to other instruments of essentially the same nature, or by using discounted cash flow models.
Under some circumstances, the Group may not have enough information to determine the fair value of these
financial assets; in which case they are maintained at cost.
(i) Inventories
Inventories are measured at the lower of cost and net realizable value. Cost is calculated using the weighted
average cost method. Finished product cost includes the cost of raw materials, direct manpower, and other
production costs that are directly and indirectly allocable (in this case on the basis of normal production
capacity). Net realizable value is the estimated selling price in the normal course of business, less any
selling costs.
(j) Receivables
Receivables, with due dates consistent with normal terms of trade in the sector in which the Group is active,
or that earn interest at market rates, are not discounted to present value. They are recognized at cost
(identified as face value), net of provisions for doubtful accounts, which are shown as a direct deduction from
such receivables in order to align them with their fair value. Receivables whose due date exceeds normal
terms of trade (i.e. due dates longer than one year) are initially recognized at fair value and subsequently at
amortized cost – using the effective interest rate method – net of related impairment losses.
Datalogic Group
Consolidated quarterly report at 30/09/06 – Notes 33
(k) Cash & cash equivalents
Cash and cash equivalents comprise cash in hand, bank and post office balances, and securities with
original maturity of less than three months. Current -account overdrafts and advances on invoices subject to
collection are deducted from cash only for the purposes of the cash flow statement.
(l) Impairment
The book value of assets – with the exception of inventories, financial assets governed by IAS 39, deferred
tax assets (see IAS 12), and non-current assets held for sale governed by IFRS 5 – are reviewed at each
balance sheet date to look for any indications of impairment. If this analysis reveals the presence of such
indications, it is necessary to calculate the asset’s presumed recoverable value following the approach
indicated below in point (i).
The presumed recoverable value of goodwill and of intangible assets not yet used is instead estimated at
least annually, or more frequently if specific events indicate the possible presence of impairment.
If the recoverable value (estimated as indicated below) of the asset or cash generating unit (CGU) to which
the asset belongs is lower than net carrying value, the asset is written down to reflect impairment, with the
relevant loss posted in the period’s income statement.
Write-downs made to CGUs for impairment losses are allocated first to goodwill and, for the remainder, to
other assets on a proportional basis.
The Group’s CGUs are defined as being individual companies in the consolidation area, given their
autonomous ability to generate cash flows.
All goodwill recognized in the accounts for the period ending on 30 September 2006 was subjected to
impairment testing as of 1 January 2004 – the IFRS transition date – and as of 31 December 2004 and 31
December 2005. No impairment losses emerged from such tests.
(i) Calculation of presumed recoverable value
The presumed recoverable value of assets other than goodwill is the higher of net disposal price and value in
use. Value in use is calculated according to projected future cash flows associated with the asset,
discounted to present value at a rate that allows for current market interest rates and for the specific risks
inherent in the asset to which presumed recoverable value refers.
Datalogic Group
Consolidated quarterly report at 30/09/06 – Notes 34
For assets that do not generate stand-alone cash flows, presumed recoverable value is determined for the
CGU to which the asset belongs.
(ii) Reversal of impairment losses
Impairment loss of assets other than goodwill is reversed when there is a change in the estimate used to
determine presumed recoverable value. Goodwill impairment losses are never reversed. Impairment loss is
reversed within the limits of the carrying value that would have emerged, net of depreciation and
amortization, if no impairment loss had ever been recognized.
(m) Share capital
Costs relating to the issue of shares or options are classified in equity (net of associated tax benefit relating
to the same) as a deduction from the proceeds from issuance of such instruments.
In the case of buyback of own shares (“treasury shares”), the price paid, inclusive of any directly attributable
accessory costs, is deducted from the Group’s equity until such shares are cancelled, re-issued, or sold.
When treasury shares are resold or re-issued, the proceeds, net of any directly attributable accessory costs
and the related tax effect, are posted as Group net equity.
(n) Stock options
On 28 February 2001 the Extraordinary Shareholders' Meeting of Datalogic SpA gave the Board of Directors
full powers to develop a stock-option incentive scheme for executive directors and for some employees. At
the same time shareholders approved a capital increase (of up to a maximum of 600,000 shares, or some
4.8% of share capital) reserved for implementation of the stock option plan.
On 17 May 2001 the Board of Directors implemented the plan in question, making it possible to:
- Increase the capacity to attract and retain key managerial and professional figures;
- Aid alignment of the interests of key people and shareholders;
- Enable key persons to participate in the creation of value and share it with investors.
In addition, the Board of Directors identified the stock option plan’s beneficiaries – 78 in total bet ween
executive directors and employees of the company and its subsidiaries, with the exception of Escort Memory
System (EMS).
The options’ vesting period started on 1 January 2004 and will end on 31 December 2007.
On 27 February 2002, the Board of Directors decided to recalculate – as an extraordinary measure – the
grant price of shares relating to the stock option plan approved on 17 May 2001, setting it at €11.5 per share.
Datalogic Group
Consolidated quarterly report at 30/09/06 – Notes 35
On 14 November 2002, the Board of Directors voted to grant 67% of the attributed options to the
beneficiaries of the stock option plan; on 17 December 2003 the Board approved assignment of the
remaining 33%. At 31 December 2003, all options relating to the 600,000 shares of the increase approved
on 28 February 2001 had been assigned.
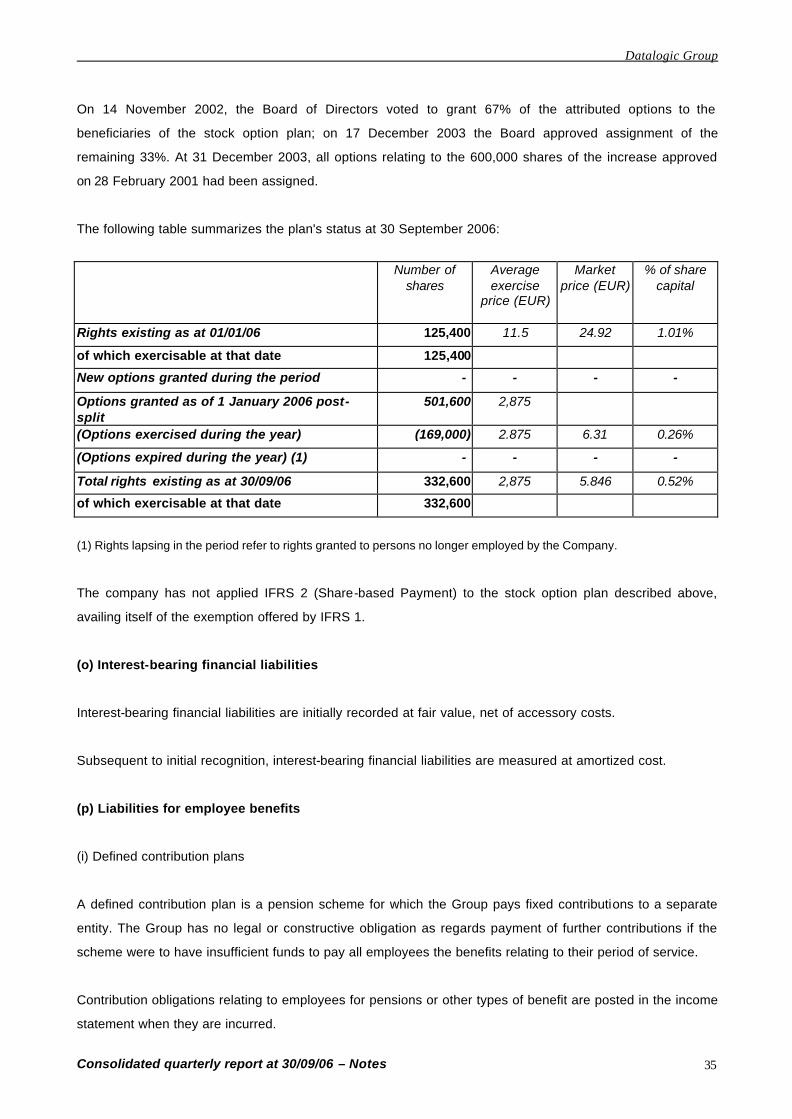
The following table summarizes the plan's status at 30 September 2006:
Number of shares
Average exercise
price (EUR)
Market price (EUR)
% of share capital
Rights existing as at 01/01/06 125,400 11.5 24.92 1.01%
of which exercisable at that date 125,400
New options granted during the period - - - -
Options granted as of 1 January 2006 post-split
501,600 2,875
(Options exercised during the year) (169,000) 2.875 6.31 0.26%
(Options expired during the year) (1) - - - -
Total rights existing as at 30/09/06 332,600 2,875 5.846 0.52%
of which exercisable at that date 332,600
(1) Rights lapsing in the period refer to rights granted to persons no longer employed by the Company.
The company has not applied IFRS 2 (Share-based Payment) to the stock option plan described above,
availing itself of the exemption offered by IFRS 1.
(o) Interest-bearing financial liabilities
Interest-bearing financial liabilities are initially recorded at fair value, net of accessory costs.
Subsequent to initial recognition, interest-bearing financial liabilities are measured at amortized cost.
(p) Liabilities for employee benefits
(i) Defined contribution plans
A defined contribution plan is a pension scheme for which the Group pays fixed contributions to a separate
entity. The Group has no legal or constructive obligation as regards payment of further contributions if the
scheme were to have insufficient funds to pay all employees the benefits relating to their period of service.
Contribution obligations relating to employees for pensions or other types of benefit are posted in the income
statement when they are incurred.

Datalogic Group
Consolidated quarterly report at 30/09/06 – Notes 36
(ii) Defined benefit plans
The net obligations concerning defined benefit plans after the period of employment in the Group –
consisting mainly of employee severance indemnities for the Group’s Italian companies – are calculated
separately for each plan, estimating (with use of actuarial techniques) the amount of the future benefit
accrued by employees in the period and in previous periods. The benefit so determined is discounted to
present value and is shown net of the fair value of any related assets. Calculation is performed by an
independent actuary using the projected unit credit method.
Actuarial gains and losses at 1 January 2004, the transition date to IFRS, have been posted to a separate
equity reserve. Actuarial gains and losses subsequent to that date are recognized in the income statement of
the relevant period, therefore not adopting the “corridor” technique envisaged by IAS 19.
(iii) Termination benefits
Termination benefits are payable when employment is terminated before normal pensionable retirement age
or when an employee accepts voluntary redundancy in exchange for such benefits. The Group recognizes
termination benefits when it is demonstrably under obligation to terminate current employees’ employment in
accordance with a detailed formal plan without any possibility of withdrawal, or to provide termination
benefits following a proposal made to encourage voluntary redundancy. Benefits that fall due more than 12
months after the balance sheet date are discounted to their present value.
(q) Provisions
In cases where the Group has a legal or constructive obligation arising from a past event and will probably
have to bear losses of economic benefits to settle the obligation, an appropriate provision is made. If the time
factor of the expected loss of benefits is significant, the amount of future cash outlays is discounted to
present value at an interest rate that allows for market interest rates and for the specific risk of the liability
concerned.
Provisions are not made for possible (as opposed to probable) future operating losses.
Provisions are measured at the fair value of the best estimate made by management of the expense of
meeting the current obligation as of the balance sheet date.
(i) Product warranty provision
Liabilities for servicing work under warranty are specifically provisioned when products are sold. The
provision is calculated on the basis of historical cost data for work under warranty.
Datalogic Group
Consolidated quarterly report at 30/09/06 – Notes 37
(ii) Other provisions
The Group has made a provision for a lawsuit against an ex-employee. The amount has been calculated
based on estimates made by the Group, together with its legal advisors, to determine likelihood, timing,
amounts involved and probable outlay of resources. The provision made will be adjusted according to
progress with the restructuring plan. Upon conclusion of the dispute, the amount differing from the balance
sheet provision will be recognized in the income statement.
The Group has also made a provision for restructuring by the PSC Group. The amount has been calculated
based on estimates made by the Group to determine likelihood, timing, amounts involved and probable
outlay of resources. Upon conclusion of the plan, the amount differing from balance sheet provision will be
recognized in the income statement.
(r) Trade and other payables
Trade and other payables are measured at cost, representing their discharge value.
(s) Revenues
(i) Revenues from sales of goods and services
Revenues from sales of goods are recognized in the income statement when the risks and benefits
associated with ownership of the goods have been substantially transferred to the purchaser. This usually
coincides with delivery or shipment of the goods. Revenues for services rendered are recognized in the
income statement according to percentage of completion at the balance sheet date.
(ii) Government grants
Government grants are recorded as deferred revenues among other liabilities at the time when it is
reasonably certain that they will be given and when the Group has complied with all conditions necessary to
obtain them. Grants received against costs borne are systematically posted in the income statement in the
same periods when such costs are recorded. Grants received against specific balance sheet assets are
recognized as deferred income and in the income statement as other operating revenues, based on the
relevant asset’s useful life.
(iii) Dividends
Dividends are recognised in the income statement on the date when the right to receive them matures. In the
case of listed companies, this is on coupon detachment date.
Datalogic Group
Consolidated quarterly report at 30/09/06 – Notes 38
(t) Costs
(i) Rental and operating lease costs
Rental and operating lease costs are recorded in the income statement on an accruals basis.
(ii) Finance lease instalments
In the case of finance lease instalments, the capital portion goes to reduce the financial liability, while interest
is posted in the income statement.
(iii) Financial income and expenses
Financial income and expenses are recognized on an accruals basis.
(u) Income taxes
Income taxes shown in the income statement include current and deferred taxes. Income taxes are generally
posted in the income statement, except when they refer to events recognized directly in equity.
Current income taxes are the taxes that are expected to be paid, calculated by applying to taxable income
the tax rate in force at the balance sheet date and adjustments to previous periods’ taxes.
Deferred taxes are calculated using the so-called liability method applied to temporary differences between
the amount of assets and liabilities in consolidated accounts and the corresponding amounts recognized for
tax purposes. Deferred taxes are calculated according to the expected manner of reversal of temporary
differences, using the tax rate in force at the balance sheet date.
Deferred tax assets are recognized only if it is probable that sufficient taxable income will be generated in
subsequent years to use such deferred taxes.
(v) Segment reporting
A segment is defined as a business activity or geographical area in which the Group does business that
features conditions and returns different to those of other segments. In the Group’s specific case, business
segments are the primary segments and are identified as the Data Capture segment and the Business
Development segment. Geographical areas (secondary segments) have been defined as being Italy, the
Rest of Europe (including non-EU countries), North America, and the Rest of the World.
Datalogic Group
Consolidated quarterly report at 30/09/06 – Notes 39
(w) Non-current assets held for sale and discontinued operations
Assets held for sale and any assets and liabilities belonging to company divisions or consolidated
investments held for sale are measured at the lower of book value at the time of classification of such items
as held for sale and their fair value net of selling costs.
Any impairment losses recognized via application of this policy are recognized in the income statement, both
in the case of write-down for alignment with fair value and in that of gains and losses stemming from
subsequent changes in fair value.
Business divisions are classified as discontinued operations at the time of their disposal or when they meet
the requisites for being classified as held for sale, if such requisites existed previously.
(x) Use of estimates
The preparation of consolidated financial statements requires directors to apply accounting standards and
methods that, in some cases, are based on complex and subjective evaluations, estimates based on
historical experience, and on assumptions that, on each occasion, are deemed reasonable and realistic in
relation to the circumstances concerned. The application of such estimates and assumptions affects the
amounts reported in financial statements, i.e. the balance sheet, income statement, and cash flow statement,
plus the information disclosed. The ultimate amounts of accounting items for which the aforesaid estimates
and assumptions have been used might be different to those reported in financial statements due to the
uncertainty characterizing assumptions and the conditions on which estimates are based.
Below we list the accounting items that, more than others, require greater subjectivity on the part of directors
in developing estimates and for which any change in the conditions underlying assumption could have a
significant impact on the Group’s consolidated quarterly accounts:
• Goodwill;
• Impairment of non-current assets;
• Development costs;
• Deferred tax assets;
• Provisions for doubtful accounts;
• Employee benefits;
• Provisions for risks and charges.
We review estimates and assumptions regularly and the effects of every change are immediately reflected in
the income statement.
Datalogic Group
Consolidated quarterly report at 30/09/06 – Notes 40
(y) Financial risks and derivative instruments
The Group is exposed to a variety of commercial and financial risks that are monitored and, in certain cases
managed, centrally. It nevertheless does not use financial derivatives to minimize the impact of such risks on
its results.
The market risks to which the Group is exposed can be divided into the following categories:
(i) Price risk
The Group buys and sells on a global scale and is therefore exposed to the normal risk of price fluctuations
typical of the sector.
(ii) Credit risk
The Group trades only with known and reliable customers. It is Group policy to subject customers requesting
extended payment terms to procedures to check their creditworthiness. In addition, the balance of
receivables is monitored during the year so that the amount of non-performing positions is not significant.
There is no significant concentration of credit risk in the Group.
(iii) Interest rate risks
Risks of changes in interest rates refer to borrowing. Floating-rate loans expose the group to the risk of
changes in cash flows due to interest expense. Fixed-rate loans expose the Group to the risk of changes in
the loans’ fair value.
Despite this, the Group does not use financial derivatives to hedge interest-rate risk.
(z) Earnings per share
Basic
Basic earnings per share is calculated by dividing the Group's profit by the weighted average number of
ordinary shares outstanding during the period, excluding treasury shares.
Diluted
Diluted earnings per share is calculated by dividing the Group's profit by the weighted average number of
ordinary shares outstanding during the period, excluding treasury shares. The weighted average number of
Datalogic Group
Consolidated quarterly report at 30/09/06 – Notes 41
shares is determined assuming conversion of all potential shares with a dilutive effect, and the Group's net
profit is adjusted for the post-tax effects of the conversion.
(aa) Exemptions and exceptions envisaged by IFRS 1
For the purposes of preparation of the present interim report and relevant comparative data, the accounting
standards illustrated in the previous paragraphs have been applied retrospectively except in the case of
optional exemptions to retrospective application allowed by IFRS 1 and adopted by the Group as described
in the following table. Optional exemption Choice Business combinations: aggregations of companies, acquisitions of equity interests in associates and joint ventures
The Group has decided to avail itself of exemption as regards retrospective application of IFRS 3 for business combinations and acquisitions of equity interests in associates and joint ventures taking place prior to 1 January 2004.
Opening value of tangible and intangible assets
The Group has decided to apply “deemed cost” for property assets. It has applied revalued cost based on specific appraisals performed by independent expert valuers. As regards intangible assets, given the absence of active markets, the Group has been unable to benefit from use of the “deemed cost” method.
Employee benefits As regards accounting treatment of defined-benefit plans (= employee severance indemnities in Italy) the Group has decided not to avail itself of the corridor approach and therefore, disregarding the exemption granted under IFRS 1, the actuarial gain/loss has been fully recognized at the transition date and duly reflected in net equity.
Cumulative translation differences
The Group has decided to opt for exemption from retrospective application of IAS 21. Gains/(losses) arising from translation of foreign investee companies’ financial statements have been cleared, set against the “Retained earnings” reserve.
Compound financial instruments
The Group does not have any compound financial instruments.
Transition of subsidiaries, associates and joint ventures
Not applicable to the consolidated half-year financial statements.
Alignment of comparative information concerning financial assets and liabilities
The Group has decided to apply IAS 32 and IAS 39 as from the transition date.
Designation of financial instruments already recognized
The Group has decided to apply IAS 32 and IAS 39 as from the transition date. The exemption has been taken as from this date.
Stock options The Group has a stock option plan that it has not accounted for in the manner envisaged by IFRS 2, as it meets the conditions for exemption offered by IFRS 1.
Insurance contracts Not applicable to the Group Changes in liabilities booked for decommissioning, restoration and similar liabilities
The Group did not have any liabilities for decommissioning, restoration and similar liabilities.
Datalogic Group
Consolidated quarterly report at 30/09/06 – Notes 42
The accounting standards applied to the opening balance sheet at 1 January 2004 have been uniformly
applied to the balance sheet and income statement at 30 September 2006 and to comparative 2005 figures,
including those concerning the recognition, classification and measurement of financial assets and liabilities
(IAS 32 and IAS 39).
The effects of IFRS adoption have been recognized in opening equity in the “Retained earnings reserve”,
except for the effects of application of fair value to available-for-sale financial assets, which have been
recognized in the “Fair value reserve”.
(ab) IFRS and IFRIC interpretations not yet endorsed
During the last few months the IASB (International Accounting Standards Board) and the IFRIC
(International Financial Reporting Interpretations Committee) have published new standards and
interpretations. Although, to date, the EU legislator has not yet endorsed such standards and interpretations,
the Group has in any case considered their effects, highlighting their potential impact on its balance sheet
and income statement, without finding them to have significant effects.

Datalogic Group
Consolidated quarterly report at 30/09/06 – Notes 43
GROUP STRUCTURE
The consolidated quarterly financial statements include the statements of the parent company and of the
companies in which the former directly or indirectly holds the majority of voting rights.
The companies consolidated on a line-by-line basis for the period ending 30 September 2006 were as
follows:
Company Registered location Share
capital Total equity
(€‘000) Profit/loss for
the period (€'000)
% ownership
Datalogic SpA (parent company )
Lippo di Calderara di Reno (Bo) – Italy
EUR 156,452,178 186,960 1,111
Laservall SpA Donnas (AO) - Italy EUR 900,000 10,036 4,561 100% Datalogic Holding AB Malmö –Sweden KRS 1,400,000 1,359 142 100%
EMS INC Scotts Valley (California) – United States
USD 1,949,084 1,113 -373 100%
Datalogic France SA Villebon Sur Yvette (Paris) – France
EUR 2,227,500 3,218 -64 100%
Datalogic Optik elektroniK GMBH
Erkenbrechtsweiler (Stuttgart) – Germany
EUR 1,025,000 3,631 191 100%
Datalogic Optic Electronics B.V.
Maarssen – The Netherlands EUR 17,800 -108 -143 100%
Datalogic Handelsgesellschaft mbH
Wiener Neudorf (Vienna) – Austria EUR 72,673 630 141 100%
Datalogic PTY LTD Mount Waverley (Melbourne) - Australia
AUD 2,300,000 721 -121 100%
Datalogic UK LTD Redbourn (London) – United Kingdom
GBP 3,500,000 4,651 121 100%
Datalogic INC Hebron (Kentucky) – United States AUD 1,847,000 2,012 450 100%
DL Iberia Madrid – Spain EUR 60,500 674 123 100% Datalogic AB Stockholm – Sweden KRS 200,000 830 -2 100% DL Slovakia Trnava - Slovakia SKK 1,999,925 3,882 4,266 100% PSC Holding Delaware USD 117,000,000 88,363 -4,592 100% DL Asia Limited Hong Kong - China HKD 100,000 166 103 100% Informatics Holding Inc. Plano Texas USD 15,100,000 14,952 1,371 90%
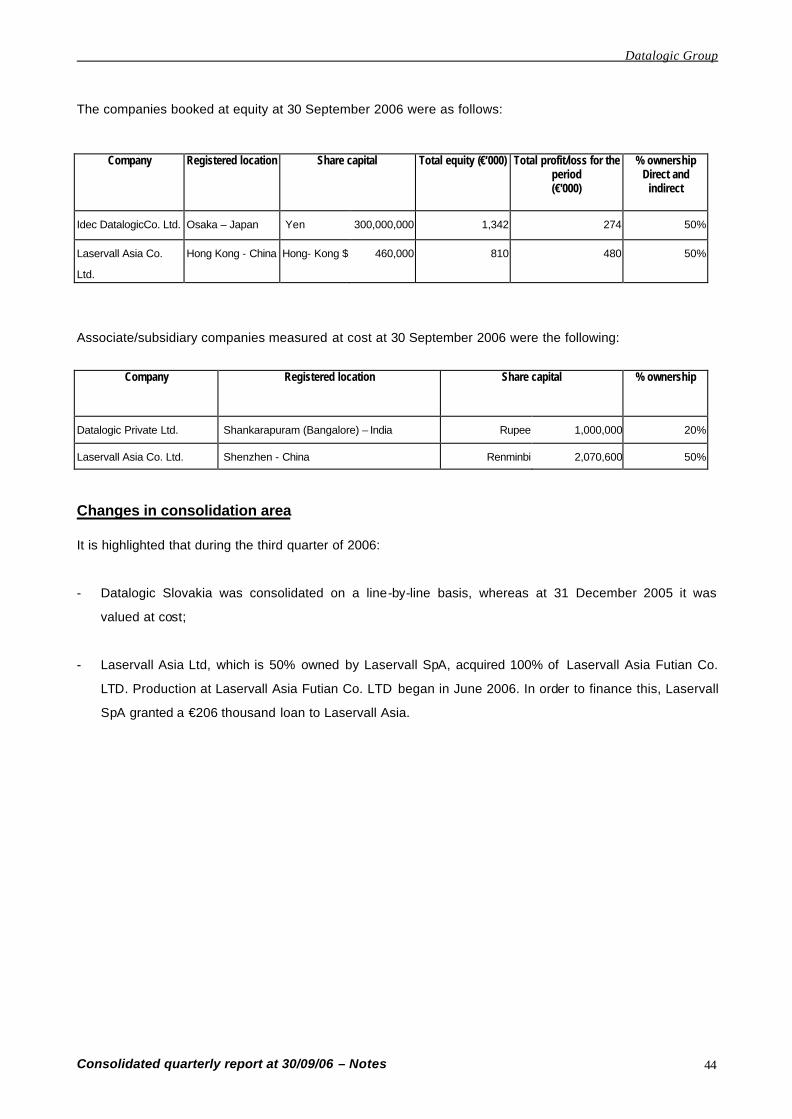
Datalogic Group
Consolidated quarterly report at 30/09/06 – Notes 44
The companies booked at equity at 30 September 2006 were as follows:
Company Registered location Share capital Total equity (€‘000) Total profit/loss for the period (€'000)
% ownership Direct and
indirect
Idec DatalogicCo. Ltd. Osaka – Japan Yen 300,000,000 1,342 274 50%
Laservall Asia Co.
Ltd.
Hong Kong - China Hong- Kong $ 460,000 810 480 50%
Associate/subsidiary companies measured at cost at 30 September 2006 were the following:
Company Registered location Share capital % ownership
Datalogic Private Ltd. Shankarapuram (Bangalore) – India Rupee 1,000,000 20%
Laservall Asia Co. Ltd. Shenzhen - China Renminbi 2,070,600 50%
Changes in consolidation area It is highlighted that during the third quarter of 2006:
- Datalogic Slovakia was consolidated on a line-by-line basis, whereas at 31 December 2005 it was
valued at cost;
- Laservall Asia Ltd, which is 50% owned by Laservall SpA, acquired 100% of Laservall Asia Futian Co.
LTD. Production at Laservall Asia Futian Co. LTD began in June 2006. In order to finance this, Laservall
SpA granted a €206 thousand loan to Laservall Asia.
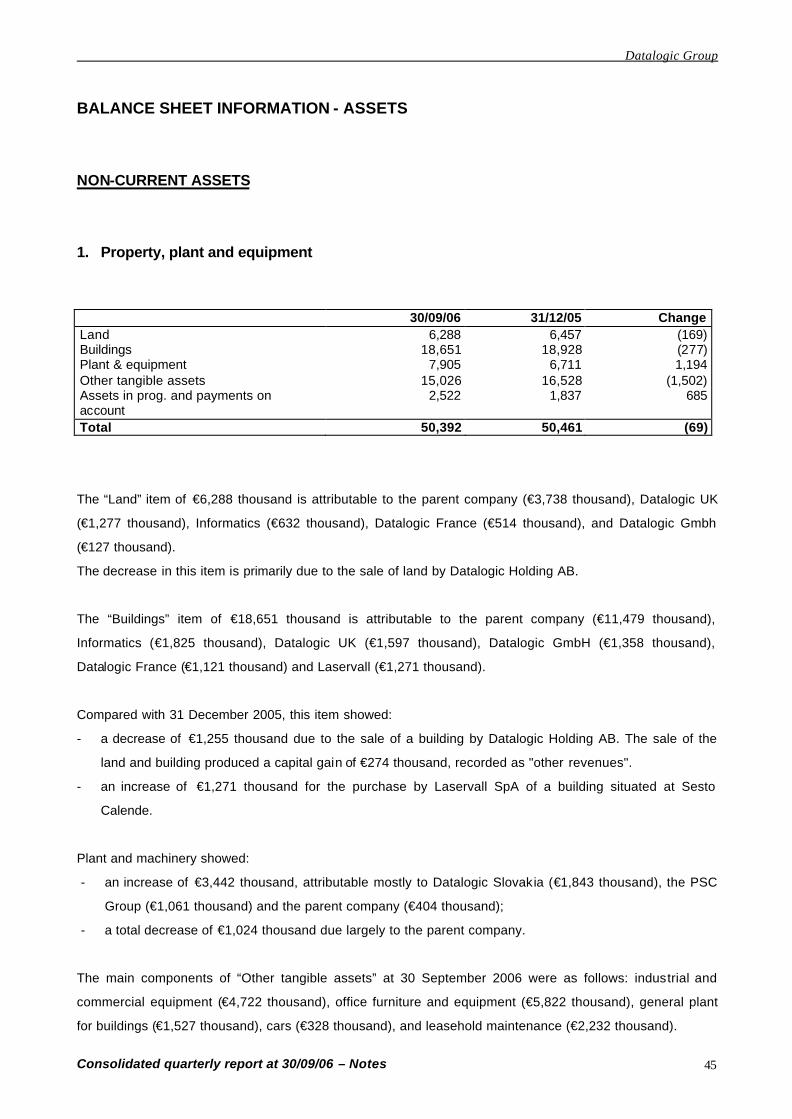
Datalogic Group
Consolidated quarterly report at 30/09/06 – Notes 45
BALANCE SHEET INFORMATION - ASSETS NON-CURRENT ASSETS
1. Property, plant and equipment
30/09/06 31/12/05 Change Land 6,288 6,457 (169) Buildings 18,651 18,928 (277) Plant & equipment 7,905 6,711 1,194 Other tangible assets 15,026 16,528 (1,502) Assets in prog. and payments on account
2,522 1,837 685
Total 50,392 50,461 (69)
The “Land” item of €6,288 thousand is attributable to the parent company (€3,738 thousand), Datalogic UK
(€1,277 thousand), Informatics (€632 thousand), Datalogic France (€514 thousand), and Datalogic Gmbh
(€127 thousand).
The decrease in this item is primarily due to the sale of land by Datalogic Holding AB.
The “Buildings” item of €18,651 thousand is attributable to the parent company (€11,479 thousand),
Informatics (€1,825 thousand), Datalogic UK (€1,597 thousand), Datalogic GmbH (€1,358 thousand),
Datalogic France (€1,121 thousand) and Laservall (€1,271 thousand).
Compared with 31 December 2005, this item showed:
- a decrease of €1,255 thousand due to the sale of a building by Datalogic Holding AB. The sale of the
land and building produced a capital gain of €274 thousand, recorded as "other revenues".
- an increase of €1,271 thousand for the purchase by Laservall SpA of a building situated at Sesto
Calende.
Plant and machinery showed:
- an increase of €3,442 thousand, attributable mostly to Datalogic Slovakia (€1,843 thousand), the PSC
Group (€1,061 thousand) and the parent company (€404 thousand);
- a total decrease of €1,024 thousand due largely to the parent company.
The main components of “Other tangible assets” at 30 September 2006 were as follows: industrial and
commercial equipment (€4,722 thousand), office furniture and equipment (€5,822 thousand), general plant
for buildings (€1,527 thousand), cars (€328 thousand), and leasehold maintenance (€2,232 thousand).
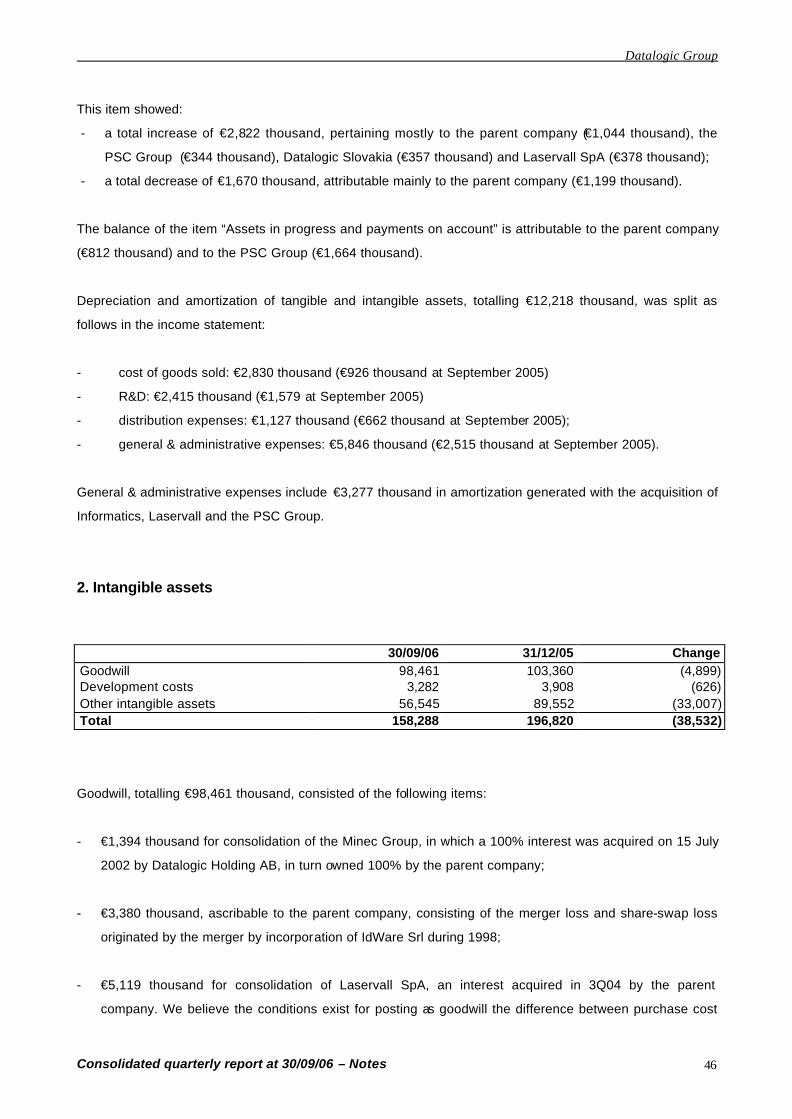
Datalogic Group
Consolidated quarterly report at 30/09/06 – Notes 46
This item showed:
- a total increase of €2,822 thousand, pertaining mostly to the parent company (€1,044 thousand), the
PSC Group (€344 thousand), Datalogic Slovakia (€357 thousand) and Laservall SpA (€378 thousand);
- a total decrease of €1,670 thousand, attributable mainly to the parent company (€1,199 thousand).
The balance of the item “Assets in progress and payments on account” is attributable to the parent company
(€812 thousand) and to the PSC Group (€1,664 thousand).
Depreciation and amortization of tangible and intangible assets, totalling €12,218 thousand, was split as
follows in the income statement:
- cost of goods sold: €2,830 thousand (€926 thousand at September 2005)
- R&D: €2,415 thousand (€1,579 at September 2005)
- distribution expenses: €1,127 thousand (€662 thousand at September 2005);
- general & administrative expenses: €5,846 thousand (€2,515 thousand at September 2005).
General & administrative expenses include €3,277 thousand in amortization generated with the acquisition of
Informatics, Laservall and the PSC Group.
2. Intangible assets
30/09/06 31/12/05 Change
Goodwill 98,461 103,360 (4,899) Development costs 3,282 3,908 (626) Other intangible assets 56,545 89,552 (33,007) Total 158,288 196,820 (38,532)
Goodwill, totalling €98,461 thousand, consisted of the following items:
- €1,394 thousand for consolidation of the Minec Group, in which a 100% interest was acquired on 15 July
2002 by Datalogic Holding AB, in turn owned 100% by the parent company;
- €3,380 thousand, ascribable to the parent company, consisting of the merger loss and share-swap loss
originated by the merger by incorporation of IdWare Srl during 1998;
- €5,119 thousand for consolidation of Laservall SpA, an interest acquired in 3Q04 by the parent
company. We believe the conditions exist for posting as goodwill the difference between purchase cost
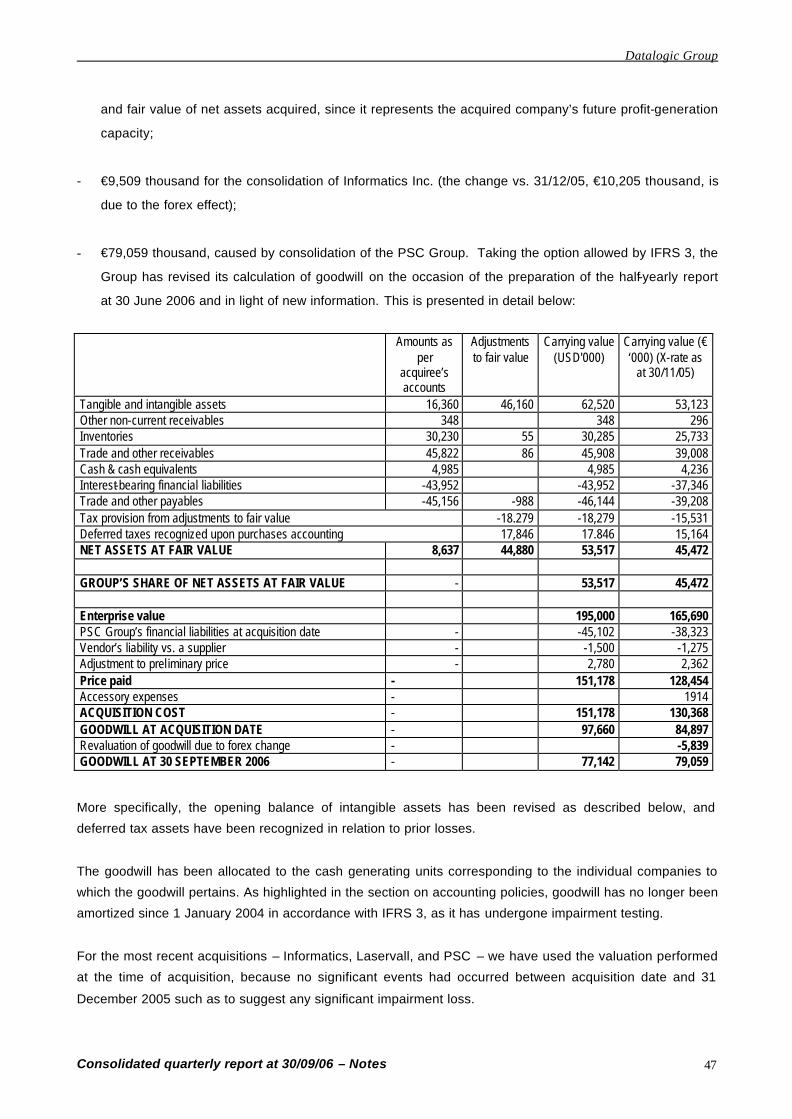
Datalogic Group
Consolidated quarterly report at 30/09/06 – Notes 47
and fair value of net assets acquired, since it represents the acquired company’s future profit-generation
capacity;
- €9,509 thousand for the consolidation of Informatics Inc. (the change vs. 31/12/05, €10,205 thousand, is
due to the forex effect);
- €79,059 thousand, caused by consolidation of the PSC Group. Taking the option allowed by IFRS 3, the
Group has revised its calculation of goodwill on the occasion of the preparation of the half-yearly report
at 30 June 2006 and in light of new information. This is presented in detail below:
Amounts as
per acquiree’s accounts
Adjustments to fair value
Carrying value (USD'000)
Carrying value (€ ‘000) (X-rate as
at 30/11/05)
Tangible and intangible assets 16,360 46,160 62,520 53,123 Other non-current receivables 348 348 296 Inventories 30,230 55 30,285 25,733 Trade and other receivables 45,822 86 45,908 39,008 Cash & cash equivalents 4,985 4,985 4,236 Interest-bearing financial liabilities -43,952 -43,952 -37,346 Trade and other payables -45,156 -988 -46,144 -39,208 Tax provision from adjustments to fair value -18.279 -18,279 -15,531 Deferred taxes recognized upon purchases accounting 17,846 17.846 15,164 NET ASSETS AT FAIR VALUE 8,637 44,880 53,517 45,472 GROUP’S SHARE OF NET ASSETS AT FAIR VALUE - 53,517 45,472 Enterprise value 195,000 165,690 PSC Group’s financial liabilities at acquisition date - -45,102 -38,323 Vendor’s liability vs. a supplier - -1,500 -1,275 Adjustment to prel iminary price - 2,780 2,362 Price paid - 151,178 128,454 Accessory expenses - 1914 ACQUISITION COST - 151,178 130,368 GOODWILL AT ACQUISITION DATE - 97,660 84,897 Revaluation of goodwill due to forex change - -5,839 GOODWILL AT 30 SEPTEMBER 2006 - 77,142 79,059
More specifically, the opening balance of intangible assets has been revised as described below, and
deferred tax assets have been recognized in relation to prior losses.
The goodwill has been allocated to the cash generating units corresponding to the individual companies to
which the goodwill pertains. As highlighted in the section on accounting policies, goodwill has no longer been
amortized since 1 January 2004 in accordance with IFRS 3, as it has undergone impairment testing.
For the most recent acquisitions – Informatics, Laservall, and PSC – we have used the valuation performed
at the time of acquisition, because no significant events had occurred between acquisition date and 31
December 2005 such as to suggest any significant impairment loss.
Datalogic Group
Consolidated quarterly report at 30/09/06 – Notes 48
For the acquisition of Minec and for IdWare we performed impairment testing at 31 December 2005.
The recoverable value of the cash generating units to which goodwill was allocated has been determined
according to value in use. The latter, with reference to 31 December 2005, was calculated using the
discounted cash flow method of the income projected to be earned by the individual CGUs, which in
substance correspond to the Group companies, with the exception of the IdWare goodwill which is allocated
to the MC division.
Development costs, amounting to €3,282 thousand, are attributable to:
- the parent company = €3,179 thousand
- Informatics = €103 thousand
and consisted of development projects capitalized because they met IAS 38 requirements.
The heading "Other”, at €56,545 thousand, consists primarily of intangible assets acquired through business
combinations carried out by the Group in 2004 and 2005, which are specifically identified and valued in the
context of purchase accounting. The main items are as follows:
Intangible assets pertaining to the acquisition of the PSC Group (completed on 30 November 2005)
- Patents of €30,761 thousand (historical cost USD 40,461 thousand), acquired from PSC. The useful life
of this intangible asset has been defined as being 20 years. The original value of USD 61,004 thousand
at 31 December 2005 has decreased due to revision of the goodwill calculation.
- A “Service agreement” of €608 thousand (historical cost USD 951 thousand), acquired from PSC. The
useful life of this intangible asset has been defined as being 4 years. The original value of USD 1,030
thousand at 31 December 2005 has decreased due to revision of the goodwill calculation.
- “Brands” of €2,827 thousand (historical cost USD 3,885 thousand), acquired from PSC. The useful life of
this intangible asset has been defined as being 10 years. The original value of USD 4,800 thousand at
31 December 2005 has decreased due to revision of the goodwill calculation.
- The “Customer portfolio“ of €2,738 thousand (historical cost USD 3,763 thousand), acquired from PSC.
The useful life of this intangible asset has been defined as being 10 years. The original value of USD
12,169 thousand at 31 December 2005 has decreased due to revision of the goodwill calculation.
Datalogic Group
Consolidated quarterly report at 30/09/06 – Notes 49
Intangible assets pertaining to the acquisition of the Laservall Group (completed on 27 August 2004)
- Know-how amounting to €4,050 thousand (€5,968 thousand at the date of initial recognition), acquired
from Laservall SpA and relating to technological expertise in the laser marking sector, in terms of product
engineering and industrialization. The useful life of this intangible asset has been defined as being 7
years.
- A commercial facility (Far East Window) amounting to €3,423 thousand (€4,417 thousand at the date of
initial recognition), acquired from Laservall SpA and consisting of its well-established global sales
network and customer base, with a direct presence in areas featuring strong economic growth. The
useful life of this intangible non-current asset has been defined as being 10 years.
Intangible assets pertaining to the acquisition of Informatics (completed on 28 February 2005)
- A commercial facility amounting to €5,319 thousand (USD 8,000 thousand at the date of initial
recognition) acquired from Informatics and relating to its sales network and customer portfolio.
The useful life of this intangible non-current asset has been defined as being 10 years.
The remaining €6,819 thousand of the heading "Other" pertains to the parent company for €5,669 thousand.
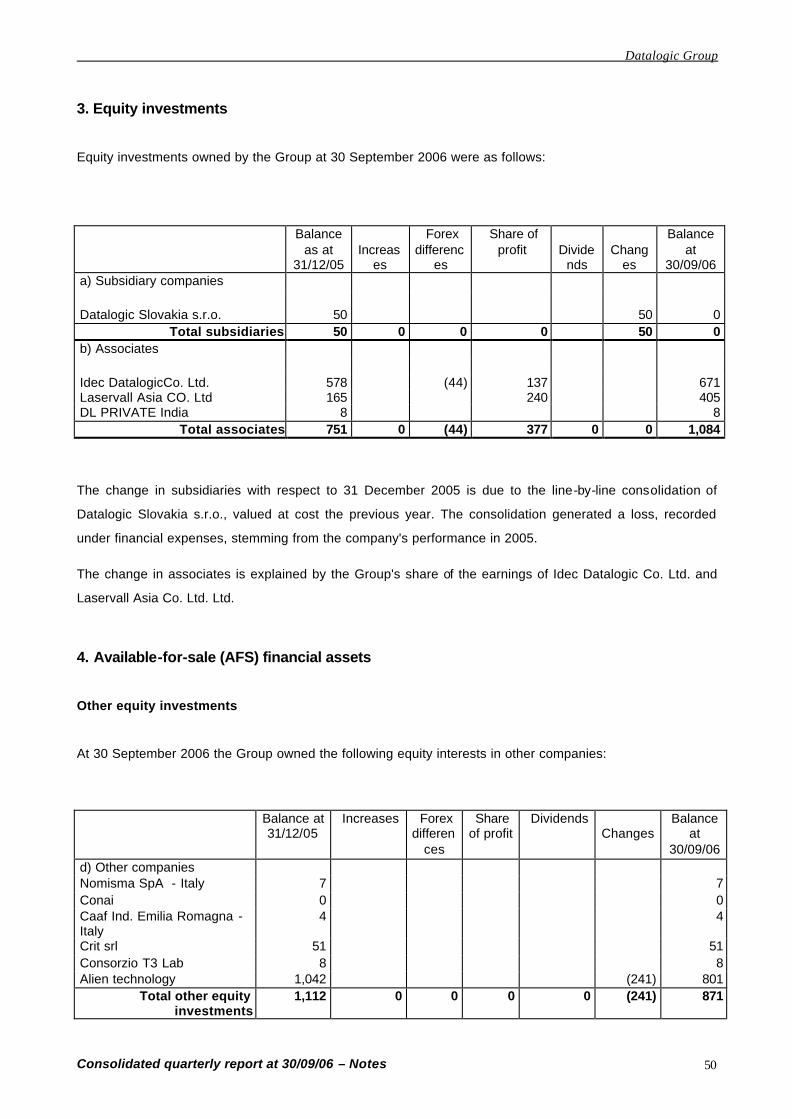
Datalogic Group
Consolidated quarterly report at 30/09/06 – Notes 50
3. Equity investments
Equity investments owned by the Group at 30 September 2006 were as follows:
Balance as at
31/12/05
Increas
es
Forex differenc
es
Share of profit
Divide
nds
Chang
es
Balance at
30/09/06 a) Subsidiary companies
Datalogic Slovakia s.r.o. 50 50 0
Total subsidiaries 50 0 0 0 50 0 b) Associates
Idec DatalogicCo. Ltd. 578 (44) 137 671 Laservall Asia CO. Ltd 165 240 405 DL PRIVATE India 8 8
Total associates 751 0 (44) 377 0 0 1,084 The change in subsidiaries with respect to 31 December 2005 is due to the line-by-line consolidation of
Datalogic Slovakia s.r.o., valued at cost the previous year. The consolidation generated a loss, recorded
under financial expenses, stemming from the company's performance in 2005.
The change in associates is explained by the Group's share of the earnings of Idec Datalogic Co. Ltd. and
Laservall Asia Co. Ltd. Ltd.
4. Available-for-sale (AFS) financial assets
Other equity investments
At 30 September 2006 the Group owned the following equity interests in other companies:
Balance at
31/12/05 Increases Forex
differences
Share of profit
Dividends Changes
Balance at
30/09/06 d) Other companies Nomisma SpA - Italy 7 7 Conai 0 0 Caaf Ind. Emilia Romagna - Italy
4 4
Crit srl 51 51 Consorzio T3 Lab 8 8 Alien technology 1,042 (241) 801
Total other equity investments
1,112 0 0 0 0 (241) 871
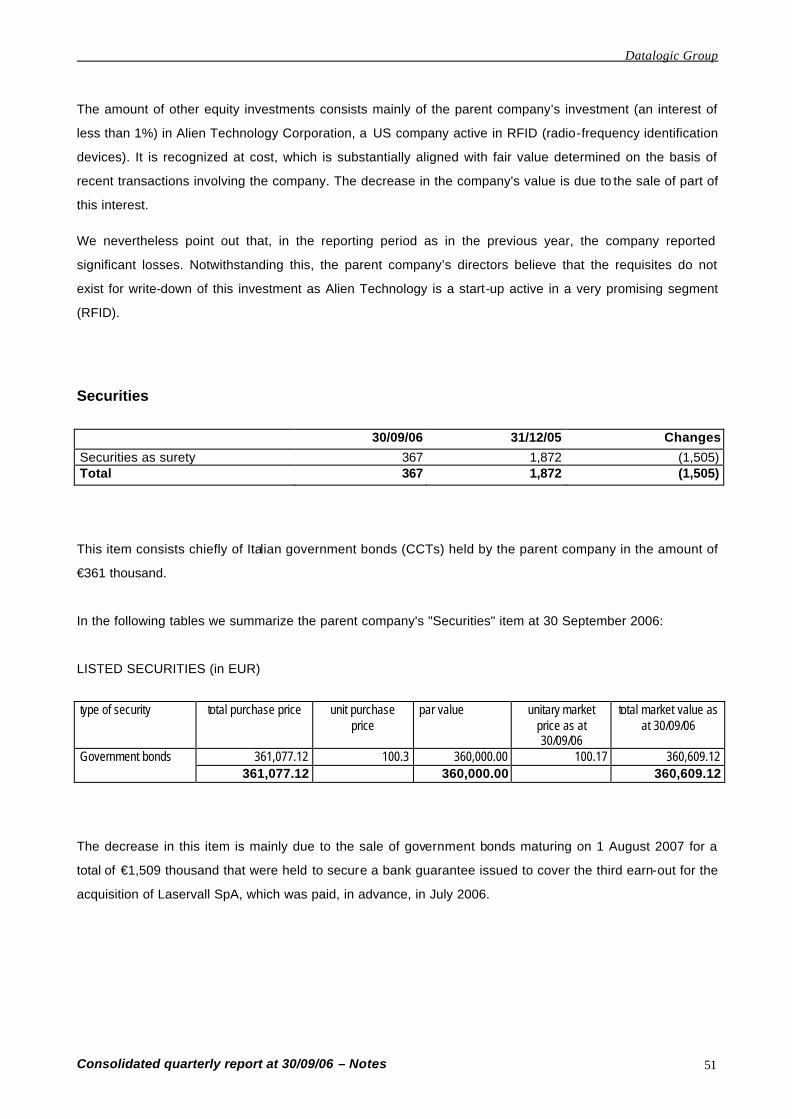
Datalogic Group
Consolidated quarterly report at 30/09/06 – Notes 51
The amount of other equity investments consists mainly of the parent company’s investment (an interest of
less than 1%) in Alien Technology Corporation, a US company active in RFID (radio-frequency identification
devices). It is recognized at cost, which is substantially aligned with fair value determined on the basis of
recent transactions involving the company. The decrease in the company's value is due to the sale of part of
this interest.
We nevertheless point out that, in the reporting period as in the previous year, the company reported
significant losses. Notwithstanding this, the parent company’s directors believe that the requisites do not
exist for write-down of this investment as Alien Technology is a start-up active in a very promising segment
(RFID).
Securities
30/09/06 31/12/05 Changes
Securities as surety 367 1,872 (1,505) Total 367 1,872 (1,505)
This item consists chiefly of Italian government bonds (CCTs) held by the parent company in the amount of
€361 thousand.
In the following tables we summarize the parent company's "Securities" item at 30 September 2006:
LISTED SECURITIES (in EUR)
type of security total purchase price unit purchase
price par value unitary market
price as at 30/09/06
total market value as at 30/09/06
Government bonds 361,077.12 100.3 360,000.00 100.17 360,609.12 361,077.12 360,000.00 360,609.12
The decrease in this item is mainly due to the sale of government bonds maturing on 1 August 2007 for a
total of €1,509 thousand that were held to secure a bank guarantee issued to cover the third earn-out for the
acquisition of Laservall SpA, which was paid, in advance, in July 2006.
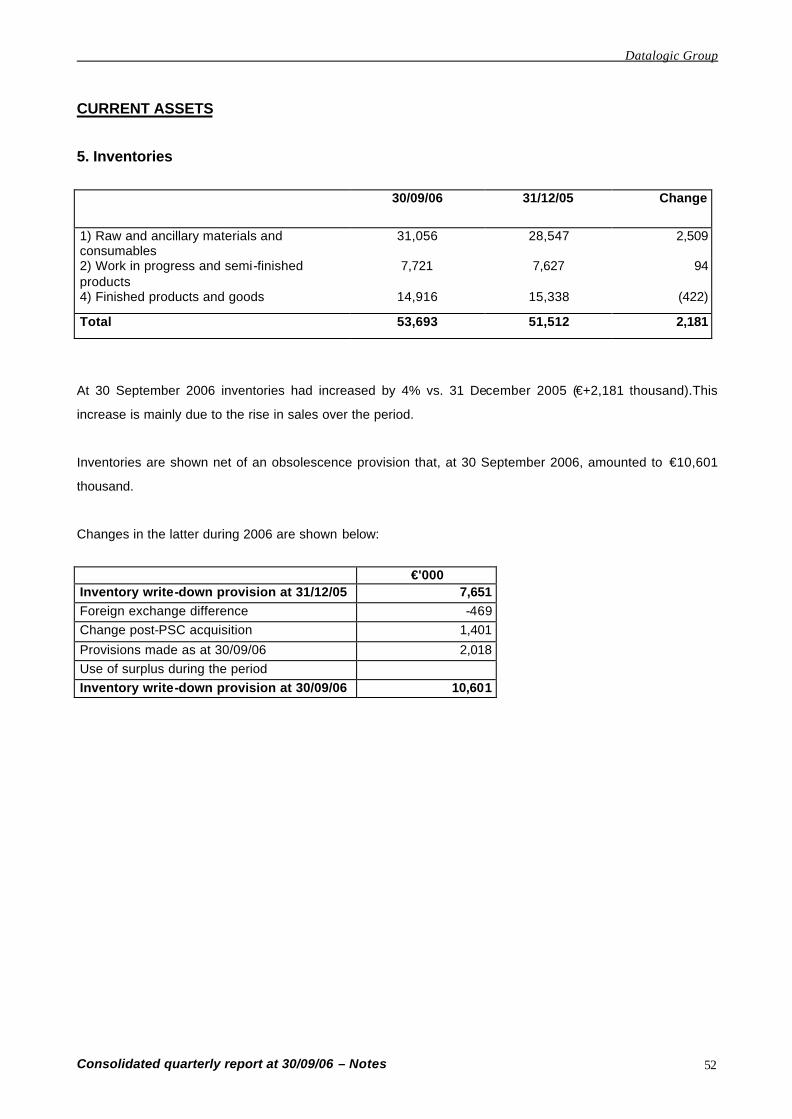
Datalogic Group
Consolidated quarterly report at 30/09/06 – Notes 52
CURRENT ASSETS
5. Inventories
30/09/06 31/12/05 Change
1) Raw and ancillary materials and consumables
31,056 28,547 2,509
2) Work in progress and semi-finished products
7,721 7,627 94
4) Finished products and goods 14,916 15,338 (422)
Total 53,693 51,512 2,181
At 30 September 2006 inventories had increased by 4% vs. 31 December 2005 (€+2,181 thousand).This
increase is mainly due to the rise in sales over the period.
Inventories are shown net of an obsolescence provision that, at 30 September 2006, amounted to €10,601
thousand.
Changes in the latter during 2006 are shown below:
€'000 Inventory write-down provision at 31/12/05 7,651 Foreign exchange difference -469 Change post-PSC acquisition 1,401
Provisions made as at 30/09/06 2,018 Use of surplus during the period Inventory write-down provision at 30/09/06 10,601
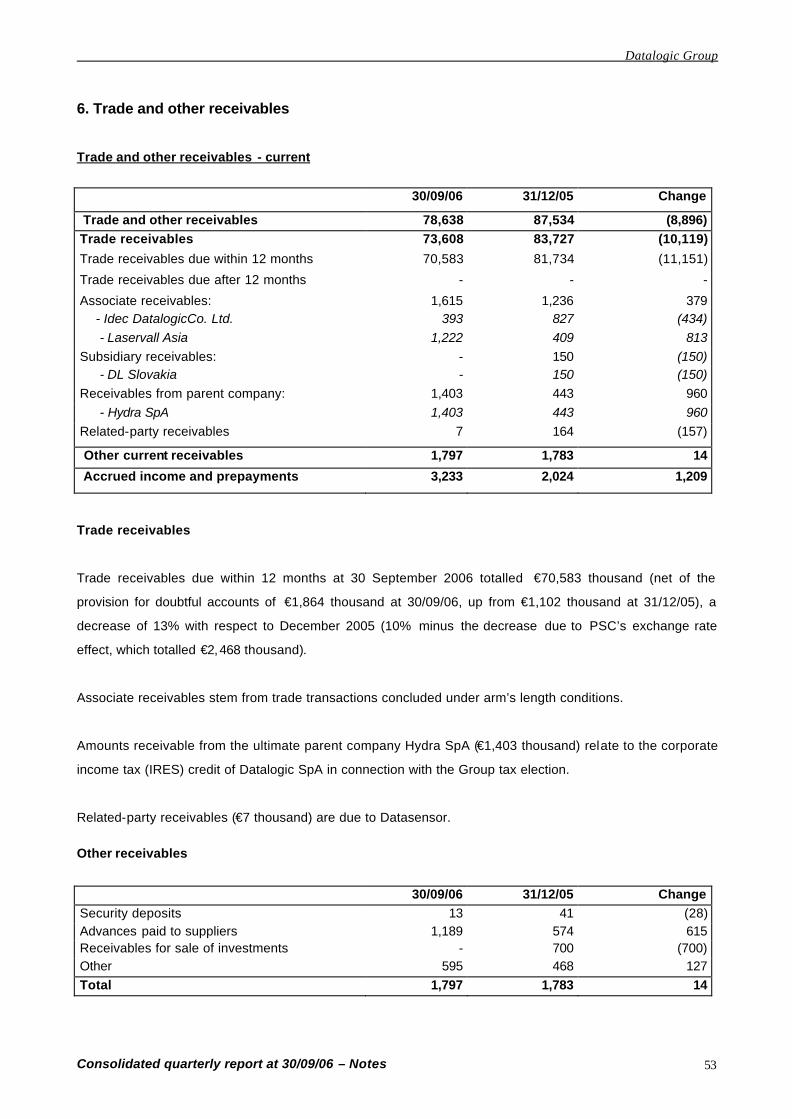
Datalogic Group
Consolidated quarterly report at 30/09/06 – Notes 53
6. Trade and other receivables
Trade and other receivables - current
30/09/06 31/12/05 Change
Trade and other receivables 78,638 87,534 (8,896) Trade receivables 73,608 83,727 (10,119)
Trade receivables due within 12 months 70,583 81,734 (11,151)
Trade receivables due after 12 months - - -
Associate receivables: 1,615 1,236 379 - Idec DatalogicCo. Ltd. 393 827 (434) - Laservall Asia 1,222 409 813 Subsidiary receivables: - 150 (150) - DL Slovakia - 150 (150) Receivables from parent company: 1,403 443 960 - Hydra SpA 1,403 443 960 Related-party receivables 7 164 (157)
Other current receivables 1,797 1,783 14
Accrued income and prepayments 3,233 2,024 1,209
Trade receivables
Trade receivables due within 12 months at 30 September 2006 totalled €70,583 thousand (net of the
provision for doubtful accounts of €1,864 thousand at 30/09/06, up from €1,102 thousand at 31/12/05), a
decrease of 13% with respect to December 2005 (10% minus the decrease due to PSC’s exchange rate
effect, which totalled €2,468 thousand).
Associate receivables stem from trade transactions concluded under arm’s length conditions.
Amounts receivable from the ultimate parent company Hydra SpA (€1,403 thousand) relate to the corporate
income tax (IRES) credit of Datalogic SpA in connection with the Group tax election.
Related-party receivables (€7 thousand) are due to Datasensor.
Other receivables
30/09/06 31/12/05 Change
Security deposits 13 41 (28) Advances paid to suppliers 1,189 574 615 Receivables for sale of investments - 700 (700) Other 595 468 127 Total 1,797 1,783 14

Datalogic Group
Consolidated quarterly report at 30/09/06 – Notes 54
The item "Other" includes €222 thousand, paid by the parent company to the Inland Revenue for notice of
tax reassessment received on 22/10/02, against which the company has filed an appeal
Accrued income and prepayments
30/09/06 31/12/05 Change
a) accrued income
miscellaneous interest income 6 30 (24) other accrued income 39 25 14
total accrued income 45 55 (10)
b) prepayments insurance 375 236 139
membership fees 13 20 (9) rent and maintenance fees 1,205 515 690
leasing contracts 62 32 30 surety costs 25 57 (32)
trade fairs and sponsorships 112 110 2 substitute tax 130 208 (78)
other prepayments 1,266 789 477 total prepayments 3,188 1,969 1,219
Total accrued income and prepayments
3,233 2,024 1,209
The increase in rent and maintenance fees pertains to Datalogic Slovakia (€288 thousand) and the PSC
Group (€477 thousand), for rent.
Trade and other receivables - non-current
30/09/06 31/12/05 Change Security deposits 488 772 (284) Other 45 24 21 Total 533 796 (263)
Security deposits are attributable mainly to the PSC Group (€288 thousand) and Datalogic Slovakia (€127
thousand).
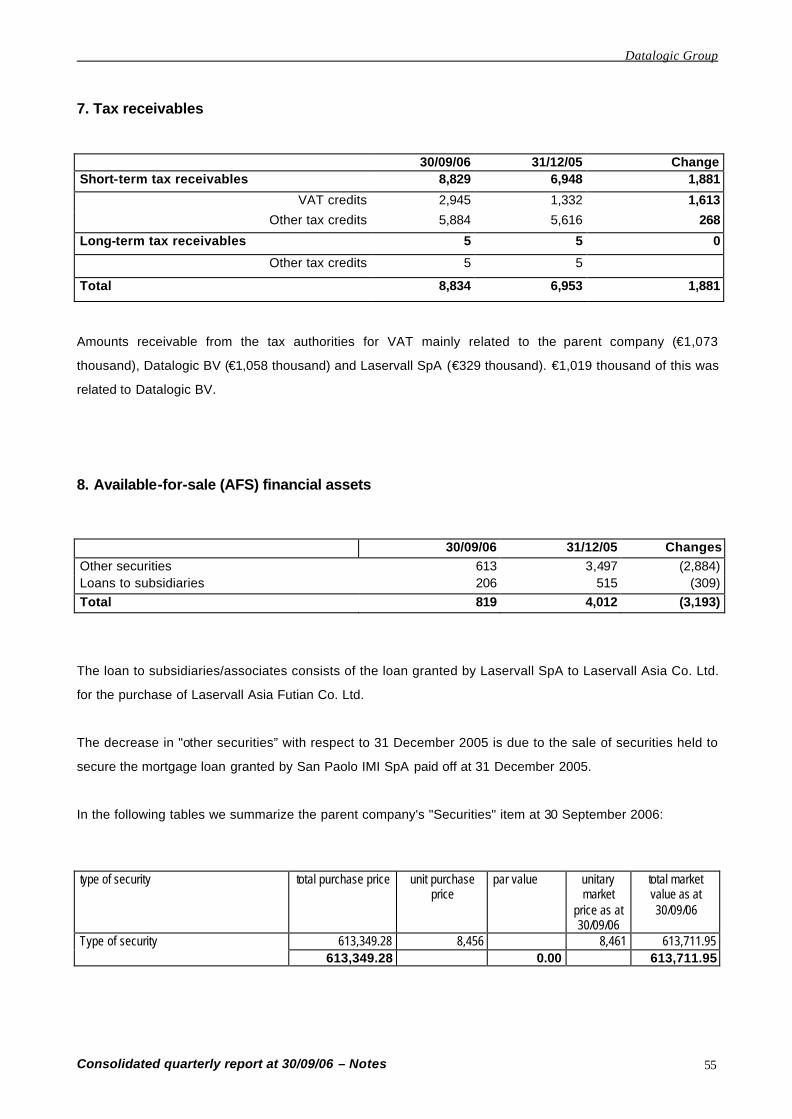
Datalogic Group
Consolidated quarterly report at 30/09/06 – Notes 55
7. Tax receivables
30/09/06 31/12/05 Change Short-term tax receivables 8,829 6,948 1,881
VAT credits 2,945 1,332 1,613
Other tax credits 5,884 5,616 268
Long-term tax receivables 5 5 0
Other tax credits 5 5
Total 8,834 6,953 1,881
Amounts receivable from the tax authorities for VAT mainly related to the parent company (€1,073
thousand), Datalogic BV (€1,058 thousand) and Laservall SpA (€329 thousand). €1,019 thousand of this was
related to Datalogic BV.
8. Available-for-sale (AFS) financial assets
30/09/06 31/12/05 Changes Other securities 613 3,497 (2,884) Loans to subsidiaries 206 515 (309) Total 819 4,012 (3,193)
The loan to subsidiaries/associates consists of the loan granted by Laservall SpA to Laservall Asia Co. Ltd.
for the purchase of Laservall Asia Futian Co. Ltd.
The decrease in "other securities” with respect to 31 December 2005 is due to the sale of securities held to
secure the mortgage loan granted by San Paolo IMI SpA paid off at 31 December 2005.
In the following tables we summarize the parent company's "Securities" item at 30 September 2006:
type of security total purchase price unit purchase
price par value unitary
market price as at 30/09/06
total market value as at 30/09/06
Type of security 613,349.28 8,456 8,461 613,711.95 613,349.28 0.00 613,711.95
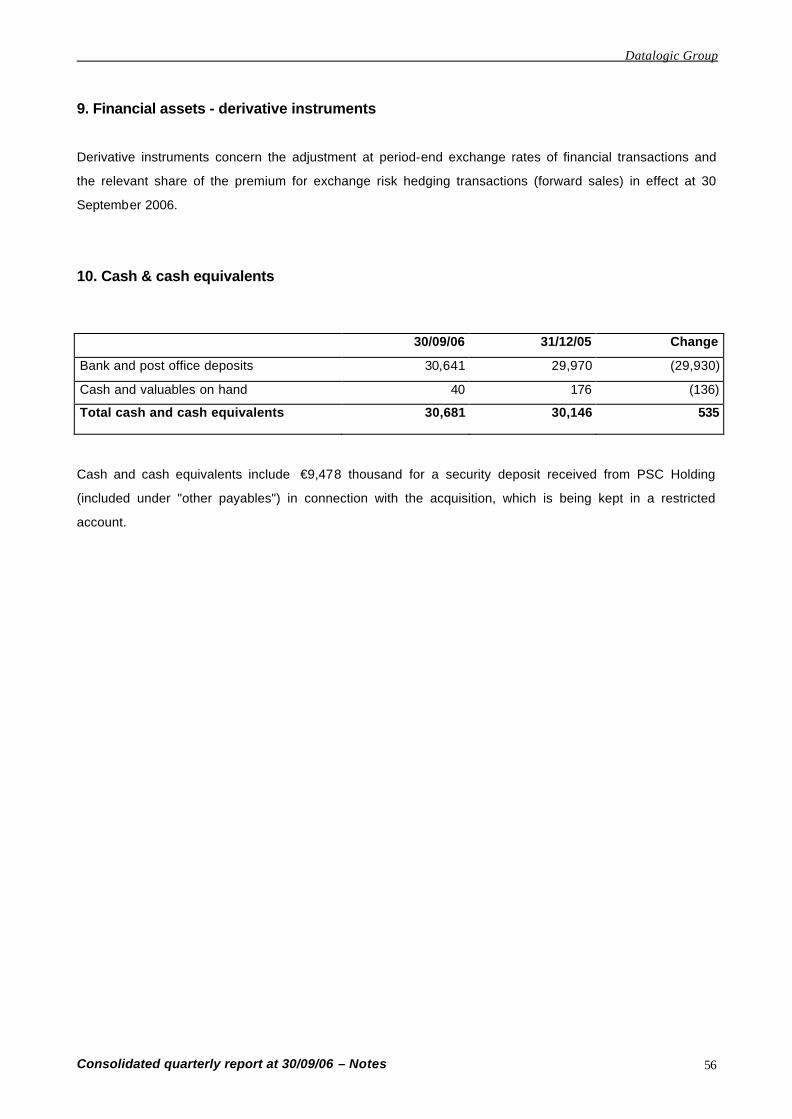
Datalogic Group
Consolidated quarterly report at 30/09/06 – Notes 56
9. Financial assets - derivative instruments
Derivative instruments concern the adjustment at period-end exchange rates of financial transactions and
the relevant share of the premium for exchange risk hedging transactions (forward sales) in effect at 30
September 2006.
10. Cash & cash equivalents
30/09/06 31/12/05 Change
Bank and post office deposits 30,641 29,970 (29,930)
Cash and valuables on hand 40 176 (136)
Total cash and cash equivalents 30,681 30,146 535
Cash and cash equivalents include €9,478 thousand for a security deposit received from PSC Holding
(included under "other payables") in connection with the acquisition, which is being kept in a restricted
account.

Datalogic Group
Consolidated quarterly report at 30/09/06 – Notes 57
INFORMATION ON THE BALANCE SHEET - NET EQUITY AND LIABILITIES
11. Equity
Details of net equity are shown below; movements during the period are presented in a separate table.
a) Share capital
Movements in share capital at 30 September 2006 are reported below (in €'000):
Number of shares
Share capital Share premium reserve
Treasury shares
Demerger reserve
Total
01/01/06 12,378,100 25,746 58,490 1,881 4,439 90,556
Number of shares at 31 December 2005 post-split
49,512,400
Capital increase from issue of new shares 13,863,472 7,209 69,387 76,596
Capital increase for exercise of stock options 169,000 89 397 486
Purchase of treasury shares (1,119,104) (6,440) (6,440) Sale of treas ury shares 19,104 110 110 Exercise of rejected options and purchase of treasury shares
- 93 93
Capital increase expenses - (512) (512)
30/09/06 62,444,872 33,044 127,762 (4,356) 4,439 160,889
On 8 May 2006, a share split was carried out at a ratio of 1 to 4, reducing the unit price from €2.08 to €0.52.
Ordinary shares
At 30 September 2006 the total number of ordinary shares was 62,444,872 (net of 1,100,000 treasury
shares) with a par value of €0.52 each; all shares issued are fully paid.
The main change taking place as at 3Q06 was the rights issue (capital increase) of €76,596 thousand. This
was approved by the extraordinary shareholders' meeting of 2 December 2005 and completed in January
with the issue of 3,465,868 shares (13,863,472 post-split), at a unit price of €22.10 each.
Treasury shares
During 2006 the Group bought 1,119,104 treasury shares and sold 19,104, producing a capital gain of €8
thousand.
Datalogic Group
Consolidated quarterly report at 30/09/06 – Notes 58
Demerger reserve
This reserve was a consequence of the split of the parent company on 2 January 1998 into IES SpA
(demerged company, now Datasensor) and Datalogic SpA (the beneficiary company).
b) Other reserves
The reserve for revaluation of financial assets (fair value reserve) comprises revaluation at fair value of AFS
securities until the time when such securities are sold and is net of the tax effect.
A member of the board of directors (as reported in the 'related parties' section of the Management Report)
has signed a PUT option with the parent company (which therefore has a CALL option) on his minority stake
of 10% in Informatics Inc., which is 90% owned by the parent company. In accordance with IAS 32.23, this
transaction is recognised as a financial liability. This liability is offset by a negative reserve of €2,502
thousand as it is believed that the exercise price established approximates the fair value of the minority
interest in the subsidiary as of the option exercise date (2009). For the same reason, net equity and the
minority shareholders' interest in net earnings have been maintained in the financial statements.
The translation reserve is generated from the translation into euros of foreign companies' financial
statements.
c) Profits carried forward
Reserve for treasury shares
This was created by the parent company in relation to buy -back transactions. As required by the Italian Civil
Code, the reserve shows movements corresponding to the purchase and sale of treasury shares during the
period.
Reserve for gain on cancellation and untaxed capital grant reserve
These reserves are a consequence of the merger of Datalogic SpA and Datasud in 2004.
IFRS transition reserve
This is the reserve created upon first-time adoption of international accounting standards at 1 January 2004
(consolidated accounts at 31/12/03) as per IFRS 1.
Datalogic Group
Consolidated quarterly report at 30/09/06 – Notes 59
Retained earnings/ (losses carried forward)
This item includes the equity changes of consolidated companies taking place subsequent to their
acquisition.
Dividends
At 30 September 2006 dividends had been paid in the amount of €3,489 thousand (€15,040 thousand at
31/12/05, including an extraordinary payout of €12,350 thousand).
d) Minority interests
Minority interests amount to €477 thousand and relate to 10% of Informatics Inc.
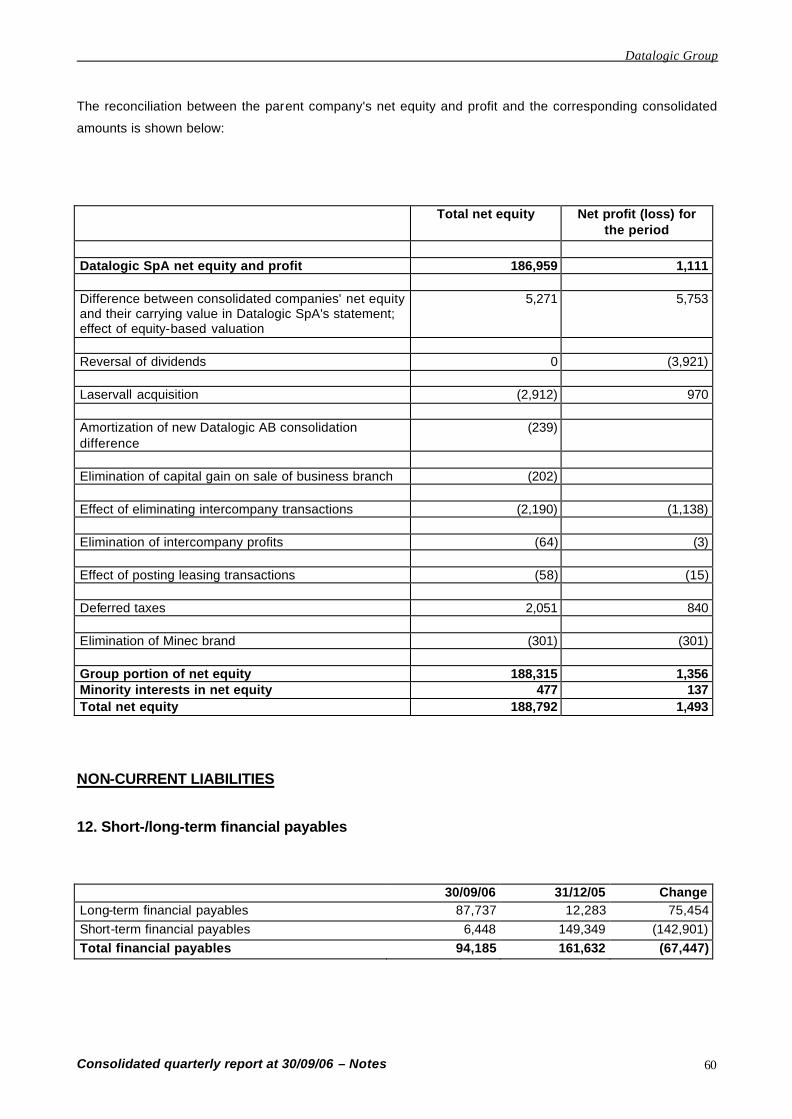
Datalogic Group
Consolidated quarterly report at 30/09/06 – Notes 60
The reconciliation between the parent company's net equity and profit and the corresponding consolidated
amounts is shown below:
Total net equity Net profit (loss) for the period
Datalogic SpA net equity and profit 186,959 1,111
Difference between consolidated companies' net equity and their carrying value in Datalogic SpA's statement; effect of equity-based valuation
5,271 5,753
Reversal of dividends 0 (3,921) Laservall acquisition (2,912) 970 Amortization of new Datalogic AB consolidation difference
(239)
Elimination of capital gain on sale of business branch (202) Effect of eliminating intercompany transactions (2,190) (1,138) Elimination of intercompany profits (64) (3)
Effect of posting leasing transactions (58) (15) Deferred taxes 2,051 840
Elimination of Minec brand (301) (301)
Group portion of net equity 188,315 1,356 Minority interests in net equity 477 137 Total net equity 188,792 1,493
NON-CURRENT LIABILITIES
12. Short-/long-term financial payables
30/09/06 31/12/05 Change
Long-term financial payables 87,737 12,283 75,454 Short-term financial payables 6,448 149,349 (142,901) Total financial payables 94,185 161,632 (67,447)
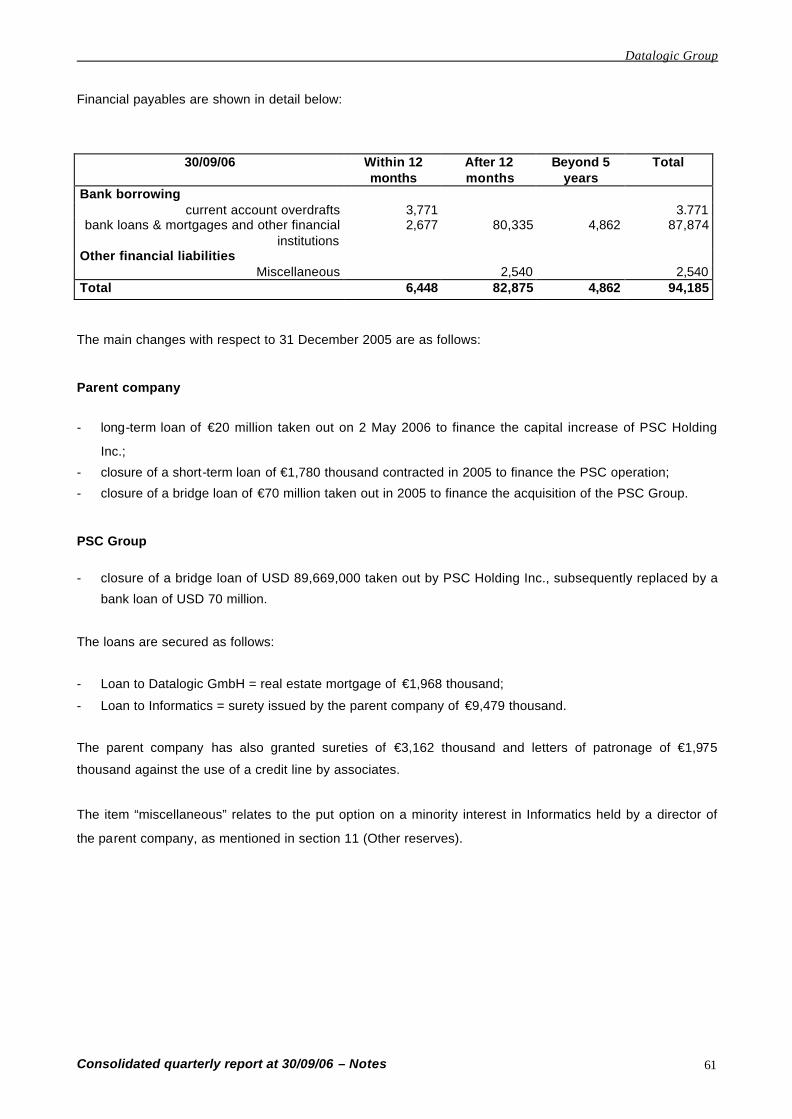
Datalogic Group
Consolidated quarterly report at 30/09/06 – Notes 61
Financial payables are shown in detail below:
30/09/06 Within 12 months
After 12 months
Beyond 5 years
Total
Bank borrowing current account overdrafts 3,771 3.771
bank loans & mortgages and other financial institutions
2,677 80,335 4,862 87,874
Other financial liabilities Miscellaneous 2,540 2,540
Total 6,448 82,875 4,862 94,185
The main changes with respect to 31 December 2005 are as follows:
Parent company
- long-term loan of €20 million taken out on 2 May 2006 to finance the capital increase of PSC Holding
Inc.;
- closure of a short-term loan of €1,780 thousand contracted in 2005 to finance the PSC operation;
- closure of a bridge loan of €70 million taken out in 2005 to finance the acquisition of the PSC Group.
PSC Group
- closure of a bridge loan of USD 89,669,000 taken out by PSC Holding Inc., subsequently replaced by a
bank loan of USD 70 million.
The loans are secured as follows:
- Loan to Datalogic GmbH = real estate mortgage of €1,968 thousand;
- Loan to Informatics = surety issued by the parent company of €9,479 thousand.
The parent company has also granted sureties of €3,162 thousand and letters of patronage of €1,975
thousand against the use of a credit line by associates.
The item “miscellaneous” relates to the put option on a minority interest in Informatics held by a director of
the parent company, as mentioned in section 11 (Other reserves).
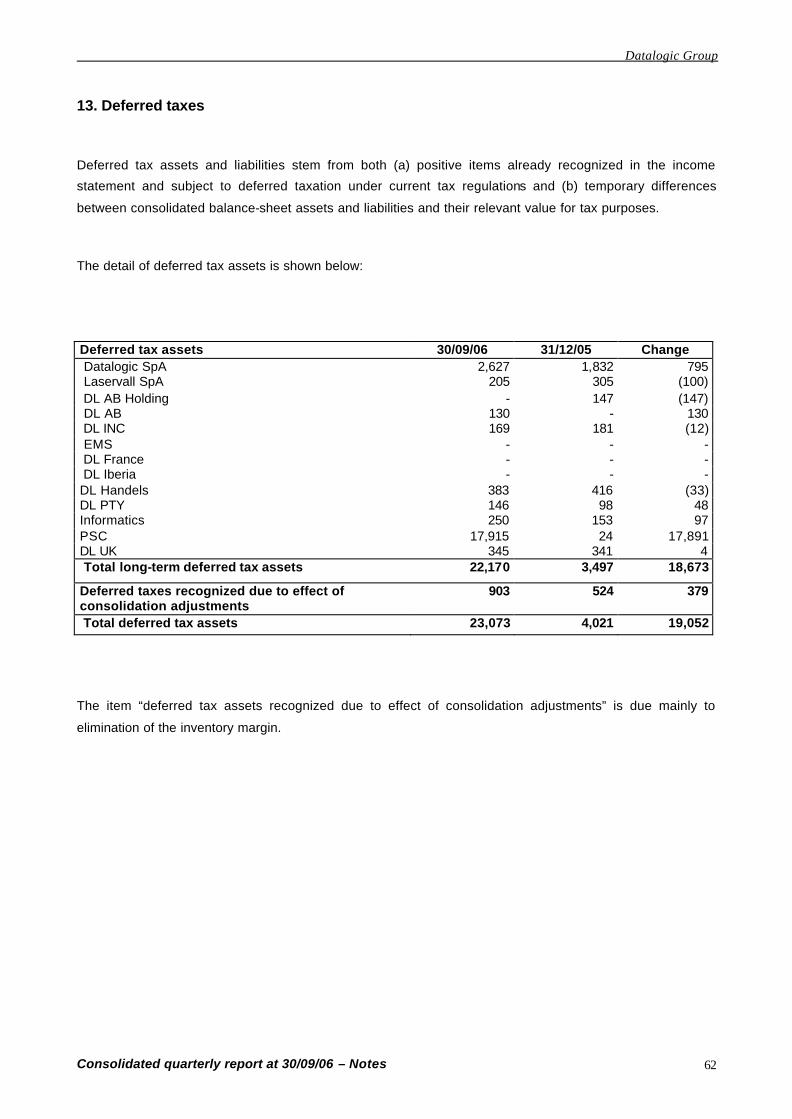
Datalogic Group
Consolidated quarterly report at 30/09/06 – Notes 62
13. Deferred taxes
Deferred tax assets and liabilities stem from both (a) positive items already recognized in the income
statement and subject to deferred taxation under current tax regulations and (b) temporary differences
between consolidated balance-sheet assets and liabilities and their relevant value for tax purposes.
The detail of deferred tax assets is shown below:
Deferred tax assets 30/09/06 31/12/05 Change Datalogic SpA 2,627 1,832 795 Laservall SpA 205 305 (100) DL AB Holding - 147 (147) DL AB 130 - 130 DL INC 169 181 (12) EMS - - - DL France - - - DL Iberia - - - DL Handels 383 416 (33) DL PTY 146 98 48 Informatics 250 153 97 PSC 17,915 24 17,891 DL UK 345 341 4 Total long-term deferred tax assets 22,170 3,497 18,673
Deferred taxes recognized due to effect of consolidation adjustments
903 524 379
Total deferred tax assets 23,073 4,021 19,052
The item “deferred tax assets recognized due to effect of consolidation adjustments” is due mainly to
elimination of the inventory margin.
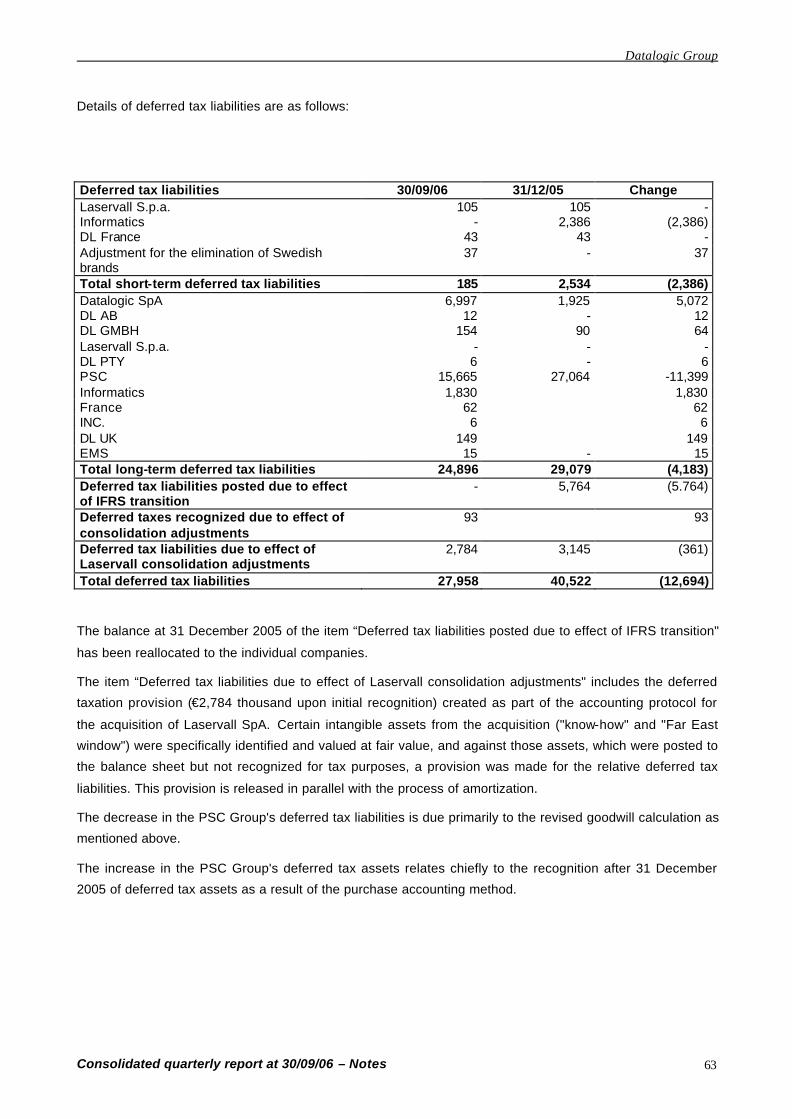
Datalogic Group
Consolidated quarterly report at 30/09/06 – Notes 63
Details of deferred tax liabilities are as follows:
Deferred tax liabilities 30/09/06 31/12/05 Change Laservall S.p.a. 105 105 - Informatics - 2,386 (2,386) DL France 43 43 - Adjustment for the elimination of Swedish brands
37 - 37
Total short-term deferred tax liabilities 185 2,534 (2,386) Datalogic SpA 6,997 1,925 5,072 DL AB 12 - 12 DL GMBH 154 90 64 Laservall S.p.a. - - - DL PTY 6 - 6 PSC 15,665 27,064 -11,399 Informatics 1,830 1,830 France 62 62 INC. 6 6 DL UK 149 149 EMS 15 - 15 Total long-term deferred tax liabilities 24,896 29,079 (4,183) Deferred tax liabilities posted due to effect of IFRS transition
- 5,764 (5.764)
Deferred taxes recognized due to effect of consolidation adjustments
93 93
Deferred tax liabilities due to effect of Laservall consolidation adjustments
2,784 3,145 (361)
Total deferred tax liabilities 27,958 40,522 (12,694)
The balance at 31 December 2005 of the item “Deferred tax liabilities posted due to effect of IFRS transition"
has been reallocated to the individual companies.
The item “Deferred tax liabilities due to effect of Laservall consolidation adjustments" includes the deferred
taxation provision (€2,784 thousand upon initial recognition) created as part of the accounting protocol for
the acquisition of Laservall SpA. Certain intangible assets from the acquisition ("know-how" and "Far East
window") were specifically identified and valued at fair value, and against those assets, which were posted to
the balance sheet but not recognized for tax purposes, a provision was made for the relative deferred tax
liabilities. This provision is released in parallel with the process of amortization.
The decrease in the PSC Group's deferred tax liabilities is due primarily to the revised goodwill calculation as
mentioned above.
The increase in the PSC Group's deferred tax assets relates chiefly to the recognition after 31 December
2005 of deferred tax assets as a result of the purchase accounting method.
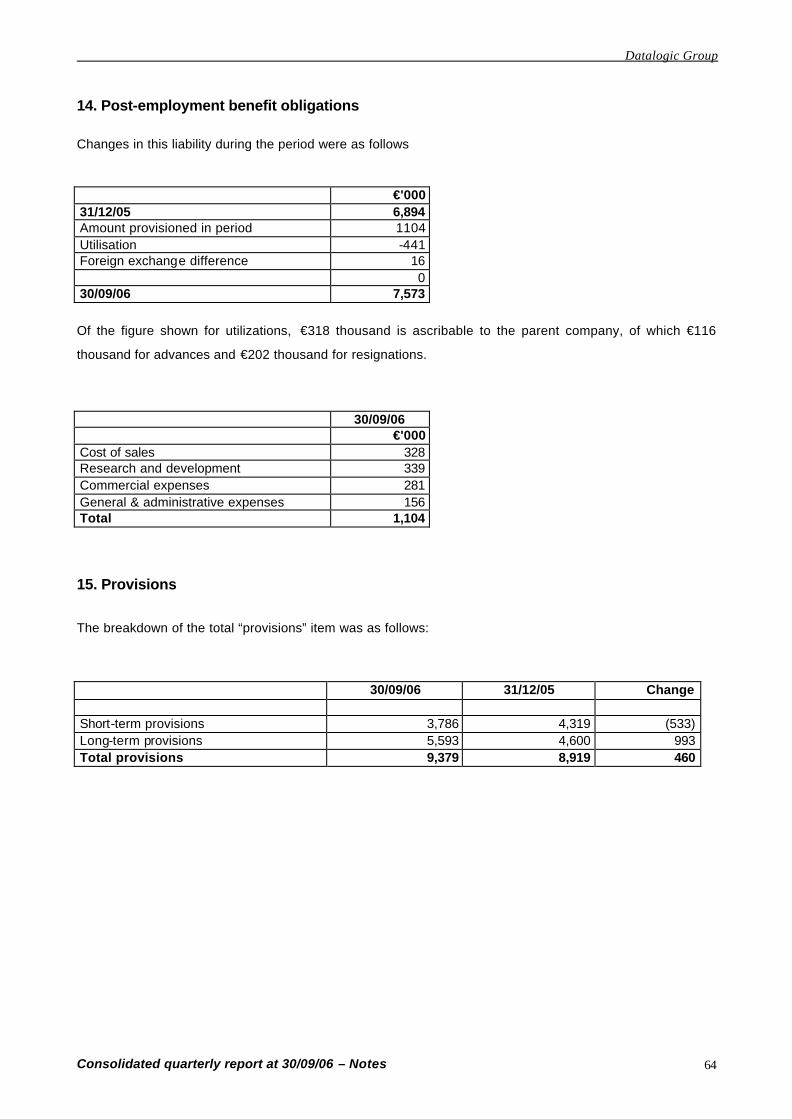
Datalogic Group
Consolidated quarterly report at 30/09/06 – Notes 64
14. Post-employment benefit obligations
Changes in this liability during the period were as follows €'000 31/12/05 6,894 Amount provisioned in period 1104 Utilisation -441 Foreign exchange difference 16 0 30/09/06 7,573
Of the figure shown for utilizations, €318 thousand is ascribable to the parent company, of which €116
thousand for advances and €202 thousand for resignations.
30/09/06 €'000 Cost of sales 328 Research and development 339 Commercial expenses 281 General & administrative expenses 156 Total 1,104
15. Provisions
The breakdown of the total “provisions” item was as follows:
30/09/06 31/12/05 Change
Short-term provisions 3,786 4,319 (533) Long-term provisions 5,593 4,600 993 Total provisions 9,379 8,919 460

Datalogic Group
Consolidated quarterly report at 30/09/06 – Notes 65
Below we show the changes occurring in the item:
31/12/05 Increases (Utilisation) Unused amounts
Forex differences
30/09/06
Product warranty provision 4,672 500 (182) (400) (204) 4,386 Provision for legal disputes 1,371 (1,085) (78) 208 Restructuring provision - 1,502 (798) 704 Provision for management incentive scheme
1,104 981 (14) (8) 2,063
Other 1,772 980 (612) (122) 2,018 Total provisions 8,919 3,963 (2,691) (400) (412) 9,379
The product warranty provision covers the estimated cost of repairing products sold under warranty; it
amounts to €4,386 thousand and is considered sufficient in relation to the specific risk it covers. It is mainly
attributable to the PSC Group (€3,046 thousand, of which €1,939 thousand long-term), to the parent
company (€950 thousand) and to Laservall SpA (€340 thousand).
The restructuring provision was set up against the restructuring plan of the PSC Group.
The decrease in the provision for legal disputes was mainly attributable to the PSC Group.
Of the provision for the management incentive scheme, €1,900 thousand was attributable to the direct parent
company and €163 thousand to the PSC Group.
The heading "Other" mainly consists of:
- €1,742 thousand for a "stock rotation" provision concerning the PSC Group, showing an increase of
€823 thousand vs. 31 December 2005;
- € 91 thousand attributable to the PSC Group and provisioned for compliance with directive 2002/95/EC,
i.e. the “Directive on restrictions of use of some hazardous substances in electric and electronic
equipment”, enacted in Italian law by Legislative Decree no. 151 of 277/5/2005.This fund has decreased
by €612 thousand with regard to 31 December 2005.
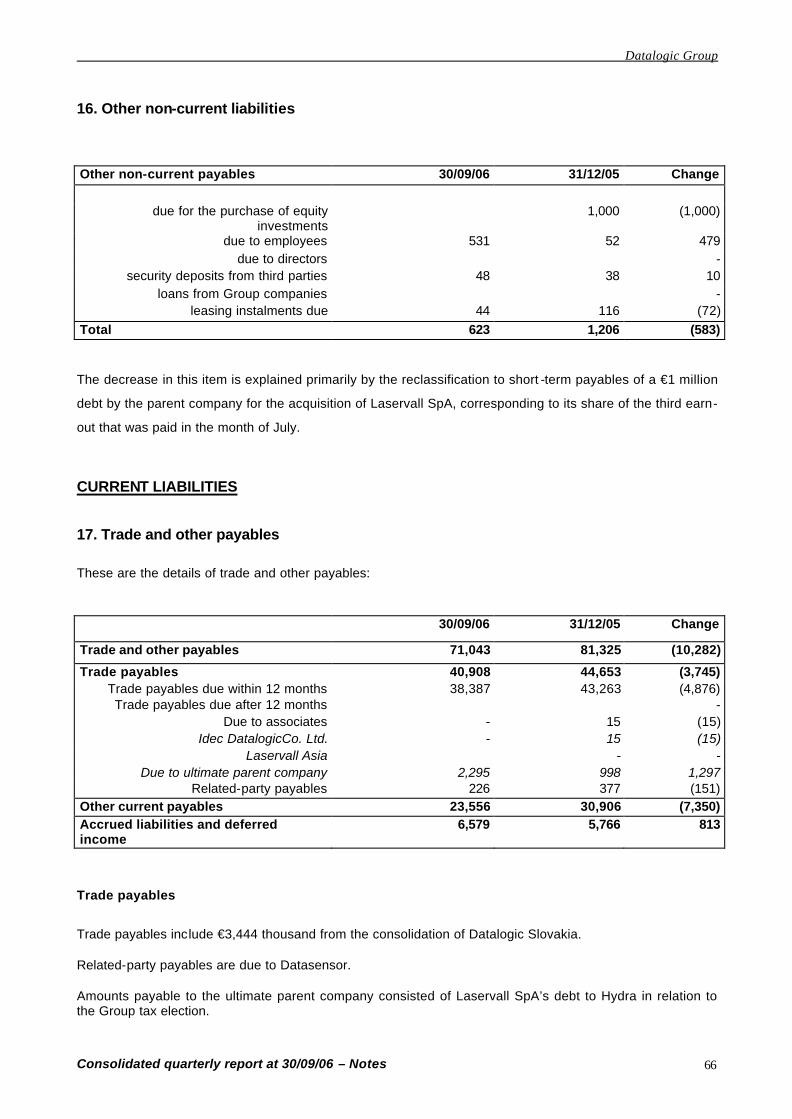
Datalogic Group
Consolidated quarterly report at 30/09/06 – Notes 66
16. Other non-current liabilities
Other non-current payables 30/09/06 31/12/05 Change
due for the purchase of equity
investments 1,000 (1,000)
due to employees 531 52 479 due to directors -
security deposits from third parties 48 38 10 loans from Group companies -
leasing instalments due 44 116 (72) Total 623 1,206 (583)
The decrease in this item is explained primarily by the reclassification to short -term payables of a €1 million
debt by the parent company for the acquisition of Laservall SpA, corresponding to its share of the third earn-
out that was paid in the month of July.
CURRENT LIABILITIES
17. Trade and other payables
These are the details of trade and other payables:
30/09/06 31/12/05 Change
Trade and other payables 71,043 81,325 (10,282)
Trade payables 40,908 44,653 (3,745) Trade payables due within 12 months 38,387 43,263 (4,876) Trade payables due after 12 months -
Due to associates - 15 (15) Idec DatalogicCo. Ltd. - 15 (15)
Laservall Asia - - Due to ultimate parent company 2,295 998 1,297
Related-party payables 226 377 (151) Other current payables 23,556 30,906 (7,350) Accrued liabilities and deferred income
6,579 5,766 813
Trade payables
Trade payables include €3,444 thousand from the consolidation of Datalogic Slovakia. Related-party payables are due to Datasensor. Amounts payable to the ultimate parent company consisted of Laservall SpA’s debt to Hydra in relation to the Group tax election.
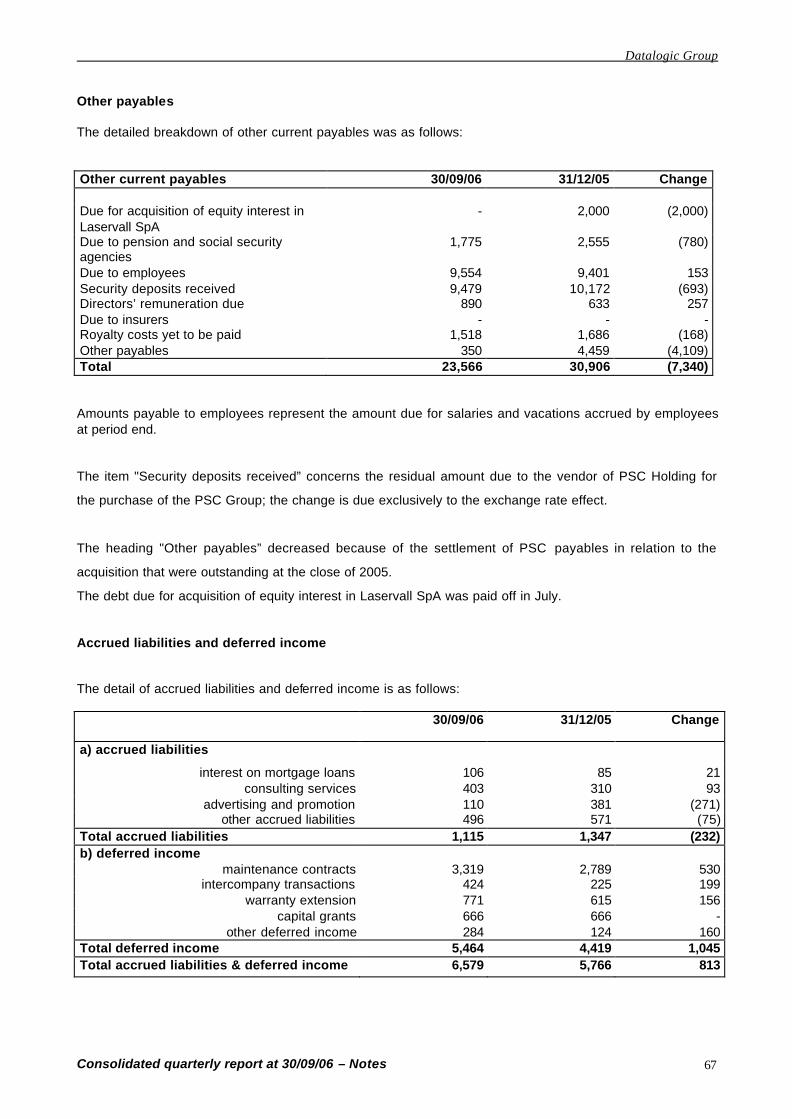
Datalogic Group
Consolidated quarterly report at 30/09/06 – Notes 67
Other payables The detailed breakdown of other current payables was as follows: Other current payables 30/09/06 31/12/05 Change
Due for acquisition of equity interest in Laservall SpA
- 2,000 (2,000)
Due to pension and social security agencies
1,775 2,555 (780)
Due to employees 9,554 9,401 153 Security deposits received 9,479 10,172 (693) Directors’ remuneration due 890 633 257 Due to insurers - - - Royalty costs yet to be paid 1,518 1,686 (168) Other payables 350 4,459 (4,109) Total 23,566 30,906 (7,340) Amounts payable to employees represent the amount due for salaries and vacations accrued by employees at period end.
The item "Security deposits received” concerns the residual amount due to the vendor of PSC Holding for
the purchase of the PSC Group; the change is due exclusively to the exchange rate effect.
The heading "Other payables” decreased because of the settlement of PSC payables in relation to the
acquisition that were outstanding at the close of 2005.
The debt due for acquisition of equity interest in Laservall SpA was paid off in July. Accrued liabilities and deferred income The detail of accrued liabilities and deferred income is as follows:
30/09/06 31/12/05 Change
a) accrued liabilities
interest on mortgage loans 106 85 21 consulting services 403 310 93
advertising and promotion 110 381 (271) other accrued liabilities 496 571 (75)
Total accrued liabilities 1,115 1,347 (232) b) deferred income
maintenance contracts 3,319 2,789 530 intercompany transactions 424 225 199
warranty extension 771 615 156 capital grants 666 666 -
other deferred income 284 124 160 Total deferred income 5,464 4,419 1,045 Total accrued liabilities & deferred income 6,579 5,766 813
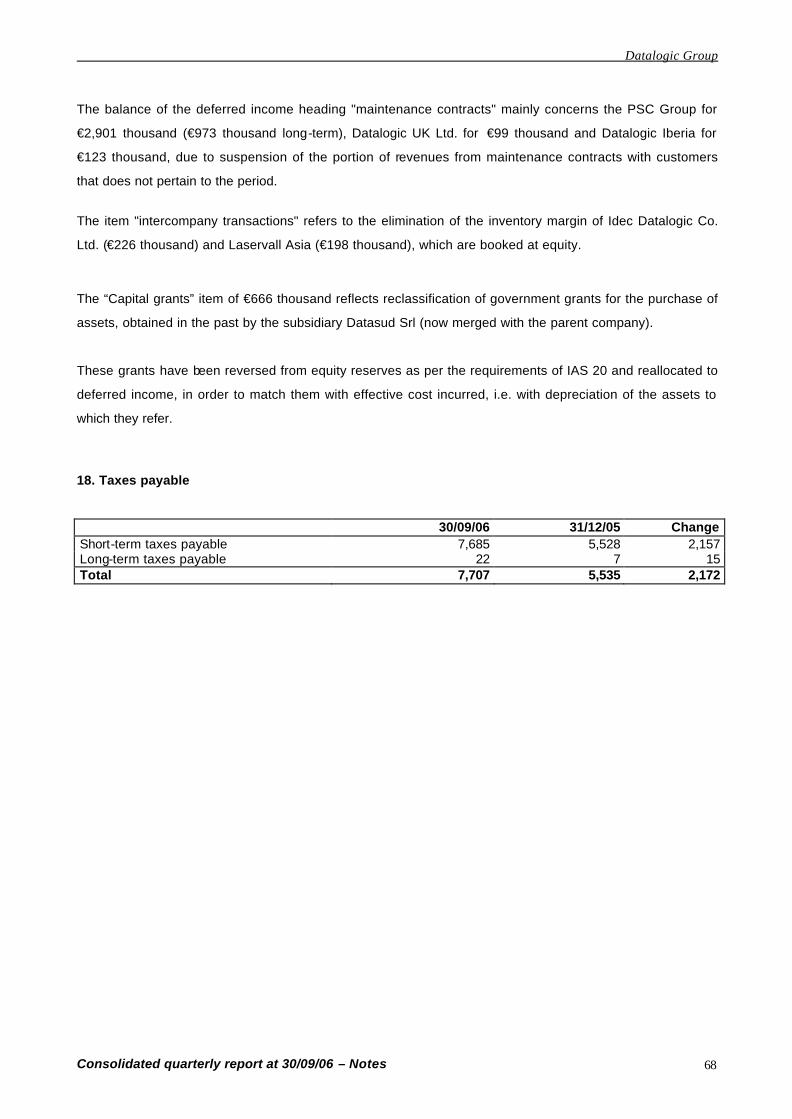
Datalogic Group
Consolidated quarterly report at 30/09/06 – Notes 68
The balance of the deferred income heading "maintenance contracts" mainly concerns the PSC Group for
€2,901 thousand (€973 thousand long-term), Datalogic UK Ltd. for €99 thousand and Datalogic Iberia for
€123 thousand, due to suspension of the portion of revenues from maintenance contracts with customers
that does not pertain to the period.
The item "intercompany transactions" refers to the elimination of the inventory margin of Idec Datalogic Co.
Ltd. (€226 thousand) and Laservall Asia (€198 thousand), which are booked at equity.
The “Capital grants” item of €666 thousand reflects reclassification of government grants for the purchase of
assets, obtained in the past by the subsidiary Datasud Srl (now merged with the parent company).
These grants have been reversed from equity reserves as per the requirements of IAS 20 and reallocated to
deferred income, in order to match them with effective cost incurred, i.e. with depreciation of the assets to
which they refer. 18. Taxes payable
30/09/06 31/12/05 Change Short-term taxes payable 7,685 5,528 2,157 Long-term taxes payable 22 7 15 Total 7,707 5,535 2,172

Datalogic Group
Consolidated quarterly report at 30/09/06 – Notes 69
At 30 September 2006, taxes payable amounted to €7,707 thousand, as detailed below, by individual
company:
Short-term taxes payable 30/09/06 31/12/05 Change DL SpA 2,225 2,042 183 PSC 892 1,147 (255) Laservall SpA 565 573 (8) DL AB Holding 22 19 3 DL AB 154 227 (73) Informatics 184 9 175 DL GMBH 332 627 (295) BV 1,199 34 1,165 HANDEL 4 7 (3) DL Iberia 299 339 (40) DL France 179 31 148 DL UK 347 422 (75) INC. 231 52 179 EMS 7 - 7 DL PTY 30 - 30 DL Slovakia 1,036 - 1,036 DL Asia - - - Total 7,706 5,528 2,178 payables recognized due to consolidation adjustments
(21) - (21)
Total short-term taxes payable 7,685 5,528 2,157 Long-term taxes payable DL UK 22 - 22 DL PTY - 7 (7) PSC - - - Informatics - - - EMS - - - Total long-term taxes payable 22 7 15 Total taxes payable 7,707 5,535 2,172
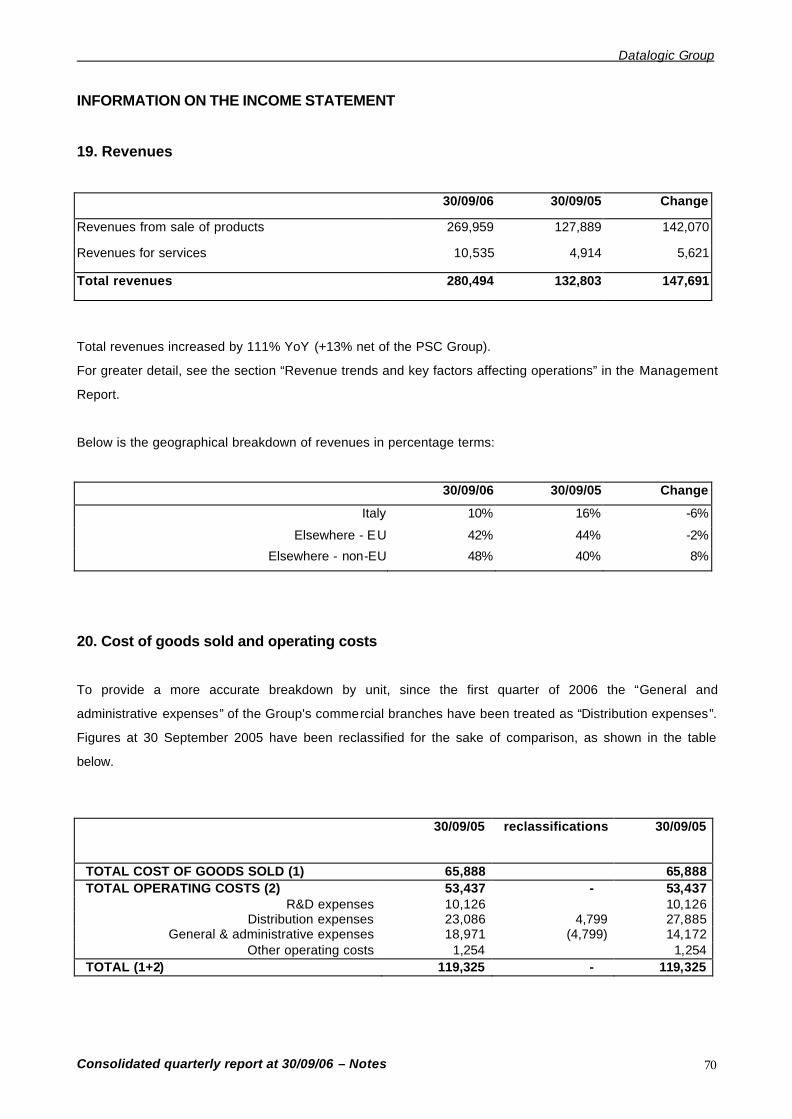
Datalogic Group
Consolidated quarterly report at 30/09/06 – Notes 70
INFORMATION ON THE INCOME STATEMENT 19. Revenues
30/09/06 30/09/05 Change
Revenues from sale of products 269,959 127,889 142,070
Revenues for services 10,535 4,914 5,621
Total revenues 280,494 132,803 147,691
Total revenues increased by 111% YoY (+13% net of the PSC Group).
For greater detail, see the section “Revenue trends and key factors affecting operations” in the Management
Report.
Below is the geographical breakdown of revenues in percentage terms:
30/09/06 30/09/05 Change
Italy 10% 16% -6%
Elsewhere - EU 42% 44% -2%
Elsewhere - non-EU 48% 40% 8%
20. Cost of goods sold and operating costs
To provide a more accurate breakdown by unit, since the first quarter of 2006 the “General and
administrative expenses” of the Group's commercial branches have been treated as “Distribution expenses”.
Figures at 30 September 2005 have been reclassified for the sake of comparison, as shown in the table
below.
30/09/05 reclassifications 30/09/05
TOTAL COST OF GOODS SOLD (1) 65,888 65,888 TOTAL OPERATING COSTS (2) 53,437 - 53,437
R&D expenses 10,126 10,126 Distribution expenses 23,086 4,799 27,885
General & administrative expenses 18,971 (4,799) 14,172 Other operating costs 1,254 1,254
TOTAL (1+2) 119,325 - 119,325
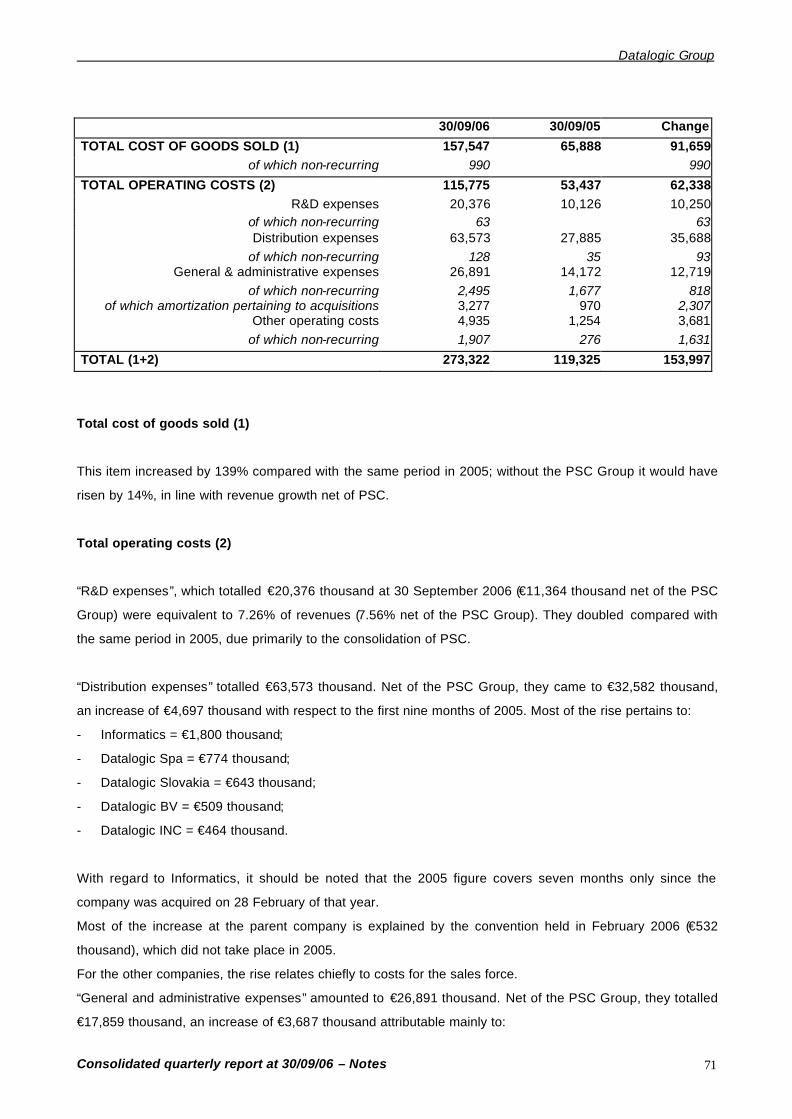
Datalogic Group
Consolidated quarterly report at 30/09/06 – Notes 71
30/09/06 30/09/05 Change
TOTAL COST OF GOODS SOLD (1) 157,547 65,888 91,659 of which non-recurring 990 990
TOTAL OPERATING COSTS (2) 115,775 53,437 62,338 R&D expenses 20,376 10,126 10,250
of which non-recurring 63 63 Distribution expenses 63,573 27,885 35,688
of which non-recurring 128 35 93 General & administrative expenses 26,891 14,172 12,719
of which non-recurring 2,495 1,677 818 of which amortization pertaining to acquisitions 3,277 970 2,307
Other operating costs 4,935 1,254 3,681 of which non-recurring 1,907 276 1,631
TOTAL (1+2) 273,322 119,325 153,997
Total cost of goods sold (1)
This item increased by 139% compared with the same period in 2005; without the PSC Group it would have
risen by 14%, in line with revenue growth net of PSC.
Total operating costs (2)
“R&D expenses”, which totalled €20,376 thousand at 30 September 2006 (€11,364 thousand net of the PSC
Group) were equivalent to 7.26% of revenues (7.56% net of the PSC Group). They doubled compared with
the same period in 2005, due primarily to the consolidation of PSC.
“Distribution expenses” totalled €63,573 thousand. Net of the PSC Group, they came to €32,582 thousand,
an increase of €4,697 thousand with respect to the first nine months of 2005. Most of the rise pertains to:
- Informatics = €1,800 thousand;
- Datalogic Spa = €774 thousand;
- Datalogic Slovakia = €643 thousand;
- Datalogic BV = €509 thousand;
- Datalogic INC = €464 thousand.
With regard to Informatics, it should be noted that the 2005 figure covers seven months only since the
company was acquired on 28 February of that year.
Most of the increase at the parent company is explained by the convention held in February 2006 (€532
thousand), which did not take place in 2005.
For the other companies, the rise relates chiefly to costs for the sales force.
“General and administrative expenses” amounted to €26,891 thousand. Net of the PSC Group, they totalled
€17,859 thousand, an increase of €3,687 thousand attributable mainly to:

Datalogic Group
Consolidated quarterly report at 30/09/06 – Notes 72
- the parent company, for €2,496 thousand pertaining to the PSC acquisition;
- Informatics, for €1,433 thousand, of which €672 thousand related to payroll & employee benefit costs
(€487 thousand for an incentive scheme) and €482 thousand related to depreciation & amortization due
to the acquisition.
The detailed breakdown of “Other operating costs” is as follows:
30/09/06 30/09/05 Change
Capital losses on assets 172 11 161 Incidental costs and cancellation of income
items 64 138 (74)
Provisions for doubtful accounts 848 263 585 Other provisions 2,894 379 2,515
Non-income taxes 820 309 511 Other 137 154 (17)
TOTAL OTHER OPERATING COSTS 4,935 1,254 3,681
Other provisions, totalling €2,894 thousand, consisted of the following items:
• a provision of €1,907 thousand made by PSC Group to help pay for a restructuring and development
plan, one effect of which is that 60 staff members have been cut for eventual savings of over 4.4 million
dollars per year;
• a provision of €900 thousand made by the parent company for the estimated 1H06 portion of a long-term
management incentive scheme (due to end in 2008);
• €87 thousand for tax assessments underway on the parent company's accounts.
The provision for doubtful accounts increased by €585 thousand, due mainly to a provision by Datalogic
GMBH (€296 thousand) in relation to the financial problems of one of its distributors and a provision by the
PSC Group (€361 thousand).
Non-income taxes were attributable mainly to the PSC Group (€400 thousand), the parent company (€212
thousand), Datalogic UK (€59 thousand), Datalogic FRANCE (€56 thousand) and Informatics (€43
thousand).
Capital losses on assets, totalling €172 thousand, relate mainly to the parent company.
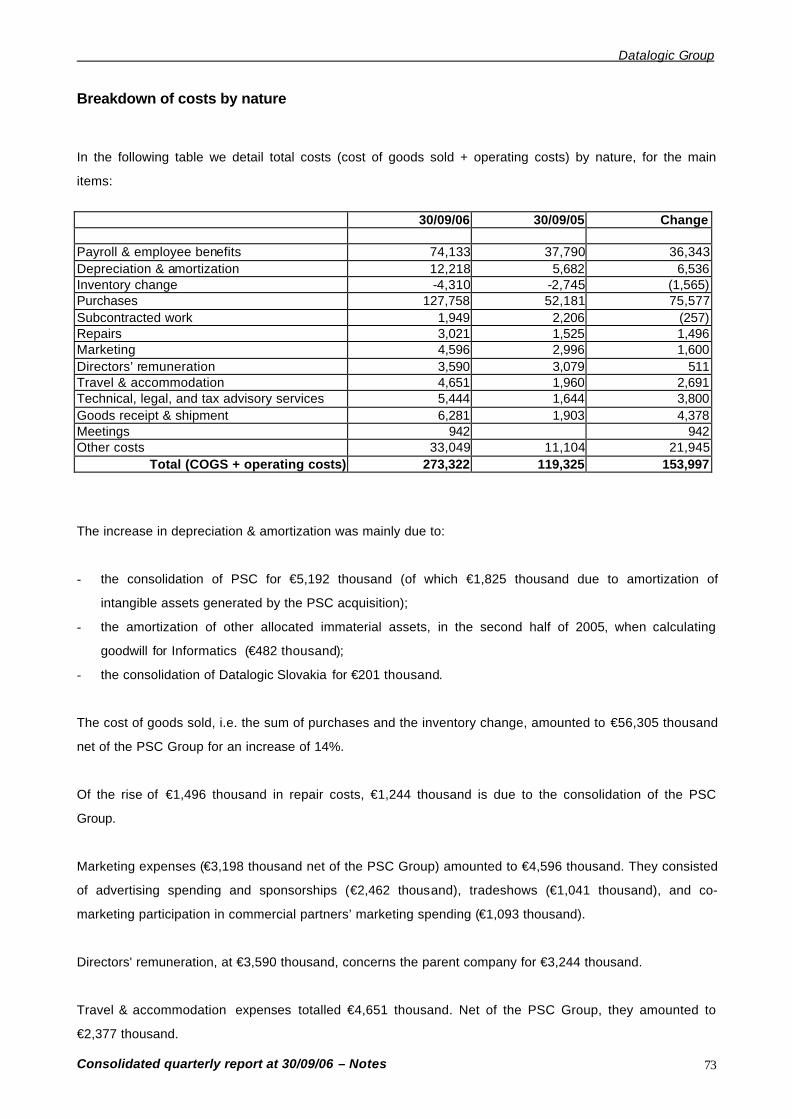
Datalogic Group
Consolidated quarterly report at 30/09/06 – Notes 73
Breakdown of costs by nature
In the following table we detail total costs (cost of goods sold + operating costs) by nature, for the main
items:
30/09/06 30/09/05 Change
Payroll & employee benefits 74,133 37,790 36,343 Depreciation & amortization 12,218 5,682 6,536 Inventory change -4,310 -2,745 (1,565) Purchases 127,758 52,181 75,577 Subcontracted work 1,949 2,206 (257) Repairs 3,021 1,525 1,496 Marketing 4,596 2,996 1,600 Directors’ remuneration 3,590 3,079 511 Travel & accommodation 4,651 1,960 2,691 Technical, legal, and tax advisory services 5,444 1,644 3,800 Goods receipt & shipment 6,281 1,903 4,378 Meetings 942 942 Other costs 33,049 11,104 21,945
Total (COGS + operating costs) 273,322 119,325 153,997
The increase in depreciation & amortization was mainly due to:
- the consolidation of PSC for €5,192 thousand (of which €1,825 thousand due to amortization of
intangible assets generated by the PSC acquisition);
- the amortization of other allocated immaterial assets, in the second half of 2005, when calculating
goodwill for Informatics (€482 thousand);
- the consolidation of Datalogic Slovakia for €201 thousand.
The cost of goods sold, i.e. the sum of purchases and the inventory change, amounted to €56,305 thousand
net of the PSC Group for an increase of 14%.
Of the rise of €1,496 thousand in repair costs, €1,244 thousand is due to the consolidation of the PSC
Group.
Marketing expenses (€3,198 thousand net of the PSC Group) amounted to €4,596 thousand. They consisted
of advertising spending and sponsorships (€2,462 thousand), tradeshows (€1,041 thousand), and co-
marketing participation in commercial partners’ marketing spending (€1,093 thousand).
Directors' remuneration, at €3,590 thousand, concerns the parent company for €3,244 thousand.
Travel & accommodation expenses totalled €4,651 thousand. Net of the PSC Group, they amounted to
€2,377 thousand.
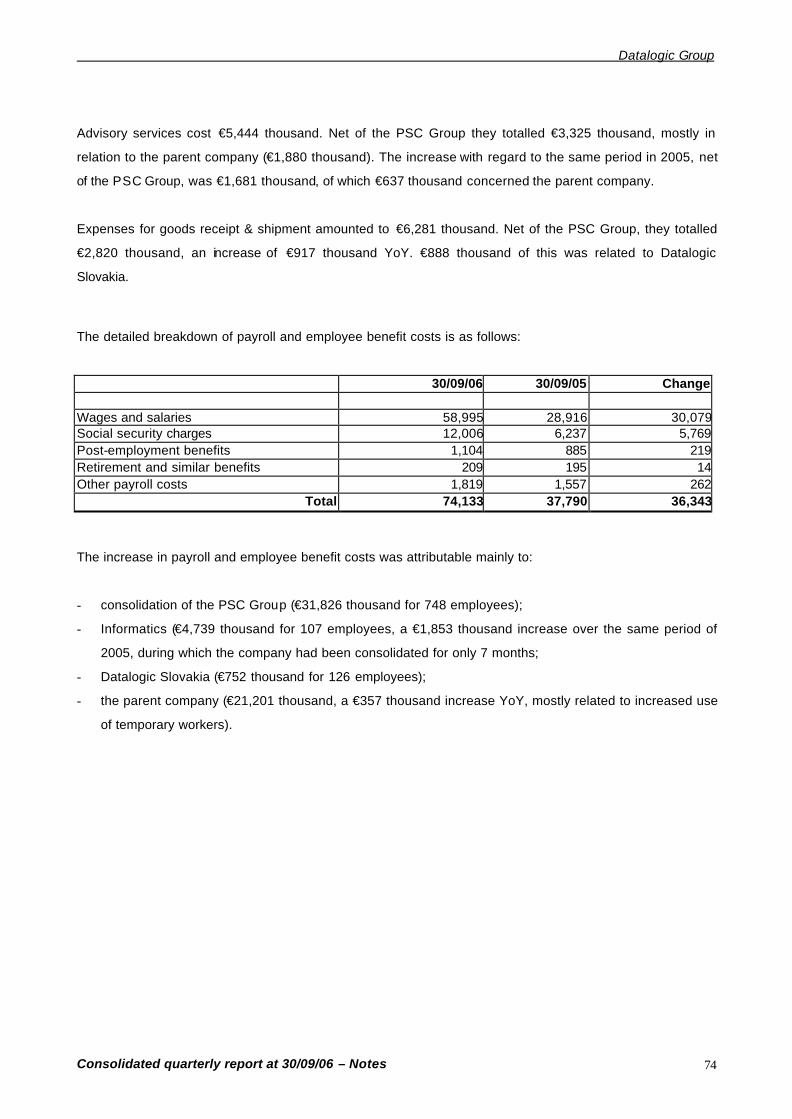
Datalogic Group
Consolidated quarterly report at 30/09/06 – Notes 74
Advisory services cost €5,444 thousand. Net of the PSC Group they totalled €3,325 thousand, mostly in
relation to the parent company (€1,880 thousand). The increase with regard to the same period in 2005, net
of the PSC Group, was €1,681 thousand, of which €637 thousand concerned the parent company.
Expenses for goods receipt & shipment amounted to €6,281 thousand. Net of the PSC Group, they totalled
€2,820 thousand, an increase of €917 thousand YoY. €888 thousand of this was related to Datalogic
Slovakia.
The detailed breakdown of payroll and employee benefit costs is as follows:
30/09/06 30/09/05 Change
Wages and salaries 58,995 28,916 30,079Social security charges 12,006 6,237 5,769Post-employment benefits 1,104 885 219Retirement and similar benefits 209 195 14Other payroll costs 1,819 1,557 262
Total 74,133 37,790 36,343
The increase in payroll and employee benefit costs was attributable mainly to:
- consolidation of the PSC Group (€31,826 thousand for 748 employees);
- Informatics (€4,739 thousand for 107 employees, a €1,853 thousand increase over the same period of
2005, during which the company had been consolidated for only 7 months;
- Datalogic Slovakia (€752 thousand for 126 employees);
- the parent company (€21,201 thousand, a €357 thousand increase YoY, mostly related to increased use
of temporary workers).
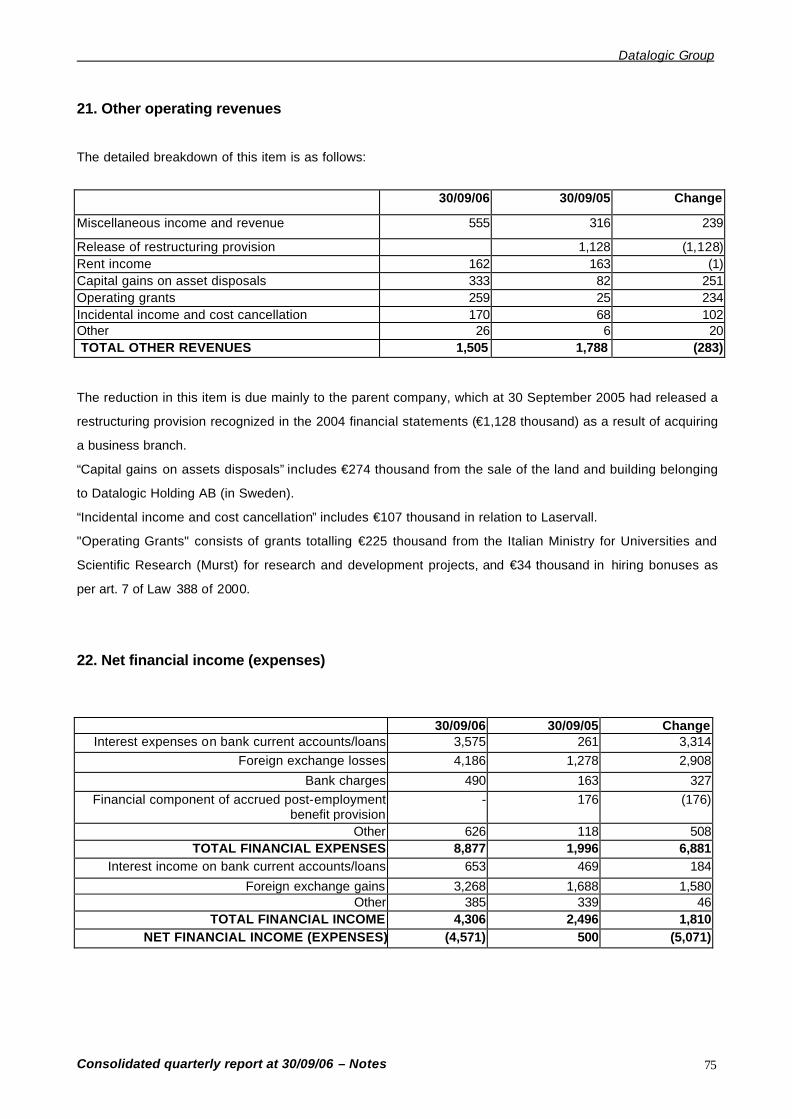
Datalogic Group
Consolidated quarterly report at 30/09/06 – Notes 75
21. Other operating revenues
The detailed breakdown of this item is as follows:
30/09/06 30/09/05 Change
Miscellaneous income and revenue 555 316 239
Release of restructuring provision 1,128 (1,128) Rent income 162 163 (1) Capital gains on asset disposals 333 82 251 Operating grants 259 25 234 Incidental income and cost cancellation 170 68 102 Other 26 6 20 TOTAL OTHER REVENUES 1,505 1,788 (283)
The reduction in this item is due mainly to the parent company, which at 30 September 2005 had released a
restructuring provision recognized in the 2004 financial statements (€1,128 thousand) as a result of acquiring
a business branch.
“Capital gains on assets disposals” includes €274 thousand from the sale of the land and building belonging
to Datalogic Holding AB (in Sweden).
“Incidental income and cost cancellation” includes €107 thousand in relation to Laservall.
"Operating Grants" consists of grants totalling €225 thousand from the Italian Ministry for Universities and
Scientific Research (Murst) for research and development projects, and €34 thousand in hiring bonuses as
per art. 7 of Law 388 of 2000.
22. Net financial income (expenses)
30/09/06 30/09/05 Change
Interest expenses on bank current accounts/loans 3,575 261 3,314 Foreign exchange losses 4,186 1,278 2,908
Bank charges 490 163 327 Financial component of accrued post-employment
benefit provision - 176 (176)
Other 626 118 508 TOTAL FINANCIAL EXPENSES 8,877 1,996 6,881
Interest income on bank current accounts/loans 653 469 184
Foreign exchange gains 3,268 1,688 1,580 Other 385 339 46
TOTAL FINANCIAL INCOME 4,306 2,496 1,810 NET FINANCIAL INCOME (EXPENSES) (4,571) 500 (5,071)
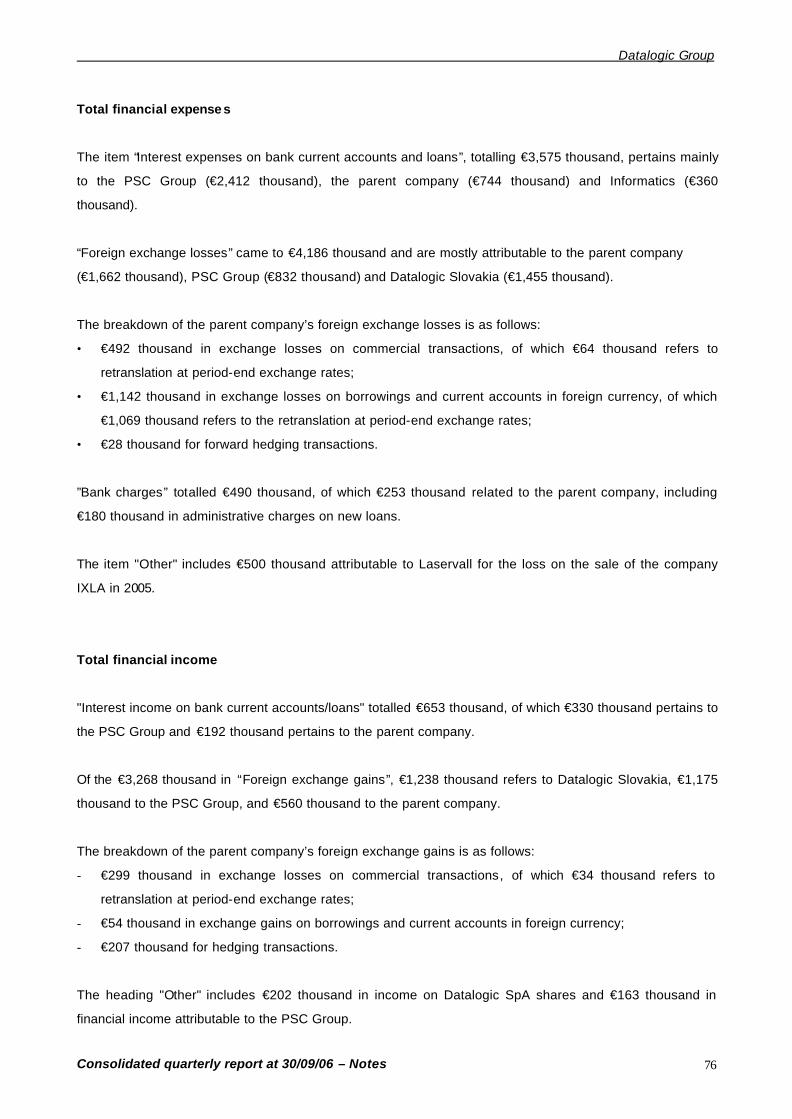
Datalogic Group
Consolidated quarterly report at 30/09/06 – Notes 76
Total financial expense s
The item “Interest expenses on bank current accounts and loans”, totalling €3,575 thousand, pertains mainly
to the PSC Group (€2,412 thousand), the parent company (€744 thousand) and Informatics (€360
thousand).
“Foreign exchange losses” came to €4,186 thousand and are mostly attributable to the parent company
(€1,662 thousand), PSC Group (€832 thousand) and Datalogic Slovakia (€1,455 thousand).
The breakdown of the parent company’s foreign exchange losses is as follows:
• €492 thousand in exchange losses on commercial transactions, of which €64 thousand refers to
retranslation at period-end exchange rates;
• €1,142 thousand in exchange losses on borrowings and current accounts in foreign currency, of which
€1,069 thousand refers to the retranslation at period-end exchange rates;
• €28 thousand for forward hedging transactions.
”Bank charges” totalled €490 thousand, of which €253 thousand related to the parent company, including
€180 thousand in administrative charges on new loans.
The item "Other" includes €500 thousand attributable to Laservall for the loss on the sale of the company
IXLA in 2005.
Total financial income
"Interest income on bank current accounts/loans" totalled €653 thousand, of which €330 thousand pertains to
the PSC Group and €192 thousand pertains to the parent company.
Of the €3,268 thousand in “Foreign exchange gains”, €1,238 thousand refers to Datalogic Slovakia, €1,175
thousand to the PSC Group, and €560 thousand to the parent company.
The breakdown of the parent company’s foreign exchange gains is as follows:
- €299 thousand in exchange losses on commercial transactions, of which €34 thousand refers to
retranslation at period-end exchange rates;
- €54 thousand in exchange gains on borrowings and current accounts in foreign currency;
- €207 thousand for hedging transactions.
The heading "Other" includes €202 thousand in income on Datalogic SpA shares and €163 thousand in
financial income attributable to the PSC Group.
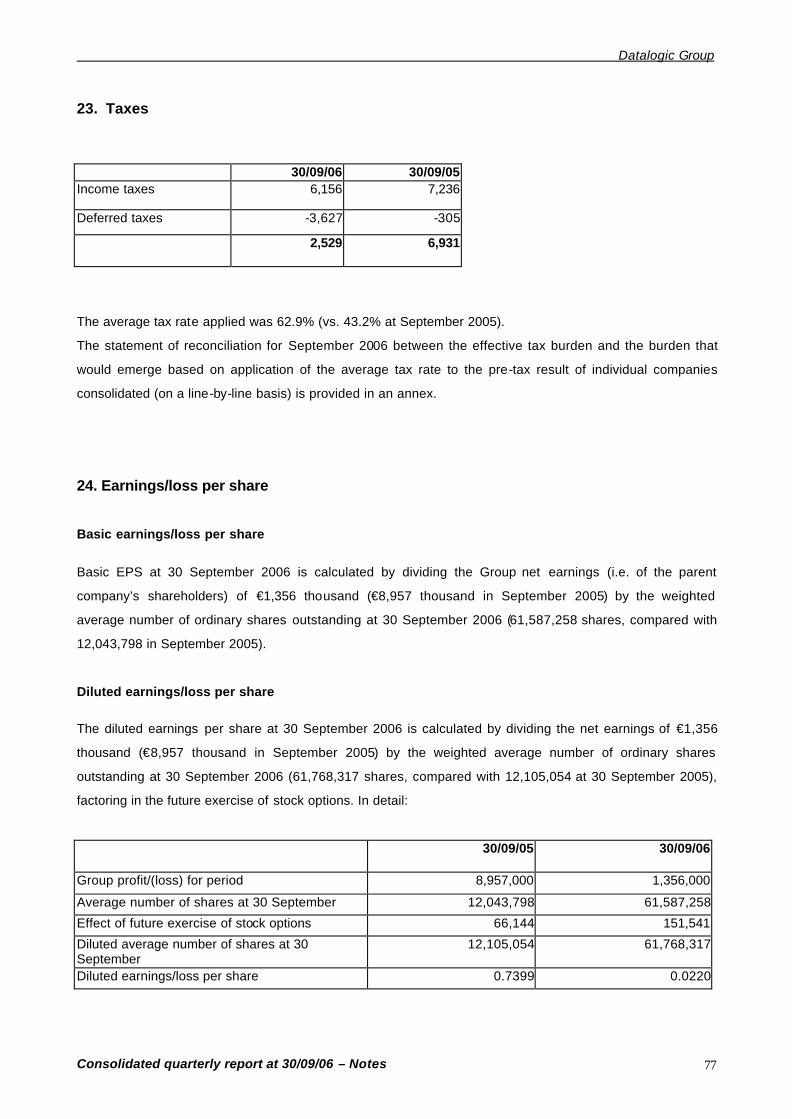
Datalogic Group
Consolidated quarterly report at 30/09/06 – Notes 77
23. Taxes
30/09/06 30/09/05 Income taxes 6,156 7,236
Deferred taxes -3,627 -305
2,529 6,931
The average tax rate applied was 62.9% (vs. 43.2% at September 2005).
The statement of reconciliation for September 2006 between the effective tax burden and the burden that
would emerge based on application of the average tax rate to the pre-tax result of individual companies
consolidated (on a line-by-line basis) is provided in an annex.
24. Earnings/loss per share
Basic earnings/loss per share
Basic EPS at 30 September 2006 is calculated by dividing the Group net earnings (i.e. of the parent
company’s shareholders) of €1,356 thousand (€8,957 thousand in September 2005) by the weighted
average number of ordinary shares outstanding at 30 September 2006 (61,587,258 shares, compared with
12,043,798 in September 2005).
Diluted earnings/loss per share
The diluted earnings per share at 30 September 2006 is calculated by dividing the net earnings of €1,356
thousand (€8,957 thousand in September 2005) by the weighted average number of ordinary shares
outstanding at 30 September 2006 (61,768,317 shares, compared with 12,105,054 at 30 September 2005),
factoring in the future exercise of stock options. In detail: 30/09/05 30/09/06
Group profit/(loss) for period 8,957,000 1,356,000
Average number of shares at 30 September 12,043,798 61,587,258
Effect of future exercise of stock options 66,144 151,541
Diluted average number of shares at 30 September
12,105,054 61,768,317
Diluted earnings/loss per share 0.7399 0.0220
Datalogic Group
Consolidated quarterly report at 30/09/06 – Notes 78
SEGMENT REPORTING
Segment information
A business segment is a group of assets and operations the aim of which is to provide products or services
subject to risks and returns that are different from those of other business segments. A geographical
segment refers to a group of assets and operations that provides products and services within a particular
economic environment subject to risks and returns that are different from those of components operating in
other economic environments.
We consider business segments to be primary (see IAS 14), while geographical segments have been
considered secondary. Our segment information reflects the Group’s internal reporting structure.
The amounts used for intersegment transfers of components or products are the Group’s effective
intercompany selling prices.
Segment information includes both directly attributable costs and those reasonably allocable.
Business segments
The Group consists of the following business segments:
Data Capture: this is Datalogic’s traditional business and includes the development, production and sale of
the following products: HHR (hand-held readers), USS (unattended scanning systems) for the industrial
market, MC (mobile computers), and checkout scanners for the retail market.
Business Development: this segment includes businesses featuring high growth potential within
Datalogic’s traditional offering (RFID [radio-frequency identification devices] and self-scanning solutions) or
those adjacent to the Group’s traditional business areas. It consists of:
- Industrial marking products;
- Distribution of automatic identification products.
These last two activities relate to two companies recently acquired by Datalogic SpA (respectively Laservall
SpA and Informatics).

Datalogic Group
Consolidated quarterly report at 30/09/06 – Notes 79
Data Capture Business
Development
Adjustments
Consolidated Total
(€'000) 30/09/06 30/09/05 30/09/06 30/09/05 30/09/06 30/09/05 30/09/06 30/09/05
External sales 224,697 90,959 55,797 41,844 280,494 132,803 Intersegment sales 755 35 35 28 (790) 63
-
- Total revenues 225,452 90,994 55,832 41,872 (790) 63 280,494 132,803 Cost of goods sold 130,257 44,960 26,300 20,960 (32) 156,557 65,888 Intersegment cost of goods sold 35 7 755 26 (790) (33)
- 0
Gross profit 95,160 46,027 28,777 20,886 -
2 123,937 66,915
% of revenues 42.21% 50.58% 51.54% 49.88% 0.00% -3.17% 44.19% 50.39% Other allocable revenues 1,279 1,636 226 152 1,505 1,788 Other intersegment revenues 282 222
-
- 282 222
-
- Allocable operating costs: 86,093 34,179 18,005 13,854 (282) (396) 103,816 47,637 % of revenues 38.19% 37.56% 32.25% 33.09% 35.70% 628.57% 37.01% 35.87% R&D expenses 17,262 7,642 3,063 2,484 (12) 20,313 10,126 Distribution expenses 53,707 20,098 10,008 7,967 (270) (215) 63,445 27,850 Allocable G&A costs 13,249 5,835 4,681 3,029
-(181) 17,930 8,683
Other allocable operating costs 1,875 604 253 374 2,128 978 SEGMENT RESULT 10,628 13,705 10,998 7,184
-176 21,626 21,065
% of revenues 4.71% 15.06% 19.70% 17.16% 0.00% -279.37% 7.71% 15.86% Unallocable G&A costs
- 3,189 2,841
Other unallocable operating costs
900
EBITANR 10,628 13,705 10,998 7,184 -
176 17,537 18,224
% of revenues 4.71% 15.06% 19.70% 17.16% 0.00% -279.37% 6.25% 13.72% Allocable non-recurring costs/revenues
(5,583) (311) 1,677 (5,583) (1,988)
Unallocable non-recurring costs/revenues
-
Amortization due to acquisitions (1,825) (1,452) (970) (3,277) (970) Net financial income (expenses) (4,571) 500 Share of associates’ profit (324) 57 240 223 (84) 280 Income taxes
- (2,529) (6,931)
NET PROFIT/LOSS 2,896 13,451 9,786 4,760 -
176 1,493 9,115
% of revenues 1.28% 14.78% 17.53% 11.37% 0.00% -279.37% 0.53% 6.86% Minority interests’ share of net profit/loss
137 137 158
GROUP NET PROFIT/LOSS 2,896 13,451 9,649 4,760 -
176 1,356 8,957
% of revenues 1.28% 14.78% 17.28% 11.37% 0.00% -279.37% 0.48% 6.74%

Datalogic Group
Consolidated quarterly report at 30/09/06 – Notes 80
Data Capture Business
Development Adjustments Consolidated Total
(€'000) 30/09/06 30/09/05 30/09/06 30/09/05 30/09/06 30/09/05 30/09/06 30/09/05
Segment assets 286,992 101,401 55,002 49,694 (229) 341,765 151,095 Interests in subsidiaries booked at equity 679 554 405 662 1,084 1,216
Unallocable assets 64,632 66,283 Total assets 287,671 101,955 55,407 50,356 (229) - 407,481 218,594
Segment liabilities 69,753 36,793 14,109 6,133 (229) (228) 83,633 42,698
Unallocable liabilities 134,843 37,899 Equity 188,792 137,997 Total liabilities 69,753 36,793 14,109 6,133 (229) (228) 407,268 218,594
Allocable D&A (including D&A due to acquisitions)
9,483 4,053 2,281 1,524 11,764 5,577
Unallocable D&A -
455 105
For comments, please see the “Segment Information” section of the Management Report.
NUMBER OF EMPLOYEES
30/09/06 30/09/05 Change DL SpA 558 559 (1) DL AB 23 31 (8) DL France 16 18 (2) DL Iberia 20 20 - DL Central Europe 47 46 1 DL Benelux 10 7 3 DL INC 46 43 3 DL PTY 13 13 - DL UK 16 15 1 EMS 61 61 - Informatics 107 89 18 Laservall 92 78 14 PSC Group 748 0 748 Slovakia 126 0 126 Asia 10 5 5
Total 1,893 985 908
Chairman of the Board of Directors Romano Volta
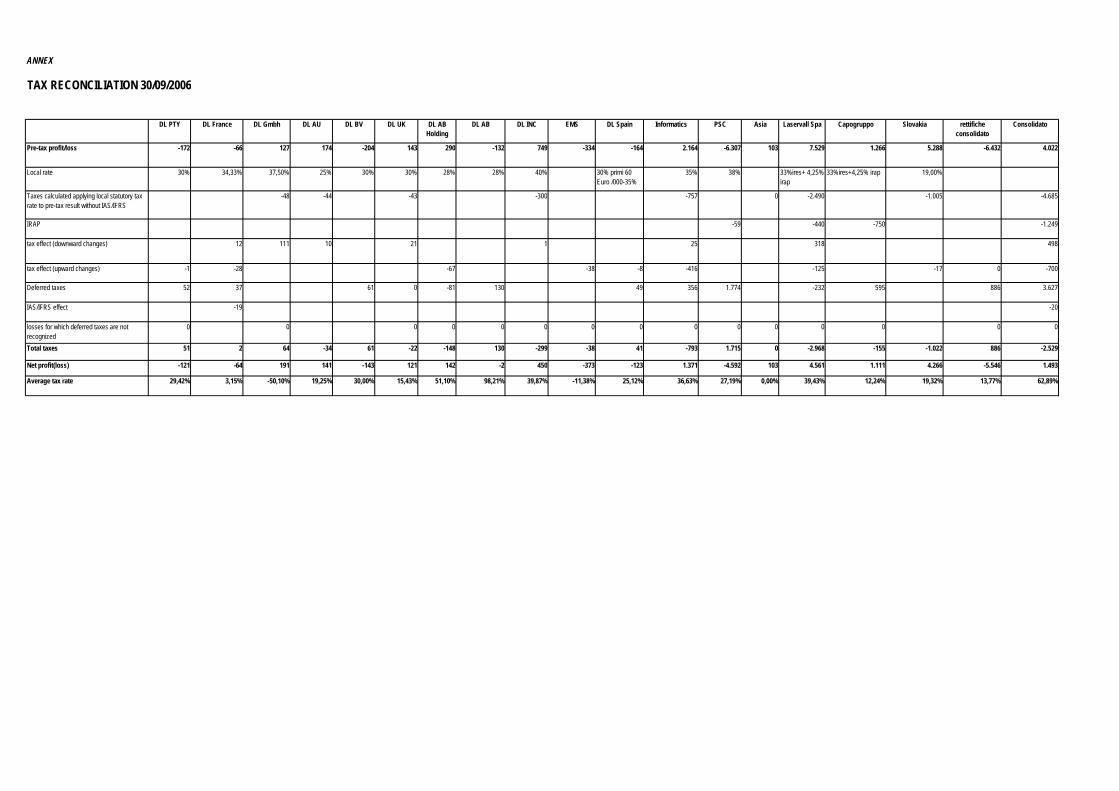
ANNEX
TAX RECONCILIATION 30/09/2006
DL PTY DL France DL Gmbh DL AU DL BV DL UK DL AB Holding
DL AB DL INC EMS DL Spain Informatics PSC Asia Laservall Spa Capogruppo Slovakia rettifiche consolidato
Consolidato
Pre-tax profit/loss -172 -66 127 174 -204 143 290 -132 749 -334 -164 2.164 -6.307 103 7.529 1.266 5.288 -6.432 4.022
Local rate 30% 34,33% 37,50% 25% 30% 30% 28% 28% 40% 30% primi 60 Euro /000-35%
35% 38% 33%ires+ 4,25% irap
33%ires+4,25% irap 19,00%
Taxes calculated applying local statutory tax rate to pre-tax result without IAS/IFRS
-48 -44 -43 -300 -757 0 -2.490 -1.005 -4.685
IRAP -59 -440 -750 -1.249
tax effect (downward changes) 12 111 10 21 1 25 318 498
tax effect (upward changes) -1 -28 -67 -38 -8 -416 -125 -17 0 -700
Deferred taxes 52 37 61 0 -81 130 49 356 1.774 -232 595 886 3.627
IAS/IFRS effect -19 -20
losses for which deferred taxes are not recognized
0 0 0 0 0 0 0 0 0 0 0 0 0 0 0
Total taxes 51 2 64 -34 61 -22 -148 130 -299 -38 41 -793 1.715 0 -2.968 -155 -1.022 886 -2.529
Net profit(loss) -121 -64 191 141 -143 121 142 -2 450 -373 -123 1.371 -4.592 103 4.561 1.111 4.266 -5.546 1.493
Average tax rate 29,42% 3,15% -50,10% 19,25% 30,00% 15,43% 51,10% 98,21% 39,87% -11,38% 25,12% 36,63% 27,19% 0,00% 39,43% 12,24% 19,32% 13,77% 62,89%