Embed Size (px)
Citation preview
WinCam-FIR_Manual_supplement_1011a.docx Page 1 of 12 www.dataray.com (203) 210-5065 DataRay Inc., Bella Vista, CA
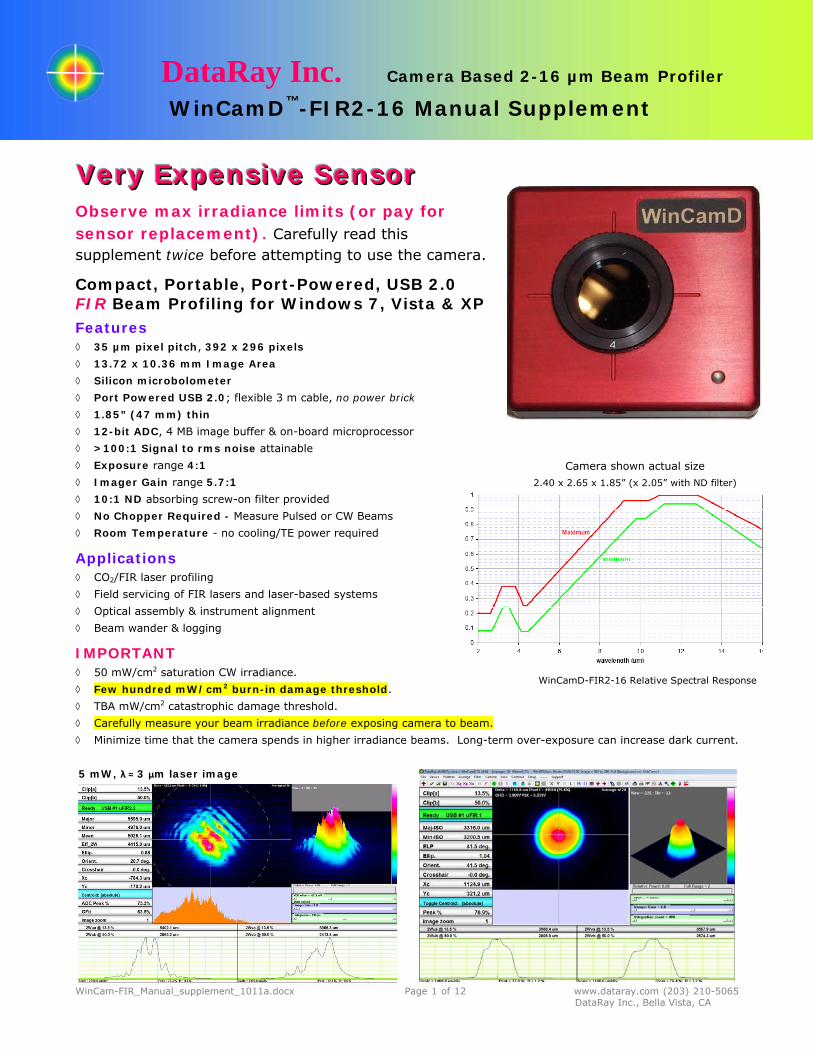
VVVeeerrryyy EEExxxpppeeennnsssiiivvveee SSSeeennnsssooorrr Observe max irradiance limits (or pay for sensor replacement). Carefully read this supplement twice before attempting to use the camera.
Compact, Portable, Port-Powered, USB 2.0 FIR Beam Profiling for Windows 7, Vista & XP
Features 35 µm pixel pitch, 392 x 296 pixels 13.72 x 10.36 mm Image Area Silicon microbolometer Port Powered USB 2.0; flexible 3 m cable, no power brick 1.85” (47 mm) thin 12-bit ADC, 4 MB image buffer & on-board microprocessor >100:1 Signal to rms noise attainable Exposure range 4:1 Imager Gain range 5.7:1 10:1 ND absorbing screw-on filter provided No Chopper Required - Measure Pulsed or CW Beams Room Temperature - no cooling/TE power required
Applications CO2/FIR laser profiling Field servicing of FIR lasers and laser-based systems Optical assembly & instrument alignment Beam wander & logging
IMPORTANT 50 mW/cm2 saturation CW irradiance. Few hundred mW/cm2 burn-in damage threshold. TBA mW/cm2 catastrophic damage threshold. Carefully measure your beam irradiance before exposing camera to beam. Minimize time that the camera spends in higher irradiance beams. Long-term over-exposure can increase dark current.
5 mW, λ ≈ 3 µm laser image
DataRay Inc. Camera Based 2-16 µm Beam Profiler
WinCamD™-FIR2-16 Manual Supplement
Camera shown actual size
2.40 x 2.65 x 1.85” (x 2.05” with ND filter) [61 x 67 x 47 mm]
WinCamD-FIR2-16 Relative Spectral Response
WinCam-FIR_Manual_supplement_1011a.docx Page 2 of 12 www.dataray.com (203) 210-5065 DataRay Inc., Bella Vista, CA
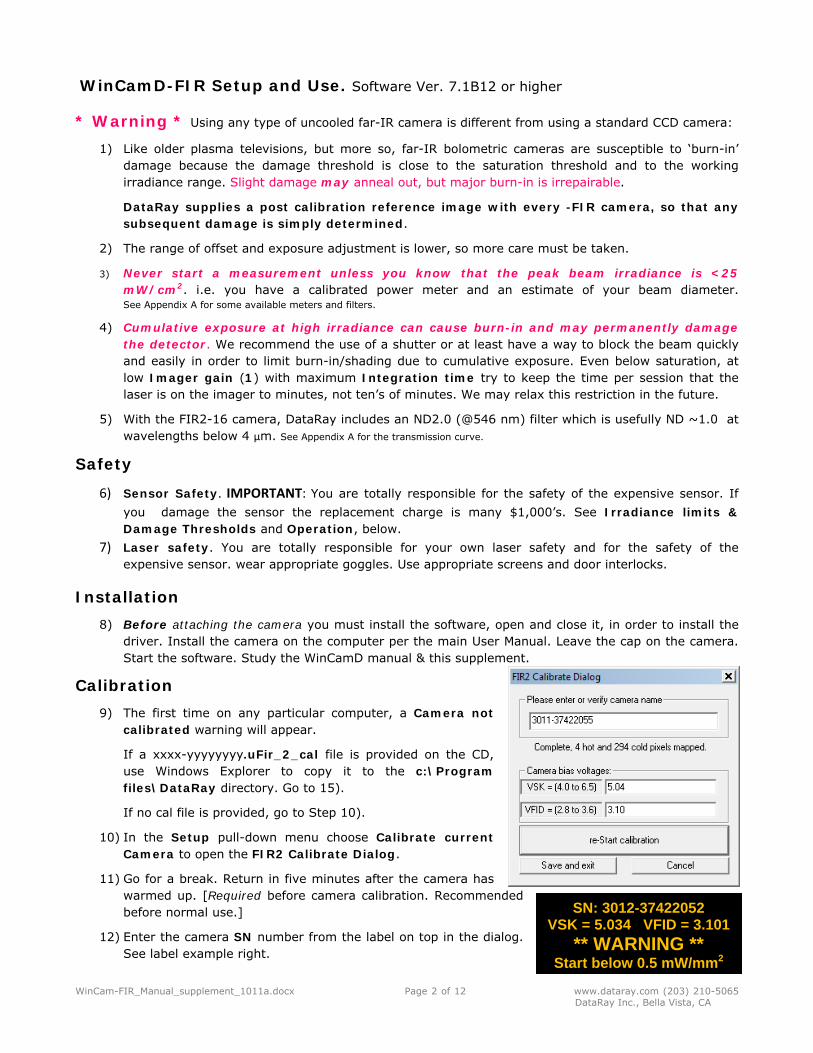
SN: 3012-37422052 VSK = 5.034 VFID = 3.101
** WARNING ** Start below 0.5 mW/mm2
WinCamD-FIR Setup and Use. Software Ver. 7.1B12 or higher
* Warning * Using any type of uncooled far-IR camera is different from using a standard CCD camera: 1) Like older plasma televisions, but more so, far-IR bolometric cameras are susceptible to ‘burn-in’
damage because the damage threshold is close to the saturation threshold and to the working irradiance range. Slight damage may anneal out, but major burn-in is irrepairable.
DataRay supplies a post calibration reference image with every -FIR camera, so that any subsequent damage is simply determined.
2) The range of offset and exposure adjustment is lower, so more care must be taken.
3) Never start a measurement unless you know that the peak beam irradiance is <25 mW/cm2. i.e. you have a calibrated power meter and an estimate of your beam diameter. See Appendix A for some available meters and filters.
4) Cumulative exposure at high irradiance can cause burn-in and may permanently damage the detector. We recommend the use of a shutter or at least have a way to block the beam quickly and easily in order to limit burn-in/shading due to cumulative exposure. Even below saturation, at low Imager gain (1) with maximum Integration time try to keep the time per session that the laser is on the imager to minutes, not ten’s of minutes. We may relax this restriction in the future.
5) With the FIR2-16 camera, DataRay includes an ND2.0 (@546 nm) filter which is usefully ND ~1.0 at wavelengths below 4 µm. See Appendix A for the transmission curve.
Safety
6) Sensor Safety. IMPORTANT: You are totally responsible for the safety of the expensive sensor. If you damage the sensor the replacement charge is many $1,000’s. See Irradiance limits & Damage Thresholds and Operation, below.
7) Laser safety. You are totally responsible for your own laser safety and for the safety of the expensive sensor. wear appropriate goggles. Use appropriate screens and door interlocks.
Installation 8) Before attaching the camera you must install the software, open and close it, in order to install the
driver. Install the camera on the computer per the main User Manual. Leave the cap on the camera. Start the software. Study the WinCamD manual & this supplement.
Calibration 9) The first time on any particular computer, a Camera not
calibrated warning will appear.
If a xxxx-yyyyyyyy.uFir_2_cal file is provided on the CD, use Windows Explorer to copy it to the c:\Program files\DataRay directory. Go to 15).
If no cal file is provided, go to Step 10).
10) In the Setup pull-down menu choose Calibrate current Camera to open the FIR2 Calibrate Dialog.
11) Go for a break. Return in five minutes after the camera has warmed up. [Required before camera calibration. Recommended before normal use.]
12) Enter the camera SN number from the label on top in the dialog. See label example right.
WinCam-FIR_Manual_supplement_1011a.docx Page 3 of 12 www.dataray.com (203) 210-5065 DataRay Inc., Bella Vista, CA
13) Enter the camera bias voltages VSK and VFID from the label on top of the camera. Press Start Calibration.
14) After a few seconds you will see the line Complete, …. appear in the dialog. Press Save and exit.
[The calibration file is saved in c:\Program files\DataRay directory as, this example, 3011-37422055.uFir_2_cal. If you move the camera to another PC, either redo the calibration or also move the file.]
Reference Image & Damage
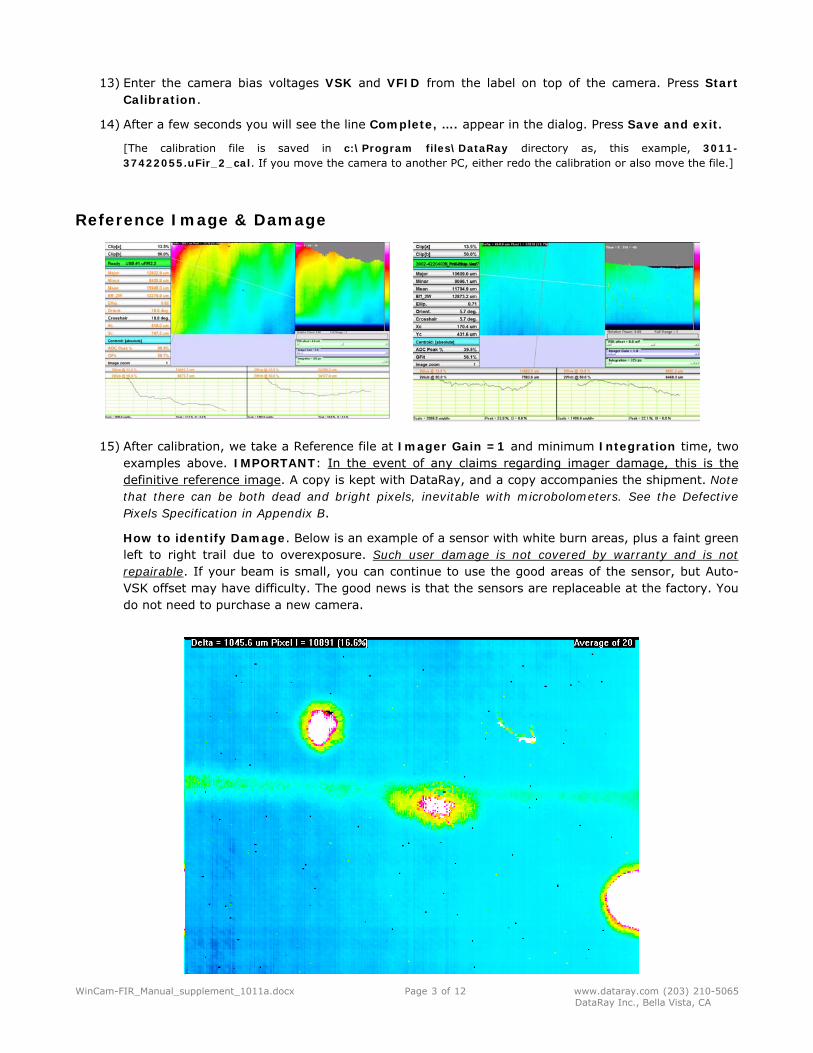
15) After calibration, we take a Reference file at Imager Gain =1 and minimum Integration time, two examples above. IMPORTANT: In the event of any claims regarding imager damage, this is the definitive reference image. A copy is kept with DataRay, and a copy accompanies the shipment. Note that there can be both dead and bright pixels, inevitable with microbolometers. See the Defective Pixels Specification in Appendix B.
How to identify Damage. Below is an example of a sensor with white burn areas, plus a faint green left to right trail due to overexposure. Such user damage is not covered by warranty and is not repairable. If your beam is small, you can continue to use the good areas of the sensor, but Auto-VSK offset may have difficulty. The good news is that the sensors are replaceable at the factory. You do not need to purchase a new camera.
WinCam-FIR_Manual_supplement_1011a.docx Page 4 of 12 www.dataray.com (203) 210-5065 DataRay Inc., Bella Vista, CA
Very ExpensiveSensor
Observe max irradiance limits (or pay for
sensor replacement)
VVVeeerrryyy EEExxxpppeeennnsssiiivvveee SSSeeennnsssooorrr Observe max irradiance limits.
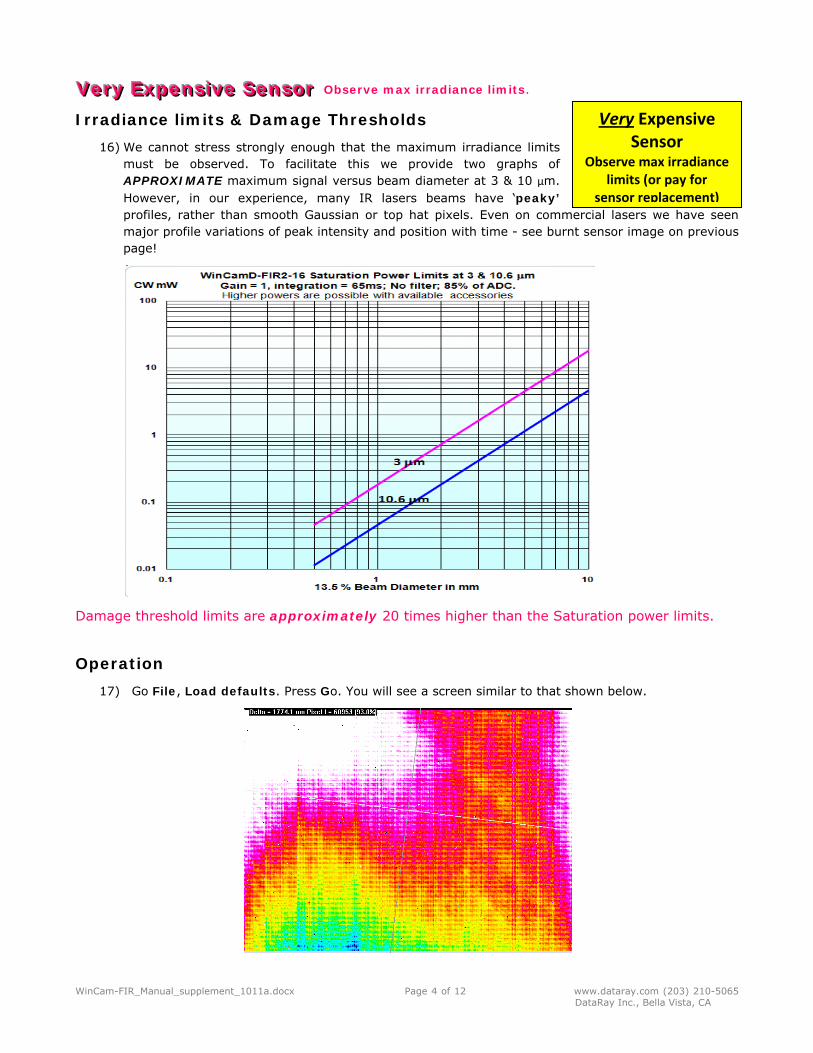
Irradiance limits & Damage Thresholds 16) We cannot stress strongly enough that the maximum irradiance limits
must be observed. To facilitate this we provide two graphs of APPROXIMATE maximum signal versus beam diameter at 3 & 10 µm. However, in our experience, many IR lasers beams have ‘peaky’ profiles, rather than smooth Gaussian or top hat pixels. Even on commercial lasers we have seen major profile variations of peak intensity and position with time - see burnt sensor image on previous page!
Damage threshold limits are approximately 20 times higher than the Saturation power limits.
Operation 17) Go File, Load defaults. Press Go. You will see a screen similar to that shown below.
WinCam-FIR_Manual_supplement_1011a.docx Page 5 of 12 www.dataray.com (203) 210-5065 DataRay Inc., Bella Vista, CA
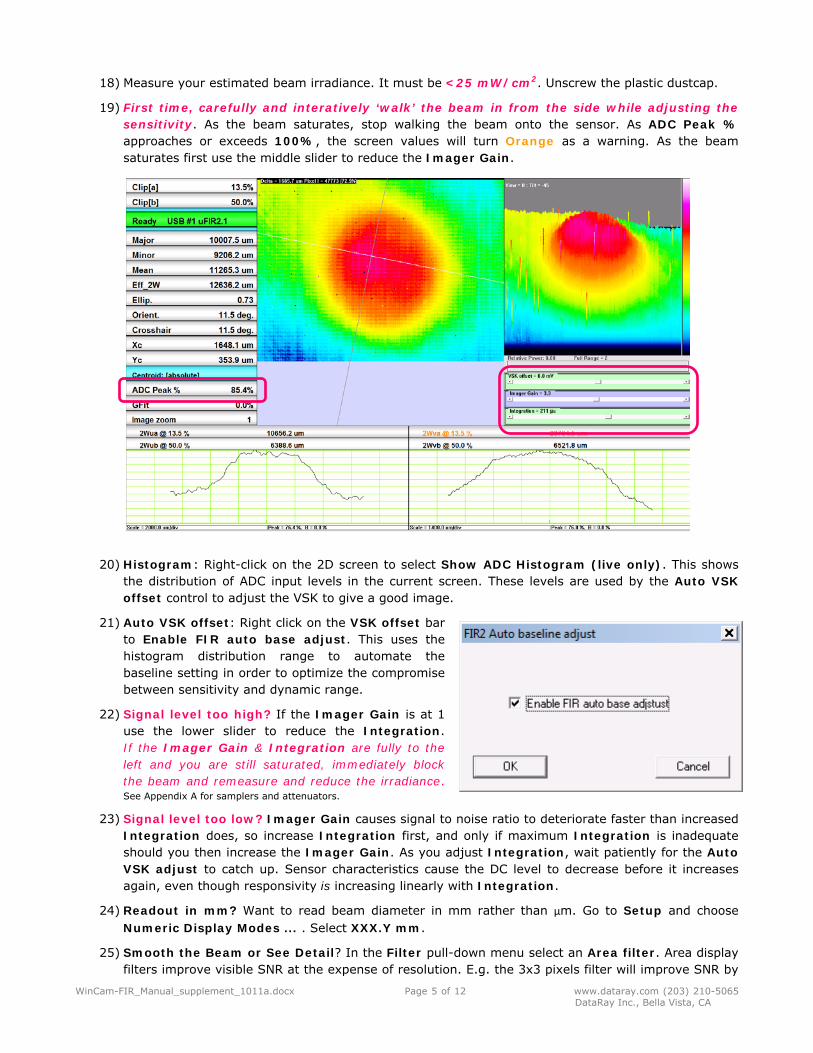
18) Measure your estimated beam irradiance. It must be <25 mW/cm2. Unscrew the plastic dustcap.
19) First time, carefully and interatively ‘walk’ the beam in from the side while adjusting the sensitivity. As the beam saturates, stop walking the beam onto the sensor. As ADC Peak % approaches or exceeds 100%, the screen values will turn Orange as a warning. As the beam saturates first use the middle slider to reduce the Imager Gain.
20) Histogram: Right-click on the 2D screen to select Show ADC Histogram (live only). This shows the distribution of ADC input levels in the current screen. These levels are used by the Auto VSK offset control to adjust the VSK to give a good image.
21) Auto VSK offset: Right click on the VSK offset bar to Enable FIR auto base adjust. This uses the histogram distribution range to automate the baseline setting in order to optimize the compromise between sensitivity and dynamic range.
22) Signal level too high? If the Imager Gain is at 1 use the lower slider to reduce the Integration. If the Imager Gain & Integration are fully to the left and you are still saturated, immediately block the beam and remeasure and reduce the irradiance. See Appendix A for samplers and attenuators.
23) Signal level too low? Imager Gain causes signal to noise ratio to deteriorate faster than increased Integration does, so increase Integration first, and only if maximum Integration is inadequate should you then increase the Imager Gain. As you adjust Integration, wait patiently for the Auto VSK adjust to catch up. Sensor characteristics cause the DC level to decrease before it increases again, even though responsivity is increasing linearly with Integration.
24) Readout in mm? Want to read beam diameter in mm rather than µm. Go to Setup and choose Numeric Display Modes ... . Select XXX.Y mm.
25) Smooth the Beam or See Detail? In the Filter pull-down menu select an Area filter. Area display filters improve visible SNR at the expense of resolution. E.g. the 3x3 pixels filter will improve SNR by
WinCam-FIR_Manual_supplement_1011a.docx Page 6 of 12 www.dataray.com (203) 210-5065 DataRay Inc., Bella Vista, CA
a factor of ~3, but increases the effective pixel size from 35 x 35 µm to 105 x 105 µm. This is still ~50 resolution elements across a 5 mm beam.
Want mainly to smooth the beam? Use Area filter # ≥ (Beam diameter in mm) x 2
Want to see detail in the beam? Use Area filter # ≤ (Beam diameter in mm) / 2
Want to compromise? Use Area filter # ≈ (Beam diameter in mm)
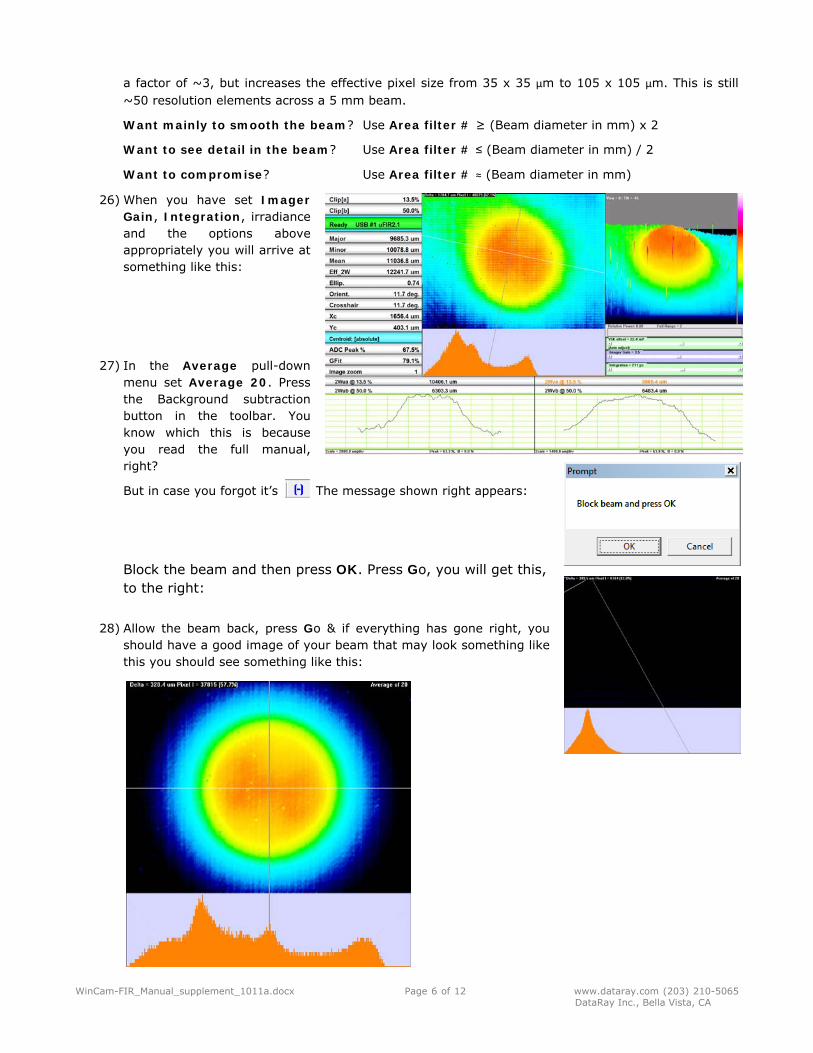
26) When you have set Imager Gain, Integration, irradiance and the options above appropriately you will arrive at something like this:
27) In the Average pull-down menu set Average 20. Press the Background subtraction button in the toolbar. You know which this is because you read the full manual, right?
But in case you forgot it’s The message shown right appears:
Block the beam and then press OK. Press Go, you will get this, to the right:
28) Allow the beam back, press Go & if everything has gone right, you
should have a good image of your beam that may look something like this you should see something like this:
WinCam-FIR_Manual_supplement_1011a.docx Page 7 of 12 www.dataray.com (203) 210-5065 DataRay Inc., Bella Vista, CA
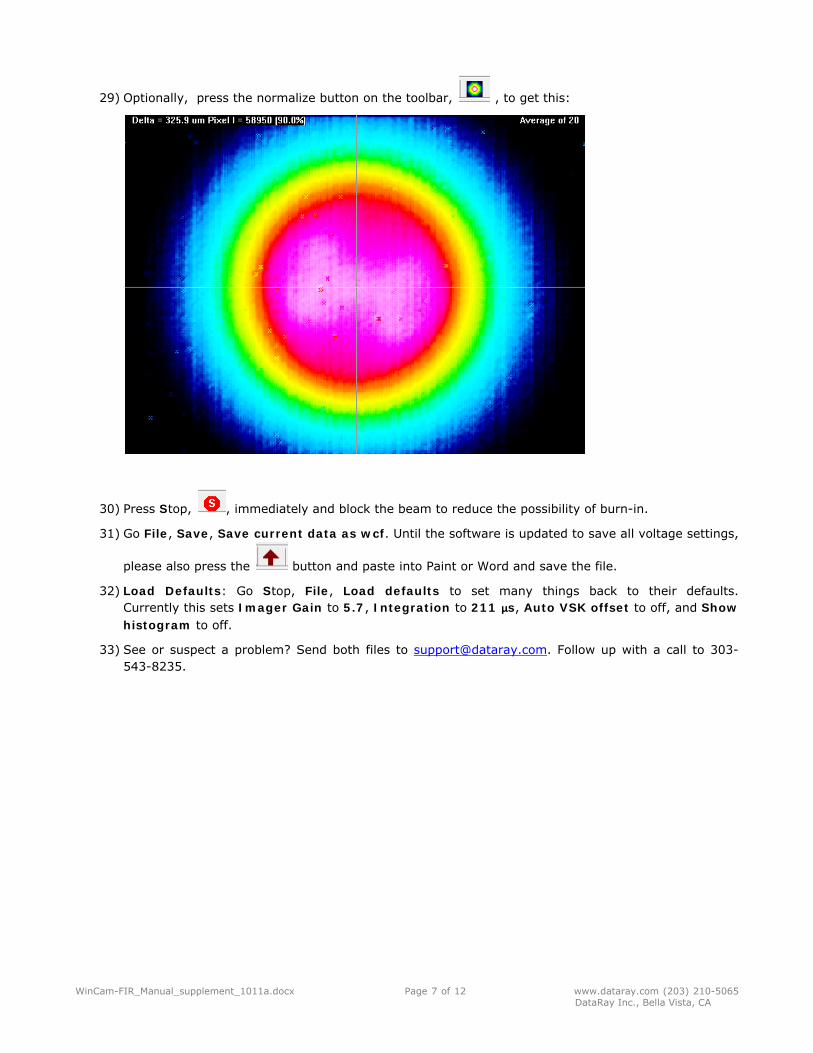
29) Optionally, press the normalize button on the toolbar, , to get this:
30) Press Stop, , immediately and block the beam to reduce the possibility of burn-in.
31) Go File, Save, Save current data as wcf. Until the software is updated to save all voltage settings,
please also press the button and paste into Paint or Word and save the file.
32) Load Defaults: Go Stop, File, Load defaults to set many things back to their defaults. Currently this sets Imager Gain to 5.7, Integration to 211 µs, Auto VSK offset to off, and Show histogram to off.
33) See or suspect a problem? Send both files to [email protected]. Follow up with a call to 303-543-8235.
WinCam-FIR_Manual_supplement_1011a.docx Page 8 of 12 www.dataray.com (203) 210-5065 DataRay Inc., Bella Vista, CA
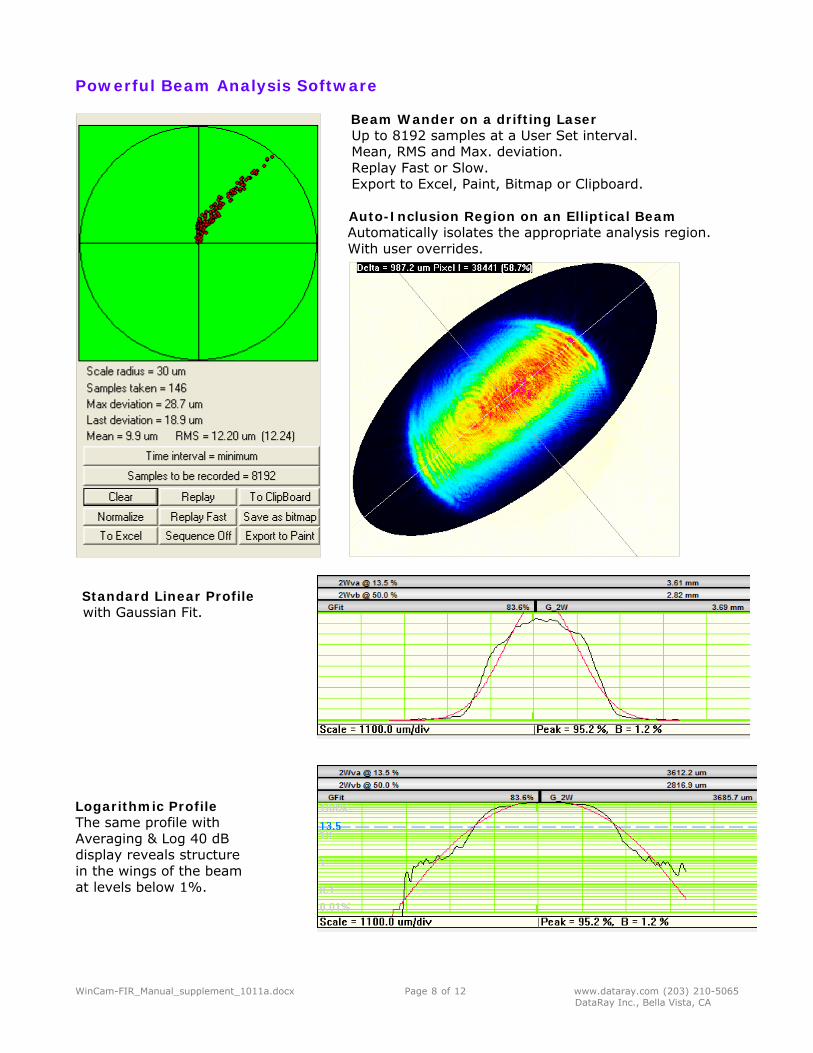
Powerful Beam Analysis Software
Beam Wander on a drifting Laser Up to 8192 samples at a User Set interval. Mean, RMS and Max. deviation. Replay Fast or Slow. Export to Excel, Paint, Bitmap or Clipboard.
Auto-Inclusion Region on an Elliptical Beam Automatically isolates the appropriate analysis region. With user overrides. With user overrides.
Standard Linear Profile with Gaussian Fit.
Logarithmic Profile The same profile with Averaging & Log 40 dB display reveals structure in the wings of the beam at levels below 1%.
WinCam-FIR_Manual_supplement_1011a.docx Page 9 of 12 www.dataray.com (203) 210-5065 DataRay Inc., Bella Vista, CA
DataRay Innovation - The company that brought you the first Windows-based CCD beam profiler, the first thin camera for confined spaces, the first software slider exposure and electronic auto-shutter, the first standard window-free CCD for no fringing, the first auto-orientation on the ellipse & the first USB 2.0 beam profiling camera has done it again …
Compact, Room Temperature, Port Powered WinCamD-FIR cameras.
Features: Digital serial link for EMI immunity XY profiles and centroids Linear and logarithmic displays Gaussian and Top Hat least squares fits Ellipse Angle, Major, Minor, Mean Diameters
Background capture and subtraction Image & Intensity Zoom Linear and area filters Image Averaging, 1 to continuous PC Or Mac-Intel Operation
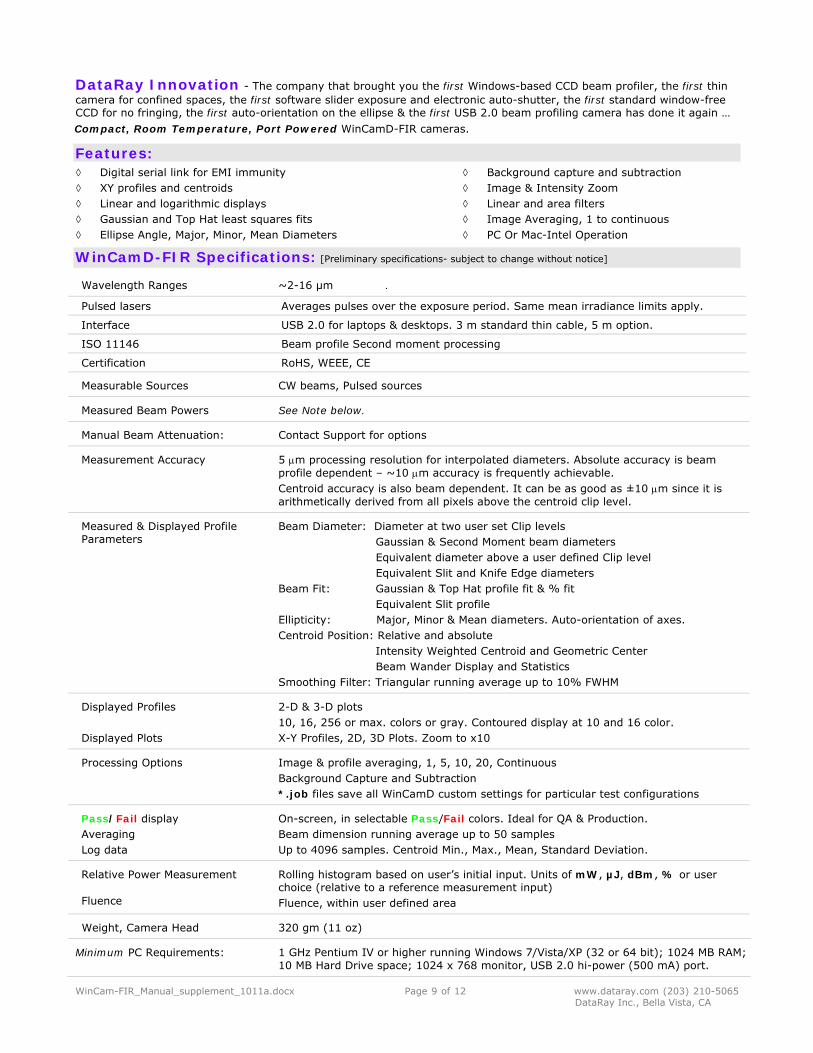
WinCamD-FIR Specifications: [Preliminary specifications- subject to change without notice]
Wavelength Ranges ~2-16 µm .
Pulsed lasers Averages pulses over the exposure period. Same mean irradiance limits apply.
Interface USB 2.0 for laptops & desktops. 3 m standard thin cable, 5 m option.
ISO 11146 Beam profile Second moment processing
Certification RoHS, WEEE, CE
Measurable Sources CW beams, Pulsed sources
Measured Beam Powers See Note below.
Manual Beam Attenuation: Contact Support for options
Measurement Accuracy 5 m processing resolution for interpolated diameters. Absolute accuracy is beam profile dependent – ~10 m accuracy is frequently achievable. Centroid accuracy is also beam dependent. It can be as good as ±10 m since it is arithmetically derived from all pixels above the centroid clip level.
Measured & Displayed Profile Parameters
Beam Diameter: Diameter at two user set Clip levels Gaussian & Second Moment beam diameters Equivalent diameter above a user defined Clip level Equivalent Slit and Knife Edge diameters Beam Fit: Gaussian & Top Hat profile fit & % fit Equivalent Slit profile Ellipticity: Major, Minor & Mean diameters. Auto-orientation of axes. Centroid Position: Relative and absolute Intensity Weighted Centroid and Geometric Center Beam Wander Display and Statistics Smoothing Filter: Triangular running average up to 10% FWHM
Displayed Profiles Displayed Plots
2-D & 3-D plots 10, 16, 256 or max. colors or gray. Contoured display at 10 and 16 color. X-Y Profiles, 2D, 3D Plots. Zoom to x10
Processing Options Image & profile averaging, 1, 5, 10, 20, Continuous Background Capture and Subtraction *.job files save all WinCamD custom settings for particular test configurations
Pass/Fail display Averaging Log data
On-screen, in selectable Pass/Fail colors. Ideal for QA & Production. Beam dimension running average up to 50 samples Up to 4096 samples. Centroid Min., Max., Mean, Standard Deviation.
Relative Power Measurement
Fluence
Rolling histogram based on user’s initial input. Units of mW, µJ, dBm, % or user choice (relative to a reference measurement input) Fluence, within user defined area
Weight, Camera Head 320 gm (11 oz)
Minimum PC Requirements: 1 GHz Pentium IV or higher running Windows 7/Vista/XP (32 or 64 bit); 1024 MB RAM; 10 MB Hard Drive space; 1024 x 768 monitor, USB 2.0 hi-power (500 mA) port.
WinCam-FIR_Manual_supplement_1011a.docx Page 10 of 12 www.dataray.com (203) 210-5065 DataRay Inc., Bella Vista, CA
ORDERING INFORMATION
Limited 1 Year Warranty (excludes sensor damage)
Free Software Upgrades 30 Day Sale or Return Evaluation PO
A Complete System comprises: Camera, Software, 3 m (10 ft) Cable, User Manual.
Part Number component descriptions
WinCamD-FIR2-16 Complete working USB 2.0 camera system includes manual, cables, and software. 2-16 µm
Other DataRay Profiling USB 2.0 Instruments, 190 nm to 3.5 µm options.
Beam’R2 0.1micron resolution on CW lasers, 0.5 micron to 4 mm beam dimensions Optional Dual Detectors 190-1800 nm
BeamScope-P8 100 microns to 23 mm, M2 accessory, ISO 11146 Standard Linear scanning slit ,CW or Pulsed (PRR >5 kHz) lasers, up to 23 x 45 mm scanned area
WinCamD-UCD12 14 Bit ADC with high resolution ½” CCD array 4.65 x 4.65 µm pixels
WinCamD-UCD15 14 Bit ADC with high resolution CCD array 4.4 x 4.4 µm pixels
WinCamD-UCD23 14 Bit ADC with high resolution 2/3” CCD array 6.45 x 6.45 µm pixels
DualCamD Measure real-time divergence and ratios with cameras at 90 ̊
BladeCam 0.65” thin CMOS camera with ½” CMOS sensor, 5.2 x 5.2 µm pixels
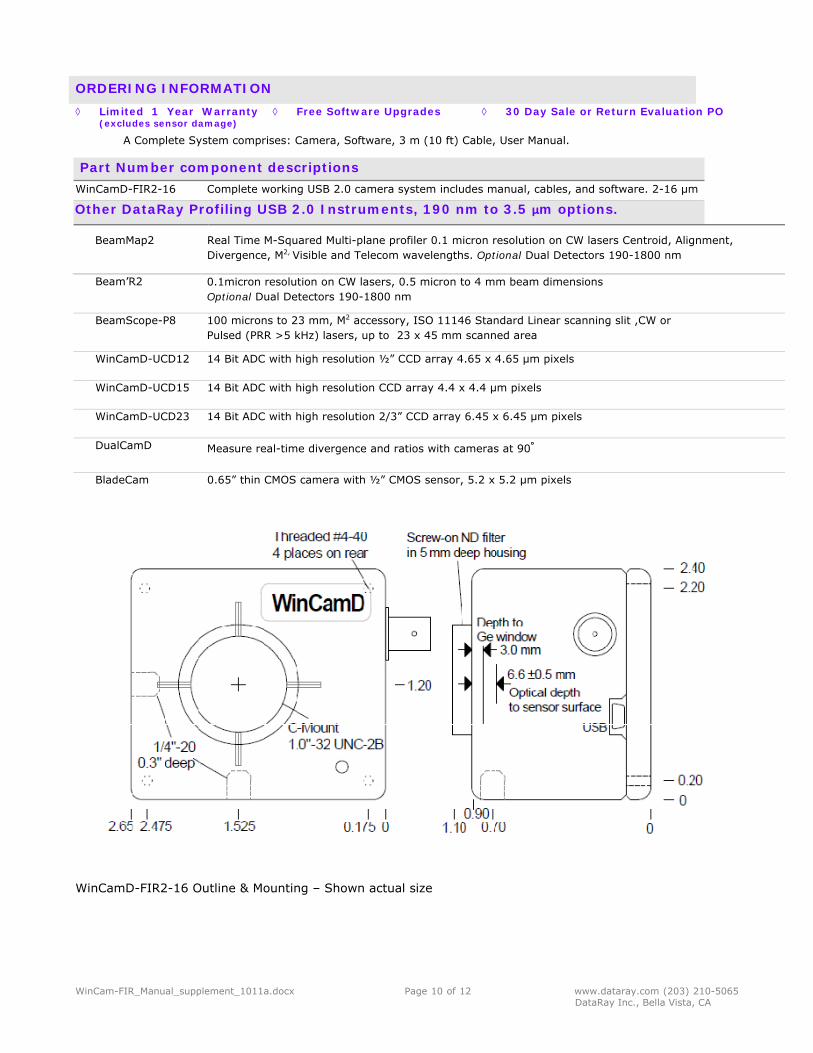
WinCamD-FIR2-16 Outline & Mounting – Shown actual size
BeamMap2 Real Time M-Squared Multi-plane profiler 0.1 micron resolution on CW lasers Centroid, Alignment, Divergence, M2, Visible and Telecom wavelengths. Optional Dual Detectors 190-1800 nm
WinCam-FIR_Manual_supplement_1011a.docx Page 11 of 12 www.dataray.com (203) 210-5065 DataRay Inc., Bella Vista, CA
Appendix A – a non-exhaustive list of related products.
a) Power Meters for µW to W
a. Gentec-eo XLP12-1S-H2-DO with P-Link USB interface, µW to 3 W.
b) Samplers and attenuators
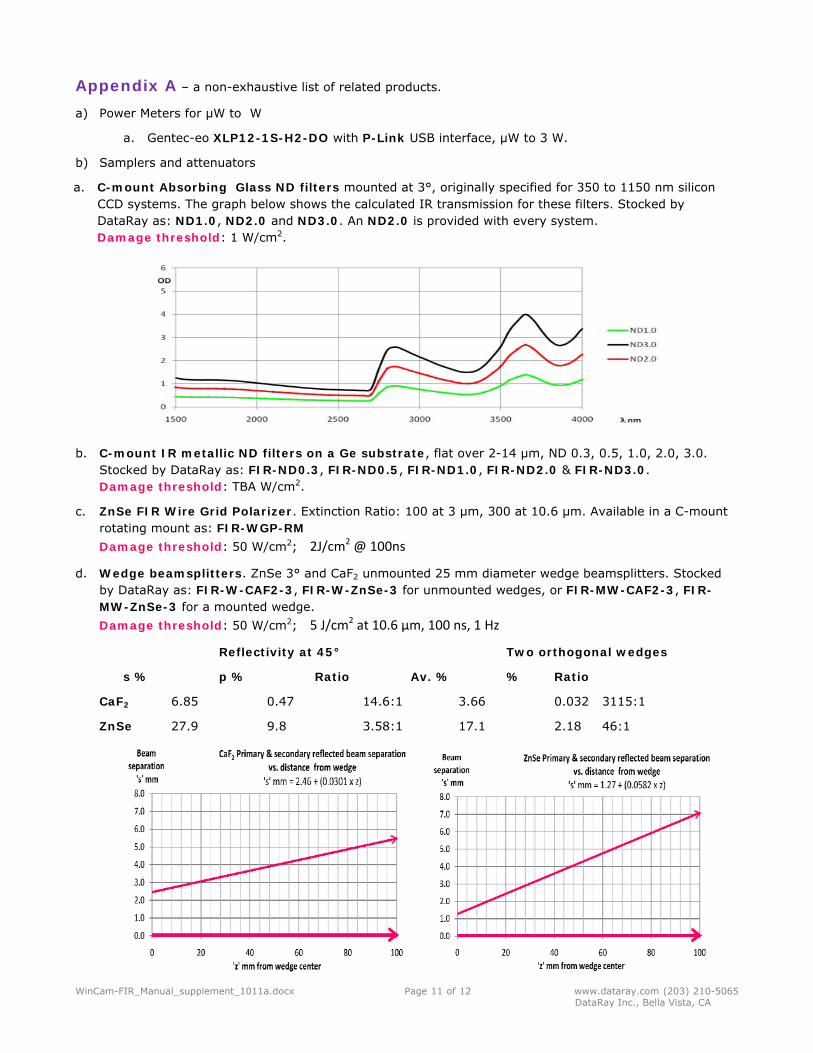
a. C-mount Absorbing Glass ND filters mounted at 3°, originally specified for 350 to 1150 nm silicon CCD systems. The graph below shows the calculated IR transmission for these filters. Stocked by DataRay as: ND1.0, ND2.0 and ND3.0. An ND2.0 is provided with every system. Damage threshold: 1 W/cm2.
b. C-mount IR metallic ND filters on a Ge substrate, flat over 2-14 µm, ND 0.3, 0.5, 1.0, 2.0, 3.0. Stocked by DataRay as: FIR-ND0.3, FIR-ND0.5, FIR-ND1.0, FIR-ND2.0 & FIR-ND3.0. Damage threshold: TBA W/cm2.
c. ZnSe FIR Wire Grid Polarizer. Extinction Ratio: 100 at 3 µm, 300 at 10.6 µm. Available in a C-mount rotating mount as: FIR-WGP-RM Damage threshold: 50 W/cm2; 2J/cm2 @ 100ns
d. Wedge beamsplitters. ZnSe 3° and CaF2 unmounted 25 mm diameter wedge beamsplitters. Stocked by DataRay as: FIR-W-CAF2-3, FIR-W-ZnSe-3 for unmounted wedges, or FIR-MW-CAF2-3, FIR-MW-ZnSe-3 for a mounted wedge. Damage threshold: 50 W/cm2; 5 J/cm2 at 10.6 µm, 100 ns, 1 Hz
Reflectivity at 45° Two orthogonal wedges
s % p % Ratio Av. % % Ratio
CaF2 6.85 0.47 14.6:1 3.66 0.032 3115:1
ZnSe 27.9 9.8 3.58:1 17.1 2.18 46:1
WinCam-FIR_Manual_supplement_1011a.docx Page 12 of 12 www.dataray.com (203) 210-5065 DataRay Inc., Bella Vista, CA
e. C-mount OD 0.30 & 0.76 25.4 mm diameter CaF2 10.6 µm attenuators. Stocked by DataRay as: FIR-CaF2-0D0.3, FIR-CaF2-0D0.76 Damage threshold: 50 W/cm2; 5 J/cm2 at 10.6 µm, 100 ns, 1 Hz
Appendix B – Defective Pixels Specification
A pixel is considered non-operating if:
It’s responsivity is <0.8 x or >1.2 x average responsivity It’s NETD is 1.5 x the average NETD in the STR
A single non-operating pixel is a non-operating pixel with no adjacent non-operating pixel.
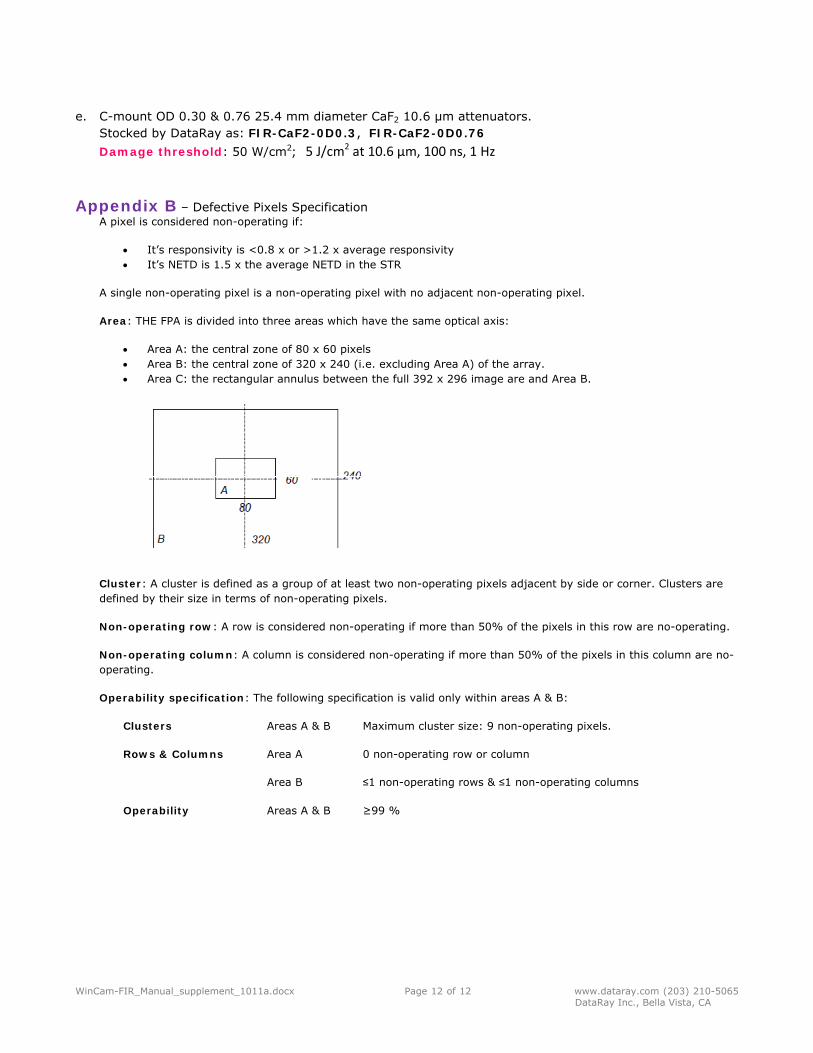
Area: THE FPA is divided into three areas which have the same optical axis:
Area A: the central zone of 80 x 60 pixels Area B: the central zone of 320 x 240 (i.e. excluding Area A) of the array. Area C: the rectangular annulus between the full 392 x 296 image are and Area B.
Cluster: A cluster is defined as a group of at least two non-operating pixels adjacent by side or corner. Clusters are defined by their size in terms of non-operating pixels.
Non-operating row: A row is considered non-operating if more than 50% of the pixels in this row are no-operating.
Non-operating column: A column is considered non-operating if more than 50% of the pixels in this column are no-operating.
Operability specification: The following specification is valid only within areas A & B:
Clusters Areas A & B Maximum cluster size: 9 non-operating pixels.
Rows & Columns Area A 0 non-operating row or column
Area B ≤1 non-operating rows & ≤1 non-operating columns
Operability Areas A & B ≥99 %