Embed Size (px)
Citation preview
© OCR 2014 [601/4260/1] DC ( ) H420/01 Turn over
Oxford Cambridge and RSA
A Level Biology A H420/01 Biological processes Sample Question Paper
Date – Morning/Afternoon Time allowed: 2 hours 15 minutes
You may use • a scientific calculator
* 0 0 0 0 0 0 *
First name
Last name
Centre number
Candidate number
INSTRUCTIONS • Use black ink. You may use an HB pencil for graphs and diagrams. • Complete the boxes above with your name, centre number and candidate number. • Answer all the questions. • Write your answer to each question in the space provided. • Additional paper may be used if required but you must clearly show your candidate
number, centre number and question number(s). • Do not write in the bar codes.
INFORMATION • The total mark for this paper is 100. • The marks for each question are shown in brackets [ ]. • Quality of extended response will be assessed in questions marked with an asterisk (*). • This document consists of 28 pages.
SPECIMEN
PMT
2
© OCR 2014 H420/01
SECTION A
You should spend a maximum of 20 minutes on this section.
Answer all the questions.
1 Which statement explains the significance of mitosis in the development of whole organisms? A Mitosis can be controlled at certain points in development, which will change body plans.
B Sex cells are produced by mitosis, which allows new organisms to be produced.
C Mitosis limits the total number of cells in an organism, which will change its shape.
D Budding in yeast is an example of mitosis, producing new multicellular organisms.
Your answer [1]
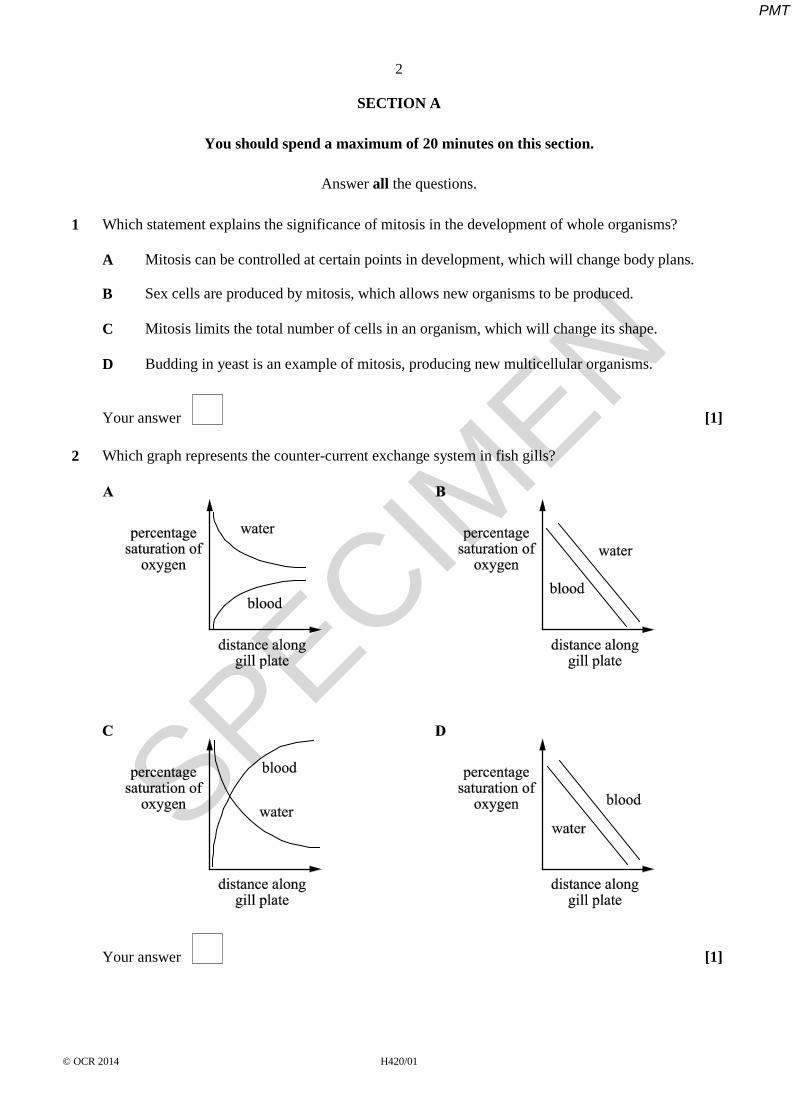
2 Which graph represents the counter-current exchange system in fish gills?
Your answer [1]
SPECIMEN
PMT
3
© OCR 2014 H420/01 Turn over
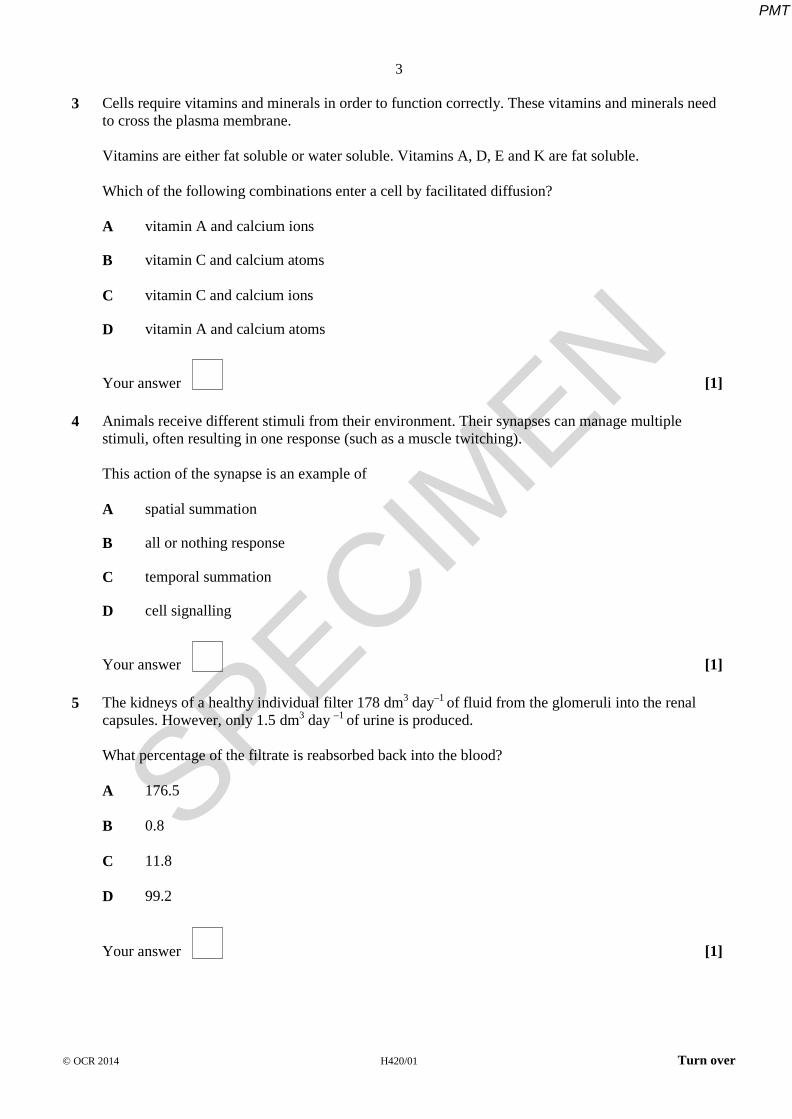
3 Cells require vitamins and minerals in order to function correctly. These vitamins and minerals need to cross the plasma membrane. Vitamins are either fat soluble or water soluble. Vitamins A, D, E and K are fat soluble. Which of the following combinations enter a cell by facilitated diffusion?
A vitamin A and calcium ions
B vitamin C and calcium atoms
C vitamin C and calcium ions
D vitamin A and calcium atoms
Your answer [1]
4 Animals receive different stimuli from their environment. Their synapses can manage multiple
stimuli, often resulting in one response (such as a muscle twitching). This action of the synapse is an example of
A spatial summation
B all or nothing response
C temporal summation
D cell signalling
Your answer [1]
5 The kidneys of a healthy individual filter 178 dm3 day–1 of fluid from the glomeruli into the renal
capsules. However, only 1.5 dm3 day –1 of urine is produced. What percentage of the filtrate is reabsorbed back into the blood?
A 176.5
B 0.8
C 11.8
D 99.2
Your answer [1]
SPECIMEN
PMT
4
© OCR 2014 H420/01
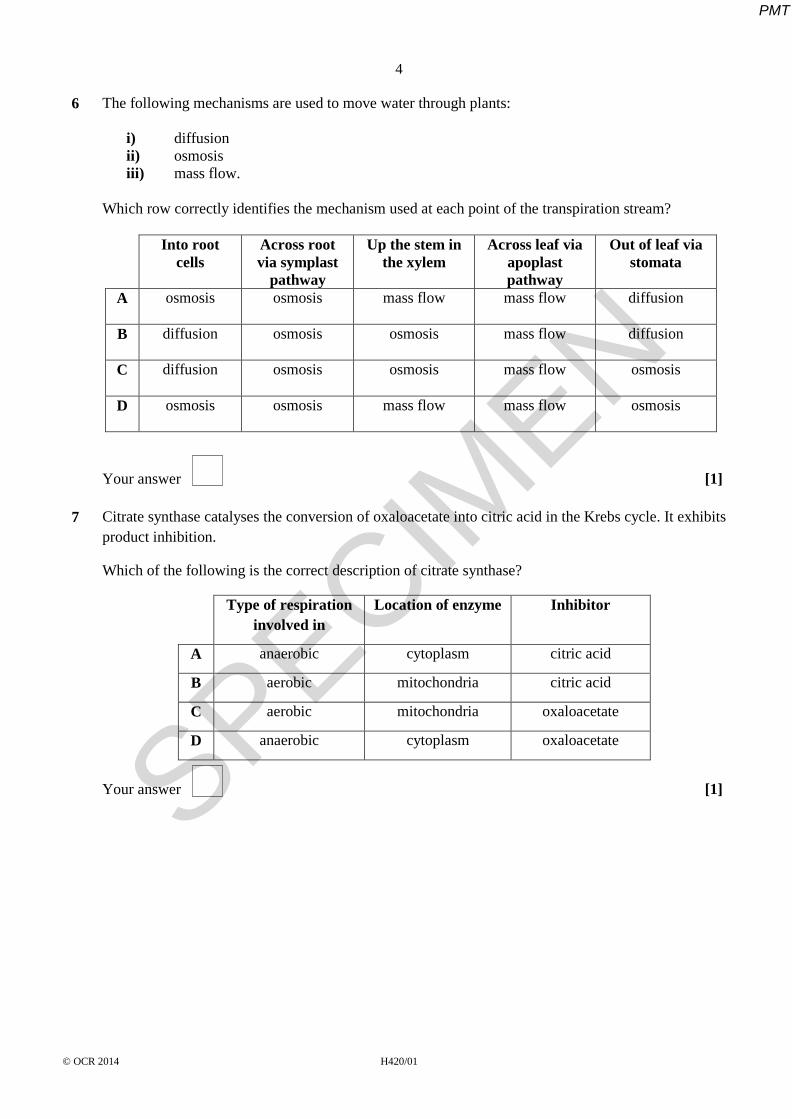
6 The following mechanisms are used to move water through plants:
i) diffusion ii) osmosis iii) mass flow.
Which row correctly identifies the mechanism used at each point of the transpiration stream?
Into root cells
Across root via symplast
pathway
Up the stem in the xylem
Across leaf via apoplast pathway
Out of leaf via stomata
A
osmosis osmosis mass flow mass flow diffusion
B
diffusion osmosis osmosis mass flow diffusion
C
diffusion osmosis osmosis mass flow osmosis
D
osmosis osmosis mass flow mass flow osmosis
Your answer [1]
7 Citrate synthase catalyses the conversion of oxaloacetate into citric acid in the Krebs cycle. It exhibits
product inhibition.
Which of the following is the correct description of citrate synthase?
Type of respiration involved in
Location of enzyme Inhibitor
A anaerobic cytoplasm citric acid
B aerobic mitochondria citric acid
C aerobic mitochondria oxaloacetate
D anaerobic cytoplasm oxaloacetate
Your answer [1]
SPECIMEN
PMT
5
© OCR 2014 H420/01 Turn over
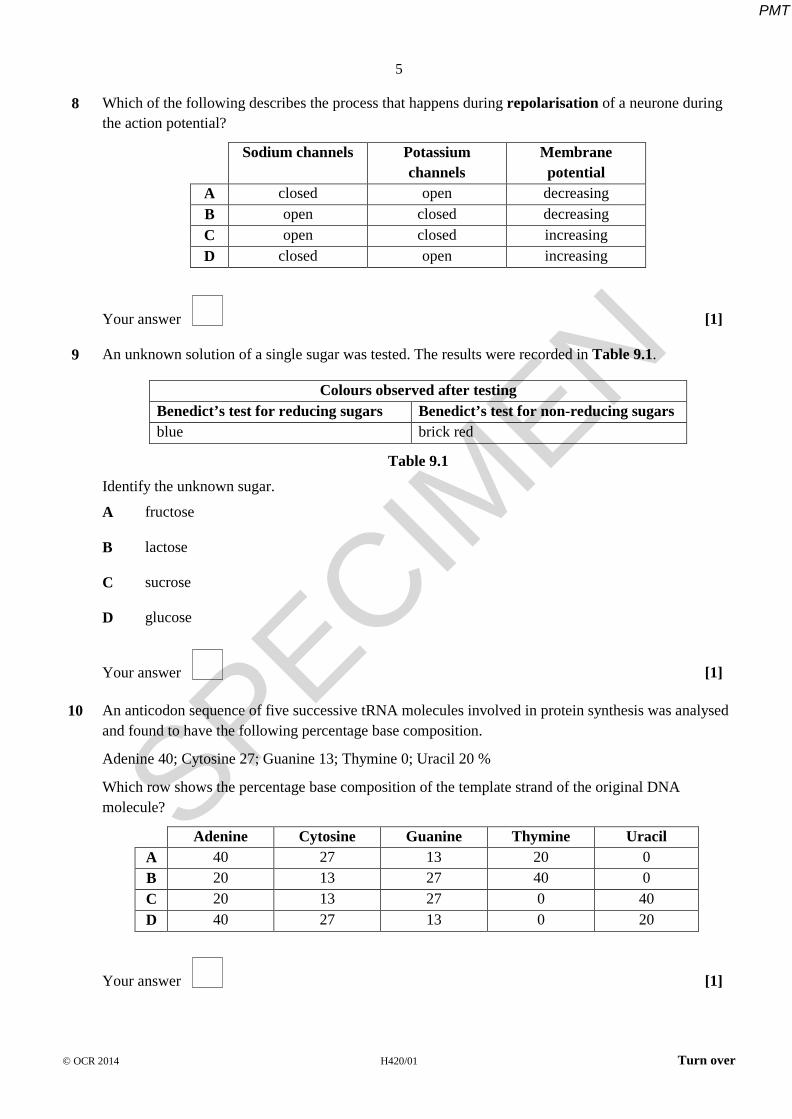
8 Which of the following describes the process that happens during repolarisation of a neurone during the action potential?
Sodium channels Potassium channels
Membrane potential
A closed open decreasing B open closed decreasing C open closed increasing D closed open increasing
Your answer [1]
9 An unknown solution of a single sugar was tested. The results were recorded in Table 9.1.
Colours observed after testing
Benedict’s test for reducing sugars Benedict’s test for non-reducing sugars blue brick red
Table 9.1 Identify the unknown sugar.
A fructose
B lactose
C sucrose
D glucose
Your answer [1]
10 An anticodon sequence of five successive tRNA molecules involved in protein synthesis was analysed
and found to have the following percentage base composition.
Adenine 40; Cytosine 27; Guanine 13; Thymine 0; Uracil 20 %
Which row shows the percentage base composition of the template strand of the original DNA molecule?
Adenine Cytosine Guanine Thymine Uracil A 40 27 13 20 0 B 20 13 27 40 0 C 20 13 27 0 40 D 40 27 13 0 20
Your answer [1]
SPECIMEN
PMT
6
© OCR 2014 H420/01
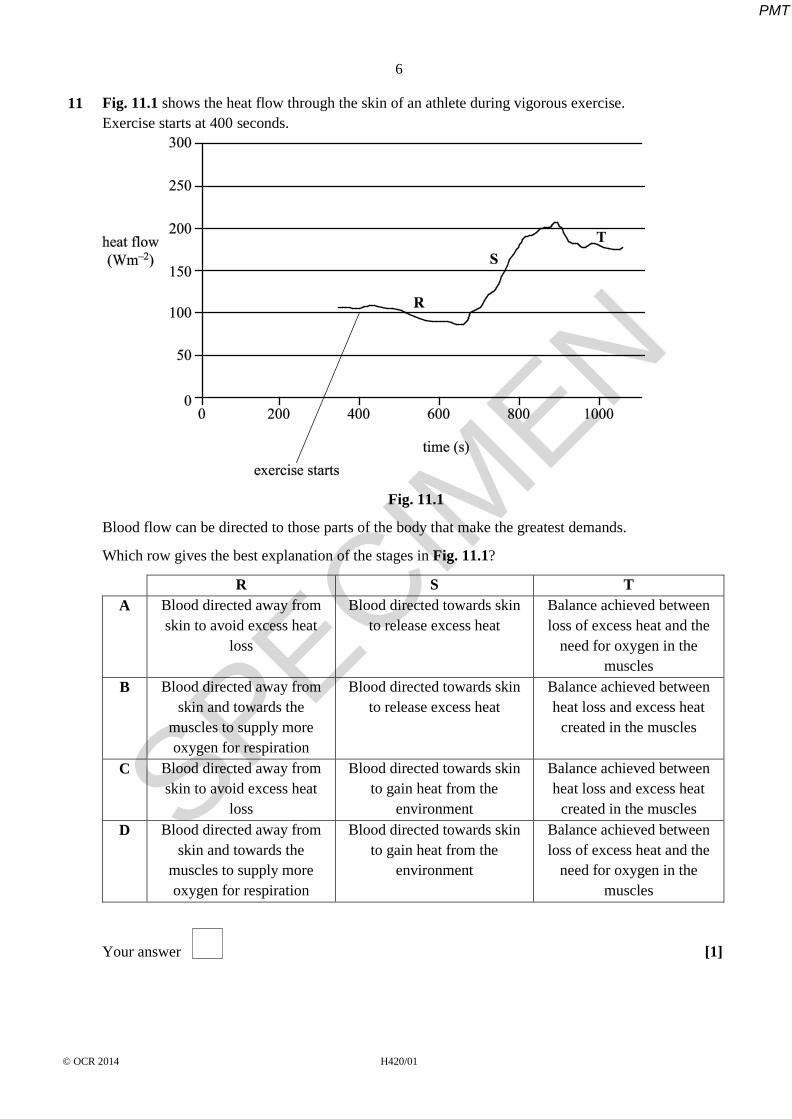
11 Fig. 11.1 shows the heat flow through the skin of an athlete during vigorous exercise. Exercise starts at 400 seconds.
Fig. 11.1
Blood flow can be directed to those parts of the body that make the greatest demands.
Which row gives the best explanation of the stages in Fig. 11.1?
R S T A Blood directed away from
skin to avoid excess heat loss
Blood directed towards skin to release excess heat
Balance achieved between loss of excess heat and the
need for oxygen in the muscles
B Blood directed away from skin and towards the
muscles to supply more oxygen for respiration
Blood directed towards skin to release excess heat
Balance achieved between heat loss and excess heat
created in the muscles
C Blood directed away from skin to avoid excess heat
loss
Blood directed towards skin to gain heat from the
environment
Balance achieved between heat loss and excess heat
created in the muscles D Blood directed away from
skin and towards the muscles to supply more oxygen for respiration
Blood directed towards skin to gain heat from the
environment
Balance achieved between loss of excess heat and the
need for oxygen in the muscles
Your answer [1]
SPECIMEN
PMT
7
© OCR 2014 H420/01 Turn over
12 Which of the following is/are interventions in the control of blood glucose concentration? Statement 1: Insulin injection.
Statement 2: Regular cardiovascular exercise.
Statement 3: Glucagon injection.
A 1, 2 and 3
B Only 1 and 2
C Only 2 and 3
D Only 1
Your answer [1]
13 Which of the following statements is/are true?
Statement 1: Microtubules are part of the ‘9 + 2’ formation in bacterial flagella.
Statement 2: Microtubules can be prevented from functioning by a respiratory inhibitor.
Statement 3: Microtubules are involved in moving chromosomes from the equator to the poles of the cell during mitosis.
A 1, 2 and 3
B Only 1 and 2
C Only 2 and 3
D Only 1
Your answer [1]
SPECIMEN
PMT
8
© OCR 2014 H420/01
14 Blood vessels are adapted for their function.
Which of the following statements is/are true? Statement 1: The walls of arteries near the heart contain a lot of elastic fibres so that they can
stretch and recoil to maintain blood pressure.
Statement 2: The walls of the venules contain little muscle.
Statement 3: The walls of arteries contain a lot of muscle fibres to contract and generate pressure in the blood.
A 1, 2 and 3
B Only 1 and 2
C Only 2 and 3
D Only 1
Your answer [1]
15 Phospholipid bilayers play crucial roles within plant cells.
Which of the following statements linked to the importance of membranes in plant cells is/are true? Statement 1: ATP synthase embedded in thylakoid membranes maintains chemiosmotic
gradients.
Statement 2: Phospholipid bilayers within the chloroplast are impermeable to protons.
Statement 3: Thylakoid membranes contain electron transport chain proteins.
A 1, 2 and 3
B Only 1 and 2
C Only 2 and 3
D Only 1
Your answer [1]
SPECIMEN
PMT
9
© OCR 2014 H420/01 Turn over
SECTION B
Answer all the questions.
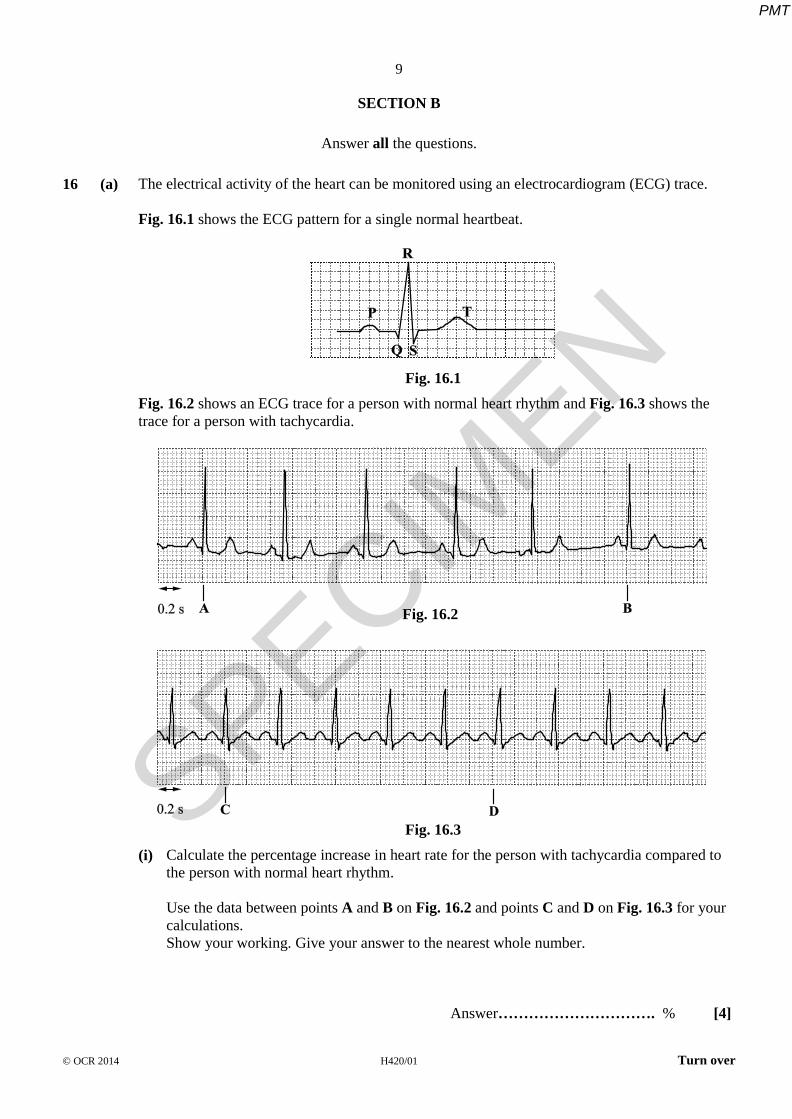
16 (a) The electrical activity of the heart can be monitored using an electrocardiogram (ECG) trace. Fig. 16.1 shows the ECG pattern for a single normal heartbeat.
Fig. 16.1
Fig. 16.2 shows an ECG trace for a person with normal heart rhythm and Fig. 16.3 shows the trace for a person with tachycardia.
Fig. 16.3
(i) Calculate the percentage increase in heart rate for the person with tachycardia compared to the person with normal heart rhythm. Use the data between points A and B on Fig. 16.2 and points C and D on Fig. 16.3 for your calculations. Show your working. Give your answer to the nearest whole number.
Answer…………………………. % [4]
Fig. 16.2
SPECIMEN
PMT
10
© OCR 2014 H420/01
(ii) The most obvious feature of tachycardia is an increased heart rate. Using the information in Fig. 16.1, Fig. 16.2 and Fig. 16.3, what are other key features of tachycardia?
……………………………………………………………………………………………….
……………………………………………………………………………………………….
……………………………………………………………………………………………….
…………………………………………………………………………………………. [2]
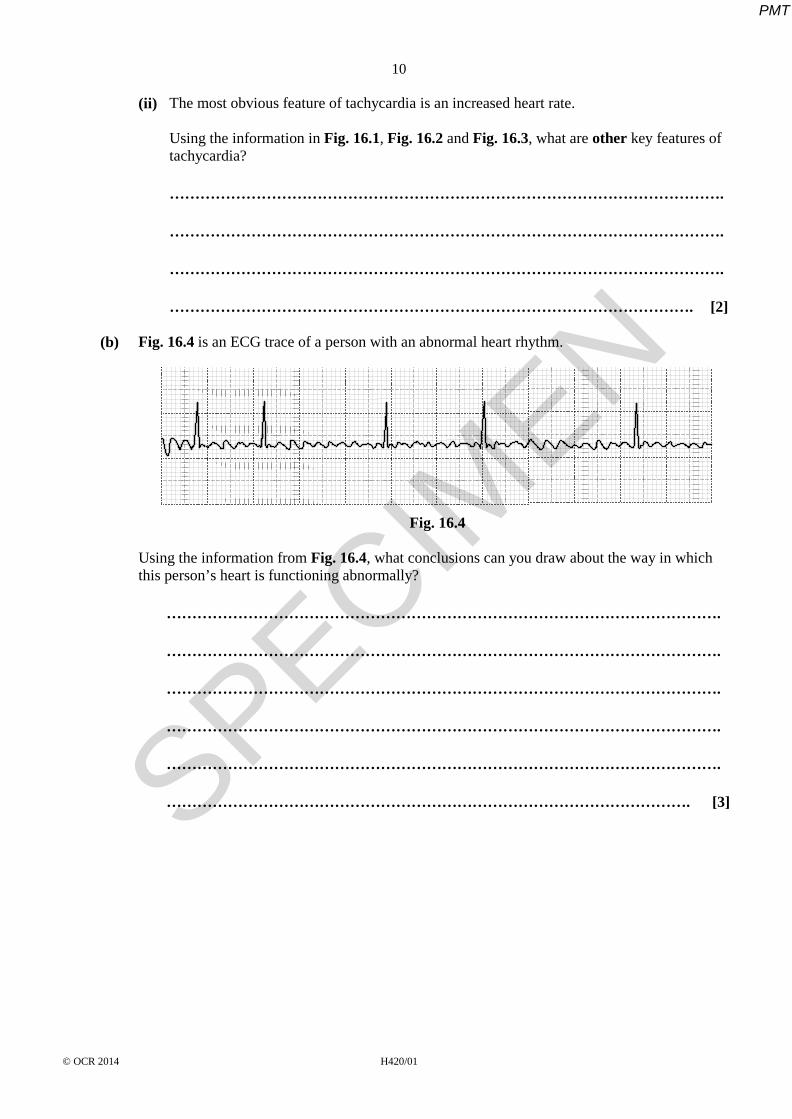
(b) Fig. 16.4 is an ECG trace of a person with an abnormal heart rhythm.
Fig. 16.4
Using the information from Fig. 16.4, what conclusions can you draw about the way in which this person’s heart is functioning abnormally?
……………………………………………………………………………………………….
……………………………………………………………………………………………….
……………………………………………………………………………………………….
……………………………………………………………………………………………….
……………………………………………………………………………………………….
…………………………………………………………………………………………. [3]
SPECIMEN
PMT

11
© OCR 2014 H420/01 Turn over
17 (a) Fig. 17.1 is a diagram of the external view of a mammalian liver.
Fig. 17.1
Identify, with reasons, each of the blood vessels labelled A – C in Fig. 17.1.
A……………………………………………………………………………………………….
…………………………………………………………………………………………………
B……………………………………………………………………………………………….
…………………………………………………………………………………………………
C……………………………………………………………………………………………….
…………………………………………………………………………………………………
[3] SPECIM
EN
PMT
12
© OCR 2014 H420/01
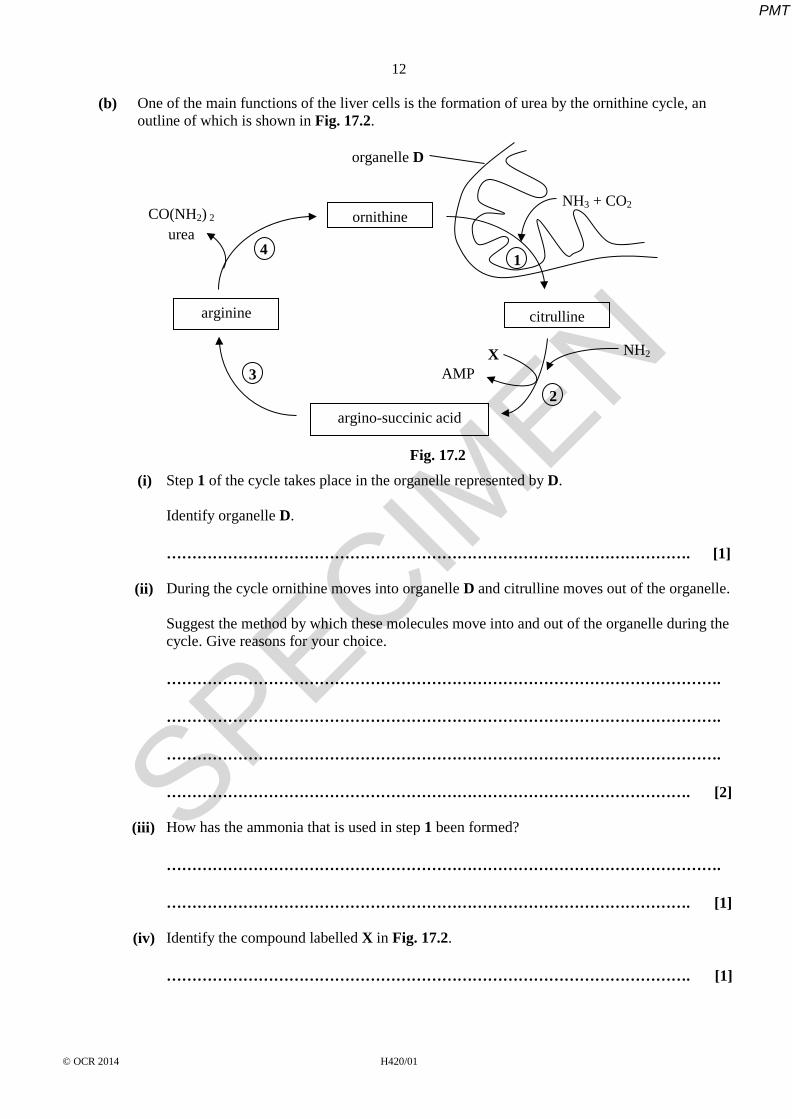
(b) One of the main functions of the liver cells is the formation of urea by the ornithine cycle, an outline of which is shown in Fig. 17.2.
Fig. 17.2
(i) Step 1 of the cycle takes place in the organelle represented by D. Identify organelle D.
…………………………………………………………………………………………. [1]
(ii) During the cycle ornithine moves into organelle D and citrulline moves out of the organelle.
Suggest the method by which these molecules move into and out of the organelle during the cycle. Give reasons for your choice.
……………………………………………………………………………………………….
……………………………………………………………………………………………….
……………………………………………………………………………………………….
…………………………………………………………………………………………. [2]
(iii) How has the ammonia that is used in step 1 been formed?
……………………………………………………………………………………………….
…………………………………………………………………………………………. [1] (iv) Identify the compound labelled X in Fig. 17.2.
…………………………………………………………………………………………. [1]
ornithine
arginine citrulline
argino-succinic acid
NH3 + CO2
AMP
NH2
CO(NH2) 2 urea
X
organelle D
1
2
3
4
SPECIMEN
PMT
13
© OCR 2014 H420/01 Turn over
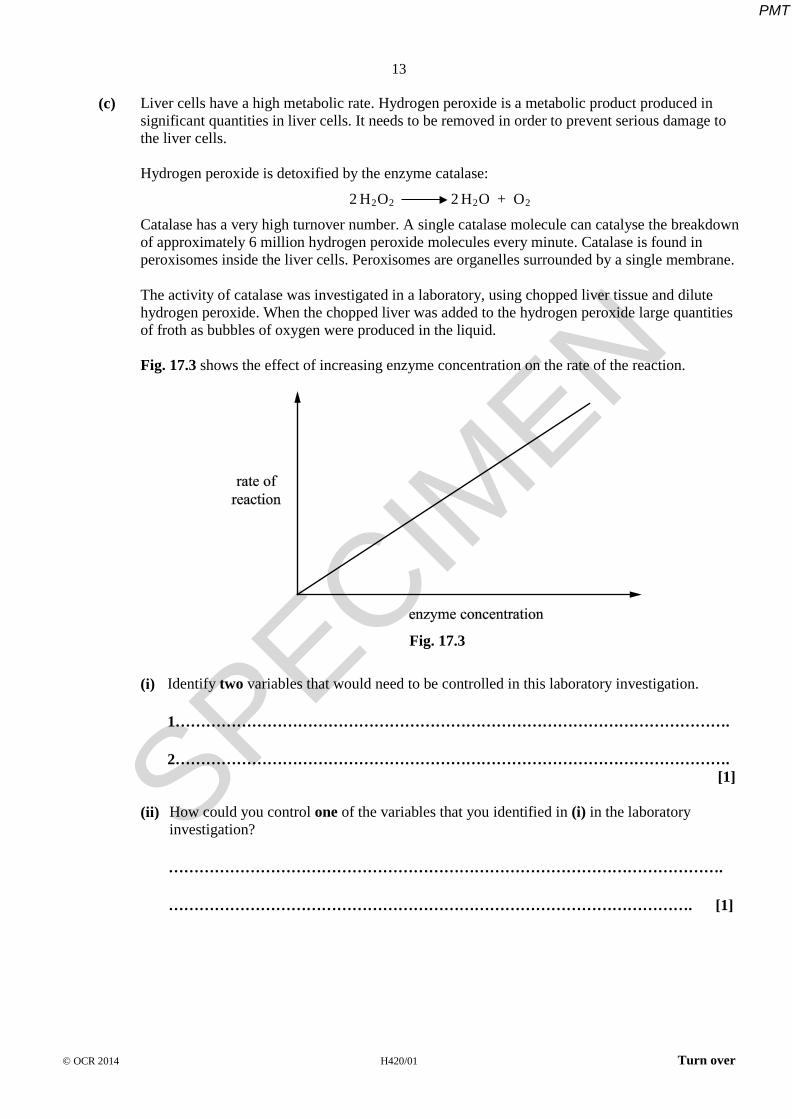
(c) Liver cells have a high metabolic rate. Hydrogen peroxide is a metabolic product produced in significant quantities in liver cells. It needs to be removed in order to prevent serious damage to the liver cells. Hydrogen peroxide is detoxified by the enzyme catalase:
2 H2O2 2 H2O + O2
Catalase has a very high turnover number. A single catalase molecule can catalyse the breakdown of approximately 6 million hydrogen peroxide molecules every minute. Catalase is found in peroxisomes inside the liver cells. Peroxisomes are organelles surrounded by a single membrane. The activity of catalase was investigated in a laboratory, using chopped liver tissue and dilute hydrogen peroxide. When the chopped liver was added to the hydrogen peroxide large quantities of froth as bubbles of oxygen were produced in the liquid.
Fig. 17.3 shows the effect of increasing enzyme concentration on the rate of the reaction.
Fig. 17.3
(i) Identify two variables that would need to be controlled in this laboratory investigation.
1……………………………………………………………………………………………….
2………………………………………………………………………………………………. [1] (ii) How could you control one of the variables that you identified in (i) in the laboratory
investigation?
……………………………………………………………………………………………….
…………………………………………………………………………………………. [1]
SPECIMEN
PMT
14
© OCR 2014 H420/01
(iii)* Using the information given in part (c), deduce why and how catalase activity is regulated inside the liver cells.
……………………………………………………………………………………………….
……………………………………………………………………………………………….
……………………………………………………………………………………………….
……………………………………………………………………………………………….
……………………………………………………………………………………………….
……………………………………………………………………………………………….
……………………………………………………………………………………………….
……………………………………………………………………………………………….
……………………………………………………………………………………………….
……………………………………………………………………………………………….
……………………………………………………………………………………………….
…………………………………………………………………………………………. [6]
SPECIMEN
PMT
15
© OCR 2014 H420/01 Turn over
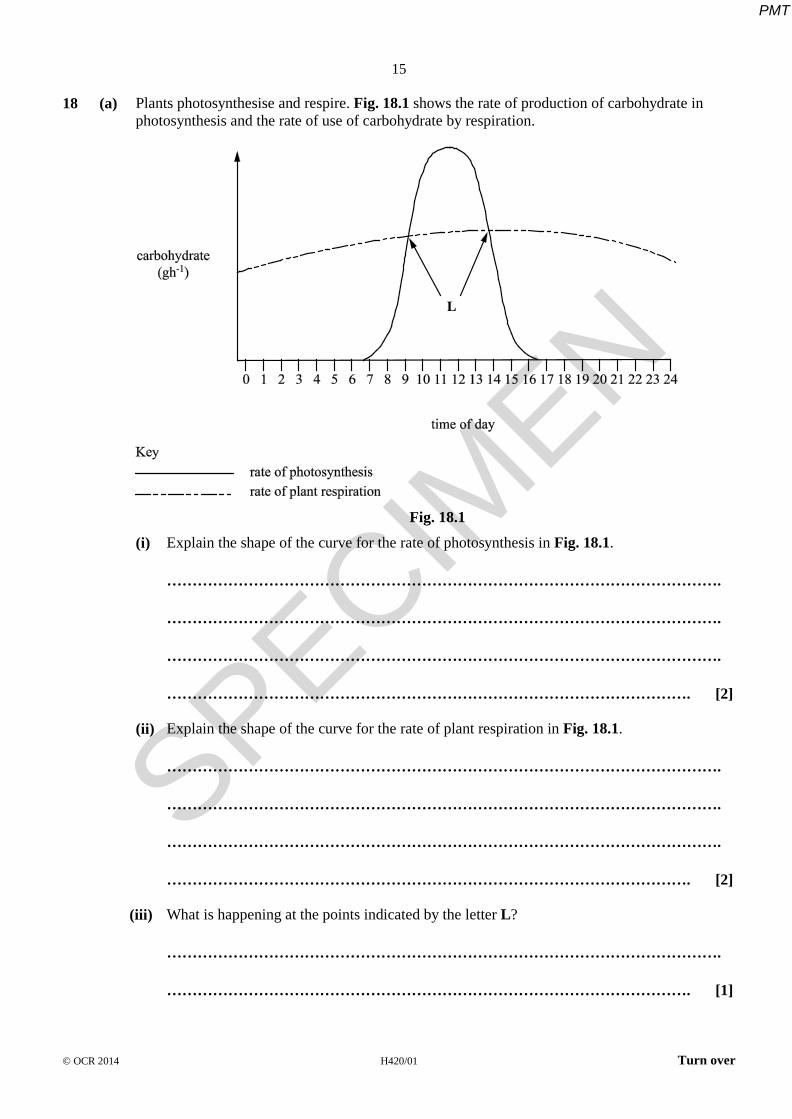
18 (a) Plants photosynthesise and respire. Fig. 18.1 shows the rate of production of carbohydrate in photosynthesis and the rate of use of carbohydrate by respiration.
Fig. 18.1
(i) Explain the shape of the curve for the rate of photosynthesis in Fig. 18.1.
……………………………………………………………………………………………….
……………………………………………………………………………………………….
……………………………………………………………………………………………….
…………………………………………………………………………………………. [2] (ii) Explain the shape of the curve for the rate of plant respiration in Fig. 18.1.
……………………………………………………………………………………………….
……………………………………………………………………………………………….
……………………………………………………………………………………………….
…………………………………………………………………………………………. [2] (iii) What is happening at the points indicated by the letter L?
……………………………………………………………………………………………….
…………………………………………………………………………………………. [1]
SPECIMEN
PMT
16
© OCR 2014 H420/01
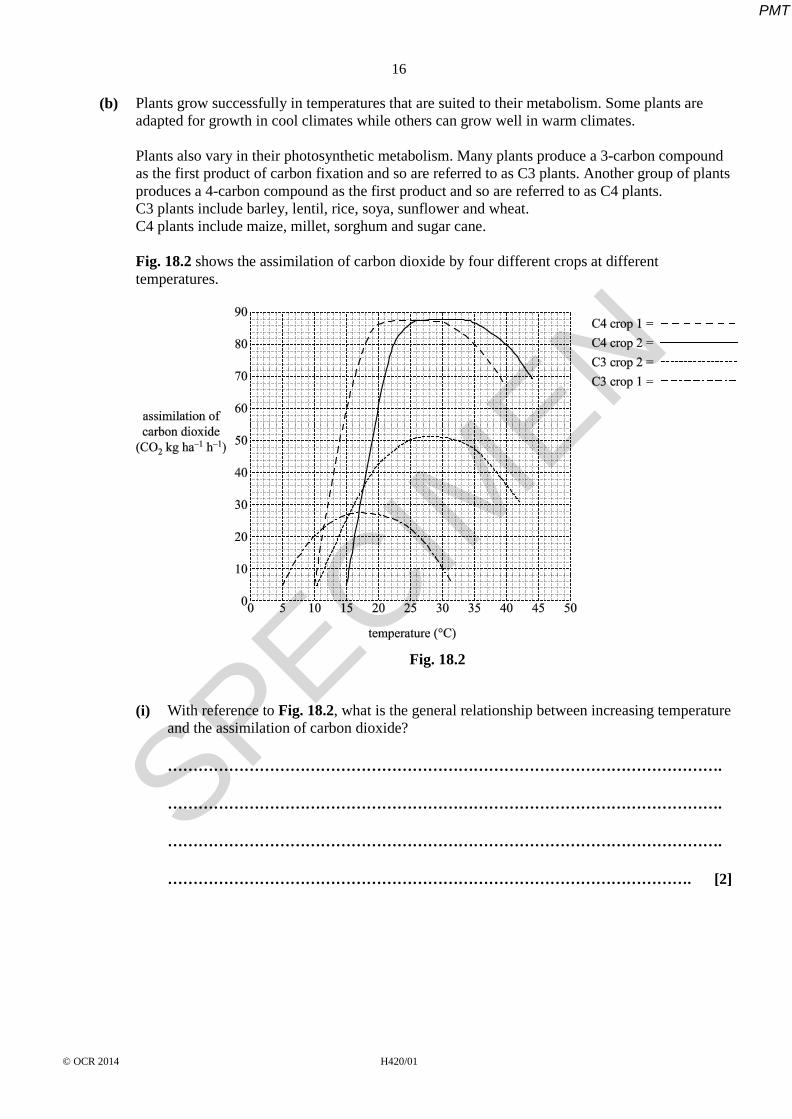
(b) Plants grow successfully in temperatures that are suited to their metabolism. Some plants are adapted for growth in cool climates while others can grow well in warm climates. Plants also vary in their photosynthetic metabolism. Many plants produce a 3-carbon compound as the first product of carbon fixation and so are referred to as C3 plants. Another group of plants produces a 4-carbon compound as the first product and so are referred to as C4 plants. C3 plants include barley, lentil, rice, soya, sunflower and wheat. C4 plants include maize, millet, sorghum and sugar cane. Fig. 18.2 shows the assimilation of carbon dioxide by four different crops at different temperatures.
Fig. 18.2
(i) With reference to Fig. 18.2, what is the general relationship between increasing temperature and the assimilation of carbon dioxide?
……………………………………………………………………………………………….
……………………………………………………………………………………………….
……………………………………………………………………………………………….
…………………………………………………………………………………………. [2]
SPECIMEN
PMT
17
© OCR 2014 H420/01 Turn over
(ii) Calculate the values for the mean assimilation of carbon dioxide by C3 plants and C4 plants at 20 oC. Include units in your answer.
C3
……………………………………………………………………………………………….
C4
……………………………………………………………………………………………….
[2] (iii) Suggest a conclusion that could be drawn from the mean values you calculated in part (ii).
……………………………………………………………………………………………….
…………………………………………………………………………………………. [1] (iv) With reference to Fig. 18.2, suggest which curve corresponds to each of the following crops:
Sugar cane, which grows in warm climates.
………………………………………………………………………………………….
Barley, which grows in cool climates.
…………………………………………………………………………………………. [2]
SPECIMEN
PMT
18
© OCR 2014 H420/01
(c) Temperature is very important in determining a plant’s ability to photosynthesise effectively. Temperature stress is becoming of great concern to plant physiologists because of climate change.
• High temperature (HT) stress is defined as the rise in temperature that is sufficient to cause irreversible damage to plant growth and development.
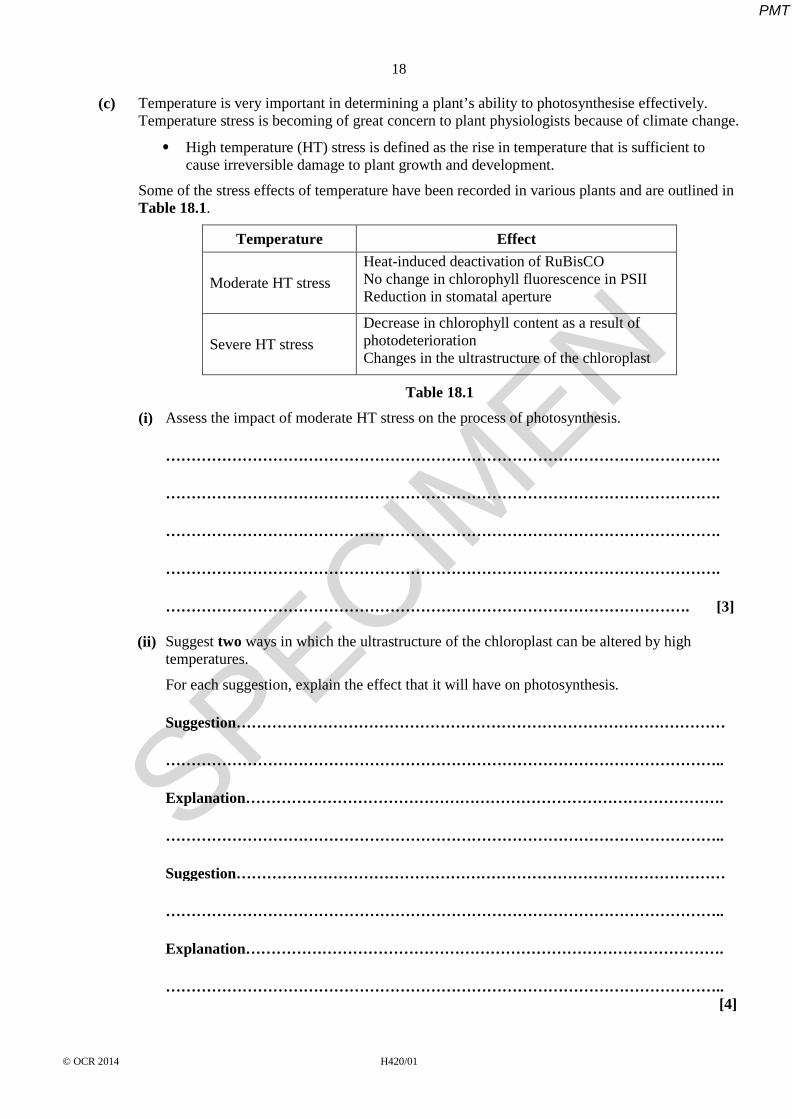
Some of the stress effects of temperature have been recorded in various plants and are outlined in Table 18.1.
Temperature Effect
Moderate HT stress Heat-induced deactivation of RuBisCO No change in chlorophyll fluorescence in PSII Reduction in stomatal aperture
Severe HT stress Decrease in chlorophyll content as a result of photodeterioration Changes in the ultrastructure of the chloroplast
Table 18.1
(i) Assess the impact of moderate HT stress on the process of photosynthesis.
……………………………………………………………………………………………….
……………………………………………………………………………………………….
……………………………………………………………………………………………….
……………………………………………………………………………………………….
…………………………………………………………………………………………. [3] (ii) Suggest two ways in which the ultrastructure of the chloroplast can be altered by high
temperatures.
For each suggestion, explain the effect that it will have on photosynthesis.
Suggestion……………………………………………………………………………………
………………………………………………………………………………………………..
Explanation………………………………………………………………………………….
………………………………………………………………………………………………..
Suggestion……………………………………………………………………………………
………………………………………………………………………………………………..
Explanation………………………………………………………………………………….
……………………………………………………………………………………………….. [4]
SPECIMEN
PMT
19
© OCR 2014 H420/01 Turn over
19 (a) Following their formation, assimilates are transported throughout the plant by translocation in phloem. Phloem sap mainly consists of carbohydrate in the form of sucrose, but also contains other solutes.
(i) Suggest why it is beneficial to the plant for the carbohydrate to be transferred throughout the plant in the form of sucrose rather than as an alternative carbohydrate.
……………………………………………………………………………………………….
……………………………………………………………………………………………….
……………………………………………………………………………………………….
…………………………………………………………………………………………. [2]
(ii) How is transport in the phloem similar to and different from transport in the xylem?
Similar……………………………………………………………………………………….
……………………………………………………………………………………………….
Different……………………………………………………………………………………..
………………………………………………………………………………………………. [2] (b) Assimilates are loaded into the phloem at the ‘source’ and then transported to the ‘sink’.
(i) Explain, with a suitable example, how some parts of the plant can act as both a ‘source’ and
a ‘sink’.
……………………………………………………………………………………………….
……………………………………………………………………………………………….
……………………………………………………………………………………………….
…………………………………………………………………………………………. [2]
SPECIMEN
PMT
20
© OCR 2014 H420/01
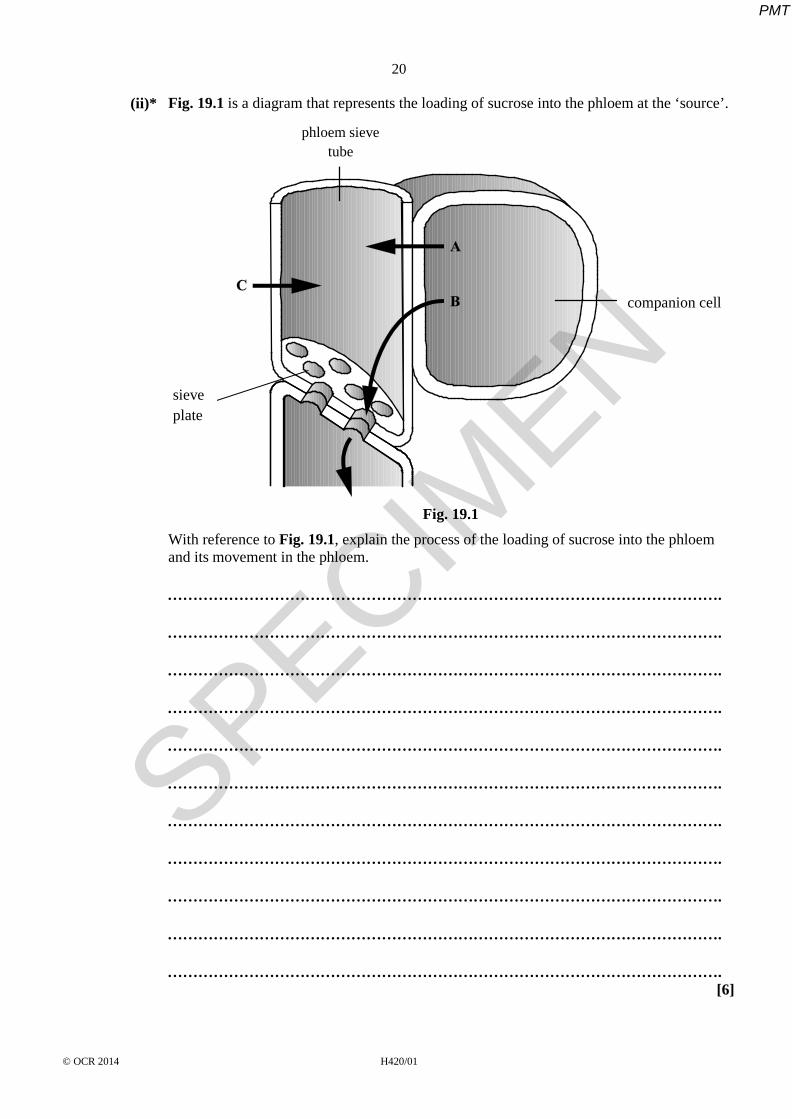
(ii)* Fig. 19.1 is a diagram that represents the loading of sucrose into the phloem at the ‘source’.
Fig. 19.1
With reference to Fig. 19.1, explain the process of the loading of sucrose into the phloem and its movement in the phloem.
……………………………………………………………………………………………….
……………………………………………………………………………………………….
……………………………………………………………………………………………….
……………………………………………………………………………………………….
……………………………………………………………………………………………….
……………………………………………………………………………………………….
……………………………………………………………………………………………….
……………………………………………………………………………………………….
……………………………………………………………………………………………….
……………………………………………………………………………………………….
……………………………………………………………………………………………….
[6]
companion cell
sieve plate
phloem sieve tube
SPECIMEN
PMT
21
© OCR 2014 H420/01 Turn over
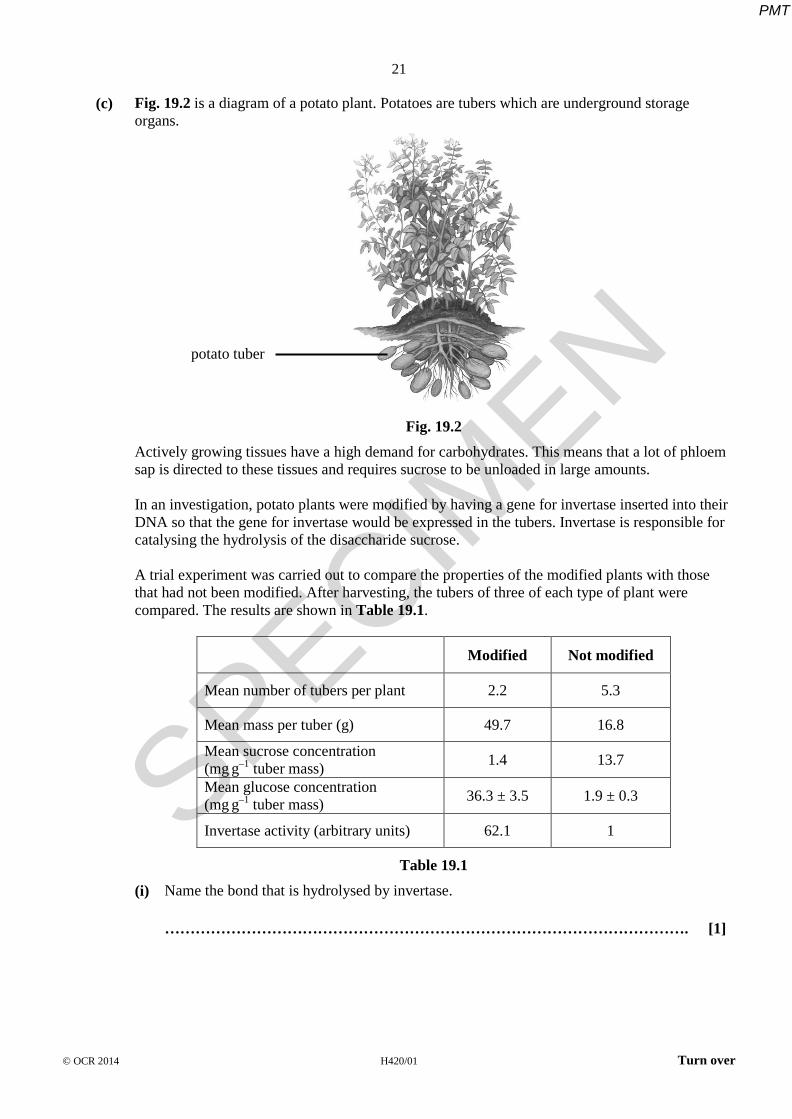
(c) Fig. 19.2 is a diagram of a potato plant. Potatoes are tubers which are underground storage organs.
Fig. 19.2
Actively growing tissues have a high demand for carbohydrates. This means that a lot of phloem sap is directed to these tissues and requires sucrose to be unloaded in large amounts. In an investigation, potato plants were modified by having a gene for invertase inserted into their DNA so that the gene for invertase would be expressed in the tubers. Invertase is responsible for catalysing the hydrolysis of the disaccharide sucrose. A trial experiment was carried out to compare the properties of the modified plants with those that had not been modified. After harvesting, the tubers of three of each type of plant were compared. The results are shown in Table 19.1.
Modified Not modified
Mean number of tubers per plant 2.2 5.3
Mean mass per tuber (g) 49.7 16.8
Mean sucrose concentration (mg g–1
tuber mass) 1.4 13.7
Mean glucose concentration (mg g–1 tuber mass) 36.3 ± 3.5 1.9 ± 0.3
Invertase activity (arbitrary units) 62.1 1
Table 19.1
(i) Name the bond that is hydrolysed by invertase.
…………………………………………………………………………………………. [1]
potato tuber
SPECIMEN
PMT
22
© OCR 2014 H420/01
(ii) The potato tubers contain monosaccharides. Compare the concentration of monosaccharides in the modified tubers with those that were not modified.
……………………………………………………………………………………………….
…………………………………………………………………………………………. [2] i(iii) In the modified plants, the unloading of sucrose is increased in the tubers compared with
those that were not modified.
The transport of sucrose to the tubers was also increased in the modified plants. Using the data and the information given, deduce a possible mechanism to account for the increased unloading and transport of sucrose in the modified plants.
……………………………………………………………………………………………….
……………………………………………………………………………………………….
……………………………………………………………………………………………….
……………………………………………………………………………………………….
…………………………………………………………………………………………… [4]
( (iv) The trial experiment compared the properties of modified potato plants with those that were
not modified. Analyse the data and draw conclusions about the yield of the tubers of modified plants compared with those tubers from plants which had not been modified.
……………………………………………………………………………………………….
……………………………………………………………………………………………….
……………………………………………………………………………………………….
…………………………………………………………………………………………. [3]
SPECIMEN
PMT
23
© OCR 2014 H420/01 Turn over
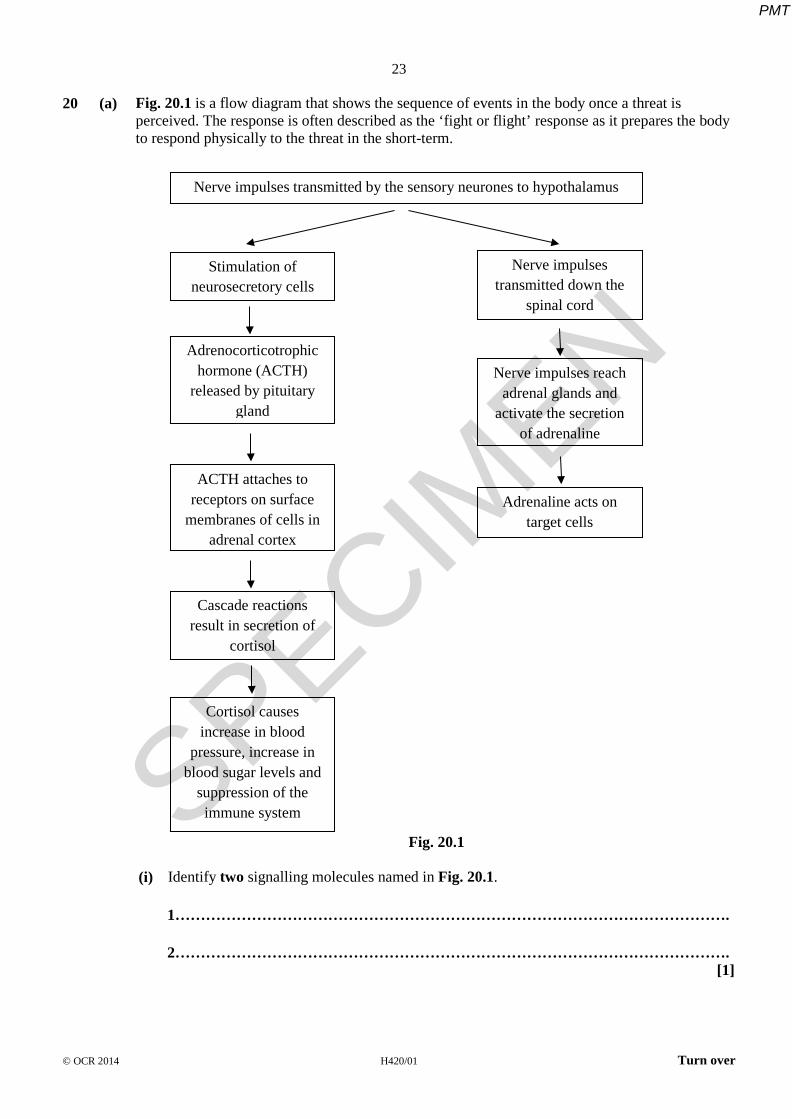
20 (a) Fig. 20.1 is a flow diagram that shows the sequence of events in the body once a threat is perceived. The response is often described as the ‘fight or flight’ response as it prepares the body to respond physically to the threat in the short-term.
Fig. 20.1
(i) Identify two signalling molecules named in Fig. 20.1.
1……………………………………………………………………………………………….
2………………………………………………………………………………………………. [1]
Nerve impulses transmitted by the sensory neurones to hypothalamus
Stimulation of neurosecretory cells
Adrenocorticotrophic hormone (ACTH)
released by pituitary gland
ACTH attaches to receptors on surface
membranes of cells in adrenal cortex
Cascade reactions result in secretion of
cortisol
Cortisol causes increase in blood
pressure, increase in blood sugar levels and
suppression of the immune system
Nerve impulses transmitted down the
spinal cord
Nerve impulses reach adrenal glands and
activate the secretion of adrenaline
Adrenaline acts on target cells
SPECIMEN
PMT
24
© OCR 2014 H420/01
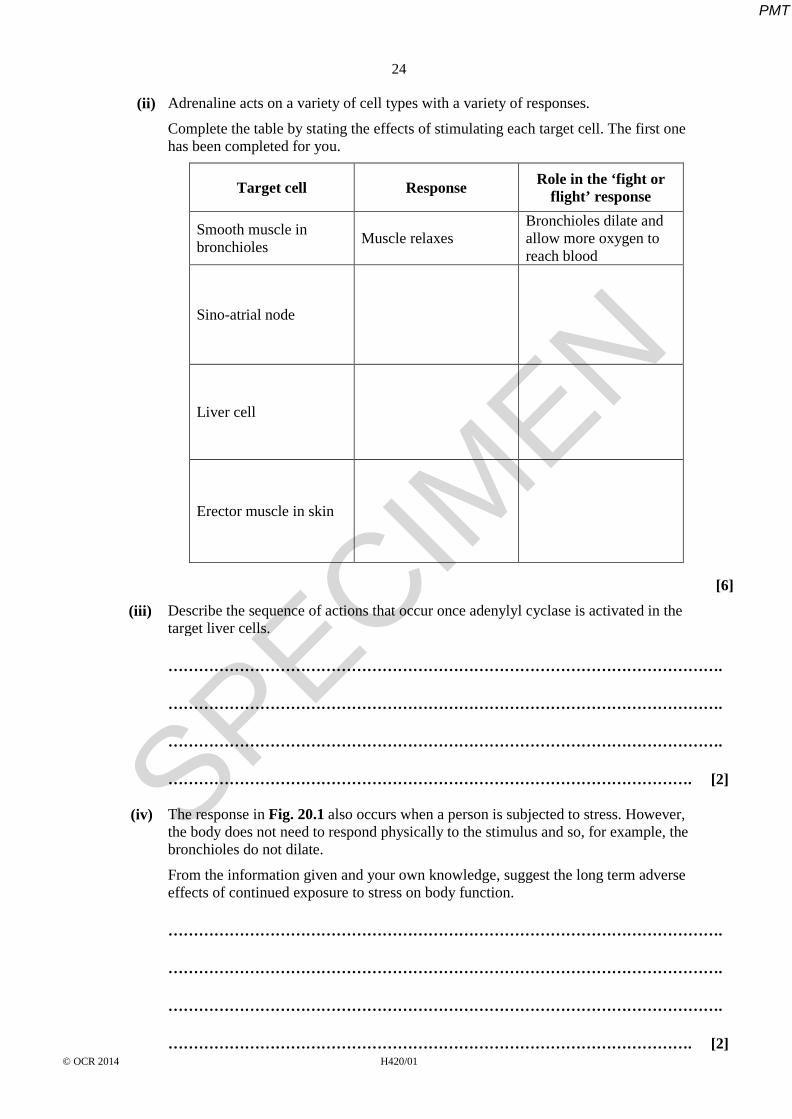
(ii) Adrenaline acts on a variety of cell types with a variety of responses.
Complete the table by stating the effects of stimulating each target cell. The first one has been completed for you.
Target cell Response Role in the ‘fight or flight’ response
Smooth muscle in bronchioles Muscle relaxes
Bronchioles dilate and allow more oxygen to reach blood
Sino-atrial node
Liver cell
Erector muscle in skin
[6] (iii) Describe the sequence of actions that occur once adenylyl cyclase is activated in the
target liver cells.
……………………………………………………………………………………………….
……………………………………………………………………………………………….
……………………………………………………………………………………………….
…………………………………………………………………………………………. [2] (iv) The response in Fig. 20.1 also occurs when a person is subjected to stress. However,
the body does not need to respond physically to the stimulus and so, for example, the bronchioles do not dilate.
From the information given and your own knowledge, suggest the long term adverse effects of continued exposure to stress on body function.
……………………………………………………………………………………………….
……………………………………………………………………………………………….
……………………………………………………………………………………………….
…………………………………………………………………………………………. [2]
SPECIMEN
PMT
25
© OCR 2014 H420/01 Turn over
(b) Part of the body’s response ‘fight or flight’ is to run away from the threat. Prolonged vigorous exercise puts high demands on the body’s metabolism.
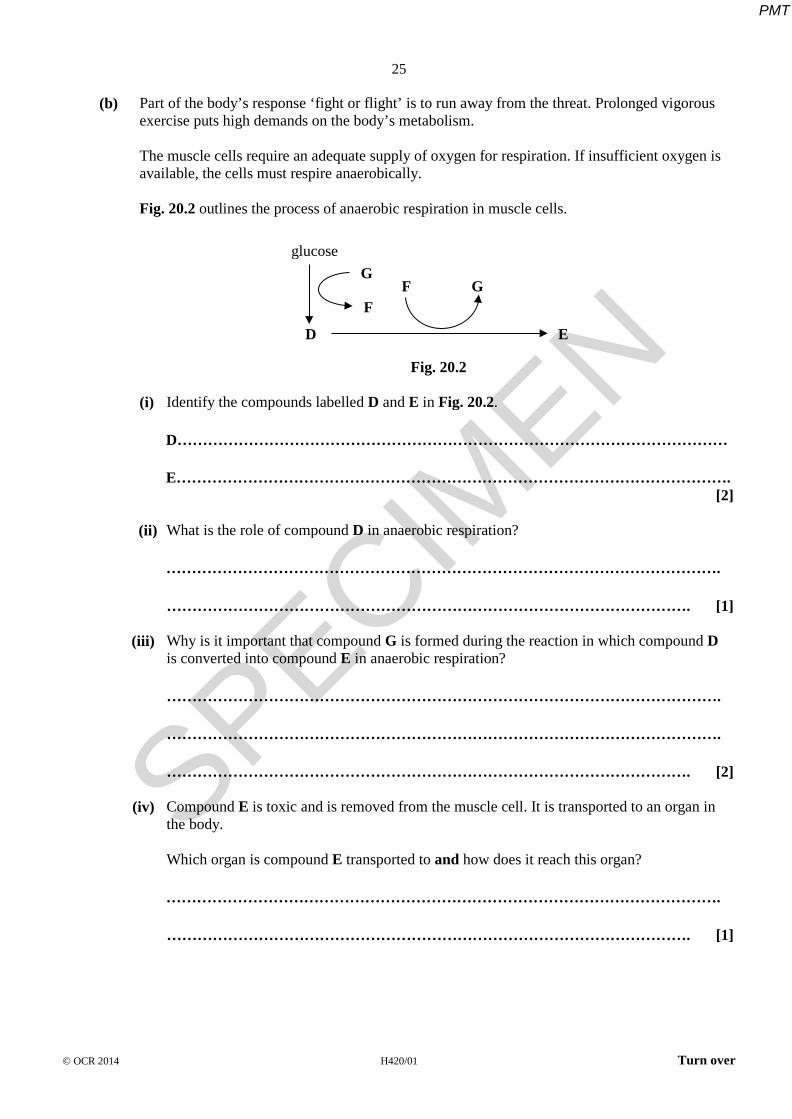
The muscle cells require an adequate supply of oxygen for respiration. If insufficient oxygen is available, the cells must respire anaerobically. Fig. 20.2 outlines the process of anaerobic respiration in muscle cells.
Fig. 20.2
(i) Identify the compounds labelled D and E in Fig. 20.2.
D………………………………………………………………………………………………
E………………………………………………………………………………………………. [2] (ii) What is the role of compound D in anaerobic respiration?
……………………………………………………………………………………………….
…………………………………………………………………………………………. [1] (iii) Why is it important that compound G is formed during the reaction in which compound D
is converted into compound E in anaerobic respiration?
……………………………………………………………………………………………….
……………………………………………………………………………………………….
…………………………………………………………………………………………. [2] (iv) Compound E is toxic and is removed from the muscle cell. It is transported to an organ in
the body. Which organ is compound E transported to and how does it reach this organ?
……………………………………………………………………………………………….
…………………………………………………………………………………………. [1]
glucose
D E
F GG
F
SPECIMEN
PMT
26
© OCR 2014 H420/01
(c) Athletic sprinters require large amounts of energy in short periods of time. Many elite sprinters can run 100 metre races in under 10 seconds. Under normal conditions, exercise requires an increased rate of breathing. It has been observed that some of the best sprinters only take one breath at the start of the race and do not inhale again until the end of the race. Suggest how these sprinters can expend so much energy without needing to carry out aerobic respiration.
……………………………………………………………………………………………………..
……………………………………………………………………………………………………..
……………………………………………………………………………………………………..
………………………………………………………………………………………………. [2]
END OF QUESTION PAPER
SPECIMEN
PMT