Embed Size (px)
Citation preview

David Lynn M.Sc., Ph.D., Department of Molecular Biology & Biochemistry,
Simon Fraser University,Vancouver, B.C., Canada.
Conservation Genetics Data Analysis Course11-16 September 2007, Flathead Lake Biological Station, Montana, USA.
Inferring Cases of Lineage-Specific Inferring Cases of Lineage-Specific and Site-Specific Adaptive Evolutionand Site-Specific Adaptive Evolution
An Introduction to Ziheng Yang’s PAML.An Introduction to Ziheng Yang’s PAML.

Talk Preview
Adaptive evolution (positive selection) introduction.
Statistical methods to detect positive selection.
A step-by-step example of using PAML to detect positive selection.
Genome-wide scans for positive selection.
Detecting selection in bovine immune genes.

Adaptive Evolution
Most variation within or between species random fixation selectively neutral mutations.
Selectively deleterious purifying selection not tolerated.
Occasionally, mutations selective advantage positive selection (adaptive evolution) fixed in the population at a much higher rate.

Why Study Adaptive Evolution?
The detection of adaptive evolution at the molecular level is of interest not only as an insight into the process of evolution but also because of its functional implications for genes of interest.
From an evolutionary biology perspective – much interest in detecting whether most mutations are deleterious, advantageous or neutral – The Neutral Theory.
Identification of selected loci provide insight into the events that have shaped a species’ evolution & can indicate which genes have been particularly important in the evolution of a species e.g. positive selection in human CCR5 suggested to have been driven by selective agents e.g. bubonic plague or smallpox.
The capacity of a species or population to respond to and survive novel infectious disease challenge is one of the most significant selective forces shaping genetic diversity.
By screening for selective signatures associated with immunity or disease susceptibility, we may be able to identify those genes that have been of critical importance to the development of disease resistance.

Why Study Adaptive Evolution?
Can indicate which amino acid sites/domains are functionally important in a molecule.
MHC – antigen recognition domain subject to positive selection (Hughes & Nei, 1988).
TLR4 – sites subject to PS suggest location of ligand binding domain
(White et al., 2003).
Alpha-defensins – PS in mature antimicrobial peptide (Lynn et al., 2004).
© UCL Biology
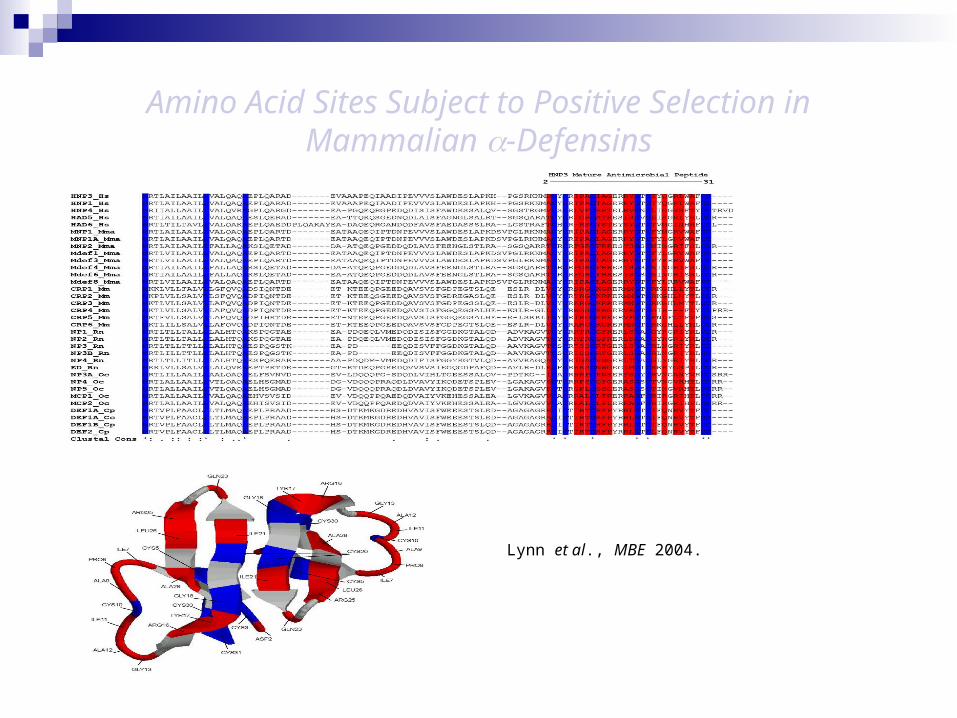
Amino Acid Sites Subject to Positive Selection in Mammalian -Defensins
Lynn et al., MBE 2004.
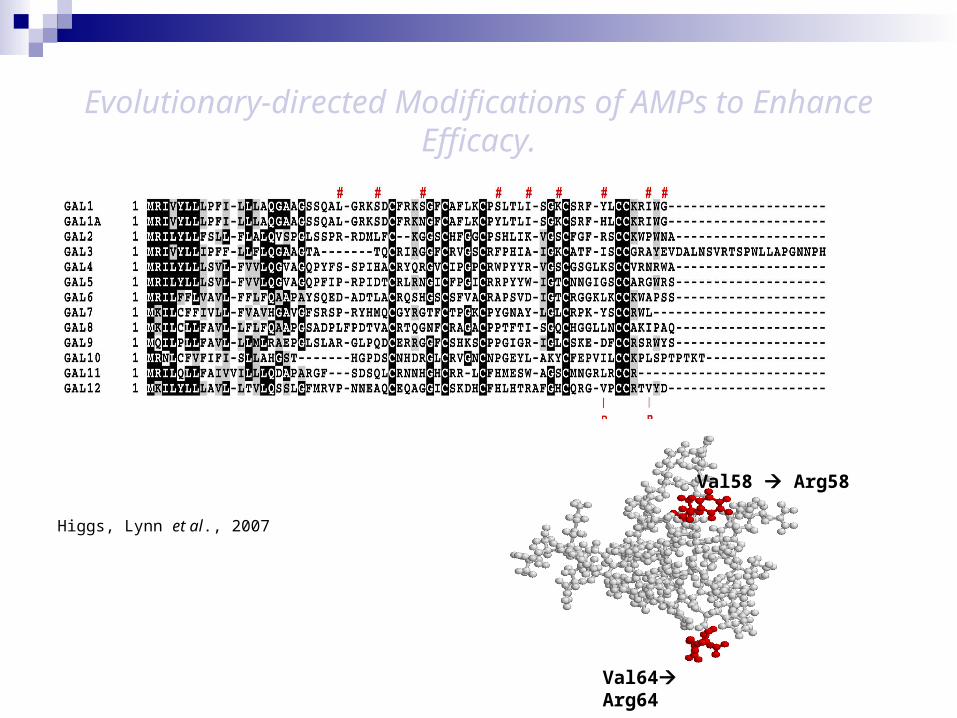
Evolutionary-directed Modifications of AMPs to Enhance Efficacy.
Val58 Arg58
Val64 Arg64
Higgs, Lynn et al., 2007
Detecting Positive Selection using Molecular Sequence Data
Widely used method to detect adaptive evolution accelerated rate of dN/ds
dN = # nonsynonymous (protein changing) substitutions per nonsynonymous site dS = # synonymous substitutions per synonymous site
ds (silent subs) are assumed to be neutral.
But see recent papers on selection acting on synonymous sites e.g. mRNA stability (Resch et al MBE 2007), at exonic splicing enhancers (Parmley et al MBE 2006) etc.
If amino acid changes selectively neutral fixed at the same rate as synonymous mutations and ω = 1.
If nonsynonymous mutations are slightly deleterious, then ω < 1.
If amino acid changes selectively advantageous fixed at a higher rate and ω > 1.

Statistical Methods to Detect Positive Selection
Early methods simply counted dN and dS but were heavily biased due to simplistic assumptions.
Most new methods correct for unequal transition/transversion ratios, codon usage bias and GC content.
Statistical Methods to Detect Positive Selection Many different methods now available to detect positive selection (particularly PS
acting at certain amino acid sites).
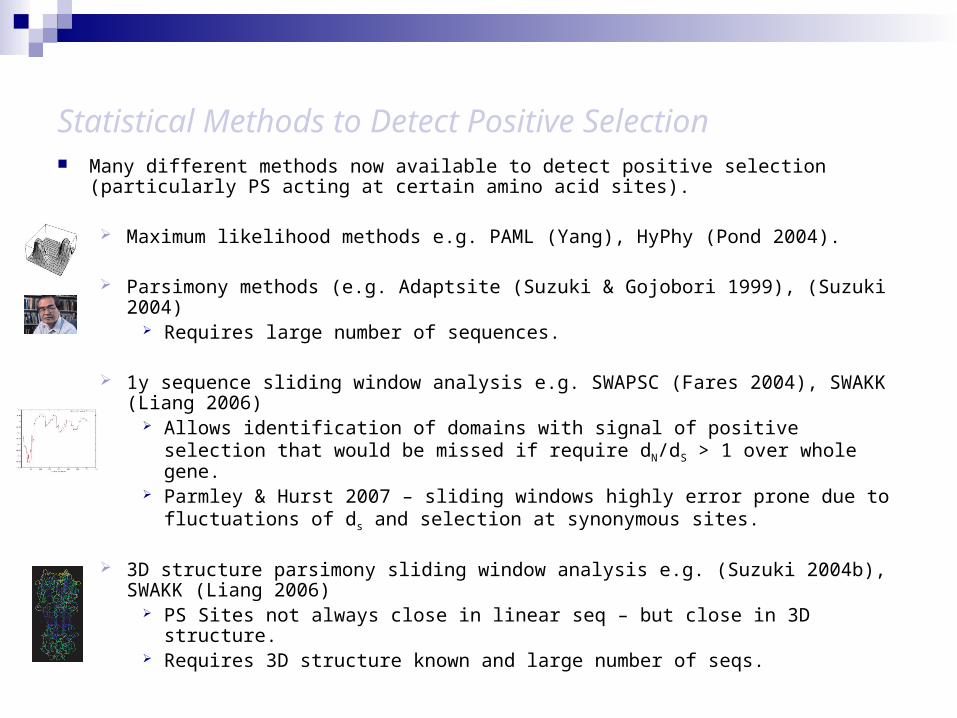
Maximum likelihood methods e.g. PAML (Yang), HyPhy (Pond 2004).
Parsimony methods (e.g. Adaptsite (Suzuki & Gojobori 1999), (Suzuki 2004) Requires large number of sequences.
1y sequence sliding window analysis e.g. SWAPSC (Fares 2004), SWAKK (Liang 2006)
Allows identification of domains with signal of positive selection that would be missed if require dN/dS > 1 over whole gene.
Parmley & Hurst 2007 – sliding windows highly error prone due to fluctuations of ds and selection at synonymous sites.
3D structure parsimony sliding window analysis e.g. (Suzuki 2004b), SWAKK (Liang 2006)
PS Sites not always close in linear seq – but close in 3D structure. Requires 3D structure known and large number of seqs.

Ziheng Yang’s PAML Program
The most widely used and accepted set of methods to detect positive selection.
http://abacus.gene.ucl.ac.uk/software/paml.html
Available for

PAML Models
Models to detect positive selection acting on
Particular branches/lineages a of phylogeny / certain genes
in particular species (lineage/branch-specific models).
Particular codon (amino acid) sites (site-specific models).
On both simultaneously (branch-site model).
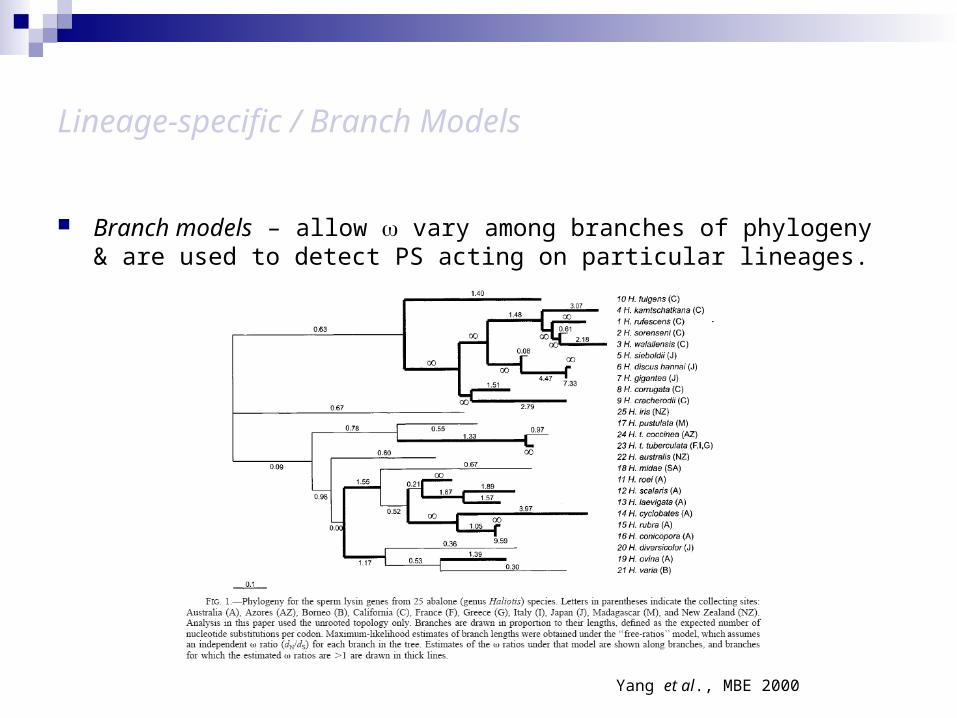
Lineage-specific / Branch Models
Branch models – allow vary among branches of phylogeny & are used to detect PS acting on particular lineages.
Yang et al., MBE 2000

Lineage-specific / Branch Models
Model = 0 one-ratio model assumes an equal ω-ratio for all branches in the phylogeny (The null model).
Model = 1 free-ratios model assumes an independent ω-ratio for each branch.
These models can be compared by Likelihood Ratio Test (LRT) compares lnL values for each model and tests if they are significantly different.
P value determined Twice the log-likelihood difference between the two models compared to a 2 distribution with d.f. = difference in # parameters between one-ratio and free-ratios model (Yang 1998; Yang and Nielsen 1998).
Where free-ratios model significantly favored can conclude that there is variable selective pressure in the phylogeny.
If some branches have > 1 weak evidence of PS.

Lineage-specific / Branch Models
Problem: free-ratios model is very parameter-rich use of a more specific model is preferred.
Model = 2 “two”-ratios model allows two or more ω ratios. User must specify how many ratios and which branches should have which rates in the tree file by using branch labels.
Allows testing of specific hypotheses e.g. PS acting on genes after duplication, PS acting on particular species etc.
LRT again used to compared two-ratios and one-ratio model.
Where two-ratios model significantly favored & branches tested have > 1 can conclude that there is evidence of PS on those lineages.
To confirm significantly > 1 compare two-ratios model to same model but with fixed =1

Detecting Positive Selection on CD2 – A step by step example
Lynn et al., Genetics 2005

Requirements for PAML Analysis
A coding DNA sequence alignment in PAML format.
A treefile in newick-like format.
codeml.ctl parameter file.
PAML installed on your machine!

Coding DNA sequence alignment in PAML format
Coding DNA sequences should never be aligned at the DNA level as alignment programs may insert gaps in codons and can end up with out-of-frame alignment.
First align CD2 protein sequences using T-coffee program (or similar) http://www.tcoffee.org/
T-coffee

Coding DNA sequence alignment in PAML format
Protein alignment + fasta formatted DNA sequences for same genes. Note labels must be the same in
both files.
Copygaps.pl Uses protein
alignment as template to generate DNA alignment.
Every gap in protein aln 3 gaps in DNA aln
# of sequenceslength of aln

Copygaps.pl Perl Script
Rename copygaps.txt copgaps.pl
You may have to edit copygaps.pl to specify correct protein alignment file name, coding sequence fasta format file name, and output file name.
Perl needs to be installed on your computer.
Command line perl copygaps.pl
Output file name
Protein alignment file name
CDS fasta file name

The Treefile
# of sequences# of trees
PAML requires that a phylogeny of the sequences to be analyzed is constructed using a 3rd party program MEGA4 - http://www.megasoftware.net/ Phylip - http://evolution.genetics.washington.edu/phylip.html
Tree must be trifurcated not rooted.
For model =2 tests:
Specifies that cow and pig have the same rate and other branches have different independent rate allows test of PS specifically on these lineages.

The codeml.ctl file

Testing for Evidence of Lineage-Specific Positive Selection on the Mammalian CD2 Gene.

Running the Null Model – The one-ratio model
Edit the codeml.ctl file so that model = 0
Create a directory (“model0” for example) to run analysis.
Copy the codeml.ctl file, the “infile.nuc” file (coding sequence alignment in PAML format) & the treefile “intree.trees” into this directory.
These files can be downloaded from http://www.pathogenomics.ca/~dlynn/congen/

Running Codeml – PAML Program that Implements Models
PAML only runs from command line.
To open command prompt in windows XP start Run type “cmd”
will open

Running Codeml – PAML Program that Implements Models
“cd Desktop\model0” changes directory to model0
“dir” lists files in model0 directory
“C:\paml4\bin\codeml.exe” reads in codeml.ctl parameters and runs codeml.
Note: The exact paths shown here may differ on your own PC.

Codeml Running …..
Done!
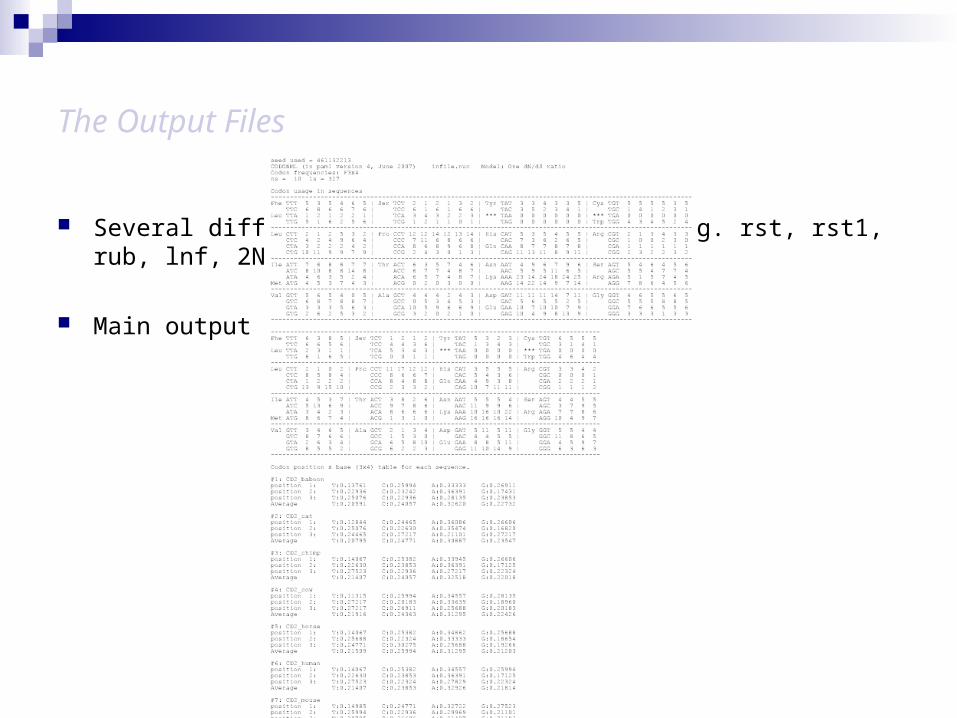
The Output Files
Several different output files produced e.g. rst, rst1, rub, lnf, 2NG.ds, 2NG.dn, 2NG.t, mlc
Main output file = mlc
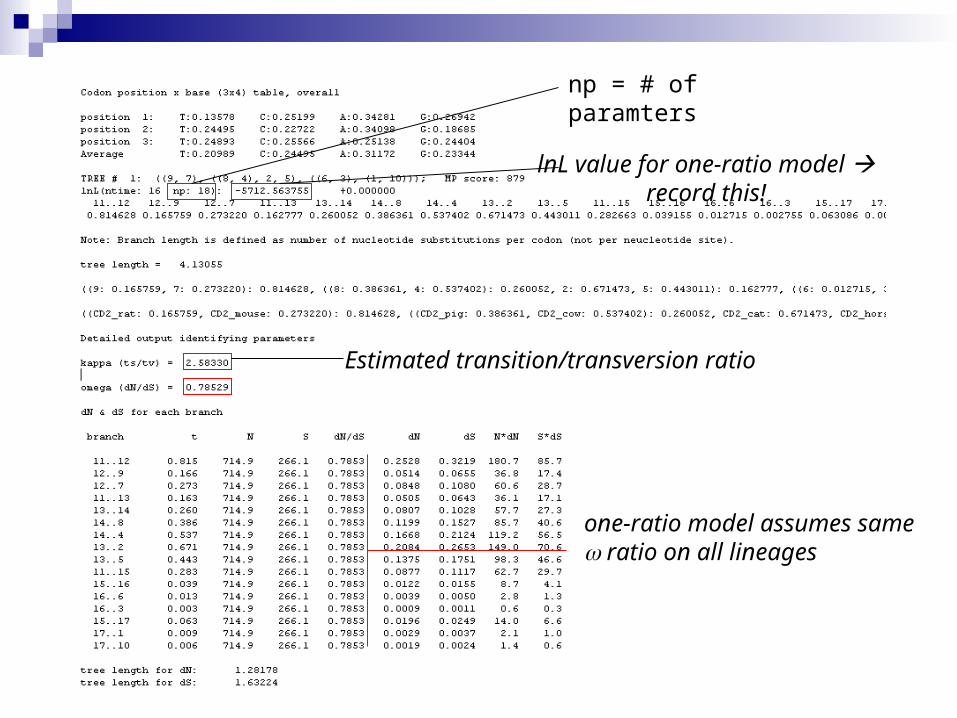
Estimated ratio
lnL value for one-ratio model record this!
Estimated transition/transversion ratio
one-ratio model assumes same ratio on all lineages
np = # of paramters

Running the free-ratios model
Edit the codeml.ctl file so that model = 1
Create a directory (“model1” for example) to run analysis.
Copy the codeml.ctl file, the “infile.nuc” file (coding sequence alignment in PAML format) & the treefile “intree.trees” into this directory.
Run codeml as before, but in the model1 directory.

Results of the free-ratios model – the mlc file again!
free-ratios model assumes independent ratio on all lineages. Note: lineages where > 1.
lnL value for free-ratio model record this!
np = # of paramters

Likelihood Ratio Test (LRT) Comparing One-ratio Model to Free-Ratios Model
P value determined Twice the log-likelihood difference between the two models compared to a 2 distribution with d.f. = difference in # of parameters between one-ratio and free-ratios models.
2l = abs(2 X (-5712.56 - -5698.41)) = 28.3; df = (33 – 18) = 15
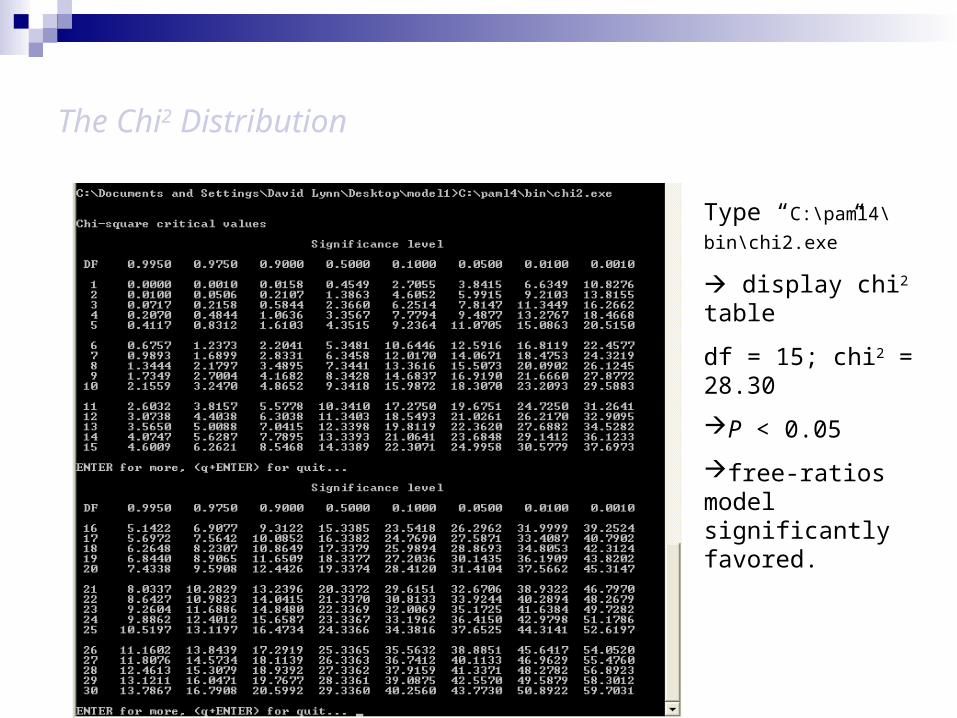
The Chi2 Distribution
Type “C:\paml4\bin\
chi2.exe”
display chi2 table
df = 15; chi2 = 28.30
P < 0.05
free-ratios model significantly favored.

Draw a Tree with branches labeled and values shown
Bottom of mlc file tree for use in Treeview.
Copy tree (i.e. the line with brackets) into new txt file.
Open with Treeview. Download from http://taxonomy.zoology.gla.ac.uk/rod/treeview.html

Running the “two”-ratios model
Note: It is statistically incorrect to use free-ratios model to develop hypotheses and then use two-ratios model to test it.
Edit the codeml.ctl file so that model = 2
Edit “intree.trees” to specify which branches to test.
Create a directory (“model2” for example) to run analysis. Copy the codeml.ctl file, the “infile.nuc” file (coding sequence alignment in PAML format) & the treefile “intree.trees” into this directory.
Run codeml as before, but in the model2 directory.

Two-ratios Model Results

Likelihood Ratio Test (LRT) Comparing One-ratio Model to Two-Ratios Model
P value determined Twice the log-likelihood difference between the two models compared to a 2 distribution with d.f. = difference in number of parameters between models.
2l = abs(2 X (-5712.56 - -5706.99)) = 11.14; df = 1
P < 0.001 two-ratios model is significantly favored.
dN/dS > 1 on lineages of interest (cow and pig) is supportive of PS on those lineages.
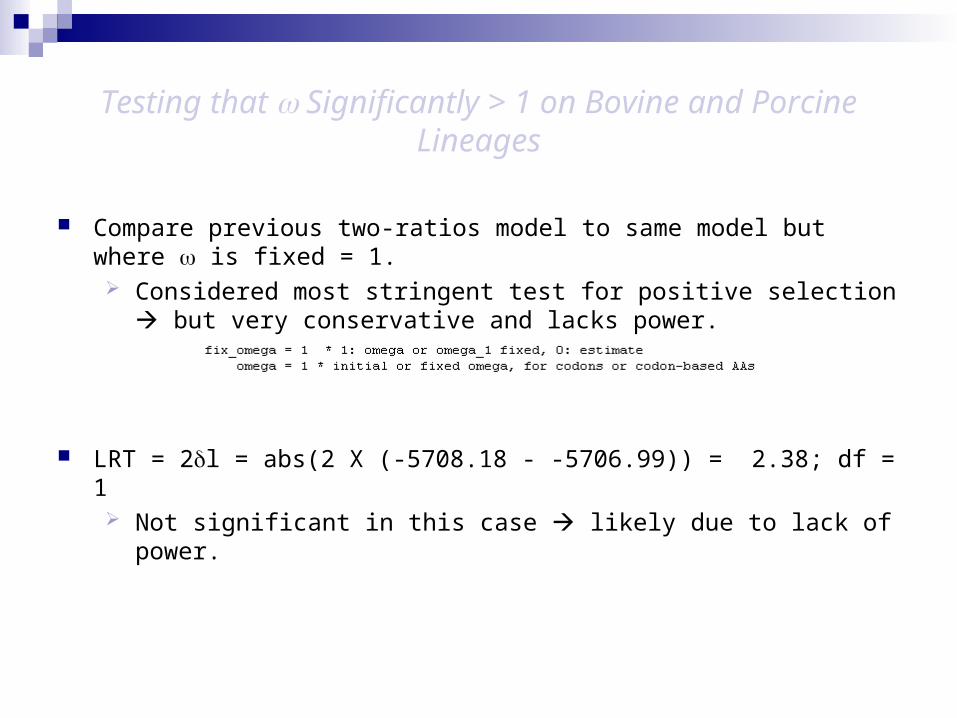
Testing that Significantly > 1 on Bovine and Porcine Lineages
Compare previous two-ratios model to same model but where is fixed = 1. Considered most stringent test for positive selection but very
conservative and lacks power.
LRT = 2l = abs(2 X (-5708.18 - -5706.99)) = 2.38; df = 1 Not significant in this case likely due to lack of power.

Testing for Evidence of Site-Specific Positive Selection.

Site Models to Detect Positive Selection at Particular Codon Sites
Branch models require > 1 over whole sequence conservative PS tends to act only on specific amino acids or domains.
Site models allow the ω ratio to vary among sites (among codons or amino acids in the protein) (Nielsen and Yang 1998; Yang et al. 2000).
Main recommended models LRT M1a Vs M2a LRT M7 (beta) and M8 (beta&ω).
http://www.molecularevolution.org

Identifying Which Sites are Subject to Positive Selection
Posterior Bayesian probabilities of site classes calculated for each amino acid site (Nielsen &Yang
1998).
Posterior Bayesian probabilities used to be calculated by naïve empirical Bayes (NEB) method. In small datasets or when sequences very similar estimates unreliable. PAML now implements improved Bayes Empirical Bayes (BEB) (Yang 2005) use this one! More sequences better accuracy & power.
If the ω-ratios for some site classes are >1 (from M2a or M8). sites with high posterior probabilities (>0.95) for those classes are likely to be under positive
selection.
http://www.molecularevolution.org

Testing for Evidence of Site-Specific Positive Selection on the Mammalian CD2 Gene.

Running the site-specific models M1a, M2a, M7 & M8
Edit the codeml.ctl file so that model = 0 & NSsites = 1 2 7 8
Create a directory (“sites” for example) to run analysis. Copy the codeml.ctl file, the “infile.nuc” file (coding sequence alignment in PAML format) & the treefile “intree.trees” into this directory.
Run codeml as before, but in the “sites” directory.

Results of the site-specific models – the mlc file again!
mlc file contains the lnL values from M1a, M2a, M7 and M8.
Construct LRTs of
M1a vs M2a (test of positive selection) LRT = 2l = abs(2 X (-5631.80 - -5615.92)) = 31.76; df = 2
M7 vs M8 (test of positive selection) LRT = 2l = abs(2 X (-5641.42 - -5616.05)) = 50.74; df = 2
Both models (M2a & M8) which have site classes with > 1 are significantly favored particular codon (amino acid) sites are subject to adaptive evolution.

Bayes Empirical Bayes (BEB) Posterior Bayesian Probabilities to Identify Particular Sites Subject to PS
Sites with high posterior probabilities of belonging to site classes with > 1 (M8 most stringent model).
E.g. Leucine at codon position 22 in alignment has high prob. of being subject to PS.
Note: Removal of gapped/missing data can cause position numbering to be different to what you think.
Note: The residue shown is for just one of the sequences in the alignment. CD2_baboon in this case. Which is the reference sequence can be found in rst file.

Structure for Human CD2 Extracellular Domain is Available – Plot Sites Subject to PS on Structure.
If a 3D structure is available for your protein of interest you can download a pdb structure file from the Protein Data Bank http://www.rcsb.org/pdb/home/home.do
E.g. 1HNF.pdb = pdb id for Human CD2 extracellular domain.
Download & install rasmol from http://www.openrasmol.org/ - Open 1HNF.pdb file in rasmol.

Using Rasmol
Choose display option e.g. spacefill Set all atoms to be same color

Color Sites Subject to PS in Red….
Open 1HNF.pdb file as text match up position numbering in mlc file to numbering of residues in .pdb file.
E.g. L22 baboon L22 human LEU7 pdb file.
mlc .pdb14 S NONE IN PDB FILE22 L LEU764 E LYS5167 E LYS5569 K LYS5789 Q GLN7895 S SER84123 S SER112149 K LYS139150 H HIS140153 L LEU143154 S SER144168 K LYS159174 G GLY165
Make background white
Select residues to be colored
Color selected atoms red

Export as image

Power & Accuracy of LRT
2 distribution does not apply when sample sizes are small.
2 makes LRT conservative (type I error rate < alpha).
Power is affected by (i) sequence length (ii) sequence divergence (low power for highly similar or highly divergent seqs) (iii) number of lineages, and (iv) strength of positive selection (Anisimova 2001).
The most efficient way to increase power is to add lineages Power low in datasets of 5/6 seqs but ~100% for 17 seqs.
High recombination rates can cause high false positive rates in LRT Empirical Bayes less affected (Anisimova 2003).

Branch-site models
Allow ω ratio vary both among sites and among lineages.
attempt to detect PS that affects only a few sites along a few lineages. Original branch-site model (Yang & Nielsen 2002) unrealistic & found to high
false positive rate (20%-70%) (Zhang 2004). New model now implemented that is more accurate (Zhang 2005).
Model A (Model =2; NSsites = 1) assumes variable selective pressure on sites on particular specified branches.
Compared to site model 1A (NSsites = 1) variable selective pressure on sites on all branches.
Comparison of Model A to Model A fixed = 1 most stringent branch-site test of PS.
Bayes Empirical Bayes (BEB) output for sites should be used.
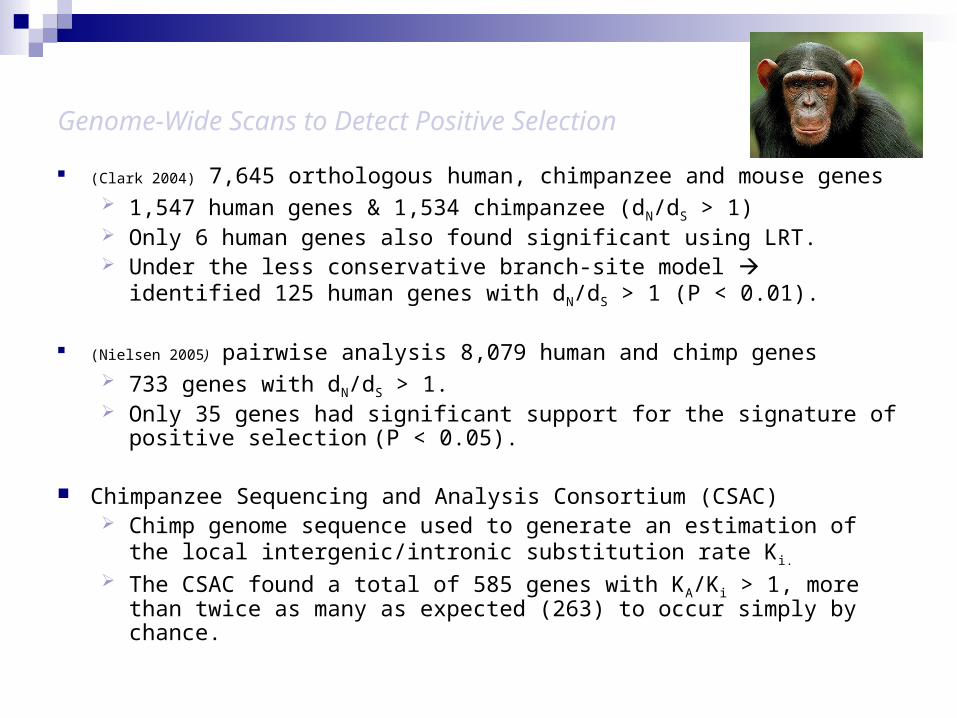
Genome-Wide Scans to Detect Positive Selection
(Clark 2004) 7,645 orthologous human, chimpanzee and mouse genes 1,547 human genes & 1,534 chimpanzee (dN/dS > 1) Only 6 human genes also found significant using LRT. Under the less conservative branch-site model identified 125 human
genes with dN/dS > 1 (P < 0.01).
(Nielsen 2005) pairwise analysis 8,079 human and chimp genes 733 genes with dN/dS > 1. Only 35 genes had significant support for the signature of positive
selection (P < 0.05).
Chimpanzee Sequencing and Analysis Consortium (CSAC) Chimp genome sequence used to generate an estimation of the local
intergenic/intronic substitution rate Ki.
The CSAC found a total of 585 genes with KA/Ki > 1, more than twice as many as expected (263) to occur simply by chance.
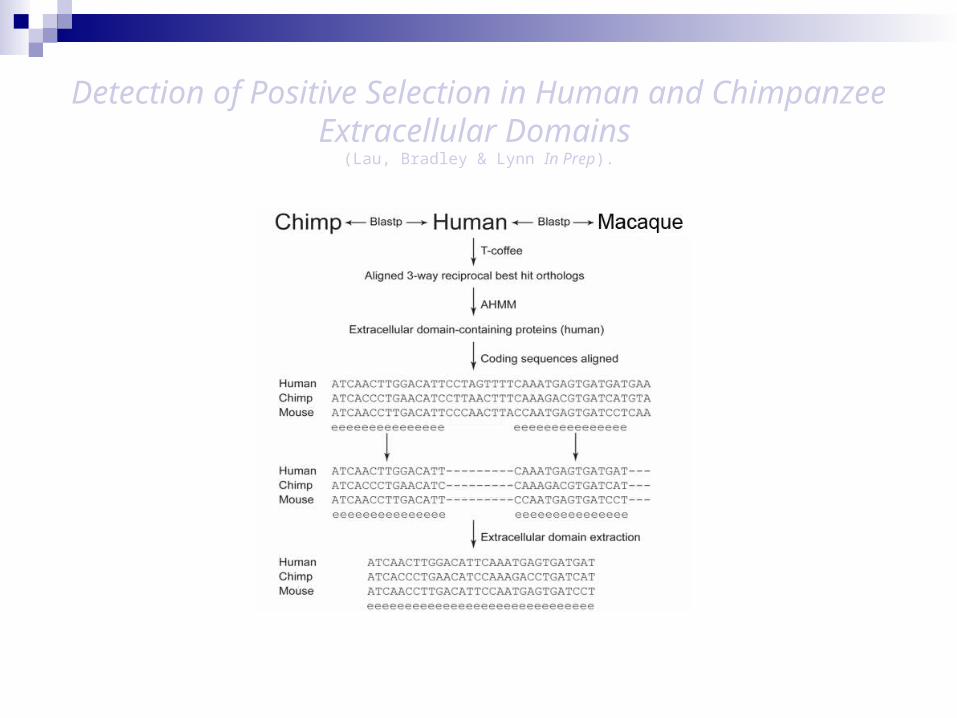
Detection of Positive Selection in Human and Chimpanzee Extracellular Domains
(Lau, Bradley & Lynn In Prep).

Positive Selection in Salmon Immune Genes (Cruz, Bradley, Lynn, Immunogenetics 2007).

Bovine immune genes subject to selection- candidates for disease resistance?

Background
Domestication severe selective pressures on cattle and other animals.
Epidemiology of infectious diseases changed.
Population densities / proximity of humans and animal.
Most significant selective effects in genomic variation can be found in those genes which influence disease susceptibility.
Potential to identify genes that are most important for disease susceptibility.

Candidate Genes Subject to Selection at the Population Level
Identify genes likely subject to positive selection during the evolution of a species lineage.
Hypothesis – good candidates for continued selection at the population level.
Chimp Genome Paper – Nature 2005. Neilsen et al., PLoS 2005. (Human – Chimp). Swanson et al., Genetics 2004 (Drosophila). Gilbert et al., Nat Rev Genetics 2005 “if a gene has experienced strong
positive selection during the evolutionary lineage leading to Homo sapiens, there is no reason to think that such selection should have stopped after the emergence of anatomically modern humans.”
Re-sequence candidates in bovine populations.

Human, mouse, cow, pig orthologs

Maximum Likelihood
Likelihood Ratio TestModel 0
One-ratio
one one value for entire value for entire treetree
Model 2
Bovine-specific
independent independent ratio on ratio on
bovine lineage.bovine lineage.

An inter-genomic comparison identifying bovine genes which have signatures of positive selection between species (Lynn et al, Genetics 2005)
~3,000 orthologs examined, 5 genes; CD2, IL2, IL13, TYROBP & ART4 significant evidence of adaptive evolution on the bovine lineage.
Interestingly, all of these genes have roles in immunity or disease resistance in humans and other mammals.
Several studies of human genes, which have signatures of adaptive evolution between species, found that many of these genes have also been subject to more recent population selection.

Identification of Population-Specific Selective Signatures and Functionally Relevant Polymorphism. (Freeman, Lynn et al., In Prep).
Approx. 2-3kb CD2, IL2, IL13, TYROBP, ART4 genomic sequence from 42 individuals from African, Asian & European breeds (17 diff. breeds).
Outgroups Gaur, Bison, Water Buffalo, Sheep and Goat also sequenced.
~1.2Mb of new sequence.
Population genetics tests for selection (Tajima’s D, Fu & Li, MK statistics) indicate selection in all genes in at least one of the populations.

CD2 in Bovine Populations
Non-synonymous changes within cattle populations were distributed non-randomly on the extracellular domain of the molecule (p<0.05), suggesting accelerated protein evolution in this region.

Signatures of Positive Selection in IL2 (Europe) and IL13 (Africa).

Balancing Selection in B.indicus ART4
Human ART4 erythrocyte glycoprotein identified as the Dombrock blood group (polymorphic).
Cattle Popns: 4/5 nsSNPs and all sSNPs occur in B.indicus sample.
B.indicus – 30 unique SNPs, only 1 or 2 SNPs in each of the other popns. diversity indicative of balancing selection.
Polymorphic at the position associated with the Joa antigen in humans.
SNPs predicted to functionally alter protein structure are found in B.indicus popn.
Relevance of these changes to susceptibility to particular blood-bourne pathogens?

Bovine HapMap Project
33K SNPs
19 animals : 12 EU, 1AF, 2IN, 4HYB
2 outgroups
501 animals 24 per breeds Holstein 53 Limousine 42 Red Angus 12 Outgroups 4

Bovine FST
FST : Measure of genetic population differentiation - local adaptation
FST = 1 -> completely different
FST = 0 -> genetically identical
Pairwise FST calculated for each of 19 breeds using HapMap allele frequency data (unbiased FST method Weir 1996).
Breed-specific FST calculated and browser developed to view FST distributions for each breed on each chromosome.

Locus Specific Branch Length
3 major bovine groups : European (B. taurus) African (B.taurus) Indian (B.indicus)
LSBL calculation based on pairwise FST values
Genetic distance calculated for each group

Acknowledgements
HapMap Dan Bradley Lilian Lau Bovine HapMap Consortium
Selection in Bovine Immune Genes Dan Bradley Ruth Freeman Caitriona Murray
Selection in Human Ec Domains Dan Bradley Lilian Lau
Selection in Salmon Immune Genes Dan Bradley Fernando Cruz
Selection in AMPs Cliona O’Farrelly Andrew Lloyd Rowan Higgs Mario Fares
SFU Fiona Brinkman
Ziheng Yang for PAML!