Embed Size (px)
Citation preview

MOVING THINKINGFORWARD
Transportation Education Series:Travel Demand Modeling
David ReinkeNovember 2012
MOVING THINKINGFORWARD
Presentation overview
• What are travel demand models?• Why use them?• How do they work?• What goes into building them?• What are their limitations?• Some further issues• Questions/discussion
MOVING THINKINGFORWARD
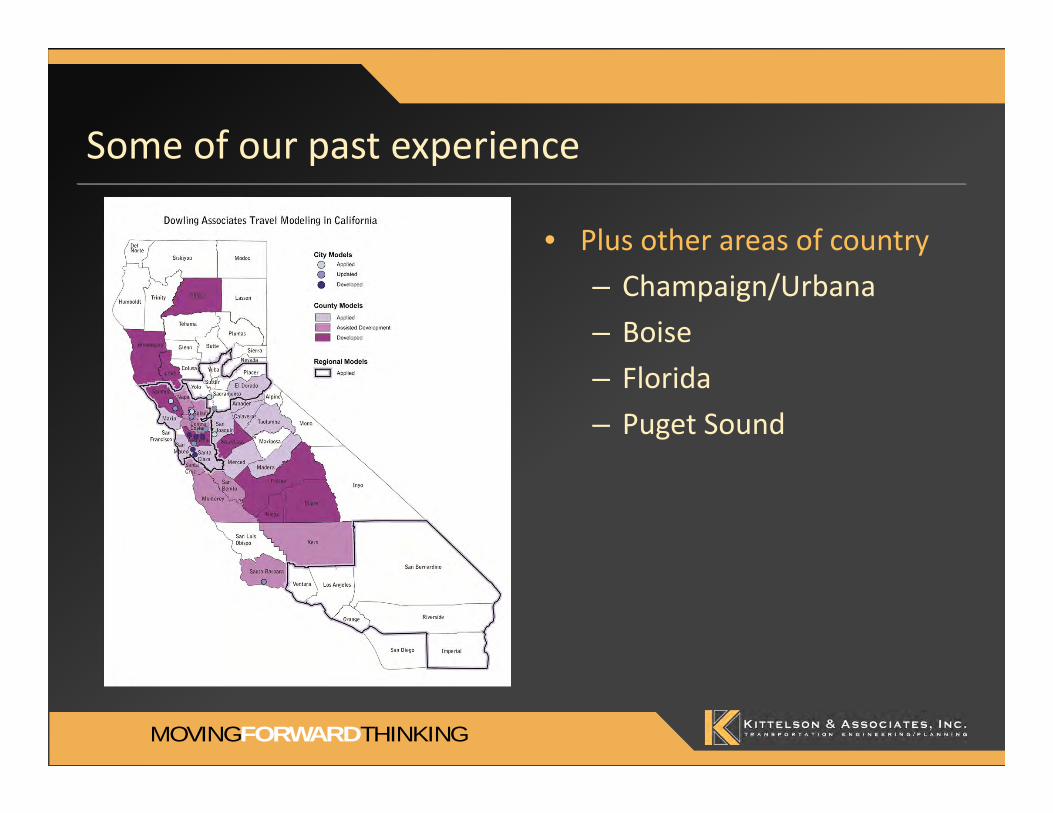
• Plus other areas of country– Champaign/Urbana– Boise– Florida– Puget Sound
Some of our past experience

MOVING THINKINGFORWARD
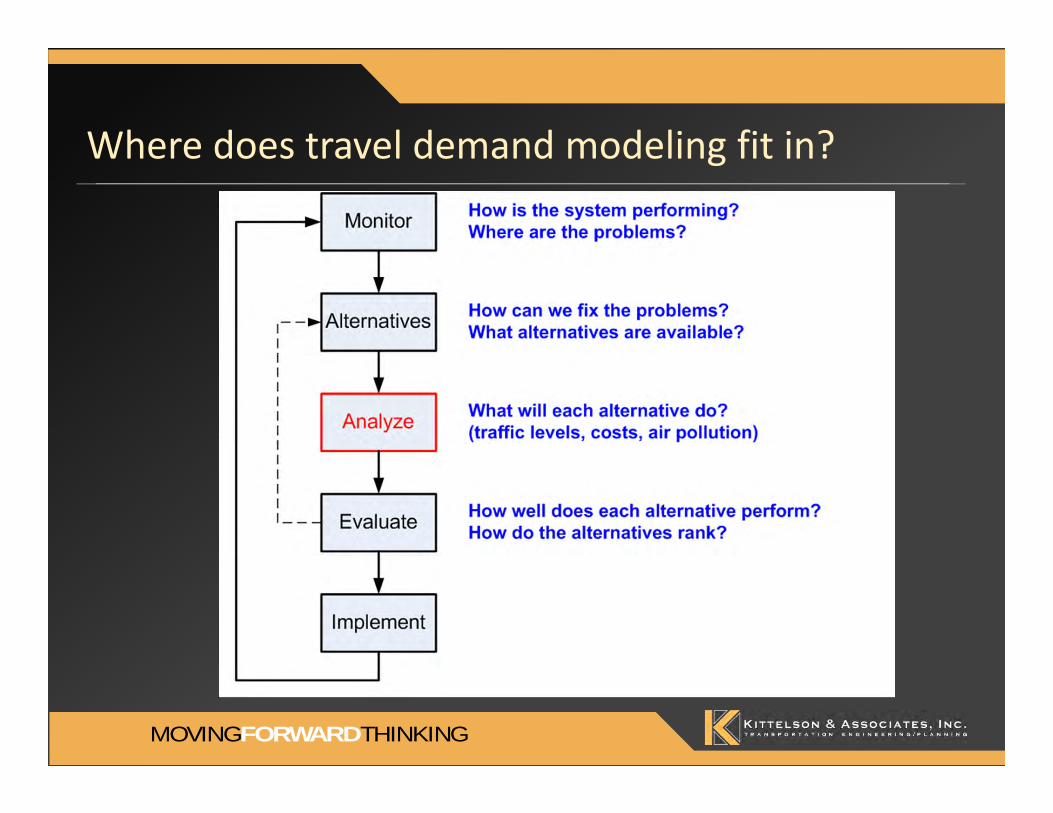
Where does travel demand modeling fit in?
MOVING THINKINGFORWARD
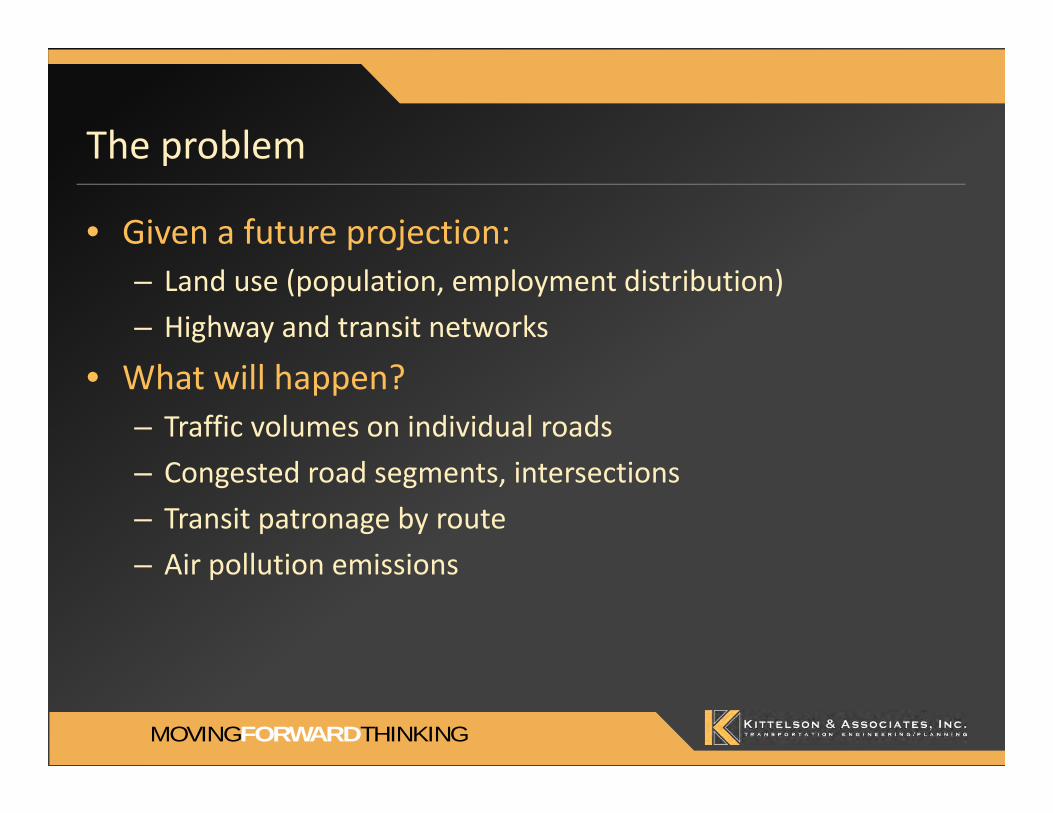
The problem
• Given a future projection:– Land use (population, employment distribution)– Highway and transit networks
• What will happen?– Traffic volumes on individual roads– Congested road segments, intersections– Transit patronage by route– Air pollution emissions

MOVING THINKINGFORWARD
Planning issues• New highway
investment• Where to locate
new highways
History: Ancient times (postwar pre‐1950)
Studies• Local, regional
studies
Travel forecasts• Trend projection
on individual roadways

MOVING THINKINGFORWARD
Planning issues• Regional growth• New highway
investment
History: 1950s – early 1960s
Studies• Large‐scale
regional studies (Chicago, Detroit)
Travel forecasts• Development of
4‐step modeling process

MOVING THINKINGFORWARD
Planning issues• Regional growth• New highway
investment• Environmental
Protection Act (1969)
• Air quality stds• New transit
starts
History: Late 1960s – 1980s
Studies• Regional
transportation plans
• Air quality inventories
• Transit alternatives analyses
Travel forecasts• Refinement of 4‐
step modeling process (UTPS, Tranplan, MINUTP)
• Introduction of disaggregate models into process

MOVING THINKINGFORWARD
Planning issues• Air quality stds.• Maintaining
existing system• Transit starts• Congestion
management, traffic mitigation at local level
History: 1990s ‐ now
Studies• Regional
transportation plans
• Air quality inventories
• New transit starts
• Local general plans
• Traffic impact
Travel forecasts• Continued
refinement of 4‐step modeling process
• Increasing development of local models
• Land use models• Activity‐based
models

MOVING THINKINGFORWARD
Types of transportation models
• Planning – Provide information on transportation activity– “Travel demand model”– “Traffic forecast model”– Software: Cube, TransCAD, EMME, Visum
• Operations– Provide information on operation of transportation system– Static capacity analysis – Simulation of vehicles or groups of vehicles– Software: Synchro, VISSIM, Paramics, Transmodeler

MOVING THINKINGFORWARD
Integrated modeling
• Level of modeling appropriate for analysis required• Macroscopic
– Evaluate large groupings of people/vehicles– All activity occurs during a single time period (day, peak hour)– Can cover large geographic area– Example: Most travel demand forecast models
• Mesoscopic– Evaluate smaller groups, time slices– Useful when conditions change during time period– Example: Freeway operations analysis for 4‐hr peak
• Microscopic or Microsimulation– Evaluate individual people/vehicles– Useful when individual behavior affects system– Example: Difficult freeway ramp weaving section

MOVING THINKINGFORWARD
What is a Travel Demand Forecast Model?
A systematic process for translatingdemand
(people moving from one land use to another to do activities)
andsupply
(available transportation systems)into projections of future travel demand

MOVING THINKINGFORWARD
What is a model?
• A “bookkeeping” device• Incorporates current knowledge of travel behavior• Projects travel behavior into the future using
– Supply‐demand relationships derived from knowledge of travel behavior
– Future land use and transportation system configurations
• Examples of “models”– Past experience– Trend projection– Computer simulation

MOVING THINKINGFORWARD
“Travel” “Demand” “Forecast”
• Travel– We have often called them “traffic models”– Now need to account for other modes such as walking, bicycling
• Demand– Models estimate how many people want to make the trips– Not necessarily how many can make the trips when they want to
• Forecast– Models do not replicate every nuance of existing travel– Most important is reasonable response to future changes

MOVING THINKINGFORWARD
How do we set up a travel model?
• Divide the region into smaller subareas (TAZs)• Build a model of highway and transit networks (supply)
• Develop demand models using available data– Household travel surveys– Borrow models from other regions – NCHRP 365

MOVING THINKINGFORWARD
A Presentable Version of the Madera Model
MOVING THINKINGFORWARD
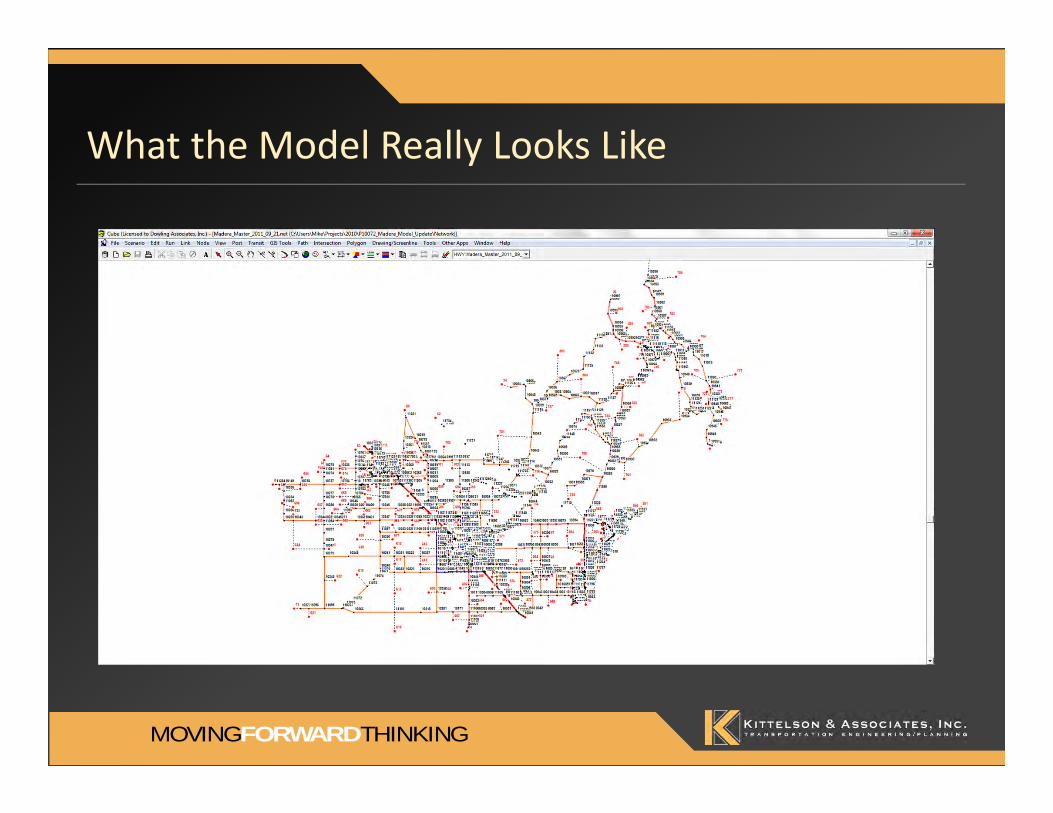
What the Model Really Looks Like

MOVING THINKINGFORWARD
Madera Model with “Zones” (Land Use Groupings)

MOVING THINKINGFORWARD
Transportation Analysis Zones (TAZs)
All land uses in TAZ (grey boundary) represented by a single point (red
dot)
MOVING THINKINGFORWARD
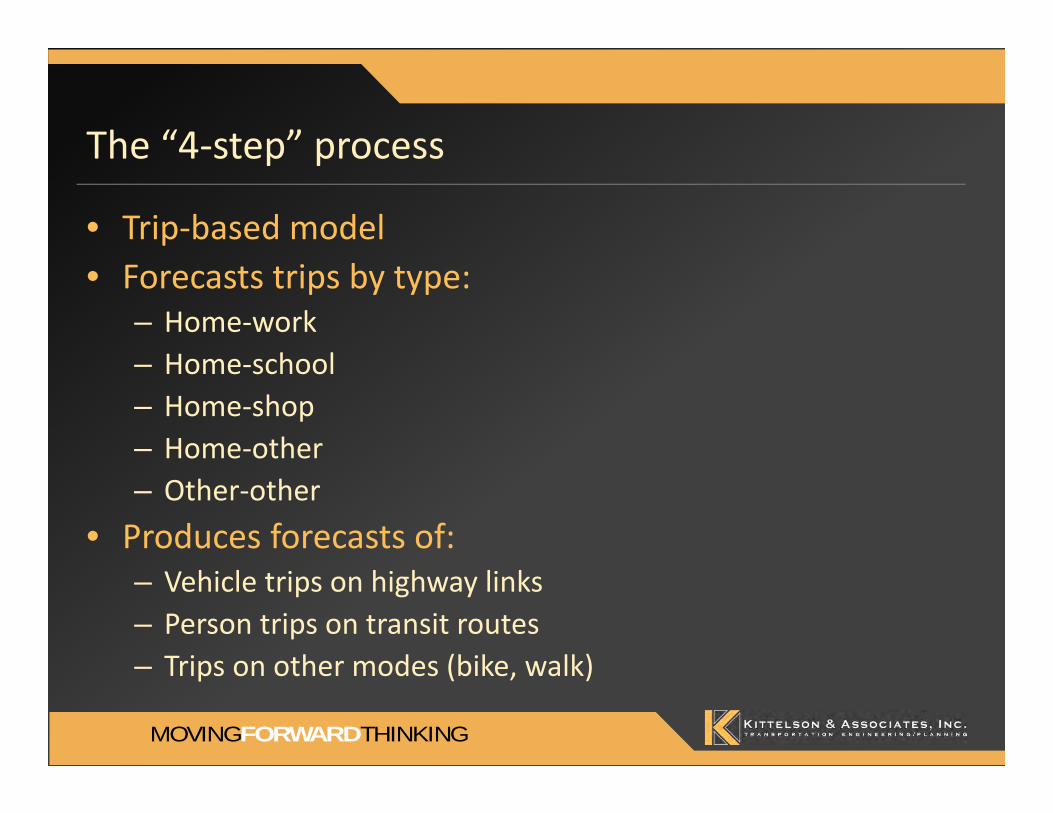
The “4‐step” process
• Trip‐based model• Forecasts trips by type:
– Home‐work– Home‐school– Home‐shop– Home‐other– Other‐other
• Produces forecasts of:– Vehicle trips on highway links– Person trips on transit routes– Trips on other modes (bike, walk)
MOVING THINKINGFORWARD
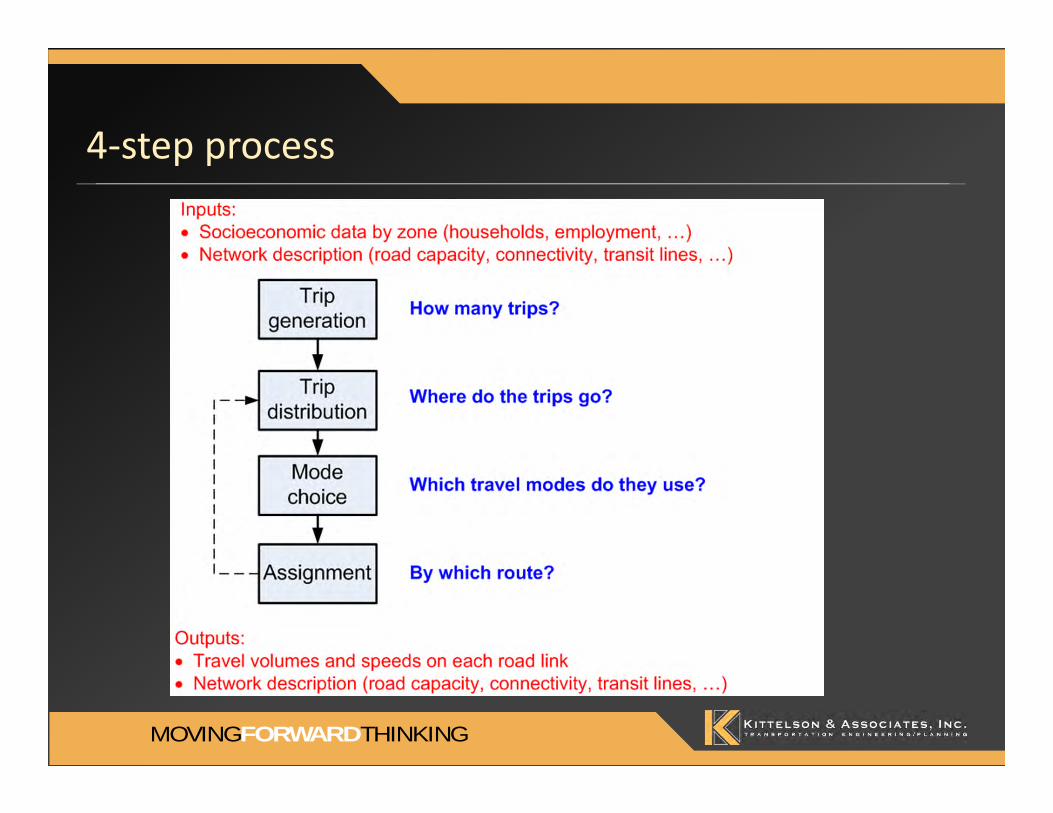
4‐step process

MOVING THINKINGFORWARD
4‐step process

MOVING THINKINGFORWARD
Trip generation
• Trip production model approaches– Trip rates: fixed rate per household type
• HH size• Number of workers• Number of autos
– Regression models based on TAZ population, income, etc.
• Trip attraction models– Trips attracted to TAZ based on employment

MOVING THINKINGFORWARD
Types of trips: depends on region, locality
• Home – work• Home – school
– K‐12– University
• Home – shop• Home – social & recreational• Home – other• Other – other (“non‐home based”)

MOVING THINKINGFORWARD
Trip generation
• Different trip types– Home‐work– Home‐school– Home‐shop– Home‐other– Other‐other
• Why?– Different trip rates by type for different HH types– Different trip length, mode choice characteristics

MOVING THINKINGFORWARD
Trip distribution
• How many trips between zone i and j• Function of
– # trips produced at production zone– # trips attracted at attraction zone– Impedance between zones
• Approaches– Gravity model– Destination choice model

MOVING THINKINGFORWARD
Trip distribution – gravity model

MOVING THINKINGFORWARD
Friction factors

MOVING THINKINGFORWARD
Trip distribution – destination choice model

MOVING THINKINGFORWARD
Mode choice
• Which travel mode will be used?– Auto (drive alone, shared ride)– Transit (bus, rail)– Non‐motorized (bike, walk)
• Modern approach: probability choice model

MOVING THINKINGFORWARD
Mode choice
• Not always included in travel models• Some rural areas, cities do not have mode choice component

MOVING THINKINGFORWARD
The “fifth step” of the four‐step process
1 n 1 n1 1
n n
1 n 1 n1 1
n n
Other‐other Off peakAttraction zone Dest zone
Prod
zone
Orig
zone
Prod
zone
Orig
zone
P/A tables by purpose O/D tables by time period
Home‐work AM peakAttraction zone Dest zone
MOVING THINKINGFORWARD
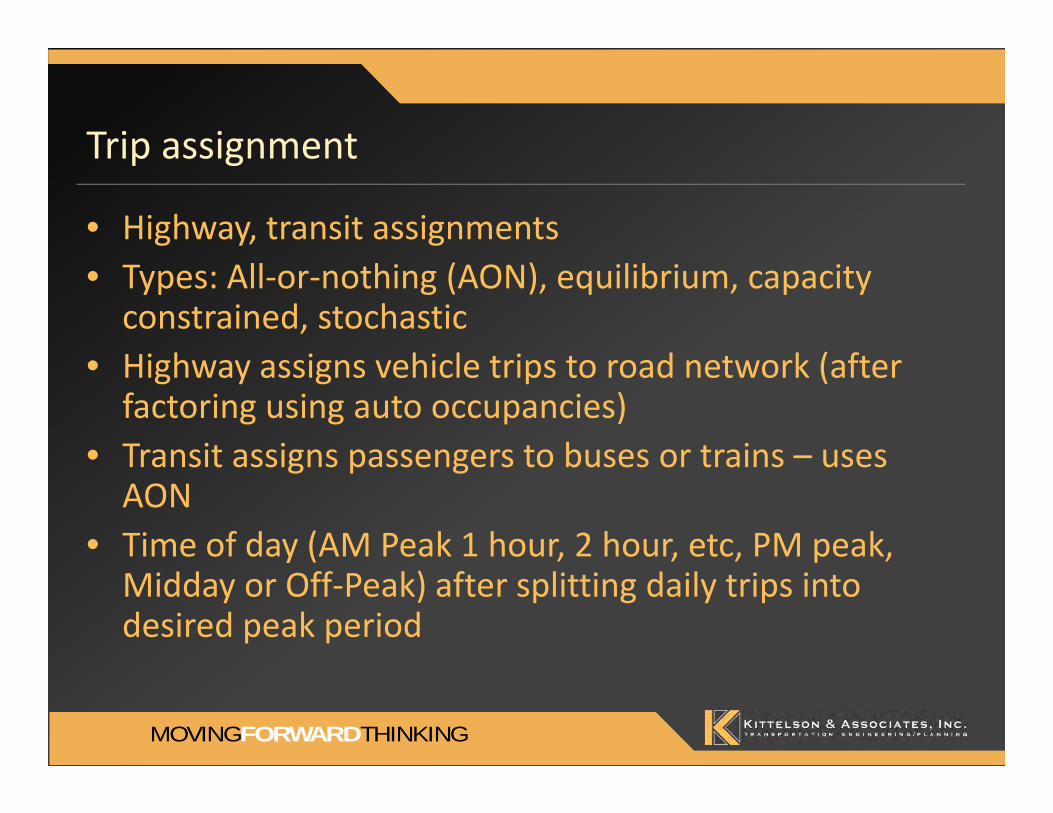
Trip assignment
• Highway, transit assignments• Types: All‐or‐nothing (AON), equilibrium, capacity constrained, stochastic
• Highway assigns vehicle trips to road network (after factoring using auto occupancies)
• Transit assigns passengers to buses or trains – uses AON
• Time of day (AM Peak 1 hour, 2 hour, etc, PM peak, Midday or Off‐Peak) after splitting daily trips into desired peak period

MOVING THINKINGFORWARD
Trip assignment
• Route chosen based on shortest time/distance path, capacity constrained or equilibrium
• Factors affecting choice include road speed, length, capacity, level of congestion
• Uses speed‐flow relationship (curve) to do this (also called volume/delay function)

MOVING THINKINGFORWARD
Volume‐delay function on a link: BPR curve
MOVING THINKINGFORWARD
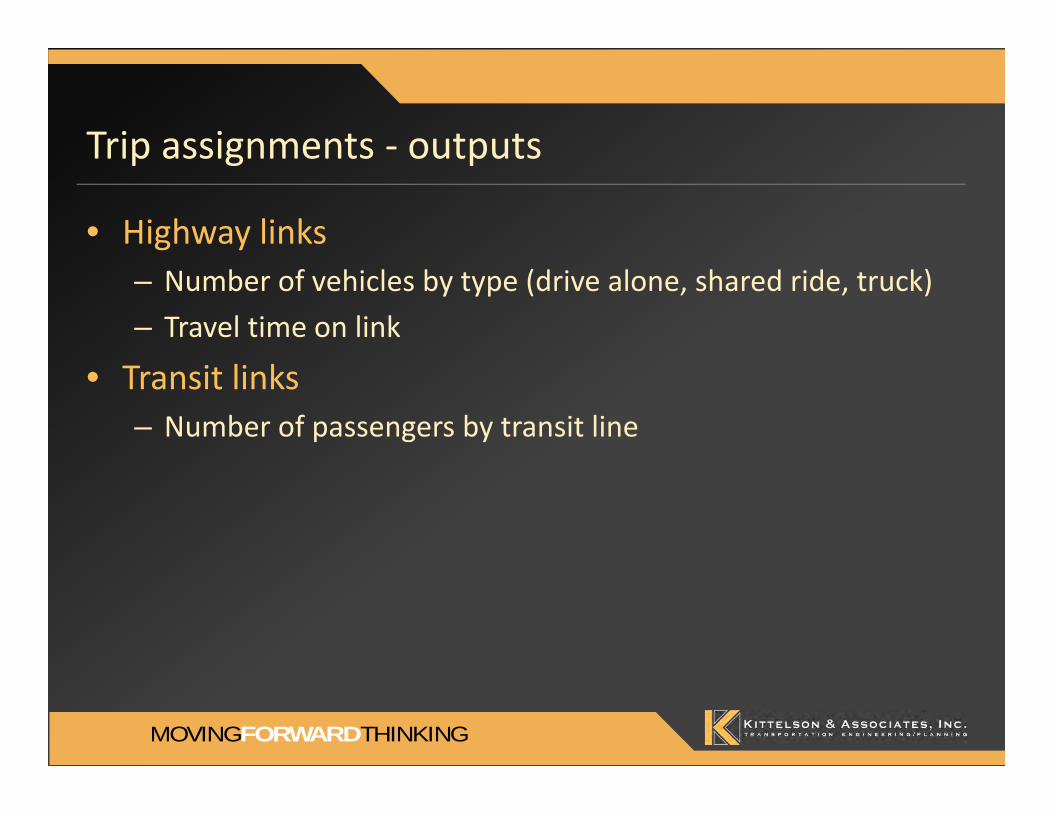
Trip assignments ‐ outputs
• Highway links– Number of vehicles by type (drive alone, shared ride, truck)– Travel time on link
• Transit links– Number of passengers by transit line

MOVING THINKINGFORWARD
Assignment output (example)

MOVING THINKINGFORWARD
The Real Process
• Define Model Area – What happens at gateways?• Code Transportation Networks• Define Zone System – Aggregate land uses• Inventory Land Uses• Calibration – Formulas based on survey data• Validation – Compare model results to counts• Forecast Inputs – Land uses, networks• Policy Framework – Which assumptions should remain
constant?• Adjust Model Results
TRIP GENERATION
TRIP DISTRIBUTION
MODE CHOICE
TRIP ASSIGNMENT
SHORTEST PATHS
Person Trips by Zone
LAND USE DATAHousing
Employment
NETWORKINPUTS
Trip Generation
Rates
Distribution Factors
Estimated Travel Times
Zone-to-Zone Person Trips
Mode Choice Coefficients/Constants
Zone-to-Zone Trips by Mode
Auto Occupancy
Factors
Speed-Congestion
Curves
Daily Traffic
RESULTS Volumes Speeds
LOS
Daily Air
Daily Rail
INPUTS
FACTORS
Daily Bus
Hardest Step
Rarely Considered

MOVING THINKINGFORWARD
More recent approach:
Activity‐based models
MOVING THINKINGFORWARD
Activity‐based models
• Sometimes called “microsimulation demand” or “tour‐based” models
• Travel is a “derived” demand– Demand for travel arises from demand for other activities (work, shopping, social, etc.)
• Captures idea of “trip chaining”: models all legs of a tour

MOVING THINKINGFORWARD
Tours vs trips
Home
Work
Drop off child at school
Pick up child at school
Grocery shopping
Eat lunch
Home based work tour
Work based subtour

MOVING THINKINGFORWARD
Differences from traditional 4‐step models
• Model works on a set of individuals rather than population aggregates
• Models tours first, individual trips second• Outputs consist of set of trip patterns for a sample of individuals

MOVING THINKINGFORWARD
Activity model steps
1. Generate a synthetic population2. Apply travel models to each person in population to
generate a set of tours3. Aggregate tours into trip tables by time of day and
mode4. Assign trip tables to highway and transit networks
MOVING THINKINGFORWARD
Types of tours
• Home‐based– Mandatory (work, school)– Maintenance (personal business, medical, shopping)– Discretionary (social, recreational)
• Subtours– Work based (e.g., visit a client, return to work)– School based (e.g., go to job, return to school)

MOVING THINKINGFORWARD
Advantages of activity based models
• Estimated on disaggregate data• Therefore, more accurate representation of travel behavior
• Captures interdependency between trips on a tour• Ability to disaggregate outputs by population groups
– Income– Ethnicity– Other special populations: seniors, handicapped, etc.

MOVING THINKINGFORWARD
Concerns with activity‐based models
• Very data intensive• Some needed data sources may not be around in the future: Census long form, PUMS/ACS data
• Very complex, usually with hundreds of parameters• Danger of overfitting, poor predictive capability• How much better do they actually perform?
– Hint: nobody really knows yet!

MOVING THINKINGFORWARD
The bottom line:
What is all this effort in aid of?
MOVING THINKINGFORWARD
Uses of travel models
• Fulfill Requirements– Air quality conformity– Transit project funding applications– State highway project requirements– Now, Sustainable Community Strategies, etc…
• Long Range Transportation Planning– Regional transportation plans– Design of new roads– Passengers on new transit services– Evaluate land use alternatives

MOVING THINKINGFORWARD
Why Make it Complicated?
• Can’t we just count cars?– Okay for existing or short‐term only
• How about growth trends?– No relation to future land uses
• Count cars and add known development on top?– Okay for specific development studies (EIS)– Can’t easily account for interactions between future land uses (new housing + new jobs)
MOVING THINKINGFORWARD
Travel Model Capabilities
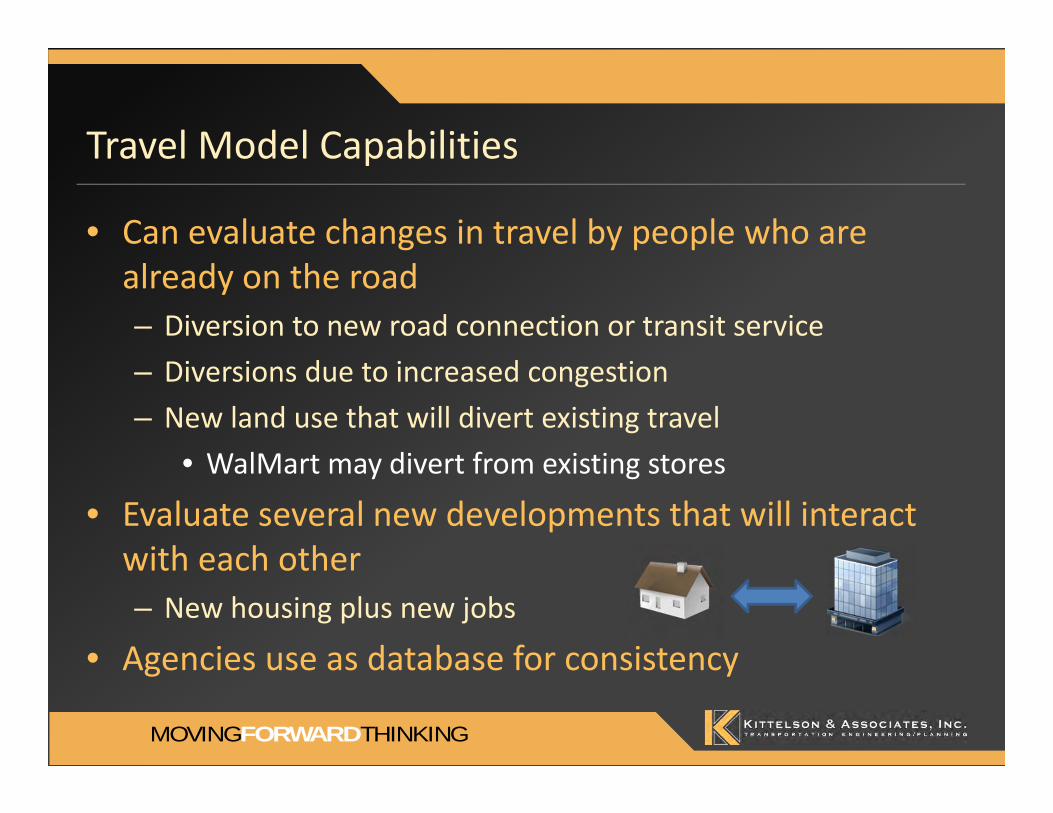
• Can evaluate changes in travel by people who are already on the road– Diversion to new road connection or transit service– Diversions due to increased congestion– New land use that will divert existing travel
• WalMart may divert from existing stores
• Evaluate several new developments that will interact with each other– New housing plus new jobs
• Agencies use as database for consistency

MOVING THINKINGFORWARD
Limitations of Travel Models
MOVING THINKINGFORWARD
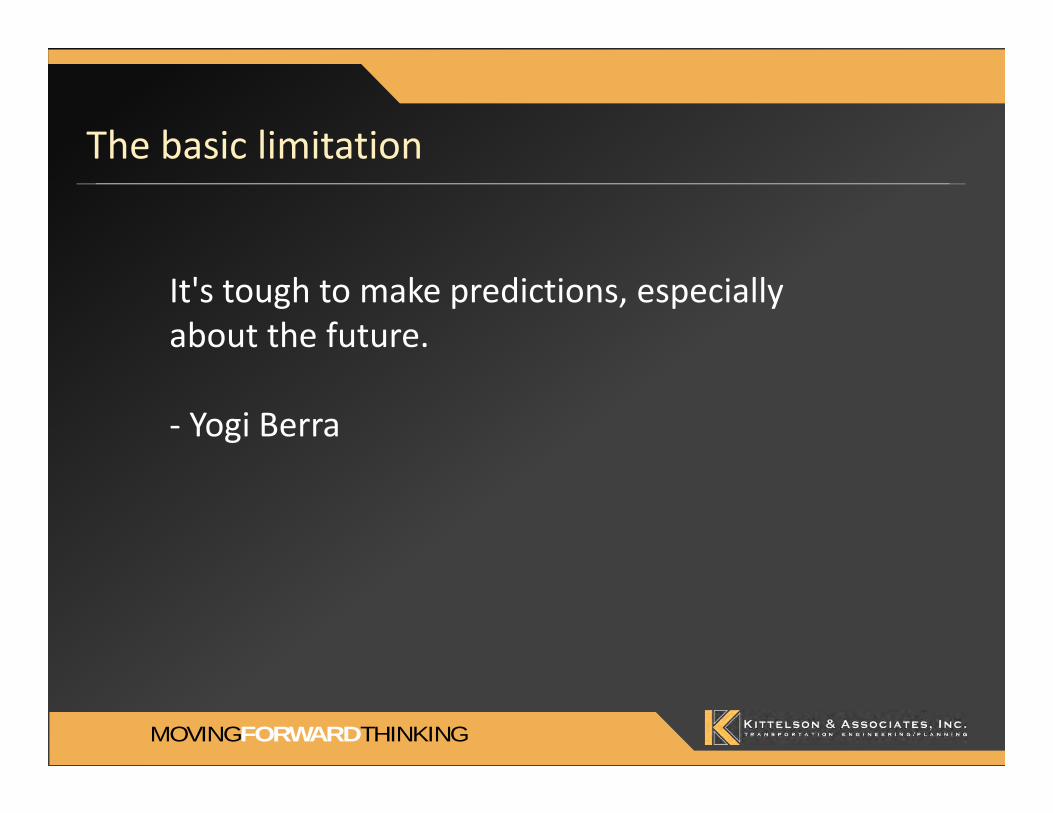
The basic limitation
It's tough to make predictions, especially about the future.
‐ Yogi Berra

MOVING THINKINGFORWARD
Travel Model Limitations
• Assume that past relationships will hold in future• We still don’t understand human behavior• Grouping of people and land uses• Travel models do not predict land use• Sensitivity to non‐auto travel• Sensitivity to urban form• Difficult to get real world data
MOVING THINKINGFORWARD
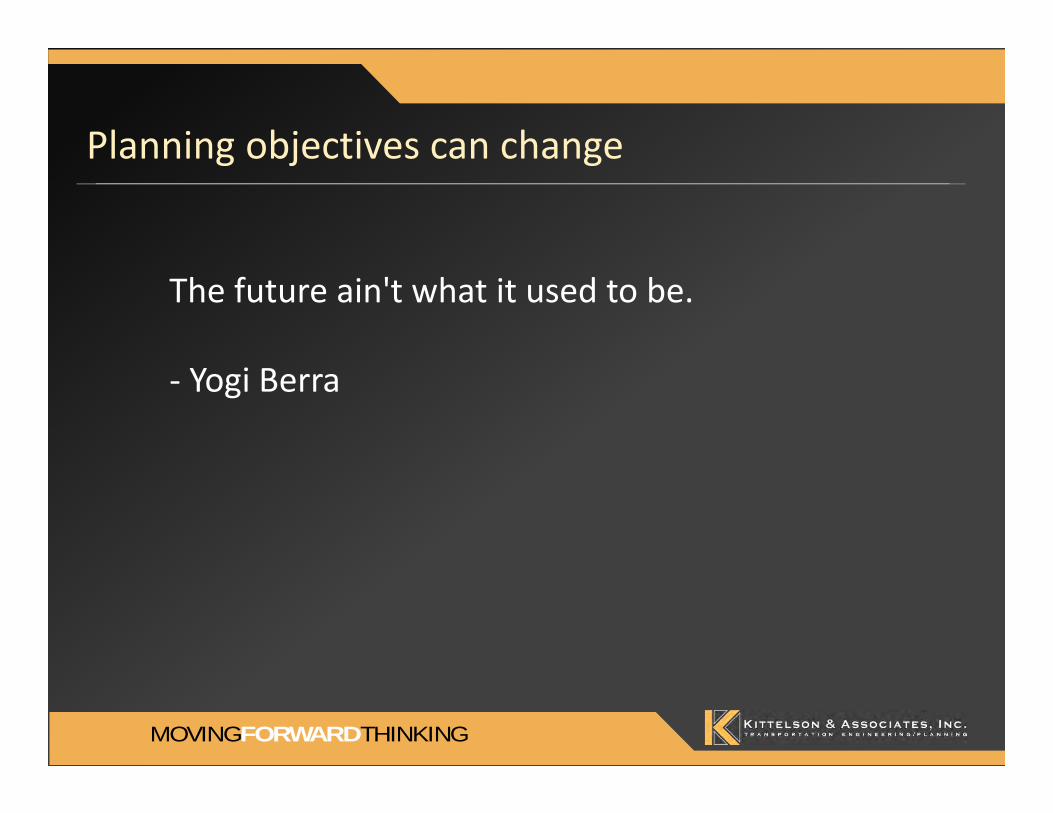
Planning objectives can change
The future ain't what it used to be.
‐ Yogi Berra
MOVING THINKINGFORWARD
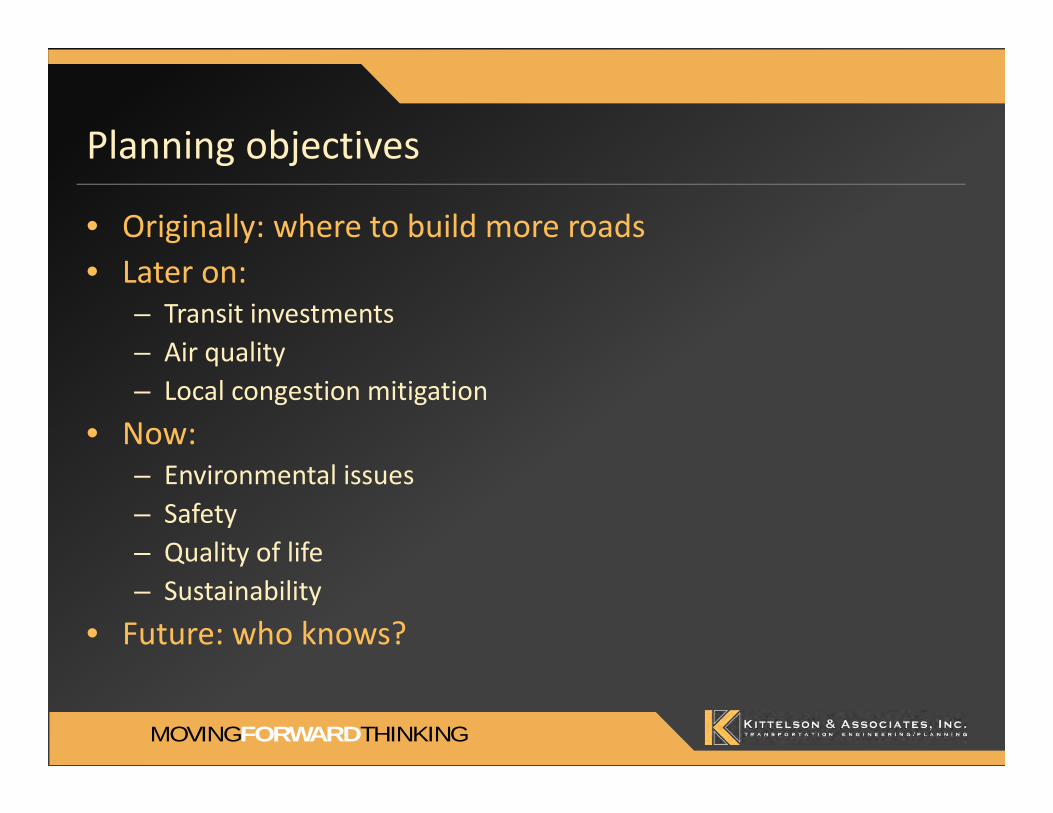
Planning objectives
• Originally: where to build more roads• Later on:
– Transit investments– Air quality– Local congestion mitigation
• Now:– Environmental issues – Safety– Quality of life– Sustainability
• Future: who knows?

MOVING THINKINGFORWARD
Putting it all together:
Evaluation
MOVING THINKINGFORWARD
Where does travel demand modeling fit in?

MOVING THINKINGFORWARD
Evaluation: the forgotten step
• Often spend too much time in forecasting, not enough time in evaluation
• Need to go into process with clear purpose:– Goals– Objectives– Performance measures (these set information requirements from travel forecasting process)

MOVING THINKINGFORWARD
Evaluation
• Need to have clear idea on how to make tradeoffs– Capacity expansion vs. environmental goals– Reduce delay vs. improving reliability– Distributional effects (who gains, who pays)
• Benefit‐cost analysis– Uses market values to help make tradeoffs– Increasing use by MPOs (MTC, PSRC)– Called for in MAP‐21– David Quarmby: If you don’t put values on things, someone else will do it for you

MOVING THINKINGFORWARD
Our basis for understanding travel behavior:
Household travel surveys

MOVING THINKINGFORWARD
Household travel surveys
• Provide basic information for travel modeling• Household characteristics• Persons in household• Trips made by each person• Vehicles in household

MOVING THINKINGFORWARD
Household travel survey steps
• Questionnaire• Sample definition• Pilot survey• Refine questionnaire, sampling method• Conduct interviews• Process data: clean, edit, code• Build database for further use

MOVING THINKINGFORWARD
Sample development
• Typically: random sample of phone numbers• May have different sample size for different sub‐regions
• Special sampling to adequately represent some groups– Elderly– Minorities

MOVING THINKINGFORWARD
Initial interview
• Contact household• Secure agreement to participate• Collect information on household & persons
– # persons– # vehicles– Age, sex, relation, occupation of each person in HH– Information on each vehicle: make, model, year, fuel type, fuel efficiency
• Set travel day(s)• Send diaries to household

MOVING THINKINGFORWARD
Follow‐up interview(s)
• Collect trip information– Formerly: limit to persons over 5 yrs old– Now: all persons in household
• Go through diary:– Origin, destination type (home, work, shop, etc.)– Origin, destination location– Begin, end trip time– Travel mode (# persons in vehicle if rideshare)– Amount paid (transit fare, toll, parking)

MOVING THINKINGFORWARD
Data processing
• CATI almost universally used, so no need to code• Still need to check data for consistency• Setting up database with appropriate structure
– Household file– Person file– Trip file– Vehicle file– Location file (Caltrans)– Codebook

MOVING THINKINGFORWARD
Household survey travel “gotchas”
• “Foreign” area codes• Wireless households• Response rate, nonresponse bias• Underreporting of trips
– Intermediate stops (e.g., between home and work)– Nonwork trips– Bike, walk trips– Short trips

MOVING THINKINGFORWARD
Some personal reflections
• We’ll never be able to model travel behavior completely
• Accept limitations of models and supplement with other actions– Past experience (post‐project evaluation)– Negative feedback: monitoring
• Yogi Berra: You can observe a lot just by watching