Embed Size (px)
Citation preview

September 2013
DB2 BLU Compression Estimation Tool
George Baklarz, IM Technical Sales Information Management IBM Software Group

1
Notices
This information was developed for products and services offered in the U.S.A.
IBM may not offer the products, services, or features discussed in this document in other countries. Consult your local IBM representative for information on the products and services currently available in your area. Any reference to an IBM product, program, or service is not intended to state or imply that only that IBM product, program, or service may be used. Any functionally equivalent product, program, or service that does not infringe any IBM intellectual property right may be used instead. However, it is the user's responsibility to evaluate and verify the operation of any non-IBM product, program, or service.
IBM may have patents or pending patent applications covering subject matter described in this document. The furnishing of this document does not give you any license to these patents. You can send license inquiries, in writing, to:
IBM Director of Licensing, IBM Corporation, North Castle Drive Armonk, NY 10504-1785 U.S.A.
The following paragraph does not apply to the United Kingdom or any other country where such provisions are inconsistent with local law: INTERNATIONAL BUSINESS MACHINES CORPORATION PROVIDES THIS PUBLICATION "AS IS" WITHOUT WARRANTY OF ANY KIND, EITHER EXPRESS OR IMPLIED, INCLUDING, BUT NOT LIMITED TO, THE IMPLIED WARRANTIES OF NON-INFRINGEMENT,
MERCHANTABILITY OR FITNESS FOR A PARTICULAR PURPOSE. Some states do not allow disclaimer of express or implied warranties in certain transactions; therefore, this statement may not apply to you.
This information could include technical inaccuracies or typographical errors. Changes are periodically made to the information herein; these changes will be incorporated in new editions of the publication. IBM may make improvements and/or changes in the product(s) and/or the program(s) described in this publication at any time without notice.
Any references in this information to non-IBM Web sites are provided for convenience only and do not in any manner serve as an endorsement of those Web sites. The materials at those Web sites are not part of the materials for this IBM product and use of those Web sites is at your own risk.
IBM may use or distribute any of the information you supply in any way it believes appropriate without incurring any obligation to you.
Information concerning non-IBM products was obtained from the suppliers of those products, their published announcements or other publicly available sources. IBM has not tested those products and cannot confirm the accuracy of performance, compatibility or any other claims related to non-IBM products. Questions on the capabilities of non-IBM products should be addressed to the suppliers of those products.
This information contains examples of data and reports used in daily business operations. To illustrate them as completely as possible, the examples include the names of individuals, companies, brands, and products. All of these names are fictitious and any similarity to the names and addresses used by an actual business enterprise is entirely coincidental.
COPYRIGHT LICENSE:
This information contains sample application programs in source language, which illustrates programming techniques on various operating platforms. You may copy, modify, and distribute these sample programs in any form without payment to IBM, for the purposes of developing, using, marketing or distributing application programs conforming to the application programming interface for the operating platform for which the sample programs are written. These examples have not been thoroughly tested under all conditions. IBM, therefore, cannot guarantee or imply reliability, serviceability, or function of these programs. You may copy, modify, and distribute these sample programs in any form without payment to IBM for the purposes of developing, using, marketing, or distributing application programs conforming to IBM's application programming interfaces.

2
Introduction As the amount of data being managed continues to rise, the cost of storage is becoming an increasing burden to CIOs and IT executives. Although the cost of disk drives as measured in dollars per gigabyte of storage continues to decline, the overall IT expense on storage infrastructure continues to climb. This is as a result of the explosive growth in storage requirements of both structured and unstructured data that needs to be managed. Looking at the cost of database storage along with the cost of backup media and disaster recovery storage, a significant amount of money can be saved if the database were to consume substantially less space. DB2 brings to the table significant advancements in compression technology. These features allow databases to be compressed anywhere from 50% to 90%, thus reducing storage costs and improving performance in many cases. In addition, backup images are now half the size and therefore backup/restore operations now finish in almost half the time and consume half the space. Multiply that by the number of backup images you keep and the savings grow even larger. In addition, disaster recovery sites now require almost half the amount of storage as well. Looking at the cost of enclosures, controllers, power, cooling, floor space, etc., you can quickly see that DB2 Compression can save a significant amount of money for the enterprise.
Static (Row) compression
The first type of DB2 compression is referred to as Static (or Classic) row compression. DB2 row compression uses a dictionary based Lempel-Ziv algorithm to compress data. Repeating patterns within a table are extracted from the rows and stored once in a dictionary. These patterns are then replaced with a symbol within the row itself. As shown in Figure 1, repeating column values, as well as strings that repeat across column boundaries, can be replaced.
Figure 1: Compressing data in a row Using this form of compression, DB2 can scan the entire table, find repeating strings within the data, and replace those strings with compression symbols. The amount of compression achieved in this manner on real customer data during the DB2 9 test drive has been reported at between 50% and 80%. That is, the size of the table after compression is between 50% and 80% smaller than when it started. Thus the storage consumption for these tables is significantly less. In addition, DB2 keeps this data compressed in the buffer pool so that you

3
effectively have twice the amount of memory available. That is, since rows remain compressed in the buffer pool, you can expect to see twice as many rows being stored in memory compared to non-compressed data. In one test of an SAP table with real customer data, the number of rows packed into the bufferpool was in fact four times the number of rows achieved without compression.
Adaptive Table Compression
DB2 V10.1 introduced Adaptive table compression. Adaptive compression improves upon the compression rates that can be achieved over using classic row compression by itself. Adaptive compression incorporates classic row compression; however, it also works on a page-by-page basis to further compress data.
Adaptive compression uses two compression approaches. A Table-level compression dictionary used in classic row compression must exist in order to use Adaptive compression. Adaptive compression uses a page-level dictionary-based compression algorithm to compress data based on data repetition within each page of data. The dictionaries map repeated byte patterns to much smaller symbols; these symbols then replace the longer byte patterns in the page. The page-level compression dictionary is stored with the data in the data page, and is used to compress only the data within that page.
The significant advantage of Adaptive compression is that it can find local patterns that may not be in the global dictionary. The adaptive compression will also adjust the dictionary on a page over time, so that new patterns will continue to be compressed. Contrast this to Static compression where the dictionary is built once for the entire table, and not updated unless a reorganization command is run.
DB2 BLU Compression
DB2 V10.5 introduced a new columnar table format. A columnar table contains pages that are dedicated to individual columns. In the traditional row format, a row in a table will be placed on one database page. With columnar format, each column value in a row will end up on a separate page. For instance, in an Employee table, all employee last names would end up on a database page. Similarly, the salary column would be placed on a page along with hundreds of other salary value from other employee records.
Data that is stored in columnar format can achieve much higher compression ratios because there is significantly more repeated patterns and through the use of advanced encoding techniques. The compression is done automatically by DB2 when a table is created in column format.
4
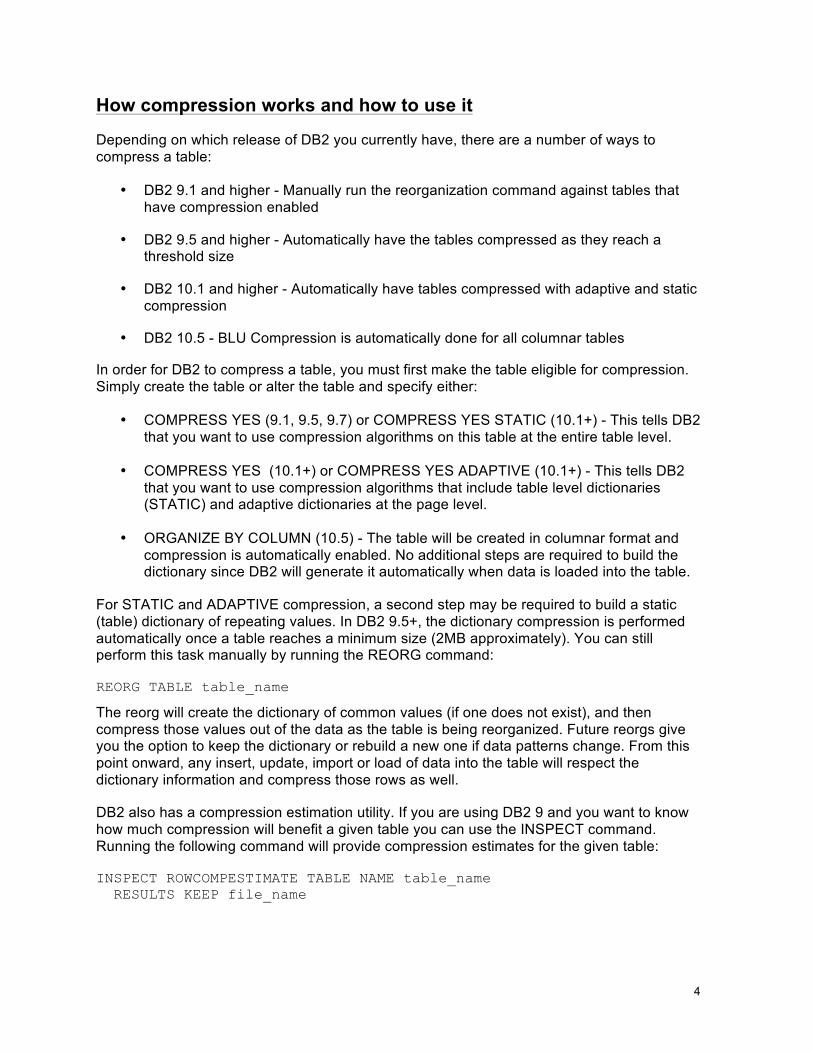
How compression works and how to use it
Depending on which release of DB2 you currently have, there are a number of ways to compress a table:
• DB2 9.1 and higher - Manually run the reorganization command against tables that have compression enabled
• DB2 9.5 and higher - Automatically have the tables compressed as they reach a threshold size
• DB2 10.1 and higher - Automatically have tables compressed with adaptive and static compression
• DB2 10.5 - BLU Compression is automatically done for all columnar tables
In order for DB2 to compress a table, you must first make the table eligible for compression. Simply create the table or alter the table and specify either:
• COMPRESS YES (9.1, 9.5, 9.7) or COMPRESS YES STATIC (10.1+) - This tells DB2 that you want to use compression algorithms on this table at the entire table level.
• COMPRESS YES (10.1+) or COMPRESS YES ADAPTIVE (10.1+) - This tells DB2 that you want to use compression algorithms that include table level dictionaries (STATIC) and adaptive dictionaries at the page level.
• ORGANIZE BY COLUMN (10.5) - The table will be created in columnar format and compression is automatically enabled. No additional steps are required to build the dictionary since DB2 will generate it automatically when data is loaded into the table.
For STATIC and ADAPTIVE compression, a second step may be required to build a static (table) dictionary of repeating values. In DB2 9.5+, the dictionary compression is performed automatically once a table reaches a minimum size (2MB approximately). You can still perform this task manually by running the REORG command:
REORG TABLE table_name
The reorg will create the dictionary of common values (if one does not exist), and then compress those values out of the data as the table is being reorganized. Future reorgs give you the option to keep the dictionary or rebuild a new one if data patterns change. From this point onward, any insert, update, import or load of data into the table will respect the dictionary information and compress those rows as well.
DB2 also has a compression estimation utility. If you are using DB2 9 and you want to know how much compression will benefit a given table you can use the INSPECT command. Running the following command will provide compression estimates for the given table:
INSPECT ROWCOMPESTIMATE TABLE NAME table_name RESULTS KEEP file_name

5
Estimating Compression using DB2 Compression Estimation Tool
The most accurate way of determining the amount of compression in a table is to use the INSPECT command within DB2 9 or the ADMIN_GET_INDEX_COMPRESS_INFO and ADMIN_GET_TAB_COMPRESS_INFO_V97 table functions. However, this technique requires that the data be transferred or migrated to a DB2 9/9.5/9.7 database. If this is not possible, then the DB2 Compression Estimator Tool may be a useful alternative.
If you are using a DB2 V10.1 database, the new command for estimating compression uses the ADMIN_GET_TAB_COMPRESS_INFO table function. The ADMIN_GET_TAB_COMPRESS_INFO table function estimates the compression savings that can be gained for the table, assuming a REORG with RESETDICTIONARY option will be performed.
SELECT TABSCHEMA, TABNAME, DBPARTITIONNUM, DATAPARTITIONID, OBJECT_TYPE, ROWCOMPMODE, PCTPAGESSAVED_CURRENT, AVGROWSIZE_CURRENT, PCTPAGESSAVED_STATIC, AVGROWSIZE_STATIC, PCTPAGESSAVED_ADAPTIVE, AVGROWSIZE_ADAPTIVE FROM TABLE( SYSPROC.ADMIN_GET_TAB_COMPRESS_INFO('SCHEMA1', 'TABLE1'))
This table function provides a direct replacement for the 'ESTIMATE' mode provided by the deprecated ADMIN_GET_TAB_COMPRESS_INFO table function in previous versions of DB2.
The DB2 Compression Estimation Tool (“Estimator”) determines the potential compression of a table or index by looking at the DDL of the object, the current statistics on the object, and then using heuristics based on extensive compression testing to determine what the potential compression could be for the object.
The tool does not read any production data within a table or index. The estimate is based solely on the statistics available to the tool. The DB2 compression algorithm can compress across (and within) columns while the Estimator can only base its results on individual column compression values. For this reason, the results determined by the tool will tend to underestimate the actual compression that can be achieved.

6
Requirements
The DB2 Compression tool is distributed as a single executable file called DB2CompressionEstimatorInstall.exe. This file may be packaged in a zip archive, which would also include this documentation.
The requirements for this program are:
• Installation on a Windows platform (Windows XP, Windows Vista, Windows 7)
• Administrator privileges on Windows to allow the installation of the program
• DB2 CLI client code
• Access to a DB2 system
The actual database that is being analyzed can be on any of the supported DB2 platforms. The user connecting to the DB2 database must have:
• Connect capability to the database (V8+)
• Access to SYSCAT tables
This program does not update or read any user data in the database. The only access the program has is to the SYSCAT tables described above.
Installation
To install the tool, the executable file needs to be run. If the program is being installed on Windows 7, ensure that the installation is run as an Administrator. Otherwise some of the modules may not be properly registered in the Windows.
The installation program will bring up a number of panels that will determine where the program will be installed. The first panel is just an introductory screen:
!

7
After pressing the NEXT button, the disclaimer for the program is displayed:
!
You must select YES in order for the installation to continue.
Once the YES button is pressed, information on the version and any additional requirements are shown:
! After pressing the NEXT button, the path for the program is displayed. By default, the path is in the standard Program Files directory, under the DB2 Compression Estimate folder:
! You can modify this path to any valid location on your system. Once the path has been defined and the NEXT statement pressed, the Program Folder is shown (DB2 Compression

8
Estimator is the default).
! After pressing the NEXT button, the program installation continues until the final screen is displayed:
! The program is now installed on the workstation.
Removing the Program
Running the installation program again, or using the Add or Remove Program option in the System Folder will uninstall the program:
!

9
The uninstaller will give you the option to keep it or remove it:
! If you have already installed the program and do a subsequent installation, the program will remove itself.
Running the Program
To run the program, select the DB2 Compression Estimator icon in the DB2 Compression Estimator folder:
!
There is also an icon on the desktop that can be used to start the program:
! The panels and options are described on the next page.

10
Program Flow

11
The program will take you through five distinct steps in the estimation process. These steps include:
1. Introduction and Disclaimer These two panels are shown whenever the program is started. You must page through these two panels before starting any of the compression analysis. Once you have read the disclaimer you will not be able to go back to view it during the session.
2. Database Selection The two panels that follow the disclaimer allow you to enter the name of the database directly, or select it using the DB2 CLI/ODBC selection applet. Once a successful connection is made to the database, you can refine your analysis by entering certain schemas or tables that you want to analyze. You can always go back to a previous panel by using the BACK button found in the bottom right-hand corner of any panel. Pressing the forward arrow will cause the program to start its analysis.
3. Table Results A graph that displays the numbers of tables analyzed, and their compression ratio, will dynamically update as the program analyzes your database. Once the analysis is complete you can click the forward arrow to see a detailed view of all of the tables.
4. Index Results Pressing the forward arrow on the table details screen will cause the program to analyze the indexes in the database. Note that the indexes that are analyzed are based on the same criteria as the tables. A graph similar to that for tables is shown during index analysis. Pressing the forward key on the index graph will then display more details on the indexes that were analyzed.
5. Final Totals and Export Pressing the final forward key on the index graph will display the compression summary for tables and indexes. You have the option on this screen to export the results to a file for further analysis.
If you need to go back to a previous panel, you can always click on the back arrow found on any panel, or use the tabs that are found at the top of the screen. Note that some tabs will be grayed out if they are currently not available or the analysis has not been completed.
The next section will take you into more details on each one of these panels.

12
Initial Panel
The first panel gives you the current version of the program. Clicking the Disclaimer button will take you to the legal page. The Exit button will close the program.
Disclaimer
Remember that this tool does estimates and that the values could differ significantly from what you get in production. Click on the CONNECT button to connect to a database.

13
Connection Panel
The Estimator needs to connect to a DB2 database on one of the supported platforms. There are five fields that can be filled in:
• Database – This is the name of the database that you want to analyze. The database must be catalogued and available to the client that you are connecting from. If it is not catalogued then you need to supply the Server/IP address (see below) or use the Connection dialog to catalogue it.
• Userid – This is the userid that you will be using to connect to the database. If this value is left blank, it will use your local userid on Windows as the connected user.
• Password – This is the password associated with the userid. If this value is left blank, it will use the local userid information to perform the connection.
• Server/IP - If the database is not cataloged on your local machine, you can access it directly by supplying the IP address or the symbolic name of the server. If the Server/IP address and port are not supplied then the program will attempt to find the database in the local directory.
• Port - Port number to connect to (usually 50000)
On most of the screens you will see information icons beside input fields. Pressing the information icon will display additional information related to that field or screen.

14
This program does not require any temporary tables in order to analyze the database. All select statements are done against the SYSCAT tables.
Pressing the Connect button will cause the program to connect to the database. If there is any error in the connection, a message will be displayed and any corrections will need to be made. Aside from invalid passwords, userids, and database names, the only other error that you may receive is a DB2CLI library or DB2 Allocation error.
Both of these problems are related to the DB2CLI library either being unavailable or the library being at an incorrect level. This could be caused by:
• The DB2 client code not being installed on your system • The DB2 client is from a very old version of DB2 (prior to DB2 Version 8)
The program cannot continue with these errors since it uses the library to communicate with the DB2 database. You can test whether or not your client is working by issuing the DB2CMD command in a CMD shell on Windows, and then if successful, the DB2 command. If a command line environment for DB2 successfully starts then there may be a problem with the program.
If you left the connection fields blank, a CLI connection panel will be displayed where you can select from a database in the list, or specify details on which database to connect to.

15
Pressing OK will then cause the program to connect to the database you want to analyze.
The other option that is available on this screen is the “Use File” button. Whenever you analyze a database (through a normal connection to the database), the program will write a catalog file to disk. This file (DB.CAT where DB is the name of your database) contains the DB2 release that the database was created on. Two additional files (DB.tab, DB.idx) contain table and index information that was analyzed. Instead of re-connecting to the database to do additional testing, you can select the name of the database catalog that is already on disk and the program will use this instead of connecting to the database.
Rather than analyzing multiple SCHEMAs (and running multiple SELECT statements against a database), it may be more efficient to have the program analyze the entire database in one step, and then go back and use the catalog file to test individual SCHEMAs.

16
Options
The options screen allows you to modify the types of tables and schemas that are analyzed. The options that are available are described below. If you have a large number of tables in your database, you may want to restrict them by SCHEMA or table name attribute before analyzing the results. Note that selecting “Exclude” (for either Schemas or Tables) will remove tables from the result.
The compression estimator will list all schemas available in the selected database. If this results in too many schemas, you can list the schemas in this input box. Type in each schema name separated by a comma. For instance, the following list will only show the schemas SYSCAT and BAKLARZ:
! Note that the schema name can include the SQL "%" character to represent any combination of characters. The following list would find any schema that starts with the letters "SYS" or ends with "CAT":
!
Any schema name that does not include this special character will need to exactly matched, so "syscat" by itself will only match SYSCAT.
Schemas that include special characters or lowercase letters need to be placed in double quotes. The program will fold all table names to uppercase, except for those in quotes:

17
!
The table input box behaves in exactly the same manner as the schema box. You can limit the tables that are retrieved by using patterns. Note that the pattern is applied to all tables that are retrieved from all of the schemas. This means that if you type in “EMPLOYEE” in the table box, and various schemas in the schema box, you will get the EMPLOYEE table from all schemas that contain that table.
Using Schemas and Tables with Catalog Files
If you use a CATALOG file (instead of connecting to the database directly), the SCHEMA/TABLE patterns are restricted to full name (baklarz) and leading/trailing patterns (%baklarz, baklarz%, %bak%). Imbedded patterns are not supported (bak%rz).
Include Catalog Tables and Indexes in Totals The estimator does not include SYSTEM catalog tables and indexes in the compression estimates. The compression algorithms that DB2 uses are not applied to the catalog tables, so no compression would be shown for these tables.
If you select this option, the graphs produced by the program will still exclude the system tables and indexes, but the final object count and table/index size will include them.
Exclude Detailed Display
The compression estimator will normally display a listing of all tables and indexes that were analyzed. This list includes the name of the object, the current (and uncompressed) size of the object, and the potential compression that can be applied to the object.
If you are analyzing databases that have 10,000's of objects, it is possible that Windows may run out of virtual memory when attempting to display this list. While it is unlikely to occur in practice, in the event you receive an out-of-memory condition, select this option to bypass detailed object display.
There are other methods that can help reduce the amount of output displayed during processing. One is to try and reduce the amount of SCHEMAs/TABLEs that are analyzed by entering the ones you want in SCHEMA and TABLE boxes.
If you do want to get a rough estimate of the total size of all regular objects in the database then just select this box to reduce the memory overhead. Whether you display the results or not, the results of the analysis are always written to disk as three files: DATABASENAME-TABLES/INDEXES/SUMMARY.
Adjusting Compression Estimates
You have the option of adjusting some of the settings that are used by the program to determine the level of compression applied to a table.
18
There are four possible settings for Data Patterns. Think of a data pattern as a string, date, or numeric value. These settings affect the potential compression that the estimator determines for a table. The system catalog doesn’t tell us everything about the patterns in a column or whether there are patterns that go between columns. This setting gives the estimator a hint about potential data patterns and adjusts the compression ratios according to these hints.
You should choose a setting that reflects the majority of tables in the database. While the estimator could be more accurate if each table had its own correlation setting, this would take considerable effort on the part of the user!
If the tables in your database do not have many correlated columns then using “Low” or “Medium” would result in more accurate results. A setting of “Random” would be used only of most of the tables have random or uncorrelated columns. By default the Compression Estimator uses a Medium setting.
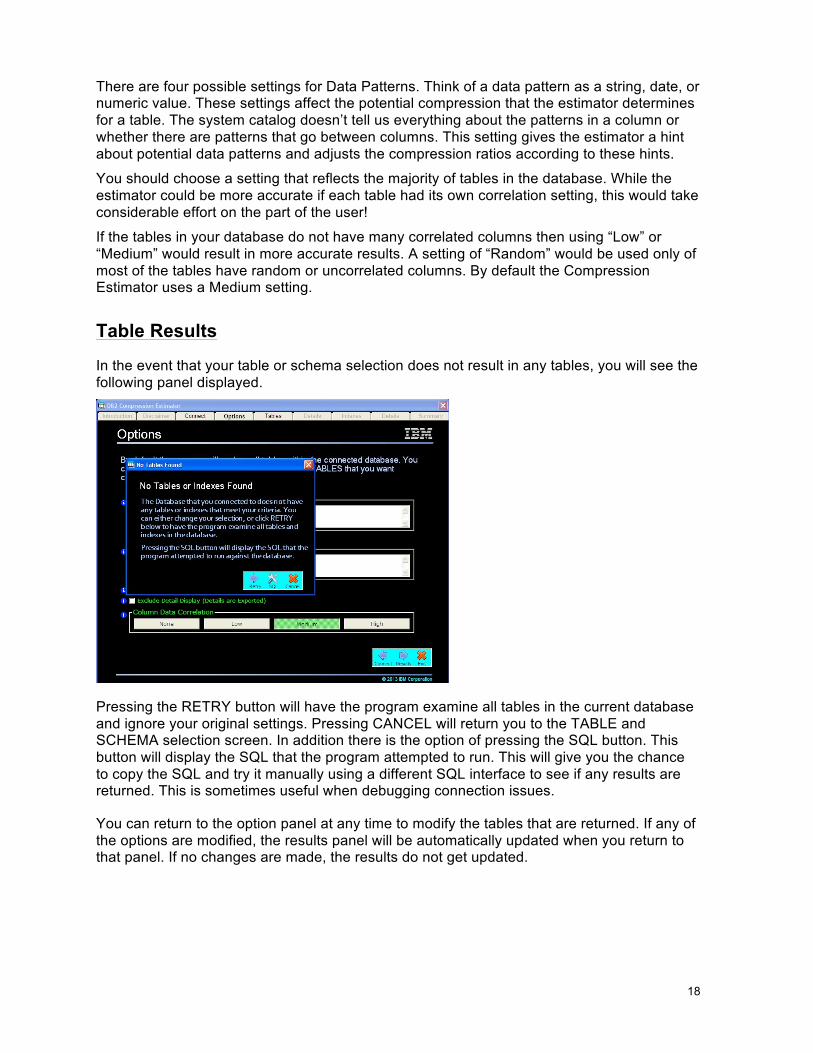
Table Results
In the event that your table or schema selection does not result in any tables, you will see the following panel displayed.
Pressing the RETRY button will have the program examine all tables in the current database and ignore your original settings. Pressing CANCEL will return you to the TABLE and SCHEMA selection screen. In addition there is the option of pressing the SQL button. This button will display the SQL that the program attempted to run. This will give you the chance to copy the SQL and try it manually using a different SQL interface to see if any results are returned. This is sometimes useful when debugging connection issues.
You can return to the option panel at any time to modify the tables that are returned. If any of the options are modified, the results panel will be automatically updated when you return to that panel. If no changes are made, the results do not get updated.

19
Results (Tables)
As the program runs it will display a graph that represents the number of tables and the levels of compression achieved. The bars represent the number of tables that have been found in the system that have a certain percentage of compression. For instance, the red bar represents 5 tables that have less than 10% compression, while the largest bar represents 1 table that has a compression rate of between 70-79%. The left side of the display shows the total number of tables, the total size, the potential compressed size, and a final compression percentage.
Three of the graphs represent different levels of potential compression you could achieve:
1. Static Compression This graph represents Static (table level) or classic row compression after a full reorg is done on the table. The dictionary is recreated after the table has been loaded so that there are more patterns for the algorithm to find.
2. Adaptive Compression Adaptive compression builds on top of Static Compression. A static dictionary gets built once the 2M threshold is met, and then additional page-level dictionaries are built as necessary. Adaptive compression is typically better than Static compression and maintains or improves the compression ratio as data changes in the table.
3. BLU (Columnar) Compression The final chart shows the columnar compression that DB2 can achieve on the tables. Note that this compression is automatic and no utilities are involved in the dictionary creation.
The final graph shows the space savings of the three compression techniques as ratios to the original database size.

20
Pressing the forward arrow (details) will display a list of all tables found and their estimated compression (Note: These details will be hidden if you selected to exclude detailed display).
You can sort the list by any one of the first 5 columns (Schema, Table Name, Info, Original Size, Current Size, and Compressed Size) by clicking on the title of the column. For instance, the following screen was sorted by Table Name:
When this screen is initially displayed, the compressed column size is based on Static compression. If you want to see what the table sizes would be based on other compression algorithms, click on column title (Static, Adaptive, BLU) to have the compression value recomputed (Adaptive Example):

21
If you want to see what the compression values would be for an individual table, click on the row that the table name is on. For instance, the following screen shows details on the WITHOUT_COMPRESSION table:
The information column is either blank (a good table for compression) or may contain one of the following codes:
• A/B/S - Table is already compressed using Adaptive/BLU/Static Compression The table is already compressed so the program will use the current compression value for the results. The original size of the table is computed by taking the current size of the table and the percentage savings found in the system catalog tables.
• C - Catalog table If you requested that Catalog tables (SYSTEM) be included in any of the totals, these

22
tables would be flagged with a "C" in the list. SYSTEM tables cannot be compressed and will be excluded from any compression calculations. However, System tables and indexes will be included in the overall totals.
• U - Statistics are missing Statistics are critical to computing the potential compression of a table. In the event that statistics are not available, the compression estimator will base the calculations on the "worst" case scenario. For instance, if there are no distribution statistics available for a numeric column, the estimator must assume that the data has a random distribution. Tables that contain zero rows will still have compression estimates computed based on these random distribution values.
• T - Tiny table In order for automatic compression to occur, the table must be at least 2M in size. If the table is less than 2M then it will be flagged with this code. The other reason for this warning is for tables that still use the old page format in DB2. A page in DB2 can contain no more than 255 entries in the old format, so compressing rows on a page may not result in any savings because the empty space can't be filled up with more rows.
Below the table summary information is a grid that displays the columns that make up that particular table.
This information may be useful in determining whether or not low, medium, or high data patterns should be used in the compression estimates. Pressing the next arrow (Indexes) will display a similar graph but based on potential index compression.
Results (Indexes)

23
The program will do a similar analysis on the Indexes in the database. As the program runs it will display a graph that represents the number of indexes and the levels of compression achieved. The left side of the display shows the total number of indexes, the total index size, the potential compressed size, and a final compression percentage. Note that index compression uses a different algorithm from table compression. Index compression was designed to save space but not at the expense of index performance. This results in much smaller savings as compared to tables (typically <30%). This particular database did not have many indexes so that is why there are very few bars highlighted in the graph.
The three graphs represent different levels of potential index compression you could achieve:
1. Static Compression/Adaptive The compression algorithm is identical for all indexes whether or not Static or Adaptive compression was used. Since Index compression was only introduced in DB2 9.7, any prior releases will not see any of these savings.
2. BLU Compression BLU compression for indexes is really just the elimination of the index! DB2 BLU tables do not use indexes, nor are you able to create them. For this reason, any indexes against a table are dropped if the table is in columnar format. However, there are some index types (and associated tables) that BLU cannot drop or use. These are any objects that contain XML, Long Fields, Oracle data types (NUMBER, VARCHAR2) and DECFLOAT. For these tables, the Static Index compression values are used.
The database that this estimate was done against had very few user indexes. Pressing the next arrow (Results) will give more detailed information on the indexes. (Note: These details will be hidden if you selected to exclude detailed display).

24
You can sort the list by any one of the first 6 columns (Schema, Table Name, Index Name, Original Size, Current Size, and Compressed Size) by clicking on the title of the column. To recompute the compression using one of the other algorithms (Static or BLU), click on the title with the compression format. This will recompute the index savings. Note: Static and Adaptive compression use the same index compression algorithms so the results are found under Static compression.
Compression estimates on an individual index can be computed by clicking on the index name.
The information column is either blank (a good index for compression) or may contain one of the following code:
• C - Catalog Index If you requested that Catalog Indexes (SYSTEM) be included in any of the totals, these indexes would be flagged with a "C" in the list. SYSTEM indexes cannot be compressed and will be excluded from any compression calculations. However, System tables and indexes will be included in the overall totals.
• U - Statistics are missing Statistics are critical to computing the potential compression of an index. In the event that statistics are not available, the compression estimator will base the calculations on the "worst" case scenario. For instance, if there are no distribution statistics available for a index column, the estimator must assume that the data has a random distribution. Indexes that contain zero rows will still have compression estimates computed based on these random distribution values. Columnar tables will ignore these indexes.
• T - Tiny Index In order for automatic compression to occur, the index must be at least 2M in size. If the index is less than 2M then it will be flagged with this code. Columnar tables will ignore these indexes.

25
• B - Block Indexes Block indexes are used for MDC tables and are already highly compressed. These indexes are ignored when using columnar tables (DB2 BLU).
• X - XML Index not compressed This program does not compute XML index compression, so any XML indexes are ignored. The XML data type is currently not supported by DB2 BLU so you must use ROW format for the table. In this case the index cannot be dropped when using DB2 BLU.
• x - XML Index compressed This is an XML index that has already been compressed. DB2 BLU cannot use XML data types, so the table and index must be used in ROW format and cannot be converted to COLUMNAR format.
• 0 - Zero cardinality Statistics are present for the index, but no rows exist. This could happen when you create a table and an index for it, but haven't loaded any data. DB2 BLU would ignore these indexes.
• N - No compression The reason for this warning is for indexes that end up being larger because of compression overhead. In this case index compression will not take effect. DB2 BLU would ignore these indexes.
• ? - Unknown An unrecognized index format (used for future compatibility).
• Z - Index already compressed DB2 has already compressed the index so there is no need to calculate the compression rate. From a DB2 BLU perspective this index could be dropped. The percent savings for this index are found in the system catalog and is used to compute what the original index size would have been.
• z - Index already compressed but no statistics DB2 has already compressed the index but the statistics are missing so the program can't determine what the current size of the index is.
After viewing the Index Details page, you can get an entire summary of all of the tables and indexes by pressing the Summary button.

26
Summary
The summary page breaks down the compression results by compression algorithm (Static, Adaptive, and BLU). The graph below the summary gives a visual representation of the savings ratio between the three different compression algorithms.
You can change the graph to display the savings as a percentage by selecting the Plot % Savings button:
You can also graph the size of the database:

27
The results of the current session are saved into three separate files:
• DB-TABLES.xls - Table details
• DB-INDEXES.xls - Index details
• DB-SUMMARY.xls -Summary information
The "DB" is replaced with the name of the database you are analysing. If the program finds an existing analysis on disk, it will overwrite the previous version.
The exported file will contain the detailed table or index information:
At this point you can exit the simulator, or click on any of the tabs on the top of the screen to go back to a previous step, or change the database that you are analysing.
Interpreting Results
There are a couple of points to remember when analysing these results. The program does not look at any of the raw data but uses the information in the system catalog tables instead. The more up to date these statistics are, the better an estimate the program can make.
The estimates are based on extensive testing against similar data types and columns. However, wide variations can occur depending on the distribution of values in a column, and whether a pattern crosses multiple columns. The program can only predict compression at an individual column level while DB2 can find patterns that cross column boundaries.
Testing has shown that the compression estimator is typically +/-10% across the entire database. Using the compression functions built-in to DB2 will give you the most accurate compression estimate.
The final database size estimated by the program is based on the information found in the catalog tables. If the statistics are out of date then the answer will be inaccurate. The total size is based on regular table objects, regular indexes, and system catalog tables. Long Objects, XML Objects, procedures, and other non-data objects will not be included in the estimate. The database size is close to what would be produced with a DB2MOVE command that extracts all of the data and DLL for a given database.

28
You have the option of adjusting some of the settings that are used by the program to determine the level of compression applied to a table.
Once you have viewed the summary screen, you can always return to the OPTIONS screen and modify the level of Data Patterns. When you set a value on this screen, the next compression estimate will use the updated data patterns. There is no need to re-connect to the database since you will be using the catalog that is found on disk, rather than a direct connection.
Sample Database
The program installs a sample catalogue (SAMPLE.CAT) in the installation directory. If you are not connected to a DB2 system you can still try out the estimator by selecting “Use File” in the “Select Database” panel:
Then select the SAMPLE.cat file from the file selection dialog:
You can then do the analysis using this SAMPLE catalogue table.
Every time you complete an analysis of a connected database, a catalogue file will be written to the installation directory. This allows you to do further analysis against the database without having to directly connect to it. Note that if you restricted the analysis to a certain schema or set of tables, the catalogue will only contain those schemas and tables. If you want to have the most flexibility in using this catalogue feature, you should run the first analysis against the entire database. Then you can go back and be more selective in your analysis, but use the file instead of a direct database connection.

29
© Copyright IBM Corporation 2012, 2013 IBM Canada 8200 Warden Avenue Markham, ON L6G 1C7 Canada Printed in United States of America 09-2013 All Rights Reserved. IBM, DB2, DB2 Universal Database, OS/390, z/OS, S/390, and the ebusiness logo are trademarks of the International Business Machines Corporation in the United States, other countries or both. UNIX and Unix-based trademarks and logos are trademarks or registered trademarks of The Open Group. Intel and Intel-based trademarks and logos are trademarks or registered trademarks of Intel Corp. Other company, product or service names may be the trademarks or service marks of others. References in this publication to IBM products or services do not imply that IBM intends to make them available in all countries in which IBM operates. The following paragraph does not apply to the United Kingdom or any other country where such provisions are inconsistent with local law: INTERNATIONAL BUSINESS MACHINES CORPORATION PROVIDES THIS PUBLICATION "AS IS" WITHOUT WARRANTY OF ANY KIND, EITHER EXPRESS OR IMPLIED, INCLUDING, BUT NOT LIMITED TO, THE IMPLIED WARRANTIES OF NON-INFRINGEMENT, MERCHANTABILITY OR FITNESS FOR A PARTICULAR PURPOSE. Some states do not allow disclaimer of express or implied warranties in certain transactions, therefore, this statement may not apply to you. This information could include technical inaccuracies or typographical errors. Changes are periodically made to the information herein; these changes will be incorporated in new editions of the publication. IBM may make improvements and/or changes in the product(s) and/or the program(s) described in this publication at any time without notice. Any performance data contained herein was determined in a controlled environment. Therefore, the results obtained in other operating environments may vary significantly. Some measurements may have been made on development-level systems and there is no guarantee that these measurements will be the same on generally available systems. Furthermore, some measurement may have been estimated through extrapolation. Actual results may vary. Users of this document should verify the applicable data for their specific environment. Information concerning non-IBM products was obtained from the suppliers of those products, their published announcements or other publicly available sources. IBM has not tested those products and cannot confirm the accuracy of performance, compatibility or any other claims related to non-IBM products. Questions on the capabilities of non-IBM products should be addressed to the suppliers of those products. The information in this white paper is provided AS IS without warranty. Such information was obtained from publicly available sources, is current as of 07/25/2012, and is subject to change. Any performance data included in the paper was obtained in the specific operating environment and is provided as an illustration. Performance in other operating environments may vary. More specific information about the capabilities of products described should be obtained from the suppliers of those products.