Embed Size (px)
Citation preview
DBMS on a modern processor:where does time go?
Anastasia Ailamaki, David DeWitt, Mark Hill and David Wood
University of Wisconsin‐Madison
Presented by:Bogdan Simion
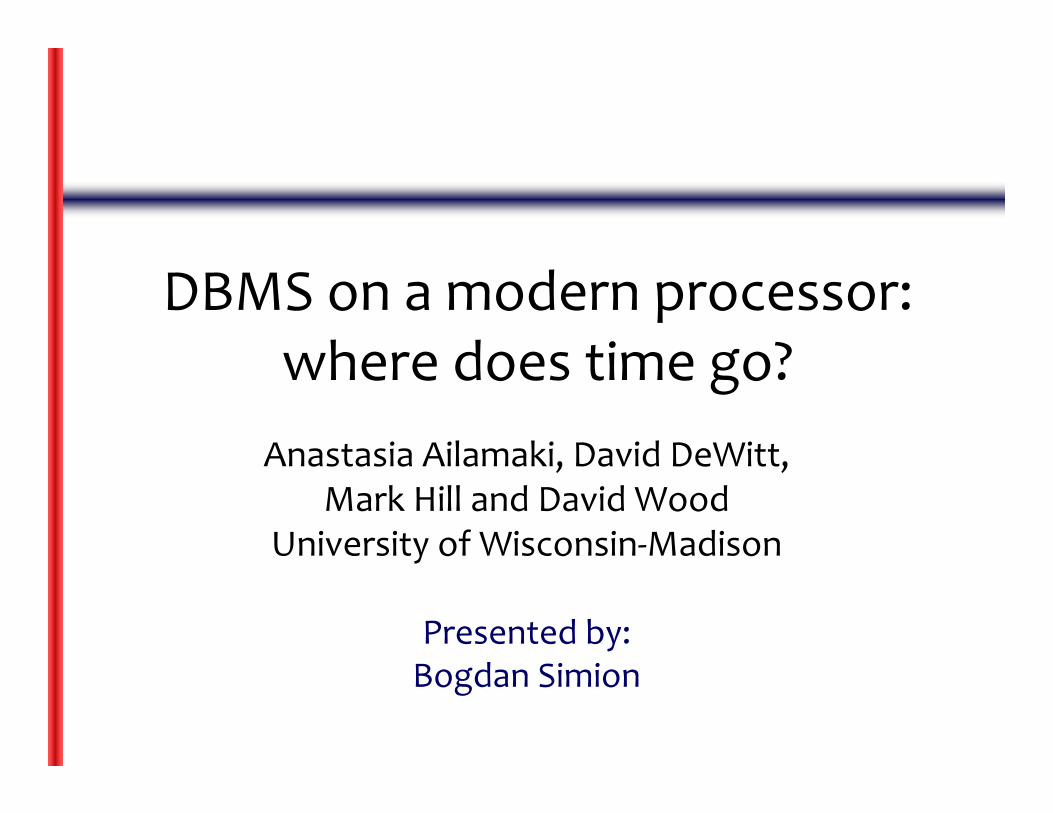
Current DBMS Performance
+
=
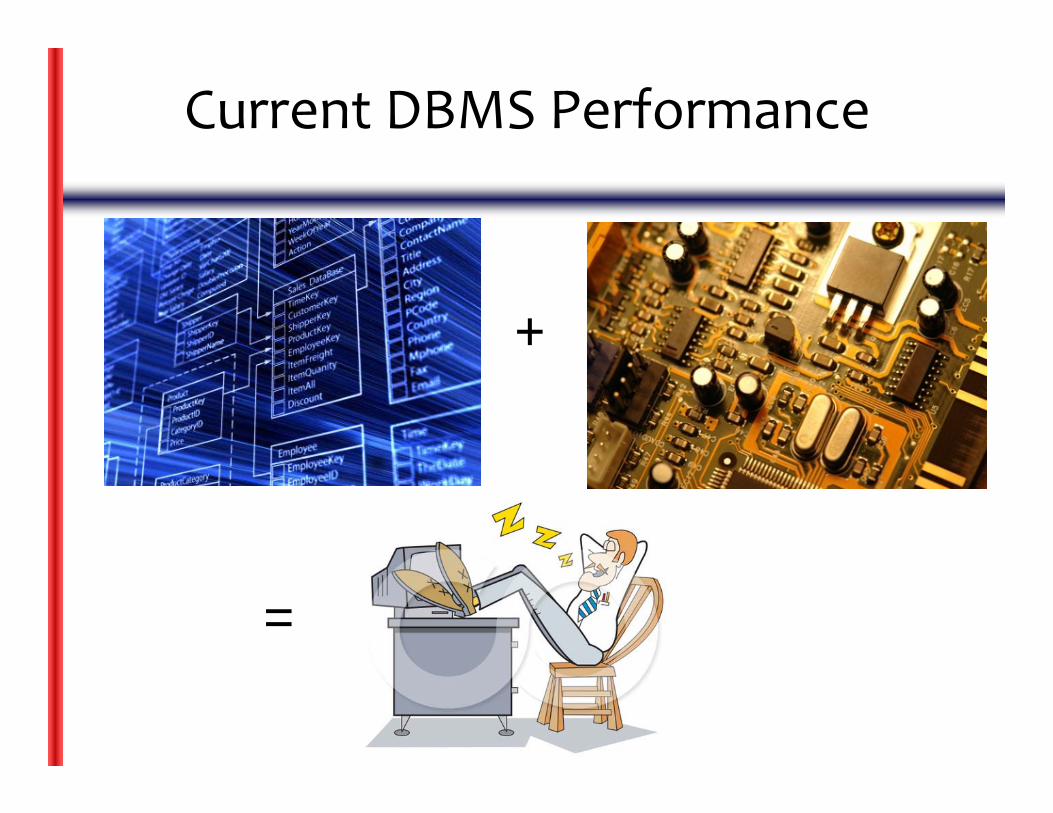
Where is query execution time spent?
Identify performance bottlenecks in CPU and memory

Outline
•Motivation•Background•Query execution time breakdown• Experimental results and discussions• Conclusions
Hardware performance standards
• Processors are designed and evaluated with simple programs
•Benchmarks: SPEC, LINPACK
•What about DBMSs?
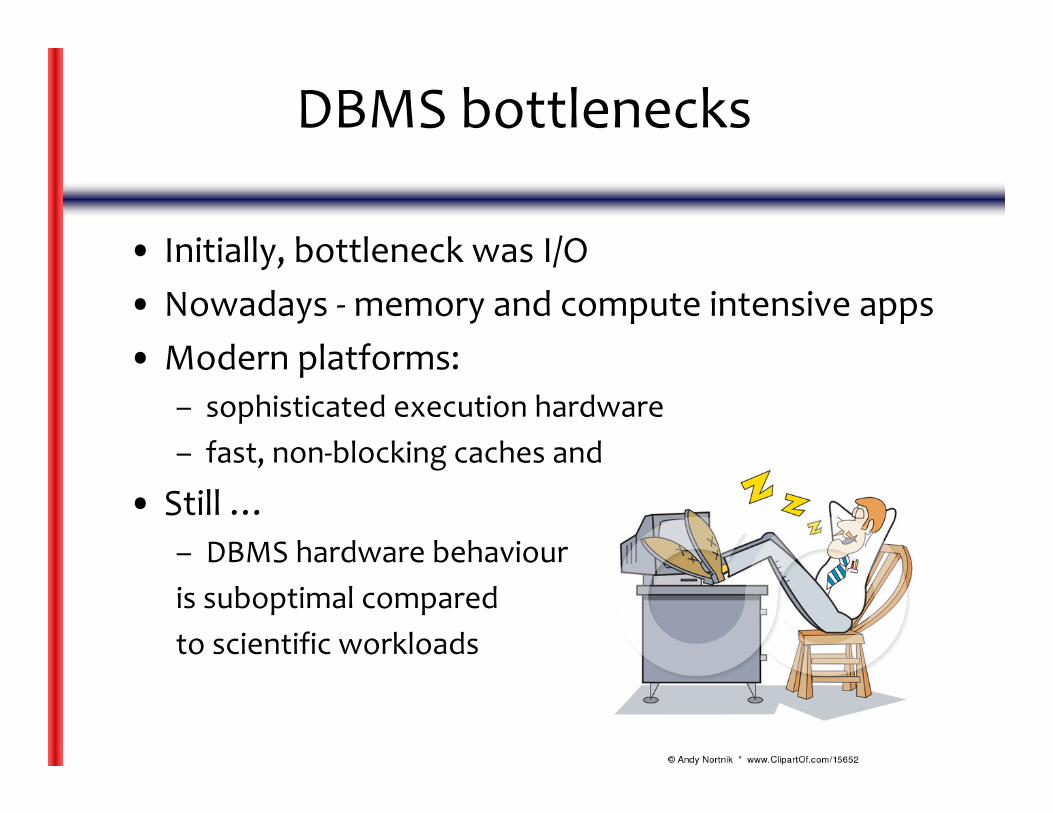
DBMS bottlenecks
• Initially, bottleneck was I/O • Nowadays ‐memory and compute intensive apps• Modern platforms:
– sophisticated execution hardware– fast, non‐blocking caches and memory
• Still …– DBMS hardware behaviouris suboptimal compared to scientific workloads
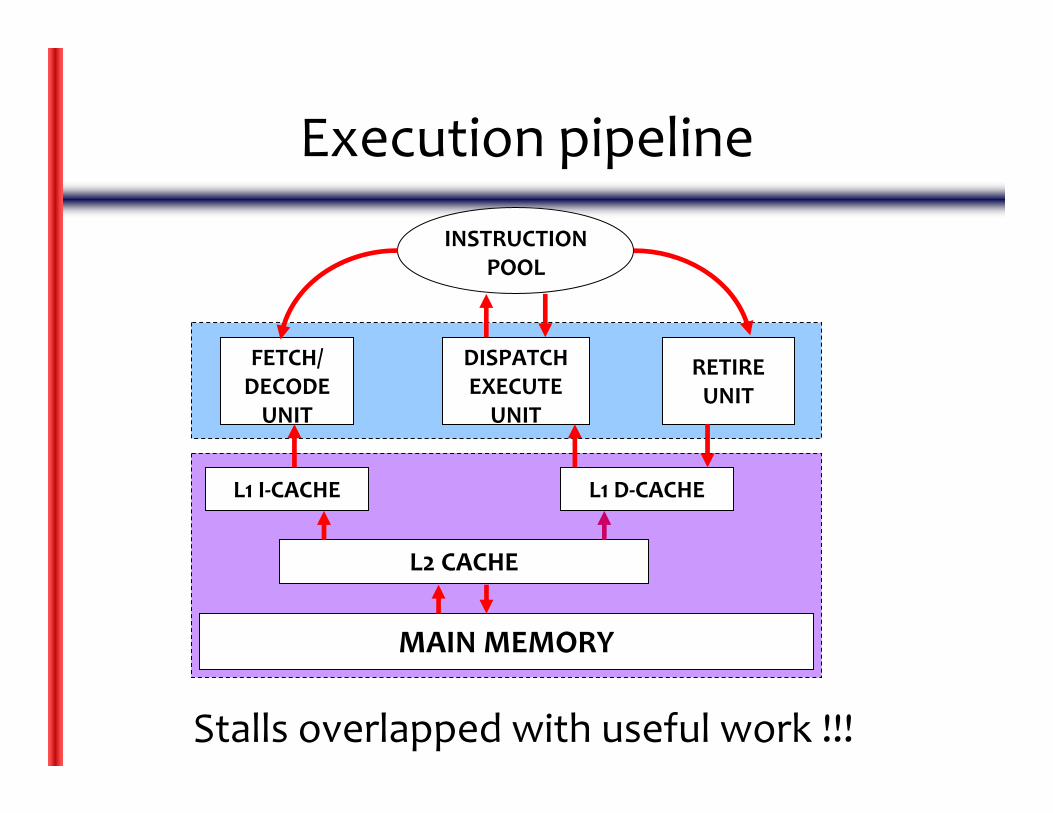
Execution pipeline
FETCH/DECODE UNIT
DISPATCH EXECUTEUNIT
RETIRE UNIT
INSTRUCTION POOL
L1 I‐CACHE L1 D‐CACHE
L2 CACHE
MAIN MEMORY
Stalls overlapped with useful work !!!
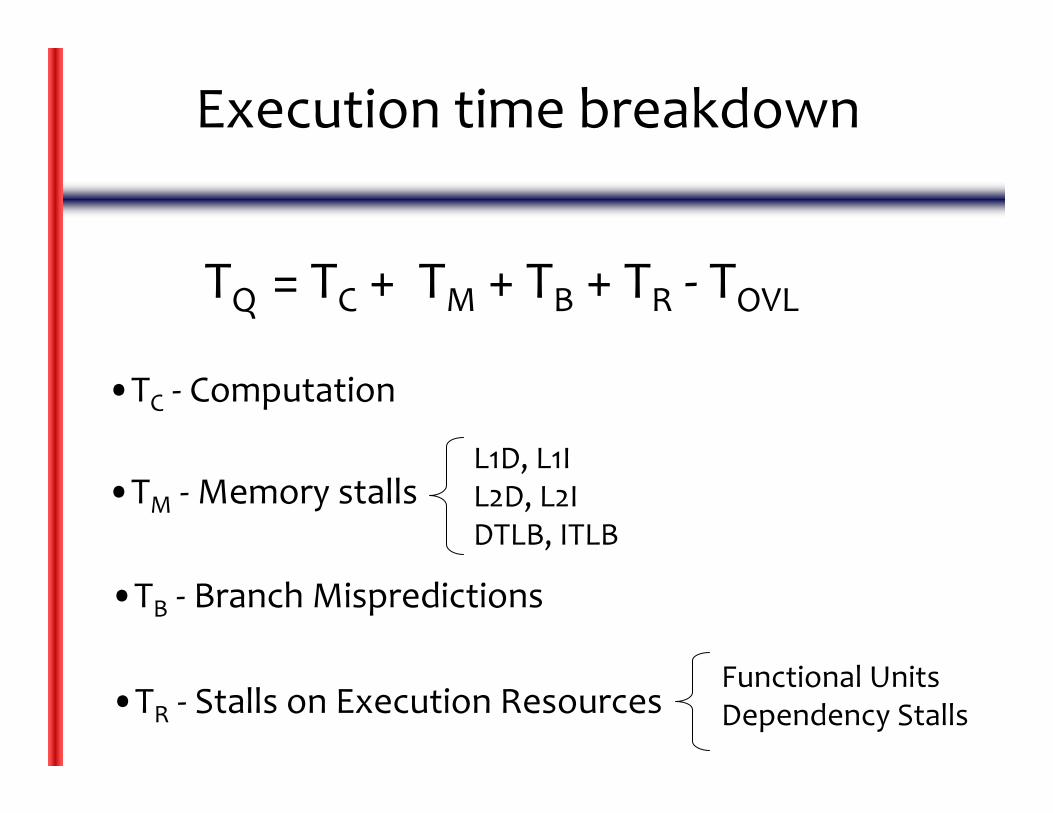
Execution time breakdown
•TC ‐ Computation
•TM ‐Memory stalls
•TB ‐ Branch Mispredictions
•TR ‐ Stalls on Execution Resources
L1D, L1IL2D, L2IDTLB, ITLB
Functional UnitsDependency Stalls
TQ = TC + TM + TB + TR ‐ TOVL
DB setup
•DB is memory resident => no I/O interference
•No dynamic and random parameters, no concurrency control among transactions
Workload choice
• Simple queries:– Single‐table range selections (sequential, index)– Two‐table equijoins
• Easy to setup and run• Fully controllable parameters• Isolates basic operations• Enable iterative hypotheses !!!• Building blocks for complex workloads?
10% Indexed Range Selection
0%
20%
40%
60%
80%
100%
B C DDBMS
Computation Memory Branch mispredictions Resource
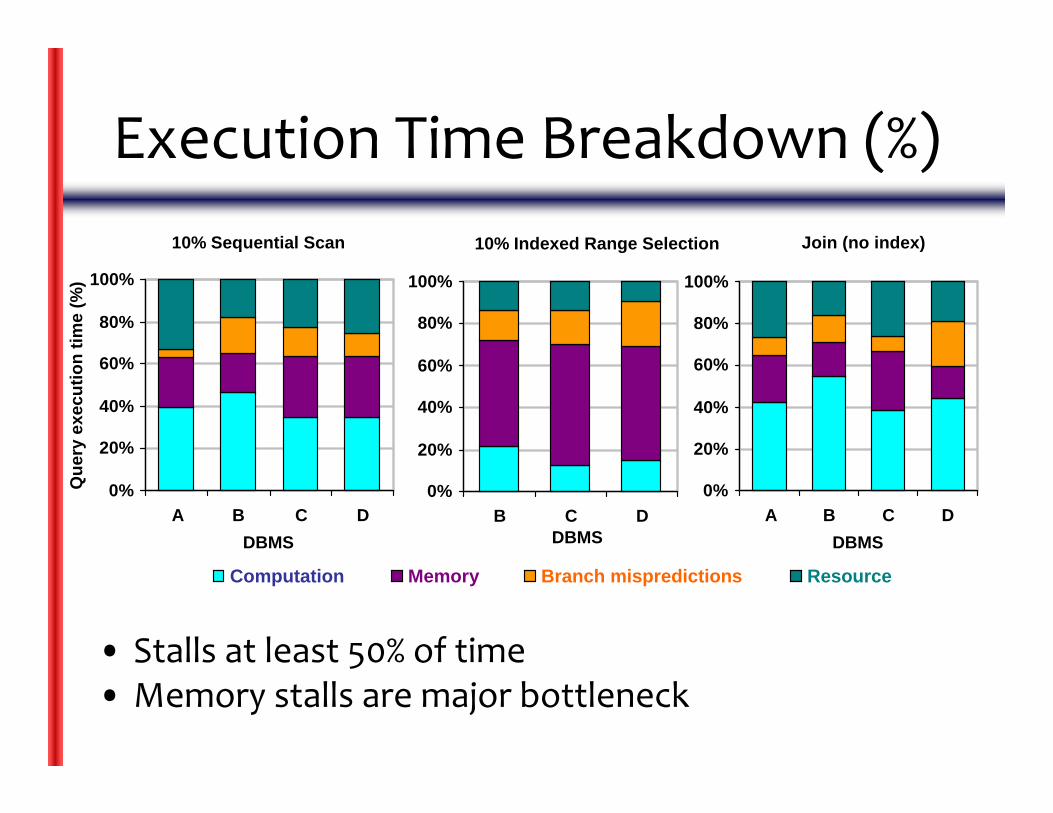
Execution Time Breakdown (%)
• Stalls at least 50% of time• Memory stalls are major bottleneck
Join (no index)
0%
20%
40%
60%
80%
100%
A B C DDBMS
10% Sequential Scan
0%
20%
40%
60%
80%
100%
A B C DDBMS
Que
ry e
xecu
tion
time
(%)
10% Indexed Range Selection
0%
20%
40%
60%
80%
100%
B C DDBMS
L1 Data L1 Instruction L2 Data L2 Instruction
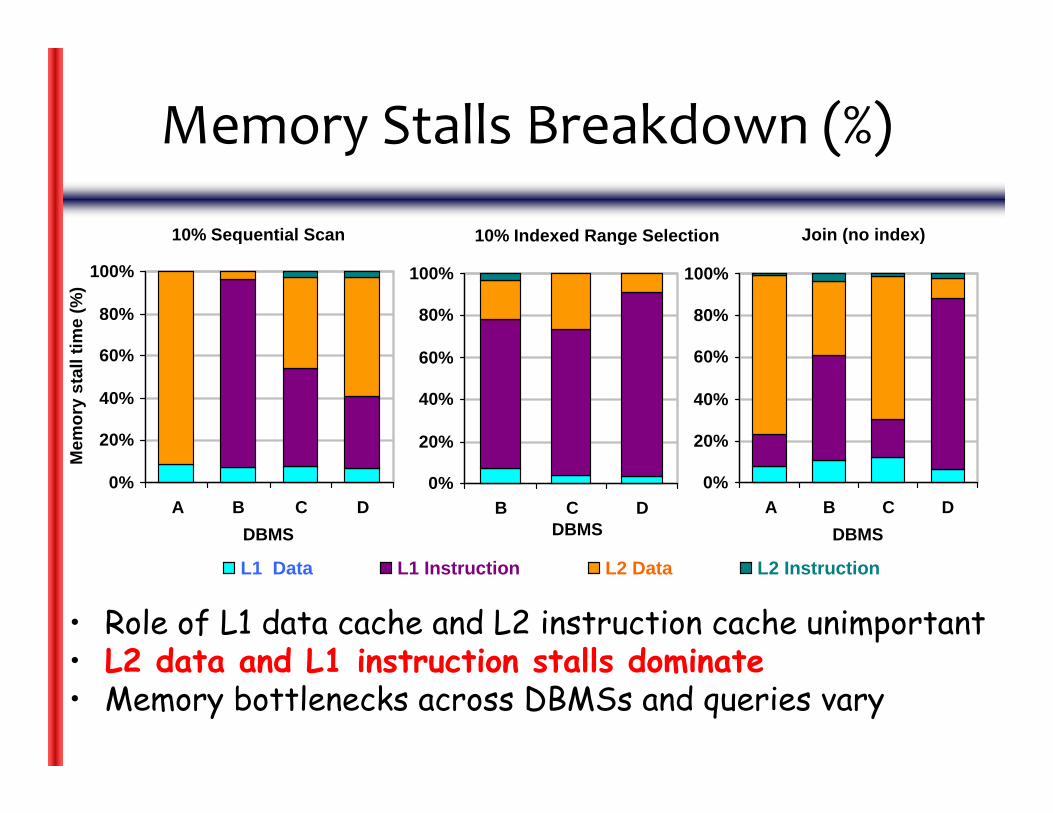
Memory Stalls Breakdown (%)
• Role of L1 data cache and L2 instruction cache unimportant• L2 data and L1 instruction stalls dominate• Memory bottlenecks across DBMSs and queries vary
Join (no index)
0%
20%
40%
60%
80%
100%
A B C DDBMS
10% Sequential Scan
0%
20%
40%
60%
80%
100%
A B C DDBMS
Mem
ory
stal
l tim
e (%
)
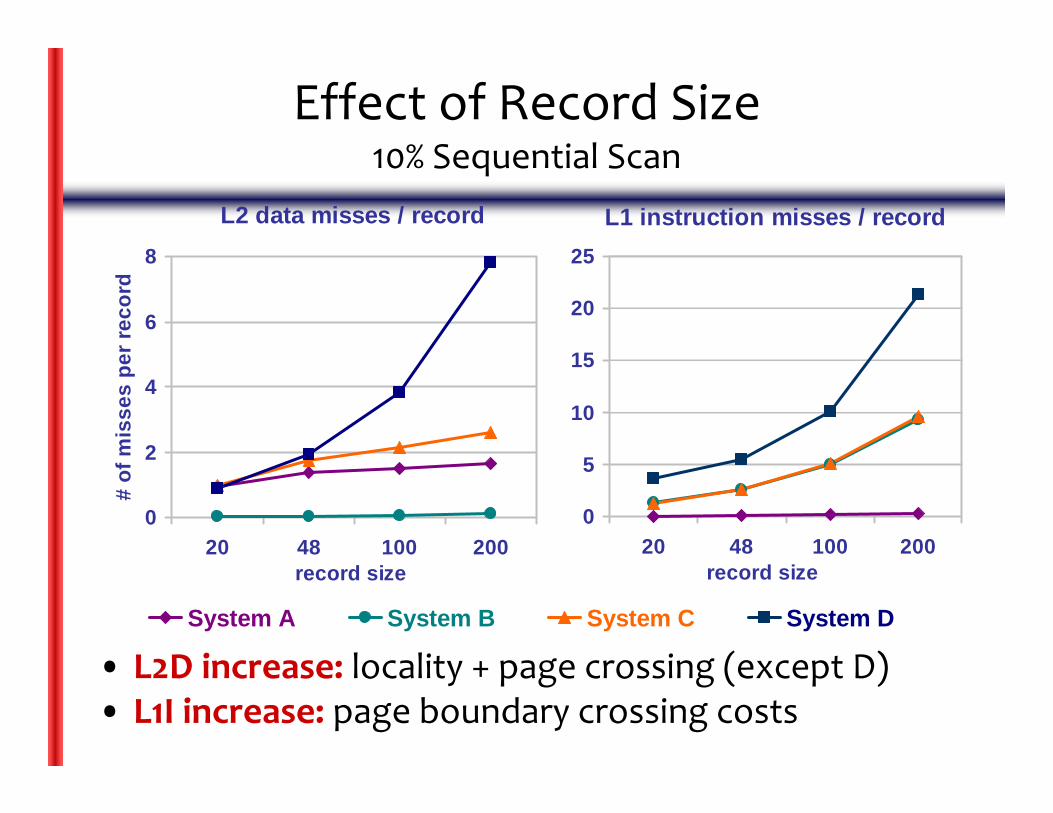
Effect of Record Size10% Sequential Scan
L1 instruction misses / record
0
5
10
15
20
25
20 48 100 200record size
System A System B System C System D
• L2D increase: locality + page crossing (except D)• L1I increase: page boundary crossing costs
L2 data misses / record
0
2
4
6
8
20 48 100 200record size
# of
mis
ses
per r
ecor
d
Memory Bottlenecks
• Memory is important‐ Increasing memory‐processor performance gap‐ Deeper memory hierarchies expected
• Stalls due to L2 cache data misses‐ Expensive fetches from main memory‐ L2 grows (8MB), but will be slower
• Stalls due to L1 I‐cache misses‐ Buffer pool code is expensive‐ L1 I‐cache not likely to grow as much as L2
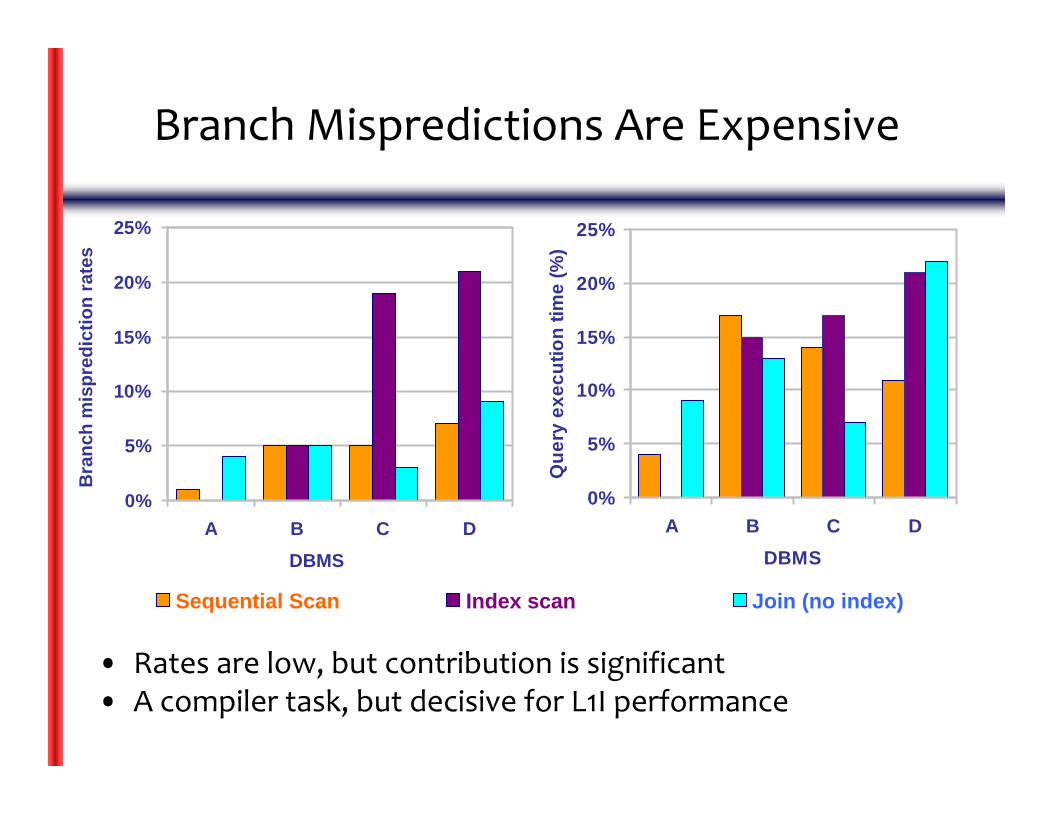
Branch Mispredictions Are Expensive
0%
5%
10%
15%
20%
25%
A B C DDBMS
Que
ry e
xecu
tion
time
(%)
• Rates are low, but contribution is significant• A compiler task, but decisive for L1I performance
0%
5%
10%
15%
20%
25%
A B C DDBMS
Bra
nch
mis
pred
ictio
nra
tes
Sequential Scan Index scan Join (no index)
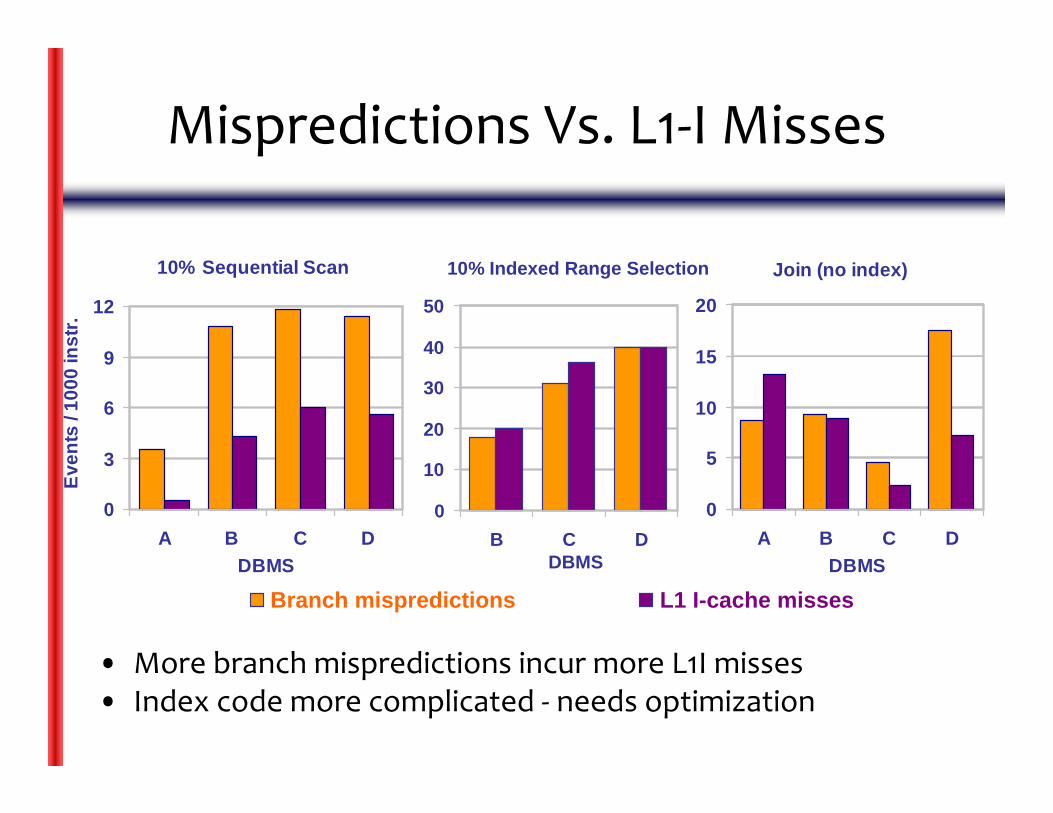
Mispredictions Vs. L1‐I Misses
10% Sequential Scan
0
3
6
9
12
A B C DDBMS
Even
ts /
1000
inst
r.
Join (no index)
0
5
10
15
20
A B C DDBMS
• More branch mispredictions incur more L1I misses• Index code more complicated ‐ needs optimization
10% Indexed Range Selection
0
10
20
30
40
50
B C DDBMS
Branch mispredictions L1 I-cache misses
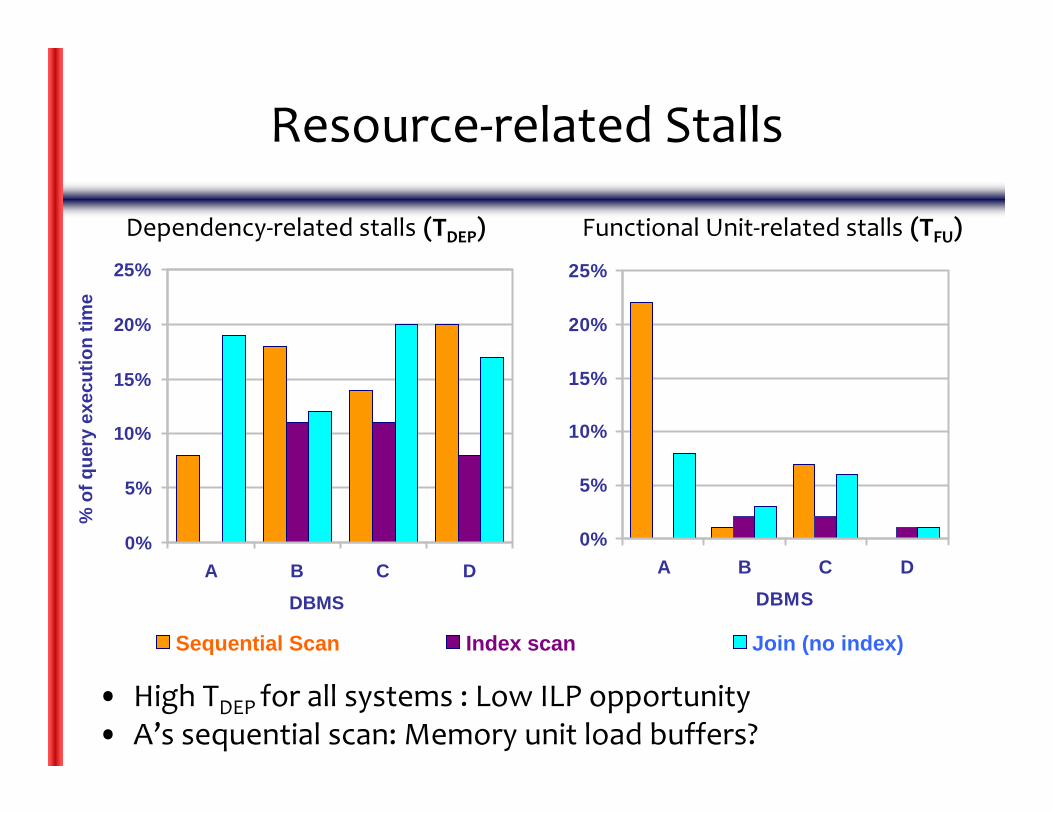
Resource‐related Stalls
0%
5%
10%
15%
20%
25%
A B C DDBMS
• High TDEP for all systems : Low ILP opportunity• A’s sequential scan: Memory unit load buffers?
Dependency‐related stalls (TDEP) Functional Unit‐related stalls (TFU)
0%
5%
10%
15%
20%
25%
A B C DDBMS
% o
f que
ry e
xecu
tion
time
Sequential Scan Index scan Join (no index)
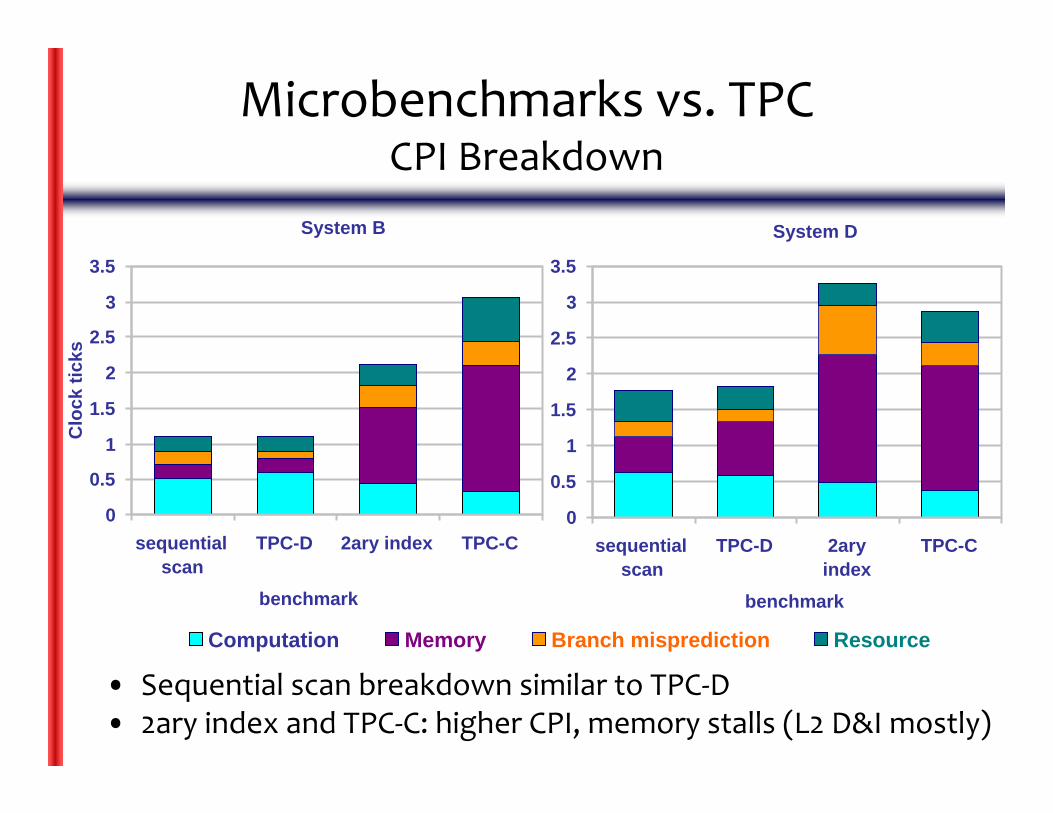
Microbenchmarks vs. TPCCPI Breakdown
• Sequential scan breakdown similar to TPC‐D• 2ary index and TPC‐C: higher CPI, memory stalls (L2 D&I mostly)
System B
0
0.5
1
1.5
2
2.5
3
3.5
sequentialscan
TPC-D 2ary index TPC-C
benchmark
Clo
ck ti
cks
Computation Memory Branch misprediction Resource
System D
0
0.5
1
1.5
2
2.5
3
3.5
sequentialscan
TPC-D 2aryindex
TPC-C
benchmark
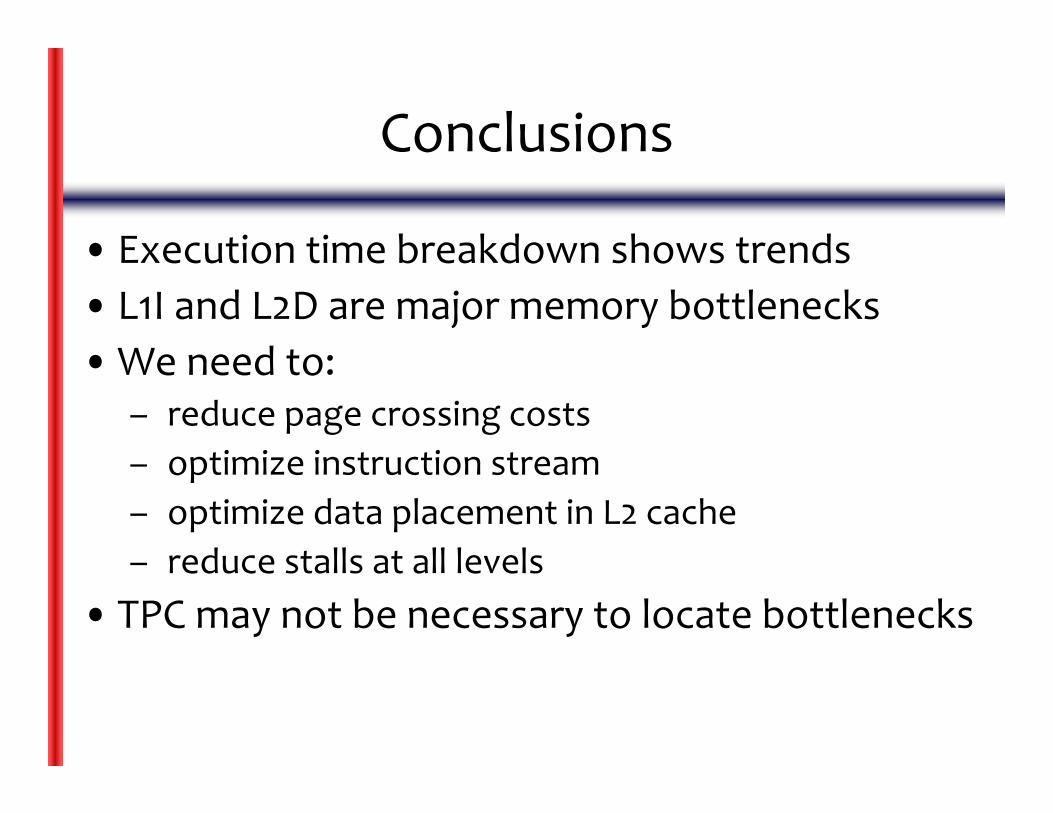
Conclusions
• Execution time breakdown shows trends• L1I and L2D are major memory bottlenecks•We need to:
– reduce page crossing costs– optimize instruction stream– optimize data placement in L2 cache– reduce stalls at all levels
• TPC may not be necessary to locate bottlenecks
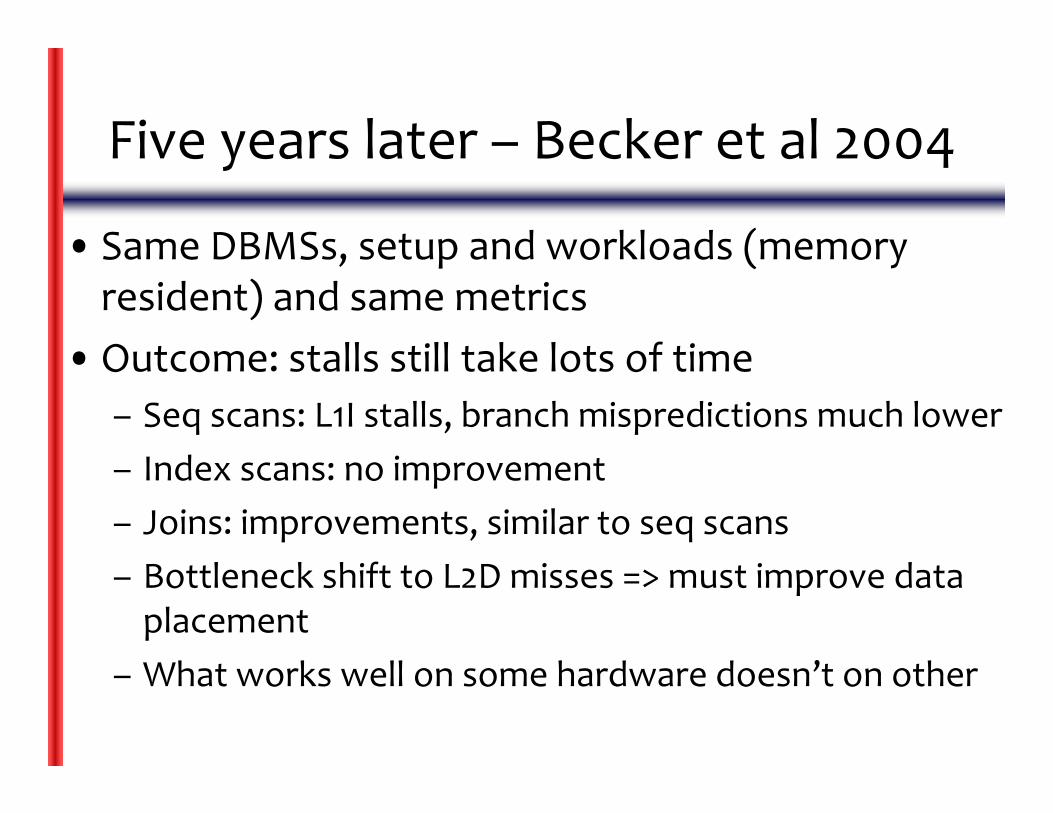
Five years later – Becker et al 2004
• Same DBMSs, setup and workloads (memory resident) and same metrics
•Outcome: stalls still take lots of time– Seq scans: L1I stalls, branch mispredictions much lower– Index scans: no improvement– Joins: improvements, similar to seq scans– Bottleneck shift to L2D misses => must improve data placement
– What works well on some hardware doesn’t on other

Five years later – Becker et al 2004
• C on a Quad P3 700MHz, 4G RAM, 16K L1, 2M L2• B on a single P4 3GHz, 1G RAM, 8K L1D + 12KuOp trace
cache, 512K L2, BTB 8x than P3
• P3 results:– Similar to 5 years ago: major bottlenecks are L1I and L2D
• P4 results:– Memory stalls almost entirely due to L1D and L2D stalls – L1D stalls higher ‐ smaller cache and larger cache line– L1I stalls removed due to trace cache (esp. for seq. scan, but
still some for index)
Hardware – awareness is important !
References
•DBMS on a modern processor: where does time go? Revisited – CMU Tech Report 2004
• Anastassia Ailamaki – VLDB’99 talk slides
Questions?