Embed Size (px)
Citation preview

Smart Measurement Solutions
Bode 100 - Application Note DC/DC Converter Stability Measurement
Page 1 of 15
DC/DC Converter
Stability Measurement
Strongly supported by
By Stephan Synkule, Lukas Heinzle & Florian Hämmerle
© 2013 Omicron Lab – V2.0 Visit www.omicron-lab.com for more information. Contact [email protected] for technical support.

Smart Measurement Solutions
Bode 100 - Application Note DC/DC Converter Stability Measurement
Page 2 of 15
Table of Contents
1 Introduction .................................................................................................................3
2 Measurement Setup ....................................................................................................4
2.1 The Circuit under Test .............................................................................................4
2.2 Selecting the Injection Point ....................................................................................5
2.3 Connecting the Bode 100 ........................................................................................6
2.4 Phase Margin and Gain Margin ...............................................................................8
3 Device Configuration ..................................................................................................9
4 Measurement & Results ............................................................................................ 10
4.1 Calibration ............................................................................................................. 10
4.2 Shaped Level ........................................................................................................ 11
4.3 Measurement Level ............................................................................................... 13
4.4 Supply Voltage Influence ....................................................................................... 14
4.5 Load Current Influence .......................................................................................... 14
5 Conclusion ................................................................................................................. 15
Note: Basic procedures such as setting-up, adjusting and calibrating the Bode 100 are described in the Bode 100 user manual.
Note: All measurements in this application note have been performed with the
Bode Analyzer Suite V2.32. Use this version or a higher version to perform the measurements detailed in this application note. You can download the latest version at http://www.omicron-lab.com/downloads.html.

Smart Measurement Solutions
Bode 100 - Application Note DC/DC Converter Stability Measurement
Page 3 of 15
1 Introduction
This application note shows how to analyze the stability respectively the control loop behavior of a step-down DC/DC converter. For the characterization of the loop response we use the voltage injection method which is widely used to analyze the stability of switched mode power supplies. To minimize the influence of supply voltage variations and load changes on the output voltage of a DC/DC converter, a compensating controller is necessary. The quality of this control circuit determines the stability and dynamic response of the entire DC/DC converter system. The following pages show you how you can measure the loop response of such control systems using the Bode 100 in combination with the B-WIT 100 wideband injection transformer. All measurements in this application note were performed using the Linear Technology demo circuit 481A. The 481A contains the LTC1976IFE step-down converter chip. Based on measurements on this demo board the following points are discussed in this document:
Setup for the signal injection into the control loop
Stability analysis of the control loop including the determination of gain margin and phase margin
Analysis of influences caused by supply voltage and load changes
Using the shaped level feature of the Bode 100 to improve the measurement results
Detailed information on the demo circuit can be found at http://www.linear.com.

Smart Measurement Solutions
Bode 100 - Application Note DC/DC Converter Stability Measurement
Page 4 of 15
2 Measurement Setup
2.1 The Circuit under Test
The demo board 481A is a step-down converter using the LT1976. The output is
optimized for at a load current of . The following figure shows the schematics of the demo board 481A.
Figure 1: LT 481A demo board schematics

Smart Measurement Solutions
Bode 100 - Application Note DC/DC Converter Stability Measurement
Page 5 of 15
2.2 Selecting the Injection Point
In order to measure the loop gain of a voltage feedback loop we need to break the loop at a suitable point and inject a disturbance signal at this point. The disturbance signal will be distributed around the loop and depending on the loop gain the signal will be amplified or attenuated and shifted in phase. The Bode 100 output will provide the disturbance signal whereas the inputs will measure the transfer function of the loop. To ensure that the measured loop gain equals the real loop gain we need to find a point where the loop is restricted to one single path and where the impedance looking in the direction of the loop is much bigger than the impedance looking backwards. The following figure shows the feedback loop of the circuit and indicates the suitable injection point. The impedance looking backwards equals the output impedance of the
converter which is very low (in the range of several ). The impedance looking in direction of the loop is formed by the compensator and the voltage divider and is in the
range of several .
Figure 2: Feedback loop and injection point
More details on the selection of the injection point and the theory of the voltage injection method can be found in the article “Loop Gain Measurement” which is available for download at: http://www.omicron-lab.com/bode-100/application-notes-know-how/articles-use-cases.html#3

Smart Measurement Solutions
Bode 100 - Application Note DC/DC Converter Stability Measurement
Page 6 of 15
2.3 Connecting the Bode 100
We have selected the injection point and now need to break the loop at this point. To ensure that the measurement does not change our system behavior we place a small resistor at the injection point that does not significantly change the feedback divider. In
this case we use a resistor. The disturbance voltage is applied in parallel to the injection resistor using the B-WIT 100 injection transformer. The transformer is necessary to isolate the output of the Bode 100 from the DC operating point of the feedback loop. The following figure shows how the Bode 100 is connected to the circuit.
Figure 3: Connecting the Bode 100 to measure the loop response
The inputs of the Bode 100 are connected to either side of the injection transformer. CH1 measures the disturbance signal that is applied to the feedback divider and CH2 measures the signal that appears at the output of the converter. By dividing the voltage at CH2 by the voltage at CH1 we get the transfer function from the feedback input to the output of the power supply. This transfer function we call the loop gain .
In this case we use 10:1 probes to pick up the signals but any standard oscilloscope probe can be used for this measurement. Attention: If hazardous voltages are present, make sure that suitable probes are
used to protect operator and device from any dangerous voltage !

Smart Measurement Solutions
Bode 100 - Application Note DC/DC Converter Stability Measurement
Page 7 of 15
To ensure good measurement results it is strongly recommended to place the injection resistor, the injection transformer and the probes close to the circuit to keep leads short. Furthermore, it is very important to avoid mechanical stress at soldering pads to prevent damage to the test object. The following figures show how we have realized the modification on the demo board and how the probes and the injection transformer are connected to the circuit.
Figure 4: Demo board prepared for connection
Figure 5: The probes and the injection transformer connected to the circuit

Smart Measurement Solutions
Bode 100 - Application Note DC/DC Converter Stability Measurement
Page 8 of 15
Figure 6: Measurement setup with power supply, resistive load, Ampere meter and Bode 100
2.4 Phase Margin and Gain Margin
According to Nyquist, the stability of a feedback system can be verified by checking two critical points. These are the Gain crossover point where the Phase Margin is measured and the Phase crossover point where the Gain Margin is determined. Note: When analyzing the open loop gain for stability as it is done in text-books,
positive feedback occurs at -180° phase. In this measurement we measure the open loop gain in a closed loop system. The phase margin must therefore be measured relatively to the 0° line. Maybe this is somehow confusing but you can try to imagine a signal that is injected at the feedback input and appears at the output without phase shift. Such a signal that passed the loop with 0° phase will again be injected at the feedback and sum up with the previous one. This is exactly the point where positive feedback and therefore instability will occur in a negative feedback system.

Smart Measurement Solutions
Bode 100 - Application Note DC/DC Converter Stability Measurement
Page 9 of 15
3 Device Configuration
In order to measure the transfer function of the loop we need to set up the Bode 100 correctly. The measurement of the loop gain is performed in the Frequency Sweep mode of the Bode Analyzer Suite: Open the device configuration window and apply the following settings: The external reference is switched on and both inputs are set to high impedance.
The following settings are applied: Start Frequency: 100 Hz
Stop Frequency: 200 kHz
Sweep Mode: Logarithmic
Number of Points: 201 or more
Level: -20 dBm
Attenuator CH1&CH2: 0 dB
Receiver Bandwidth: 30 Hz

Smart Measurement Solutions
Bode 100 - Application Note DC/DC Converter Stability Measurement
Page 10 of 15
Trace 1 & 2 are set up as shown below to display a Bode-plot:
4 Measurement & Results
4.1 Calibration
We first check if a calibration is necessary for this measurement. Calibration would be necessary if the two probes used to connect the Bode 100 to the circuit have different frequency response introducing different phase shift or attenuation. In order to check, we connect both probes to the same side of the injection resistor as shown in the picture below.
Figure 7: Connection for calibration

Smart Measurement Solutions
Bode 100 - Application Note DC/DC Converter Stability Measurement
Page 11 of 15
After connecting the probes we start a measurement by pressing the single sweep button. The measurement shows a flat line at 0dB and 0° which indicates that both probes have the same frequency response and calibration is not necessary in this case.
Figure 8: THRU Measurement result
Note: If this measurement shows a gain or phase different from 0dB and 0°, this difference can be compensated by performing a THRU calibration. Details on the THRU calibration of the Bode 100 can be found in the Bode 100 User Manual.
4.2 Shaped Level
We perform the first stability measurement with a supply voltage of and a load current of . Please do not use electronic loads for frequency response measurements as the control circuit of the electronic load could interfere with the circuit under test. Starting a frequency sweep leads to the following bode-plot.
-60
-40
-20
0
20
40
60
-150
-100
-50
0
50
100
150
102 103 104 105
TR
1/d
B TR
2/°
f/HzTR1: Mag(Gain) TR2: Phase(Gain)
-60
-40
-20
0
20
40
60
-150
-100
-50
0
50
100
150
102 103 104 105
TR
1/d
B TR
2/°
f/HzTR1: Mag(Gain) TR2: Phase(Gain)

Smart Measurement Solutions
Bode 100 - Application Note DC/DC Converter Stability Measurement
Page 12 of 15
The red line shows the gain magnitude and the blue curve the gain phase. To reduce the noise in the low frequency range we use the shaped level feature of the Bode 100. On the left hand side in the Bode Analyzer Suite, click on the arrow right to the Level and select “Shaped Level”. A “Shaped Level” button will appear. By clicking this button the shaped level can be entered in the Shaped Level window.
We set the reference level to -20dBm and increase the output level from 100Hz to 500Hz from -20dBm to 0dBm by entering a delta level of +20dB.
Smart Measurement Solutions
Bode 100 - Application Note DC/DC Converter Stability Measurement
Page 13 of 15
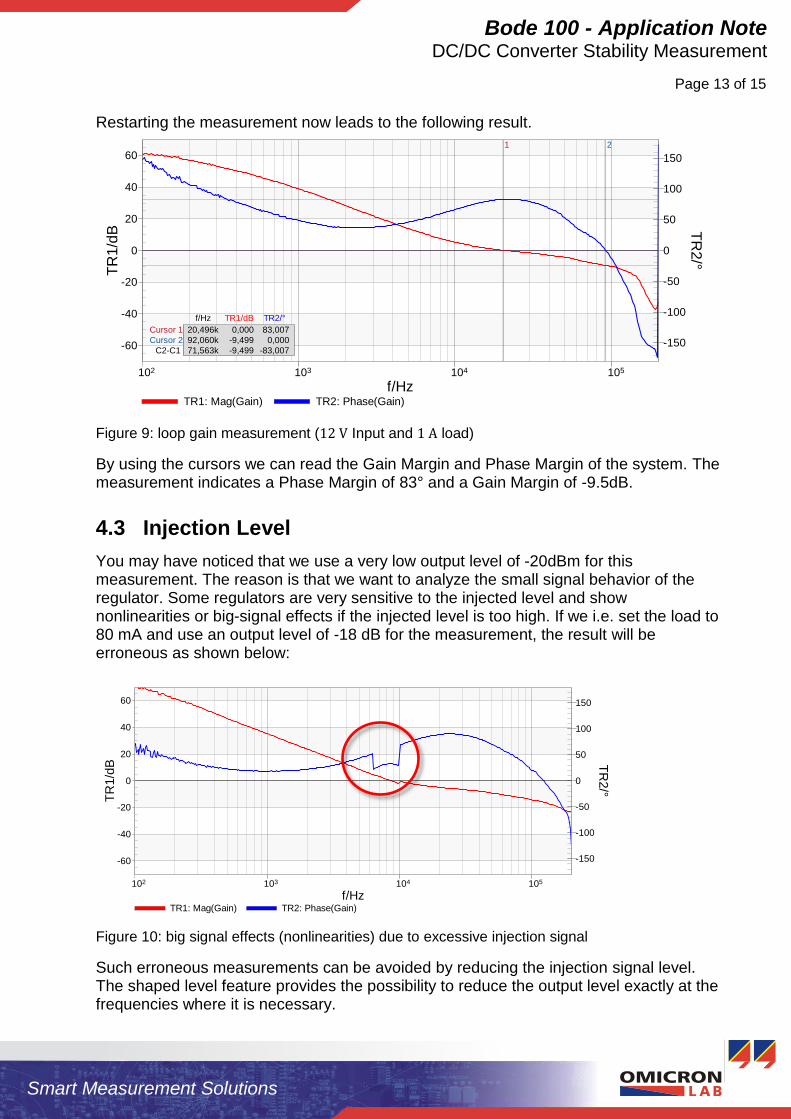
Restarting the measurement now leads to the following result.
Figure 9: loop gain measurement ( Input and load)
By using the cursors we can read the Gain Margin and Phase Margin of the system. The measurement indicates a Phase Margin of 83° and a Gain Margin of -9.5dB.
4.3 Injection Level
You may have noticed that we use a very low output level of -20dBm for this measurement. The reason is that we want to analyze the small signal behavior of the regulator. Some regulators are very sensitive to the injected level and show nonlinearities or big-signal effects if the injected level is too high. If we i.e. set the load to 80 mA and use an output level of -18 dB for the measurement, the result will be erroneous as shown below:
Figure 10: big signal effects (nonlinearities) due to excessive injection signal
Such erroneous measurements can be avoided by reducing the injection signal level. The shaped level feature provides the possibility to reduce the output level exactly at the frequencies where it is necessary.
f/Hz TR1/dB TR2/°
Cursor 1 20,496k 0,000 83,007
Cursor 2 92,060k -9,499 0,000
C2-C1 71,563k -9,499 -83,007
1 2
-60
-40
-20
0
20
40
60
-150
-100
-50
0
50
100
150
102 103 104 105
TR
1/d
B TR
2/°
f/HzTR1: Mag(Gain) TR2: Phase(Gain)
-60
-40
-20
0
20
40
60
-150
-100
-50
0
50
100
150
102 103 104 105
TR
1/d
B TR
2/°
f/HzTR1: Mag(Gain) TR2: Phase(Gain)

Smart Measurement Solutions
Bode 100 - Application Note DC/DC Converter Stability Measurement
Page 14 of 15
4.4 Supply Voltage Influence
With our next measurement we will check how supply voltage changes influence the characteristic of the LT1976 control circuit.
To do so, we change the supply voltage to . Restarting the sweep and placing the cursors again at the 0dB and 0° points leads to the following graph.
Figure 11: loop gain measurement ( Input and load)
The phase margin did decrease to 37° whereas the gain margin did increase to 25.4dB.
4.5 Load Current Influence
By varying the load current and keeping the supply voltage of the regulator constant we can check the sensitivity of the system to different load currents. The following graph shows the loop gain measurement at different load currents. All measurements were
performed with a supply voltage of .
Figure 12: loop gain depending on load current
f/Hz TR1/dB TR2/°
Cursor 1 10,521k 0,000 36,992
Cursor 2 81,025k -25,385 0,000
C2-C1 70,504k -25,385 -36,992
1 2
-60
-40
-20
0
20
40
60
-150
-100
-50
0
50
100
150
102 103 104 105
TR
1/d
B TR
2/°
f/HzTR1: Mag(Gain) TR2: Phase(Gain)
-60
-40
-20
0
20
40
60
80
-200
-150
-100
-50
0
50
100
150
200
102 103 104 105
TR
1/d
B TR
2/°
f/Hz100mA : Mag(Gain) 500mA : Mag(Gain)1000mA : Mag(Gain) 100mA : Phase(Gain)500mA : Phase(Gain) 1000mA : Phase(Gain)

Smart Measurement Solutions
Bode 100 - Application Note DC/DC Converter Stability Measurement
Page 15 of 15
5 Conclusion
The Bode 100 in combination with the B-WIT 100 injection transformer offers a perfect toolkit to easily measure the gain margin and phase margin of control systems such as switched mode power supplies. Gain margin and phase margin are widely accepted indicators for the stability of a control loop. Furthermore, the Bode Analyzer Suite provides all necessary features to display the influence of i.e. supply voltage or load current changes which provide detailed information on the dynamic behavior of a DC/DC converter in various operating conditions.