Embed Size (px)
Citation preview
Data Center Services Consolidation Measurement Report
Texas Department of Information Resources
February 27, 2015


Contents Executive Summary ....................................................................................................................................... 1
Background ............................................................................................................................................... 1
Consolidation Measurement Report ........................................................................................................ 2
Baseline Assessment of Financial Performance ............................................................................................ 4
Program Performance ............................................................................................................................... 4
Fiscal Year 2014 Unit Rate Analysis .............................................................................................................. 6
Transition and Transformation ..................................................................................................................... 9
Consolidation Progress ............................................................................................................................... 10
Consolidation Status ............................................................................................................................... 10
DCS Program Progress ............................................................................................................................ 10
Conclusion ................................................................................................................................................... 12
Appendix A – Unit Rate Analysis Methodology .......................................................................................... 13
Methodology ........................................................................................................................................... 13
Base Rates ............................................................................................................................................... 14
Inclusion/Exclusion of Resource Units .................................................................................................... 14
Appendix B – Detailed Unit Rate Analysis ................................................................................................... 16
Mainframe .............................................................................................................................................. 16
Print-Mail ................................................................................................................................................ 16
Consolidated Server ................................................................................................................................ 17
Consolidated Server Storage & Tape .................................................................................................. 17
DBaaS (Database as a Service) ............................................................................................................ 18
Non-Consolidated Servers ...................................................................................................................... 18
Non-Consolidated Server Storage & Tape .......................................................................................... 19
Appendix C – DCS Customer Analysis ......................................................................................................... 20
Department of Aging and Disability Services (DADS) ............................................................................. 20
Department of Assistive and Rehabilitative Services (DARS) ................................................................. 21
Department of Family and Protective Services (DFPS) ........................................................................... 22
Department of Information Resources - Agency (DIR-A) ........................................................................ 23
Department of Information Resources – Texas.gov (DIR-TX.gov) .......................................................... 24
Department of State Health Services (DSHS) .......................................................................................... 25
Health and Human Services Commission (HHSC) ................................................................................... 26
Health Professions Council (HPC) ........................................................................................................... 27
Office of the Attorney General – Administration & Legal Division (OAG-AL) ......................................... 28
Office of the Attorney General – Child Support Division (OAG-CS) ........................................................ 29
Public Utility Commission (PUC) ............................................................................................................. 30
Railroad Commission of Texas (RRC) ...................................................................................................... 31
Secretary of State (SOS) .......................................................................................................................... 32
Texas Alcoholic Beverage Commission (TABC) ....................................................................................... 33
Texas Board of Architectural Examiners (TBAE) ..................................................................................... 34
Texas Commission on Environmental Quality (TCEQ) ............................................................................ 35
Texas Department of Agriculture (TDA).................................................................................................. 36
Texas Department of Criminal Justice (TDCJ) ......................................................................................... 37
Texas Department of Insurance (TDI) ..................................................................................................... 38
Texas Department of Licensing and Regulation (TDLR) .......................................................................... 39
Texas Education Agency (TEA) ................................................................................................................ 40
Texas Facilities Commission (TFC) ........................................................................................................... 41
Texas Higher Education Coordinating Board (THECB) ............................................................................ 42
Texas Juvenile Justice Department (TJJD) ............................................................................................... 43
Texas Military Department (TMD) .......................................................................................................... 44
Texas Parks and Wildlife Department (TPWD) ....................................................................................... 45
Texas State Library and Archives Commission (TSLAC) .......................................................................... 46
Texas Veterans Commission (TVC) .......................................................................................................... 47
Texas Workforce Commission (TWC) ...................................................................................................... 48
Texas Water Development Board (TWDB) ............................................................................................. 49
Texas Department of Motor Vehicles (TXDMV) ..................................................................................... 50
Texas Department of Transportation (TXDOT) ....................................................................................... 51
Texas Racing Commission (TXRC) ........................................................................................................... 52
Appendix D – Definition of Terms ............................................................................................................... 53
Acknowledgements ..................................................................................................................................... 54

TEXAS DEPARTMENT OF INFORMATION RESOURCES | DCS CONSOLIDATION MEASUREMENT REPORT 1
Executive Summary
Background In 2005, the 79th Legislature passed House Bill 1516, directing the Texas Department of Information
Resources (DIR) to consolidate agencies’ information technology (IT) infrastructure to reduce statewide
costs for IT services, modernize aging state infrastructure, and increase overall security and disaster
recovery capability. The goal of the legislation was to reduce overall taxpayer costs by consolidating and
standardizing IT infrastructure, products, and services across agencies with large IT investments.
Additionally, the State sought to achieve reductions in risk associated with disaster recovery, security,
backup of critical state data and system assets, and to stay current with best practices that accrue from
a public private partnership capability.
In 2006, 29 state agencies were selected and DIR released a request for offer to outsource the
management of these agencies’ IT infrastructure, while consolidating from over 31 disparate, legacy
data centers into two highly secure, redundant data centers in Austin and San Angelo, Texas. With the
participation of all designated agencies, DIR entered into a seven-year contract in 2007. In 2010 DIR
decided to re-procure and re-structure data center services into a service integration model with
multiple Service Component Providers (SCP) and a Multisourcing Service Integrator (MSI) that
positioned the state to achieve more flexibility, accountability, and capabilities.
The DCS program currently serves 32 state agencies: 28 designated state agencies with fully managed
mainframe, server, and bulk print-mail services, three agencies with email only services, and one agency
with print-mail only services. Fully managed services means that DIR and its vendor partners work
together to provide all the hardware, software, tools, and technical staff to fully support IT
infrastructure. DCS services are available for all Texas state agencies, colleges, and universities, and with
the passage of Senate Bill 866 by the 83rd Legislature, DIR is authorized to offer data center services to
local entities. These services include disaster recovery, backup, monitoring, security, storage,
production control, data center network, architecture design, capacity management, operating system
support, hardware refresh, and facilities.
Data center services are a foundational component of technology and, as such, are necessary for every
state agency, college, university, and local government. As Texas experiences rapid population and
economic growth, state governmental entities must deliver more services with greater efficiency to an
increasing number of citizens. As a result, the state is progressively investing in IT infrastructure to
accomplish many goals. These goals include more effectively supporting business operations, pursuing
cost efficiencies, providing secure and innovative ways for citizens to interact with the State, enhancing
the digital experience of government services, and supporting open data initiatives to gain insights into
how government works. As governments are challenged to do more with less, the option to outsource
their infrastructure becomes increasingly necessary to achieve economies of scale. The DCS program
provides a strong foundation for an ever-growing and enhanced set of IT services by enabling state
agencies to meet these demands by leveraging the capabilities of a strong technology infrastructure.
TEXAS DEPARTMENT OF INFORMATION RESOURCES | DCS CONSOLIDATION MEASUREMENT REPORT 2
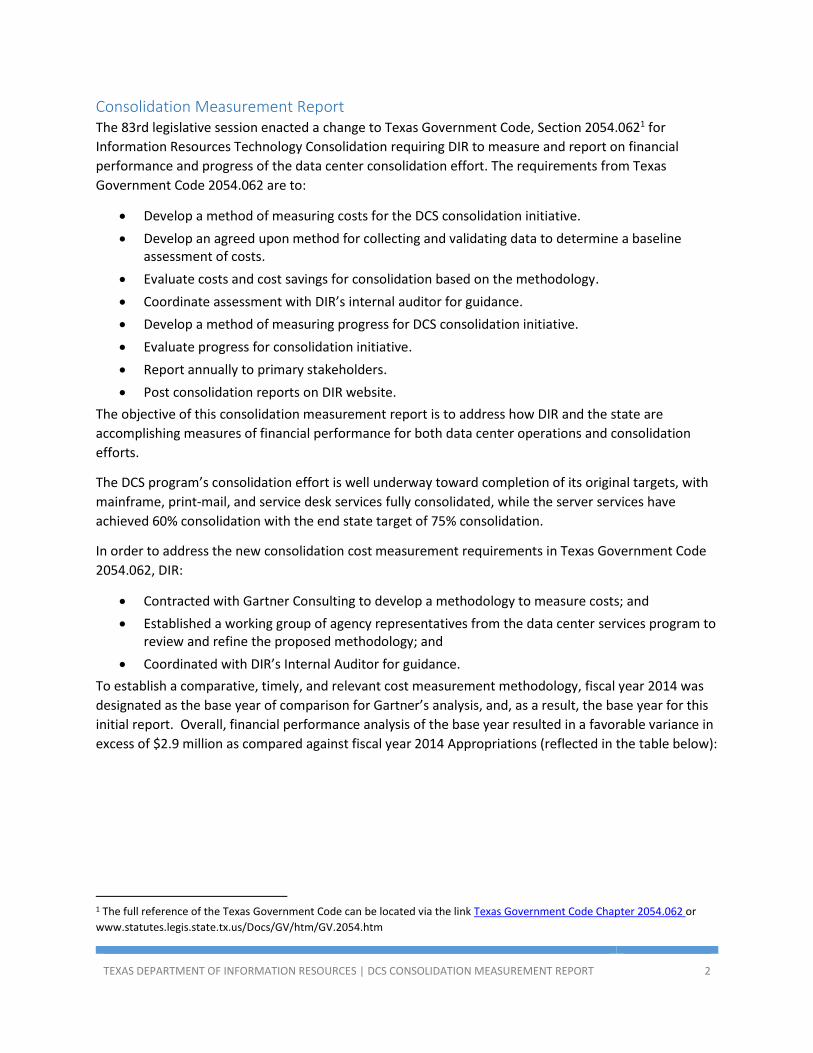
Consolidation Measurement Report The 83rd legislative session enacted a change to Texas Government Code, Section 2054.0621 for
Information Resources Technology Consolidation requiring DIR to measure and report on financial
performance and progress of the data center consolidation effort. The requirements from Texas
Government Code 2054.062 are to:
Develop a method of measuring costs for the DCS consolidation initiative.
Develop an agreed upon method for collecting and validating data to determine a baseline assessment of costs.
Evaluate costs and cost savings for consolidation based on the methodology.
Coordinate assessment with DIR’s internal auditor for guidance.
Develop a method of measuring progress for DCS consolidation initiative.
Evaluate progress for consolidation initiative.
Report annually to primary stakeholders.
Post consolidation reports on DIR website.
The objective of this consolidation measurement report is to address how DIR and the state are
accomplishing measures of financial performance for both data center operations and consolidation
efforts.
The DCS program’s consolidation effort is well underway toward completion of its original targets, with
mainframe, print-mail, and service desk services fully consolidated, while the server services have
achieved 60% consolidation with the end state target of 75% consolidation.
In order to address the new consolidation cost measurement requirements in Texas Government Code
2054.062, DIR:
Contracted with Gartner Consulting to develop a methodology to measure costs; and
Established a working group of agency representatives from the data center services program to review and refine the proposed methodology; and
Coordinated with DIR’s Internal Auditor for guidance.
To establish a comparative, timely, and relevant cost measurement methodology, fiscal year 2014 was
designated as the base year of comparison for Gartner’s analysis, and, as a result, the base year for this
initial report. Overall, financial performance analysis of the base year resulted in a favorable variance in
excess of $2.9 million as compared against fiscal year 2014 Appropriations (reflected in the table below):
1 The full reference of the Texas Government Code can be located via the link Texas Government Code Chapter 2054.062 or
www.statutes.legis.state.tx.us/Docs/GV/htm/GV.2054.htm

TEXAS DEPARTMENT OF INFORMATION RESOURCES | DCS CONSOLIDATION MEASUREMENT REPORT 3
Table 1. Fiscal Year 2014 Appropriated versus Actual
Appropriated Actual Variance
Fiscal Year 2014 Total $193,453,955 $190,535,214 $2,918,742
Note: The Appropriated amount for fiscal year 2014 reflects the original amount appropriated
directly for DCS services in capital budget appropriations. Unexpended balances remaining in
fiscal year 2014 are appropriated for fiscal year 2015 for the same purpose, in accordance with
the General Appropriations Act, Article IX, Sec. 14.03.
This consolidation measurement report provides analysis and insight into the following elements of the
DCS program:
1. Baseline assessment of total DCS program spend
Actual annual spend versus appropriated amounts at the agency and program level.
Actual annual spend by service category. 2. Unit rate impact analysis
Analysis of the impact of changes in service volumes to the billable rates and total extended charges.
3. Transition and Transformation investments
A financial summary of one-time investments required to transition services and transform the legacy IT environment to improve service and reduce ongoing support costs.
4. DCS consolidation progress
Current status of consolidation initiatives.
Description of DCS program accomplishments.
The content of this report provides multiple views of the DCS program financial performance as the DCS
program is highly complex and has experienced dynamic growth, changes between and among DCS
services, and strategic investments to support an ongoing consolidation effort.

TEXAS DEPARTMENT OF INFORMATION RESOURCES | DCS CONSOLIDATION MEASUREMENT REPORT 4
Baseline Assessment of Financial Performance
Program Performance For fiscal year 2014, the DCS program is performing favorably against the financial plan. The fiscal year
2014 appropriations to agencies participating in the DCS program was in excess of $193 million, while
actual spend was under $191 million, i.e., actual spending for fiscal year 2014 was approximately $2.9
million less than the appropriated amount.
The table below shows the actual fiscal year 2014 expenditures against the fiscal year 2014
appropriations for the main billing categories within the DCS program.
Table. 2 Enterprise Billing Categories View
Main Billing Categories Fiscal Year 2014 Actuals
Mainframe Services $36,823,753
Print-Mail Services $16,674,925
Server Services $50,178,553
Server Storage and Tape Services $43,335,420
Server Hardware and Software $29,123,250
Transition and Transformation Services $10,182,476
Other $4,216,836
TOTAL: $190,535,214
TOTAL APPROPRIATION: $193,453,955
VARIANCE: $2,918,742
In fiscal year 2014, the DCS program was managed within the allocated appropriations (1.5% below
appropriation expectations). The Detailed Unit Rate Analysis is documented in Appendix B. Individual
DCS customer analyses are documented in Appendix C.
The following are high-level descriptions of the main billing categories:
Mainframe Services. The compute processing and storage services for applications hosted on a mainframe computer.
Print-Mail Services. Bulk printing and mailing services that includes printings, mail insertion, and courier services.
Server Services. The compute processing for application and utility services hosted in the consolidated and non-consolidated server environments. Server support DCS customer applications for both internal functions (e.g., financial systems, human resources), as well as applications that directly support and provide services to constituents.
Server Storage & Tape Services. The data storage and backup services for the consolidated and non-consolidated server environments. Data storage includes both the dynamic data used by

TEXAS DEPARTMENT OF INFORMATION RESOURCES | DCS CONSOLIDATION MEASUREMENT REPORT 5
DCS customer applications (e.g., financial records, customer databases), as well as static files and images.
Server Hardware and Software. Hardware Service Charge, Software Service Charge, and Rate Card Hours. The Hardware Service Charge (HSC) is for purchases of new servers for DCS customers’ dedicated use. The Software Service Charge (SSC) is for specific categories of software procured for DCS customers. Rate Card Hours are for project personnel resources provided on an hourly basis by the service providers.
Transition and Transformation Milestones. Transition services are associated with moving from one outsourced environment to another outsourced environment, including knowledge transfer, process documentation, and wall-to-wall inventory. Transformation services are related to upgrading and consolidating the IT operating environment.
Other. This category captures costs that are not part of any of the above main categories. Examples of some of the costs captured in this category include Database as a Service (DBaaS), Optical Storage capabilities, as well as Co-Location services.
TEXAS DEPARTMENT OF INFORMATION RESOURCES | DCS CONSOLIDATION MEASUREMENT REPORT 6
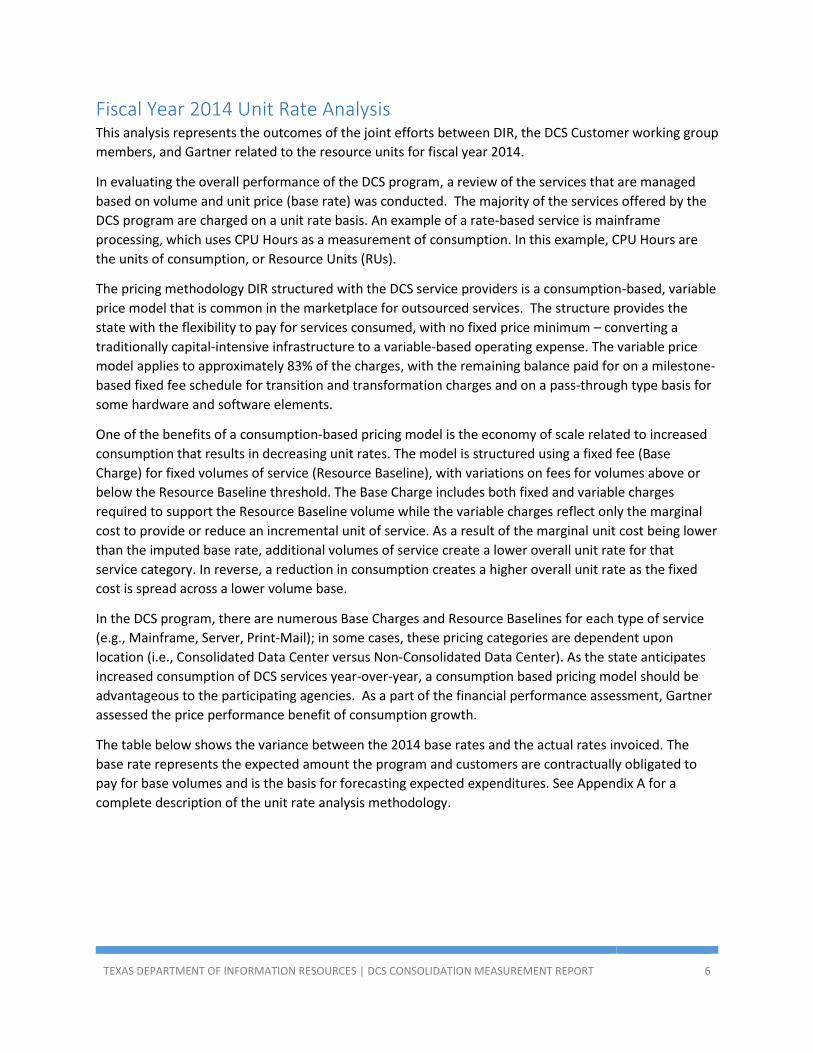
Fiscal Year 2014 Unit Rate Analysis This analysis represents the outcomes of the joint efforts between DIR, the DCS Customer working group
members, and Gartner related to the resource units for fiscal year 2014.
In evaluating the overall performance of the DCS program, a review of the services that are managed
based on volume and unit price (base rate) was conducted. The majority of the services offered by the
DCS program are charged on a unit rate basis. An example of a rate-based service is mainframe
processing, which uses CPU Hours as a measurement of consumption. In this example, CPU Hours are
the units of consumption, or Resource Units (RUs).
The pricing methodology DIR structured with the DCS service providers is a consumption-based, variable
price model that is common in the marketplace for outsourced services. The structure provides the
state with the flexibility to pay for services consumed, with no fixed price minimum – converting a
traditionally capital-intensive infrastructure to a variable-based operating expense. The variable price
model applies to approximately 83% of the charges, with the remaining balance paid for on a milestone-
based fixed fee schedule for transition and transformation charges and on a pass-through type basis for
some hardware and software elements.
One of the benefits of a consumption-based pricing model is the economy of scale related to increased
consumption that results in decreasing unit rates. The model is structured using a fixed fee (Base
Charge) for fixed volumes of service (Resource Baseline), with variations on fees for volumes above or
below the Resource Baseline threshold. The Base Charge includes both fixed and variable charges
required to support the Resource Baseline volume while the variable charges reflect only the marginal
cost to provide or reduce an incremental unit of service. As a result of the marginal unit cost being lower
than the imputed base rate, additional volumes of service create a lower overall unit rate for that
service category. In reverse, a reduction in consumption creates a higher overall unit rate as the fixed
cost is spread across a lower volume base.
In the DCS program, there are numerous Base Charges and Resource Baselines for each type of service
(e.g., Mainframe, Server, Print-Mail); in some cases, these pricing categories are dependent upon
location (i.e., Consolidated Data Center versus Non-Consolidated Data Center). As the state anticipates
increased consumption of DCS services year-over-year, a consumption based pricing model should be
advantageous to the participating agencies. As a part of the financial performance assessment, Gartner
assessed the price performance benefit of consumption growth.
The table below shows the variance between the 2014 base rates and the actual rates invoiced. The
base rate represents the expected amount the program and customers are contractually obligated to
pay for base volumes and is the basis for forecasting expected expenditures. See Appendix A for a
complete description of the unit rate analysis methodology.

TEXAS DEPARTMENT OF INFORMATION RESOURCES | DCS CONSOLIDATION MEASUREMENT REPORT 7
Table 3. Summary by Resource Unit Group
Rate Based Billing Categories (Included) Contracted Base Costs
Actuals Variance
Mainframe Services $29,794,008 $29,446,860 $347,148
Print-Mail Services $16,498,518 $14,378,425 $2,120,093
Server Services
-Consolidated Server $24,953,227 $24,691,067 $262,160
-Non-Consolidated Server $24,171,187 $23,956,238 $214,949
-DBaaS $1,015,167 $1,041,781 ($26,614)
Server Storage & Tape Services
-Consolidated Server Storage and Tape $18,871,315 $18,896,054 ($24,738)
-Non-Consolidated Server Storage and Tape $24,164,860 $22,033,833 $2,131,028
Total: $139,468,283 $134,444,258 $5,024,025
The above summary demonstrates variability across the DCS program for fiscal year 2014 with a
primarily favorable outcome. The two primary drivers of the approximately $5 million price performance
benefit from volume growth are an increase in Print-Mail services due to the inclusion of Office of the
Attorney General’s Child Support Division’s (OAG-CS) print-mail volumes and the organic growth of
Server Storage and Tape. Analysis of the each service follows:
Mainframe. o Consumption of mainframe services was generally higher than the base rate
projection resulting in a favorable variance. The mainframe environment hosts large, legacy applications that are volume sensitive with the changes in population and increases in constituent services, including programs for the Texas Workforce Commission and Health and Human Services Commission.
Print-Mail o Print Images were more than double the base volume due to the inclusion of OAG-
CS volumes that had previously been exempted from the program. o Mail Insertions are about 30% higher than expected volumes, again, primarily as a
result of the additional OAG-CS volumes. Consolidated Server
o The volume increase of Consolidated Servers drove an overall lower unit cost. Intel server consumption saw growth throughout the year as a result of consolidation, refresh, and new applications. The impact of this increase in volumes in the lower cost Intel environment were offset to a degree by reduced consumption of UNIX servers as agencies migrated to lower cost platforms.
Non-Consolidated Server o Non-Consolidated Server volumes increased over the baseline primarily as a result
of slower than anticipated server consolidation to the Austin and San Angelo data centers. Although the increased volumes created a lower unit rate, the state would have realized a greater financial benefit if these servers had moved to the Consolidated Data Centers.

TEXAS DEPARTMENT OF INFORMATION RESOURCES | DCS CONSOLIDATION MEASUREMENT REPORT 8
Consolidated Server Storage and Tape o The unfavorable variance to fiscal year 2014 Base Rates shown on the summary
table above is primarily the result of significantly lower volumes in the Consolidated Tape Stored category. Although data storage volumes exceeded the base levels, creating a lower unit rate for SAN storage, the backup environment volumes were below baseline, partially due to improved consumption management through more disciplined backup policies.
Non-Consolidated Server Storage and Tape o The reduced unit rates due to increases in volumes over the contract baseline for
this RU Group is a result of both organic growth in data storage and backup as well as slower than anticipated server and storage consolidation to the Austin and San Angelo data centers. Although the increased volumes created a lower unit rate, the state would have realized a greater financial benefit if these storage and backup environments had moved to the Consolidated Data Centers.
A more detailed analysis of the results are included in the Appendix A.
TEXAS DEPARTMENT OF INFORMATION RESOURCES | DCS CONSOLIDATION MEASUREMENT REPORT 9
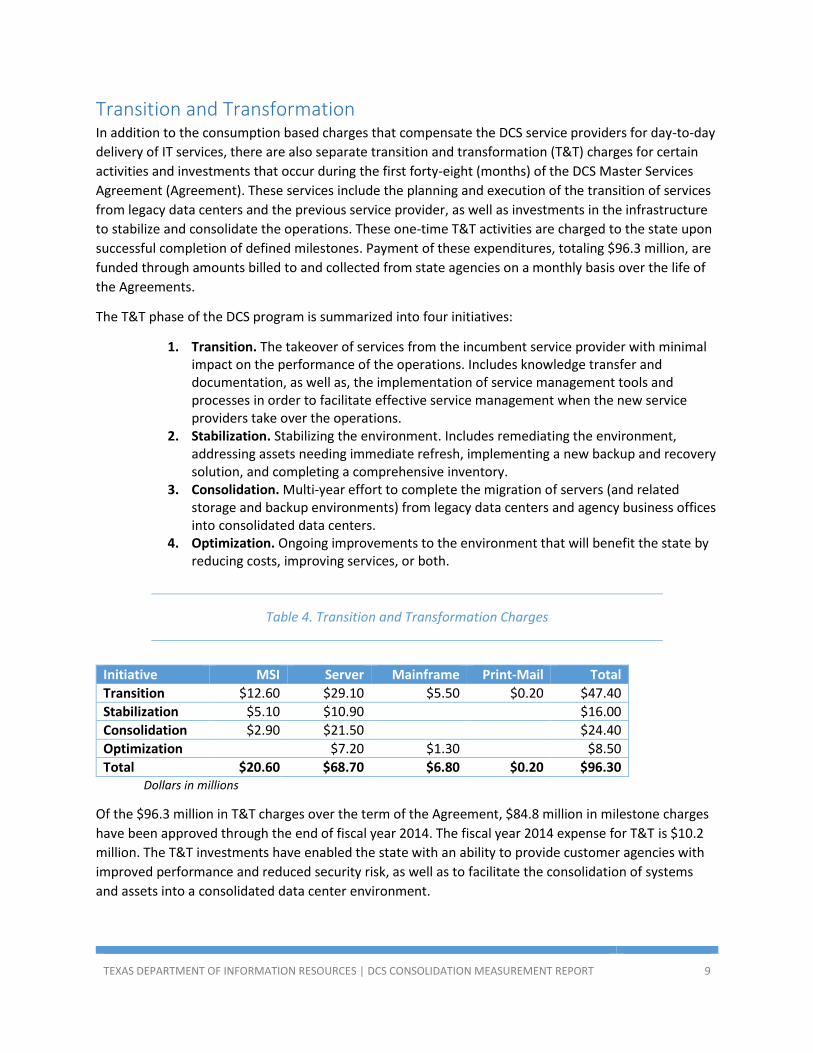
Transition and Transformation In addition to the consumption based charges that compensate the DCS service providers for day-to-day
delivery of IT services, there are also separate transition and transformation (T&T) charges for certain
activities and investments that occur during the first forty-eight (months) of the DCS Master Services
Agreement (Agreement). These services include the planning and execution of the transition of services
from legacy data centers and the previous service provider, as well as investments in the infrastructure
to stabilize and consolidate the operations. These one-time T&T activities are charged to the state upon
successful completion of defined milestones. Payment of these expenditures, totaling $96.3 million, are
funded through amounts billed to and collected from state agencies on a monthly basis over the life of
the Agreements.
The T&T phase of the DCS program is summarized into four initiatives:
1. Transition. The takeover of services from the incumbent service provider with minimal impact on the performance of the operations. Includes knowledge transfer and documentation, as well as, the implementation of service management tools and processes in order to facilitate effective service management when the new service providers take over the operations.
2. Stabilization. Stabilizing the environment. Includes remediating the environment, addressing assets needing immediate refresh, implementing a new backup and recovery solution, and completing a comprehensive inventory.
3. Consolidation. Multi-year effort to complete the migration of servers (and related storage and backup environments) from legacy data centers and agency business offices into consolidated data centers.
4. Optimization. Ongoing improvements to the environment that will benefit the state by reducing costs, improving services, or both.
Table 4. Transition and Transformation Charges
Initiative MSI Server Mainframe Print-Mail Total
Transition $12.60 $29.10 $5.50 $0.20 $47.40
Stabilization $5.10 $10.90 $16.00
Consolidation $2.90 $21.50 $24.40
Optimization $7.20 $1.30 $8.50
Total $20.60 $68.70 $6.80 $0.20 $96.30 Dollars in millions
Of the $96.3 million in T&T charges over the term of the Agreement, $84.8 million in milestone charges
have been approved through the end of fiscal year 2014. The fiscal year 2014 expense for T&T is $10.2
million. The T&T investments have enabled the state with an ability to provide customer agencies with
improved performance and reduced security risk, as well as to facilitate the consolidation of systems
and assets into a consolidated data center environment.

TEXAS DEPARTMENT OF INFORMATION RESOURCES | DCS CONSOLIDATION MEASUREMENT REPORT 10
Consolidation Progress
Consolidation Status Since its inception in 2007, the DCS program has met many of its objectives, including consolidation of
operations from disparate legacy data centers into the two consolidated data centers in Austin and San
Angelo. To date, the following consolidation progress has occurred:
Mainframe. 100% consolidated into the two state data centers with full redundancy and tested disaster recovery capability. The consolidation replaced 14 mainframes with seven new machines that have an increased capacity of 6,000 MIPS.
Print-Mail. 100% consolidated providing high speed print and bulk mail technology, resulting in reduced postage rates. The program currently prints over 230 million images annually and mails over 19 million items monthly. In 2013, the Office of the Attorney General’s Child Support Division was brought into the program. Their additional print volume lowered unit prices for all participating agencies, saving the state approximately $1 million the first year.
Server. The end state target for server consolidation is 75% of the designated agencies’ servers. The remaining 25% of servers are anticipated to remain non-consolidated to optimize performance and/or cost for select applications. As of January 6, 2015, over 60% of the server environment has been consolidated. This percentage equates to 6,100 servers with over three Petabytes of online storage and over 38 Petabytes longer-term storage. A hardware refresh program is in place to ensure the state’s assets remain current and supportable.
In order to achieve the intended financial and technical benefits of data center consolidation, the
program must continue to aggressively move servers into the state’s data centers.
DCS Program Progress DCS customer satisfaction, measured annually by a third party, has improved since the 2012 contract
restructure by an increase of 46 percentage points. With the new integrator and service provider
structure, numerous service delivery improvements have been achieved:
Service levels are measured and reported at the program level and at the individual agency level to incent service provider performance and customer satisfaction for each individual agency. Service level credits are assessed at the program level only to achieve lower overall pricing for services and consistent performance for all agencies. All service providers routinely attain rigorous service levels.
Agencies rate service provider performance on a monthly scorecard to complement the service level measurements and customer satisfaction surveys. These scorecard results show progressive improvement. In 2011, the agencies rated the prior service provider’s performance at an average of 1.8 on a 5-point scale. In April 2014, the agencies rated the current service providers’ performance at 3.5 (average) on a 5-point scale.
Security standards and practices have consistently met state and federal audit requirements. The consolidated state data centers have met Criminal Justice Information Security (CJIS), Internal Revenue System, and State Auditor’s Office security standards compliance.
The MSI portal is providing agencies transparency into service provider performance through reports, service level agreement measurements, and process documentation.
TEXAS DEPARTMENT OF INFORMATION RESOURCES | DCS CONSOLIDATION MEASUREMENT REPORT 11
The two consolidated data centers provide higher levels of security, newer technology, and more current software. The average number of critical incidents for the server environment has decreased over 50%, resulting in less time an application is down or unavailable.

TEXAS DEPARTMENT OF INFORMATION RESOURCES | DCS CONSOLIDATION MEASUREMENT REPORT 12
Conclusion
Per Texas Government Code 2054.062, DIR will prepare this Consolidation Measurement Report
annually. This first annual report presented multiple views of the financial performance of the DCS
program to capture the complexity and dynamic nature of the program, while capturing the progress
made towards the consolidation program.
To achieve the intended financial and technical benefits of data center consolidation, the program must
continue to move server resources into the state’s data centers. The objective is to achieve the 75
percent server consolidation target by August 2016. This aggressive target requires participation and
commitment from both the service providers and the agency customers.

TEXAS DEPARTMENT OF INFORMATION RESOURCES | DCS CONSOLIDATION MEASUREMENT REPORT 13
Appendix A – Unit Rate Analysis Methodology2
Methodology An analysis framework and timeline was established to meet the objectives of Government Code Sec.
2054.062. The framework included establishing a working team that consisted of representatives from
the DIR, a representative from each of the DCS five (5) partner groups, representing their agency
members, a representative from DIR Internal Audit, and assistance from Gartner, an independent third
party consulting firm.
Since this cost measurement effort is not an audit, the role of the DIR Internal Auditor was to provide
guidance and advice. Also, this effort was not intended to be a market price evaluation, but a
methodology to help address the mandate of Government Code Sec. 2054.062.
The methodology compares the actual enterprise and customer fiscal year 2014 invoiced volumes and
charges for services to a base rate. The base rate used represents the expected amount the enterprise
and customers are contractually obligated to pay for base volumes and is the basis for forecasting
expected expenditures. A comparison of the actual invoiced amounts against the base rate provides
one component of the financial performance assessment to help determine if DCS is meeting its
objectives.
Customers receive invoices from DIR for DCS services that are primarily (but not exclusively) rate-based.
“Rate-based service” refers to a service that has a base charge and base volume for each unit of
consumption. For instance, mainframe processing is a rate-based service. Mainframe is invoiced to
customers based on consumption of five rate based services or Resource Units (RUs): CPU Hours, CPU
hours Specialty Engine, Allocated Application DASD, Application Tapes in Storage VTS, and MF Offsite
Tape. For each customer consuming mainframe services, their actual monthly charges are based on the
number of units consumed of each RU for a particular month.
For the unit rate analysis, the model takes into consideration approximately 76% (roughly $145 Million
out of $191 Million) of the total amount invoiced by DIR to its customers. The 76% includes all of the
actual invoiced amounts for rate-based services. The remaining 24% (approximately $45 Million) of the
DCS invoice charges do not have a base rate against which to compare, and thus were excluded for
comparative purposes. Additional information on included and excluded RUs is contained in the
Inclusion/Exclusion of Resource Units section below.
At a customer summary level, this analysis considers what the customer’s actual monthly invoice was,
and compares it to a calculated amount that is based on the Base Rate. Actual invoiced amounts have
variable rates depending on the actual consumption of RUs at the program level. If consumption is
ahead of projections, the actual unit rate that is invoiced will be lower than the Base Rate. Conversely, if
program consumption is lower than projected, the actual unit rate invoiced will be higher than the Base
Rate.
2 Methodology and analysis provided by Gartner for DIR pursuant to DBITS Contract Number DIR-SDD-2042, Engagement 330024351.
TEXAS DEPARTMENT OF INFORMATION RESOURCES | DCS CONSOLIDATION MEASUREMENT REPORT 14
Base Rates The fiscal year 2014 Base Rate was determined to be the best comparator for the methodology as it
reflects initial contracted amounts adjusted for actual variances observed in the consolidation effort.
While these rates were established at the current contract inception, they are modified on an annual
basis based on consolidation progress. This meets the requirement of the section that “The department
shall use the data both in the department's initial cost projections and in any later cost comparison.”
The Base Rate used in this assessment is the average chargeback rate for the fiscal year (in this case
fiscal year 2014), excluding inflation factors (Economic Change Adjustment or ECA), for each resource
unit calculated by dividing the current year base charges (Attachment 4A of the contract) by the current
year base volumes (Attachment 4D of the current contract) for the service component providers (SCP)
and the Multisourcing Service Integrator (MSI) and then adding the MSI charges to the SCP rates
according to the current chargeback allocation methodology.
The formula for calculating the Base Rate is as follows:
(Base Charges from Attachment 4A / Base Volumes from Attachment 4-D)+MSI charges
In collaboration with the DCS agencies working team, it was determined that the fiscal year 2014 Base
Rates provide the best basis from which to make the comparison against actuals, as the fiscal year 2014
Base Rates reflects initial contracted amounts adjusted for actual variances observed in the
consolidation effort.
Inclusion/Exclusion of Resource Units The methodology started with the premise that as much of the costs as possible would be included in
the analysis. There is a need to be able to make a valid comparison against an outcome to garner
meaning for the analysis. Some new RUs that did not have an initial fiscal year 2014 Base Rate, but
subsequently had a rate established (i.e. New Service RU) were included, in addition to all the Base Rate
RUs. For these RUs (i.e. New Service), in lieu of the fiscal year 2014 Base Rate, the rate for first month
the RU was actually invoiced was used as its fiscal year 2014 Base Rate. These RUs include:
Database as a Service (DBaaS) Rates (Oct 2014)
Utility Server Instance Rates – a flat rate for certain volume (Sept 2013)
Consolidated Tape Written – (Sep 2014)
The charges that were excluded (charges without a Base Rate) from this assessment include:
Co-Location Services
Rate Card Services
Server Software Service Charges (New & Renewal)
Mainframe Software Service Charge (New & Renewal)
Miscellaneous charges
Optional Services
Public Cloud
Server Monitoring
Wide Area Network Services (WAAS/WAE)
Credits
TEXAS DEPARTMENT OF INFORMATION RESOURCES | DCS CONSOLIDATION MEASUREMENT REPORT 15
Service Level Credits
Custom Waste Credit
Delivery Point Validation
Optional Print/Mail Services

TEXAS DEPARTMENT OF INFORMATION RESOURCES | DCS CONSOLIDATION MEASUREMENT REPORT 16
Appendix B – Detailed Unit Rate Analysis3
Mainframe The Mainframe RU category is made up of five (5) resource units, which include:
CPU Hours CPU Hours Specialty Engine Allocated Application DASD Application Tapes in Storage VTS Mainframe Offsite Tape
Analysis: It was observed that Mainframe actual consumption was ahead of the fiscal year 2014 base
volume estimates for three of the five resource unit categories. And, CPU Hours, the largest invoicing
RU in this grouping, was ahead of the base volume for 9 months in fiscal year 2014. Also, CPU Hours
Specialty Engine and Mainframe Offsite Tape volumes were observed to be ahead of expectations for
the entire year.
It was also observed that Application Tapes in Storage VTS RU showed an unfavorable result for the
year; although this RU began trending up and above expectations for the last two (2) months of fiscal
year 2014.
The observed Allocated Application DASD RU was the only RU of this group that was behind expected
volumes and trending downward for fiscal year 2014.
The overall observation for the Mainframe RU category was that mainframe processing is growing
within the DCS program and, therefore, the supposition would be that this trending should provide for
an overall decline of the chargeback rates in this category moving forward.
Print-Mail The Print-Mail RU category is made up of three (3) resource units, which include:
Mail Insertions Courier Services Print Images
Analysis: It was observed that two of the three Print-Mail RUs, Mail Insertions and Print Images, were
significantly ahead of base volume estimates for fiscal year 2014 resulting in significantly more favorable
variances. And, it was also observed was that the only RU in this category that was lower than base
volume estimates was for the Courier Services RU.
Similar to the Mainframe RU group, it was observed that customer agencies leveraging the Print-Mail
services of the DCS program continue to increase their usage which results in improved chargeback rates
for this RU service.
3 Methodology and analysis provided by Gartner for DIR pursuant to DBITS Contract Number DIR-SDD-2042, Engagement 330024351.

TEXAS DEPARTMENT OF INFORMATION RESOURCES | DCS CONSOLIDATION MEASUREMENT REPORT 17
Consolidated Server The Consolidated Server RU category is made of seventeen (17) resource units which include:
Consolidated Intel Gold Consolidated Intel Silver Consolidated Intel Bronze Consolidated Unix Gold Consolidated Unix Silver Consolidated Unix Bronze Consolidated Email Enterprise File/Print MO365 – Exchange Plan 1 MO365 – Exchange Plan 2 MO365 – Office Suite E1 MO365 – Office Suite G1 MO365 – Kiosk Worker Plan 1 MO365 – Educational Workers A3 MO365 – Suite E3 MO365 – Suite G3 Enhanced Security Hosted Email
Analysis: It was observed that overall the Consolidated Server RUs are showing a favorable variance
triggered primarily by better than estimated base volumes. However, the observed results of the
individual RUs within this category show mixed results. For the Consolidated Intel Server categories,
Gold, Silver and Bronze, volumes observed are all higher than the base and therefore show favorable
variances. For Consolidated Unix Servers, only Unix Bronze was observed as ahead of volume
expectations, resulting in a favorable variance. It was observed that UNIX Gold and Silver are well
behind expectations, showing unfavorable variances and trending downward for fiscal year 2014.
The observed volume increases in the Consolidated Server Bronze RU and the decrease in the Gold and
Silver RUs is possibly suggestive that customers are moving more toward the Bronze level of service than
the higher Unix levels of service. This could also be the result of customer conducted evaluations that
concluded with Bronze as a more fit for purpose RU than Gold.
For the utility server categories, which include all of the Microsoft Exchange and Office servers, it was
observed that the fluctuation in volumes seems to align with the consolidation of services throughout
the agencies leveraging this offering.
Consolidated Server Storage & Tape The Consolidated Server Storage & Tape RU category is made of seven (7) resource units, which include:
Consolidated Tier 1 Consolidated Tier 2 Consolidated Tier 3 Consolidated Tape Shared Consolidated Tape Written Server Consolidated offsite Tape Optical Storage
TEXAS DEPARTMENT OF INFORMATION RESOURCES | DCS CONSOLIDATION MEASUREMENT REPORT 18
Analysis: It was observed that the Consolidated Server and Storage &Tape RUs for consolidated Tier 1
and Tier 2 storage are well ahead of expected volumes. However, the remaining RUs (Tier 3,
Consolidated Tape Stored and Server Consolidated Offsite Tape) in this category are well behind
expectations, leading to an overall slightly unfavorable variance.
The observed favorable variances in the Non-Consolidated Server Storage & Tape group is suggestive of
one possibility for why there is a reduction in movement toward the consolidated Server Storage & Tape
offering of the DCS program.
DBaaS (Database as a Service) The DBaaS RU category is made of eight (8) resource units which include:
Oracle Exadata Platinum - Small Oracle Exadata Gold – Extra Small Oracle Exadata Gold – Small Oracle Exadata Gold – Medium Oracle Exadata Silver – Extra Small Oracle Exadata Silver – Small Oracle Exadata Silver – Medium Optional Additional Advanced Storage
Analysis: The observed DCS program’s DBaaS service offering was relatively new in fiscal year 2014. As
such, the volumes associated with these RUs were observed to be relatively low. It was also observed
that the expectation of this RU volume will progressively grow as these services are increasingly
demanded by the customer base.
Non-Consolidated Servers The Non-Consolidated Servers RU category is made of seven (7) resource units. Those include:
Non-consolidated Intel Gold Non-consolidated Intel Silver Non-consolidated Intel Bronze Non-consolidated Unix Gold Non-consolidated Unix Silver Non-consolidated Unix Bronze Non-consolidated Email Accounts
For the base year, Non-Consolidated Intel Server Bronze volume was observed to be higher than
expected, leading to a favorable variance. However, the observed trend in this RU has been downward
and by the end of the base year the expected volume was becoming close to expectations. Non-
Consolidated Intel Server Silver and Gold were observed to be close to expectations for the year;
however, observed volumes were higher in the first half of fiscal year 2014 and trended down with an
overall observed reduced number of servers in these RUs than expected. With respect to the Non-
Consolidated Intel servers there was an observed overall downward trend throughout the year that
reflected volumes below expectations at the end of the fiscal year. It was observed that the base rate
for Non-Consolidated Intel servers is trending up which is observed to be encouraging for customers to
move to Consolidated Server RUs.

TEXAS DEPARTMENT OF INFORMATION RESOURCES | DCS CONSOLIDATION MEASUREMENT REPORT 19
The overall observation in the Non-Consolidated Unix RUs is similar to that of Non-Consolidated Intel
Server. More specifically, observed volumes were higher than expected for the first half of the fiscal
year, then trended downward until it was observed that at the end of the fiscal year all volumes were
below expectations.
Non-Consolidated Server Storage & Tape The Non-Consolidated Server Storage & Tape RU category is made of four (4) resource units. Those
include:
Non-consolidated Dedicated and Shared SVR Non-consolidated Offsite Tape Non-consolidated Tape Other Non-consolidated Tape Stored
It was observed that the Non-Consolidated Server Storage & Tape show a large favorable variance
(volumes in these categories are much higher than expected) and this was also observed to be
incongruent with the objectives of the DCS program. More specifically, this observation suggests that
large volumes within the Non-Consolidated RU category indicates that these volumes are not
alternatively moving to the intended Consolidated RUs. This observation indicates that agencies may
not have fully realized to date the intended benefits of moving to consolidated categories.

TEXAS DEPARTMENT OF INFORMATION RESOURCES | DCS CONSOLIDATION MEASUREMENT REPORT 20
Appendix C – DCS Customer Analysis4
Department of Aging and Disability Services (DADS) The tables below provide different views of agency performance.
The first view is fiscal year 2014 Appropriation versus actuals with a variance. A positive variance for
this view indicates the agency’s actual spend was less than the fiscal year 2014 Appropriations amount
and a negative variance indicates that the actual spend was more than fiscal year 2014 Appropriation.
Subject to the limitations contained within the General Appropriations Act, Article IX, Sec. 14.03,
agencies have varying levels of authority to address amounts spent in excess or less than the individual
DCS capital budget line item amounts.
Fiscal Year 2014 Actuals
Rate Based Resource Unit-Included $3,039,115
Rate Based Resource Unit-Excluded $154,200
HSC/SSC/Rate Card-Excluded $362,723
Other Credits-Excluded ($2,385)
Transition and Transformation $270,372
TOTAL: $3,824,025
TOTAL APPROPRIATION: $3,749,727
VARIANCE: ($74,298)
Note: See the Inclusion/Exclusion of Resource Units in Appendix B of this report for additional
information related to costs/volumes included and excluded from the Unit rate Analysis below.
The second view provides a summary of results for each of the RU’s included within the Unit Rate
Analysis Methodology defined and described within this report. These results are specific to the
Department of Aging and Disability Services and do not include any recovery fees that are seen in the
agency invoices. A positive variance for this view indicates the agency financially benefited from unit
rates that were lower than the base rate, while a negative variance reflects unit rates higher than base
rates.
Summary by RU Group DADS
Mainframe
Print-Mail
Consolidated Server $5,229
Non-Consolidated Server $5,406
Consolidated Server Storage & Tape $14,882
Non-consolidated Server Storage & Tape $130,149
DBaaS ($636)
DADS Net Posture of Summary RU Results $155,030
4 Methodology and analyses provided by Gartner for DIR pursuant to DBITS Contract Number DIR-SDD-2042, Engagement 330024351.

TEXAS DEPARTMENT OF INFORMATION RESOURCES | DCS CONSOLIDATION MEASUREMENT REPORT 21
Department of Assistive and Rehabilitative Services (DARS) The tables below provide different views of agency performance.
The first view is fiscal year 2014 Appropriation versus actuals with a variance. A positive variance for
this view indicates the agency’s actual spend was less than the fiscal year 2014 Appropriations amount
and a negative variance indicates that the actual spend was more than fiscal year 2014 Appropriation.
Subject to the limitations contained within the General Appropriations Act, Article IX, Sec. 14.03,
agencies have varying levels of authority to address amounts spent in excess or less than the individual
DCS capital budget line item amounts.
Fiscal Year 2014 Actuals
Rate Based Resource Unit-Included $1,614,466
Rate Based Resource Unit-Excluded $9,397
HSC/SSC/Rate Card-Excluded $266,836
Other Credits-Excluded ($2,614)
Transition and Transformation $317,872
TOTAL: $2,205,957
TOTAL APPROPRIATION: $2,949,136
VARIANCE: $743,180
Note: See the Inclusion/Exclusion of Resource Units in Appendix B of this report for additional
information related to costs/volumes included and excluded from the Unit rate Analysis below.
The second view provides a summary of results for each of the RU’s included within the Unit Rate
Analysis Methodology defined and described within this report. These results are specific to the
Department of Assistive and Rehabilitative Services and do not include any recovery fees that are seen
in the agency invoices. A positive variance for this view indicates the agency financially benefited from
unit rates that were lower than the base rate, while a negative variance reflects unit rates higher than
base rates.
Summary by RU Group DARS
Mainframe
Print-Mail
Consolidated Server ($1,120)
Non-Consolidated Server $1,711
Consolidated Server Storage & Tape ($4,965)
Non-consolidated Server Storage & Tape $64,402
DBaaS
DARS Net Posture of Summary RU Results $60,028
TEXAS DEPARTMENT OF INFORMATION RESOURCES | DCS CONSOLIDATION MEASUREMENT REPORT 22
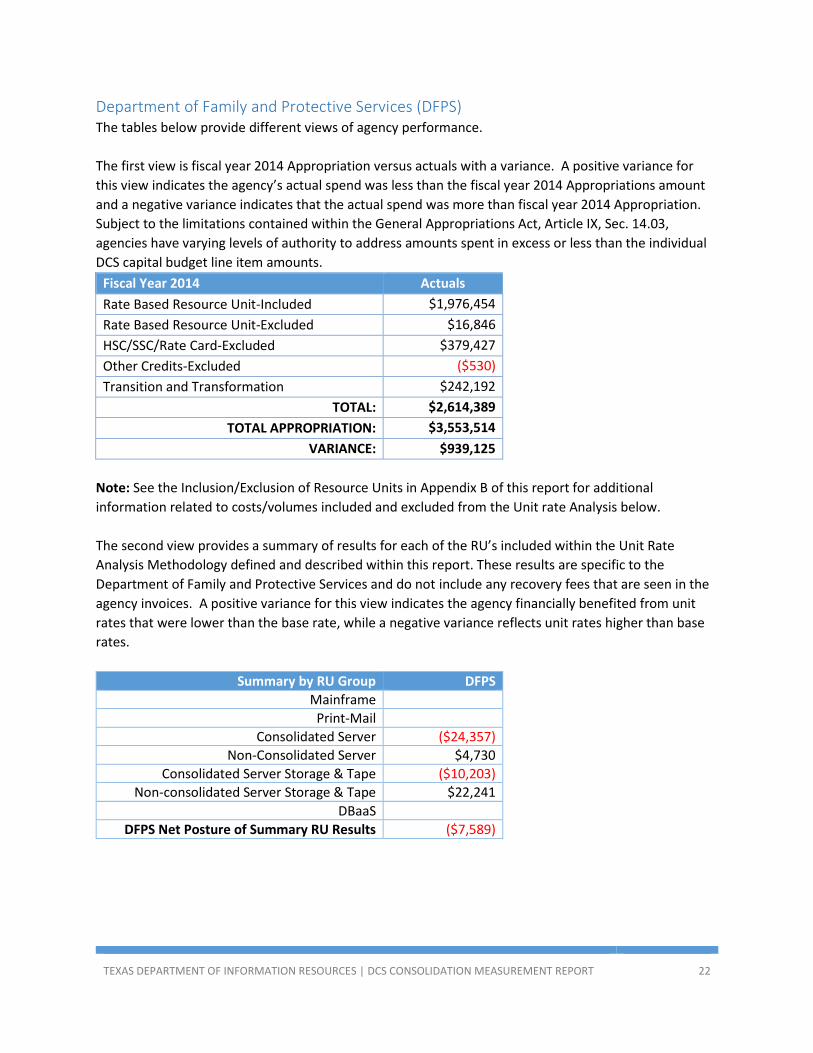
Department of Family and Protective Services (DFPS) The tables below provide different views of agency performance.
The first view is fiscal year 2014 Appropriation versus actuals with a variance. A positive variance for
this view indicates the agency’s actual spend was less than the fiscal year 2014 Appropriations amount
and a negative variance indicates that the actual spend was more than fiscal year 2014 Appropriation.
Subject to the limitations contained within the General Appropriations Act, Article IX, Sec. 14.03,
agencies have varying levels of authority to address amounts spent in excess or less than the individual
DCS capital budget line item amounts.
Fiscal Year 2014 Actuals
Rate Based Resource Unit-Included $1,976,454
Rate Based Resource Unit-Excluded $16,846
HSC/SSC/Rate Card-Excluded $379,427
Other Credits-Excluded ($530)
Transition and Transformation $242,192
TOTAL: $2,614,389
TOTAL APPROPRIATION: $3,553,514
VARIANCE: $939,125
Note: See the Inclusion/Exclusion of Resource Units in Appendix B of this report for additional
information related to costs/volumes included and excluded from the Unit rate Analysis below.
The second view provides a summary of results for each of the RU’s included within the Unit Rate
Analysis Methodology defined and described within this report. These results are specific to the
Department of Family and Protective Services and do not include any recovery fees that are seen in the
agency invoices. A positive variance for this view indicates the agency financially benefited from unit
rates that were lower than the base rate, while a negative variance reflects unit rates higher than base
rates.
Summary by RU Group DFPS
Mainframe
Print-Mail
Consolidated Server ($24,357)
Non-Consolidated Server $4,730
Consolidated Server Storage & Tape ($10,203)
Non-consolidated Server Storage & Tape $22,241
DBaaS
DFPS Net Posture of Summary RU Results ($7,589)
TEXAS DEPARTMENT OF INFORMATION RESOURCES | DCS CONSOLIDATION MEASUREMENT REPORT 23
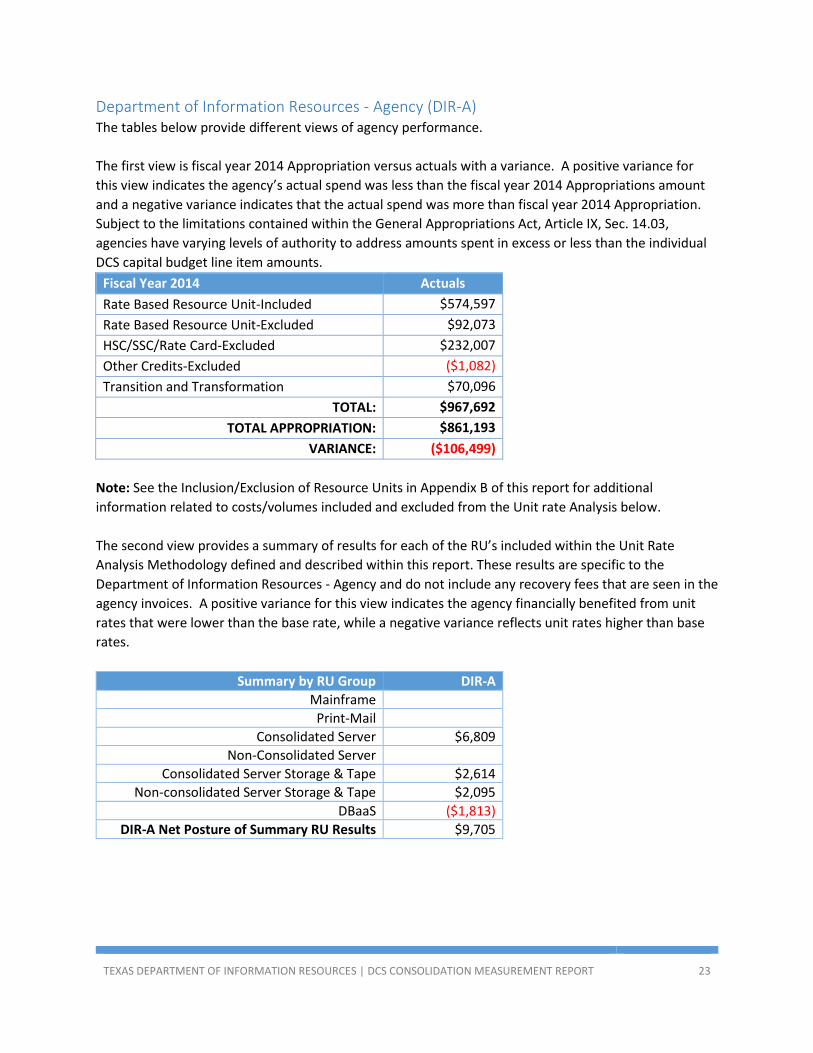
Department of Information Resources - Agency (DIR-A) The tables below provide different views of agency performance.
The first view is fiscal year 2014 Appropriation versus actuals with a variance. A positive variance for
this view indicates the agency’s actual spend was less than the fiscal year 2014 Appropriations amount
and a negative variance indicates that the actual spend was more than fiscal year 2014 Appropriation.
Subject to the limitations contained within the General Appropriations Act, Article IX, Sec. 14.03,
agencies have varying levels of authority to address amounts spent in excess or less than the individual
DCS capital budget line item amounts.
Fiscal Year 2014 Actuals
Rate Based Resource Unit-Included $574,597
Rate Based Resource Unit-Excluded $92,073
HSC/SSC/Rate Card-Excluded $232,007
Other Credits-Excluded ($1,082)
Transition and Transformation $70,096
TOTAL: $967,692
TOTAL APPROPRIATION: $861,193
VARIANCE: ($106,499)
Note: See the Inclusion/Exclusion of Resource Units in Appendix B of this report for additional
information related to costs/volumes included and excluded from the Unit rate Analysis below.
The second view provides a summary of results for each of the RU’s included within the Unit Rate
Analysis Methodology defined and described within this report. These results are specific to the
Department of Information Resources - Agency and do not include any recovery fees that are seen in the
agency invoices. A positive variance for this view indicates the agency financially benefited from unit
rates that were lower than the base rate, while a negative variance reflects unit rates higher than base
rates.
Summary by RU Group DIR-A
Mainframe
Print-Mail
Consolidated Server $6,809
Non-Consolidated Server
Consolidated Server Storage & Tape $2,614
Non-consolidated Server Storage & Tape $2,095
DBaaS ($1,813)
DIR-A Net Posture of Summary RU Results $9,705
TEXAS DEPARTMENT OF INFORMATION RESOURCES | DCS CONSOLIDATION MEASUREMENT REPORT 24
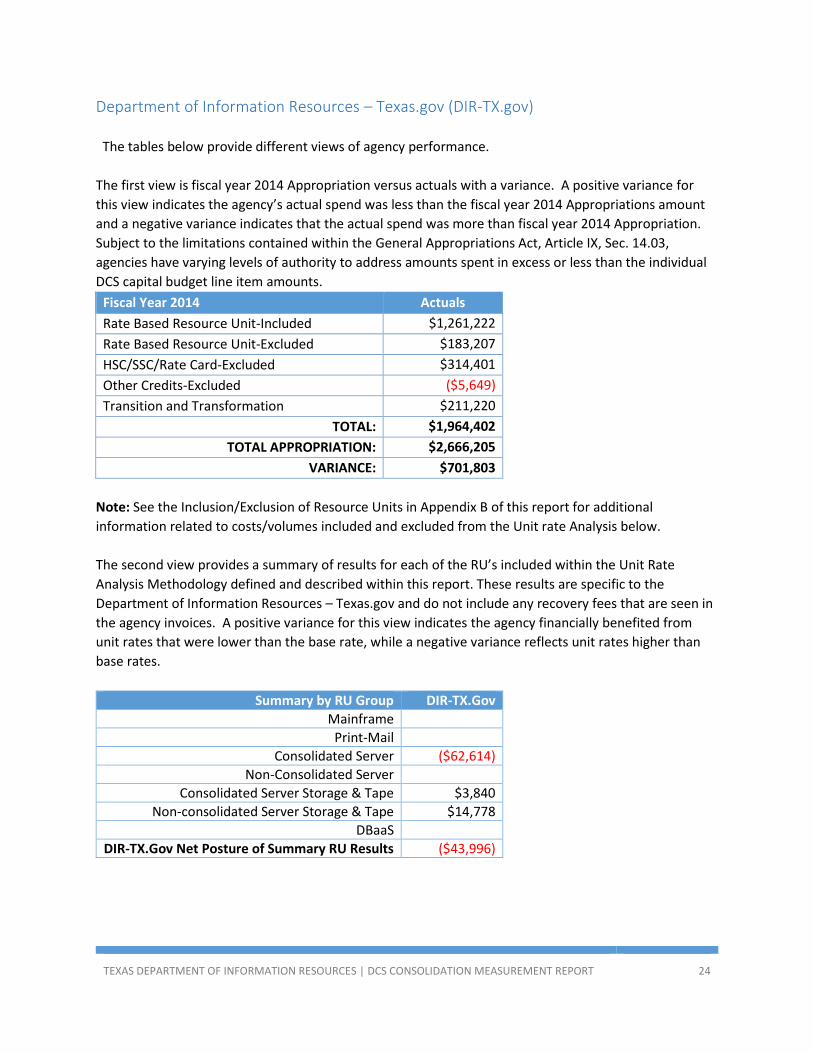
Department of Information Resources – Texas.gov (DIR-TX.gov)
The tables below provide different views of agency performance.
The first view is fiscal year 2014 Appropriation versus actuals with a variance. A positive variance for
this view indicates the agency’s actual spend was less than the fiscal year 2014 Appropriations amount
and a negative variance indicates that the actual spend was more than fiscal year 2014 Appropriation.
Subject to the limitations contained within the General Appropriations Act, Article IX, Sec. 14.03,
agencies have varying levels of authority to address amounts spent in excess or less than the individual
DCS capital budget line item amounts.
Fiscal Year 2014 Actuals
Rate Based Resource Unit-Included $1,261,222
Rate Based Resource Unit-Excluded $183,207
HSC/SSC/Rate Card-Excluded $314,401
Other Credits-Excluded ($5,649)
Transition and Transformation $211,220
TOTAL: $1,964,402
TOTAL APPROPRIATION: $2,666,205
VARIANCE: $701,803
Note: See the Inclusion/Exclusion of Resource Units in Appendix B of this report for additional
information related to costs/volumes included and excluded from the Unit rate Analysis below.
The second view provides a summary of results for each of the RU’s included within the Unit Rate
Analysis Methodology defined and described within this report. These results are specific to the
Department of Information Resources – Texas.gov and do not include any recovery fees that are seen in
the agency invoices. A positive variance for this view indicates the agency financially benefited from
unit rates that were lower than the base rate, while a negative variance reflects unit rates higher than
base rates.
Summary by RU Group DIR-TX.Gov
Mainframe
Print-Mail
Consolidated Server ($62,614)
Non-Consolidated Server
Consolidated Server Storage & Tape $3,840
Non-consolidated Server Storage & Tape $14,778
DBaaS
DIR-TX.Gov Net Posture of Summary RU Results ($43,996)
TEXAS DEPARTMENT OF INFORMATION RESOURCES | DCS CONSOLIDATION MEASUREMENT REPORT 25
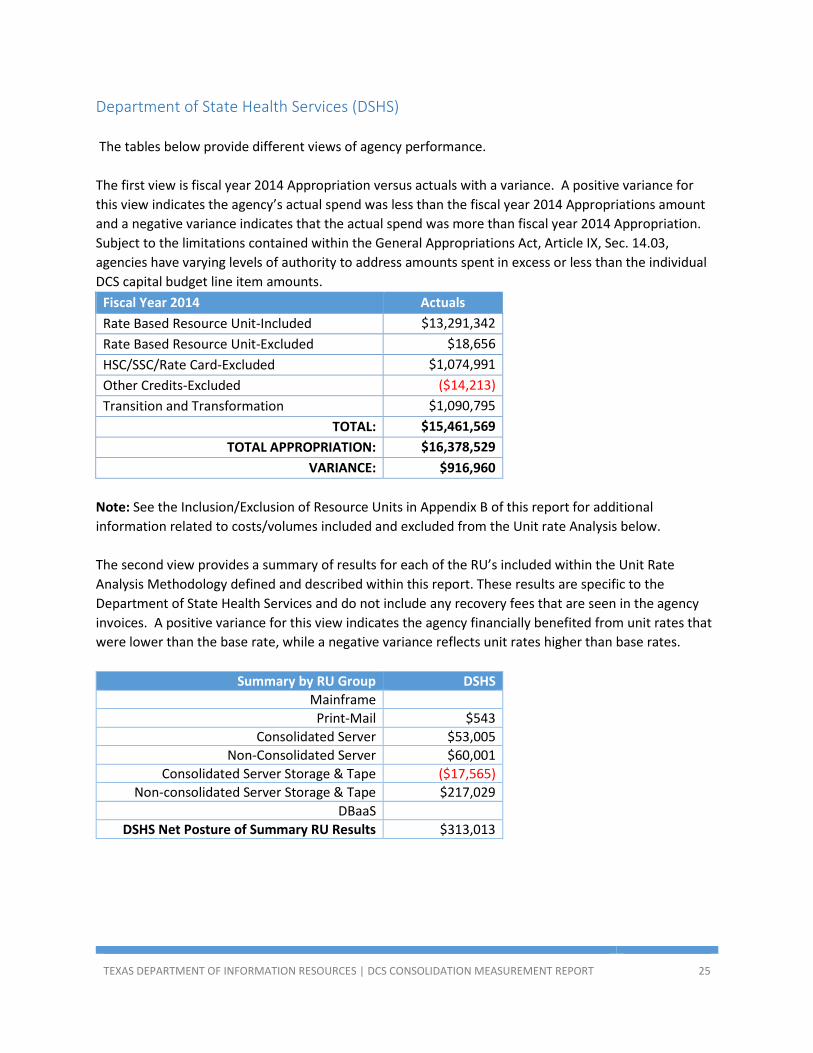
Department of State Health Services (DSHS)
The tables below provide different views of agency performance.
The first view is fiscal year 2014 Appropriation versus actuals with a variance. A positive variance for
this view indicates the agency’s actual spend was less than the fiscal year 2014 Appropriations amount
and a negative variance indicates that the actual spend was more than fiscal year 2014 Appropriation.
Subject to the limitations contained within the General Appropriations Act, Article IX, Sec. 14.03,
agencies have varying levels of authority to address amounts spent in excess or less than the individual
DCS capital budget line item amounts.
Fiscal Year 2014 Actuals
Rate Based Resource Unit-Included $13,291,342
Rate Based Resource Unit-Excluded $18,656
HSC/SSC/Rate Card-Excluded $1,074,991
Other Credits-Excluded ($14,213)
Transition and Transformation $1,090,795
TOTAL: $15,461,569
TOTAL APPROPRIATION: $16,378,529
VARIANCE: $916,960
Note: See the Inclusion/Exclusion of Resource Units in Appendix B of this report for additional
information related to costs/volumes included and excluded from the Unit rate Analysis below.
The second view provides a summary of results for each of the RU’s included within the Unit Rate
Analysis Methodology defined and described within this report. These results are specific to the
Department of State Health Services and do not include any recovery fees that are seen in the agency
invoices. A positive variance for this view indicates the agency financially benefited from unit rates that
were lower than the base rate, while a negative variance reflects unit rates higher than base rates.
Summary by RU Group DSHS
Mainframe
Print-Mail $543
Consolidated Server $53,005
Non-Consolidated Server $60,001
Consolidated Server Storage & Tape ($17,565)
Non-consolidated Server Storage & Tape $217,029
DBaaS
DSHS Net Posture of Summary RU Results $313,013
TEXAS DEPARTMENT OF INFORMATION RESOURCES | DCS CONSOLIDATION MEASUREMENT REPORT 26
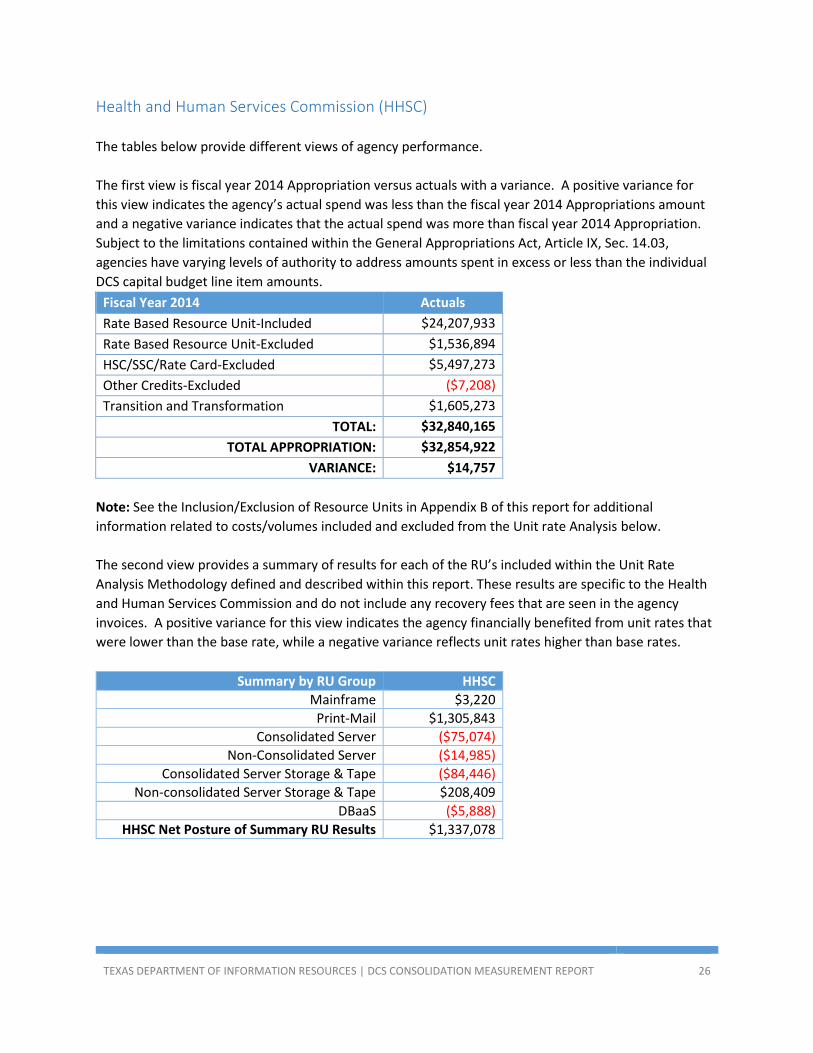
Health and Human Services Commission (HHSC)
The tables below provide different views of agency performance.
The first view is fiscal year 2014 Appropriation versus actuals with a variance. A positive variance for
this view indicates the agency’s actual spend was less than the fiscal year 2014 Appropriations amount
and a negative variance indicates that the actual spend was more than fiscal year 2014 Appropriation.
Subject to the limitations contained within the General Appropriations Act, Article IX, Sec. 14.03,
agencies have varying levels of authority to address amounts spent in excess or less than the individual
DCS capital budget line item amounts.
Fiscal Year 2014 Actuals
Rate Based Resource Unit-Included $24,207,933
Rate Based Resource Unit-Excluded $1,536,894
HSC/SSC/Rate Card-Excluded $5,497,273
Other Credits-Excluded ($7,208)
Transition and Transformation $1,605,273
TOTAL: $32,840,165
TOTAL APPROPRIATION: $32,854,922
VARIANCE: $14,757
Note: See the Inclusion/Exclusion of Resource Units in Appendix B of this report for additional
information related to costs/volumes included and excluded from the Unit rate Analysis below.
The second view provides a summary of results for each of the RU’s included within the Unit Rate
Analysis Methodology defined and described within this report. These results are specific to the Health
and Human Services Commission and do not include any recovery fees that are seen in the agency
invoices. A positive variance for this view indicates the agency financially benefited from unit rates that
were lower than the base rate, while a negative variance reflects unit rates higher than base rates.
Summary by RU Group HHSC
Mainframe $3,220
Print-Mail $1,305,843
Consolidated Server ($75,074)
Non-Consolidated Server ($14,985)
Consolidated Server Storage & Tape ($84,446)
Non-consolidated Server Storage & Tape $208,409
DBaaS ($5,888)
HHSC Net Posture of Summary RU Results $1,337,078

TEXAS DEPARTMENT OF INFORMATION RESOURCES | DCS CONSOLIDATION MEASUREMENT REPORT 27
Health Professions Council (HPC) The tables below provide different views of agency performance.
The first view is fiscal year 2014 Appropriation versus actuals with a variance. A positive variance for
this view indicates the agency’s actual spend was less than the fiscal year 2014 Appropriations amount
and a negative variance indicates that the actual spend was more than fiscal year 2014 Appropriation.
Subject to the limitations contained within the General Appropriations Act, Article IX, Sec. 14.03,
agencies have varying levels of authority to address amounts spent in excess or less than the individual
DCS capital budget line item amounts.
Fiscal Year 2014 Actuals
Rate Based Resource Unit-Included $51,841
Rate Based Resource Unit-Excluded $94
HSC/SSC/Rate Card-Excluded $14,771
Other Credits-Excluded ($152)
Transition and Transformation $5,584
TOTAL: $72,139
TOTAL APPROPRIATION: $70,710
VARIANCE: ($1,429)
Note: See the Inclusion/Exclusion of Resource Units in Appendix B of this report for additional
information related to costs/volumes included and excluded from the Unit rate Analysis below.
The second view provides a summary of results for each of the RU’s included within the Unit Rate
Analysis Methodology defined and described within this report. These results are specific to the Health
Professions Council and do not include any recovery fees that are seen in the agency invoices. A positive
variance for this view indicates the agency financially benefited from unit rates that were lower than the
base rate, while a negative variance reflects unit rates higher than base rates.
Summary by RU Group HPC
Mainframe
Print-Mail
Consolidated Server $1,396
Non-Consolidated Server
Consolidated Server Storage & Tape $173
Non-consolidated Server Storage & Tape
DBaaS
HPC Net Posture of Summary RU Results $1,569

TEXAS DEPARTMENT OF INFORMATION RESOURCES | DCS CONSOLIDATION MEASUREMENT REPORT 28
Office of the Attorney General – Administration & Legal Division (OAG-AL)
The tables below provide different views of agency performance.
The first view is fiscal year 2014 Appropriation versus actuals with a variance. A positive variance for
this view indicates the agency’s actual spend was less than the fiscal year 2014 Appropriations amount
and a negative variance indicates that the actual spend was more than fiscal year 2014 Appropriation.
Subject to the limitations contained within the General Appropriations Act, Article IX, Sec. 14.03,
agencies have varying levels of authority to address amounts spent in excess or less than the individual
DCS capital budget line item amounts.
Fiscal Year 2014 Actuals
Rate Based Resource Unit-Included $2,974,100
Rate Based Resource Unit-Excluded ($48,014)
HSC/SSC/Rate Card-Excluded $781,853
Other Credits-Excluded ($5,319)
Transition and Transformation $217,599
TOTAL: $3,920,219
TOTAL APPROPRIATION: $3,671,178
VARIANCE: ($249,042)
Note: See the Inclusion/Exclusion of Resource Units in Appendix B of this report for additional
information related to costs/volumes included and excluded from the Unit rate Analysis below.
The second view provides a summary of results for each of the RU’s included within the Unit Rate
Analysis Methodology defined and described within this report. These results are specific to the Office
of the Attorney General - Administrative & Legal Division and do not include any recovery fees that are
seen in the agency invoices. A positive variance for this view indicates the agency financially benefited
from unit rates that were lower than the base rate, while a negative variance reflects unit rates higher
than base rates.
Summary by RU Group OAG-AL
Mainframe $1,165
Print-Mail ($3,552)
Consolidated Server ($32,215)
Non-Consolidated Server $1,964
Consolidated Server Storage & Tape $35,146
Non-consolidated Server Storage & Tape $77,794
DBaaS
OAG-AL Net Posture of Summary RU Results $80,301
TEXAS DEPARTMENT OF INFORMATION RESOURCES | DCS CONSOLIDATION MEASUREMENT REPORT 29
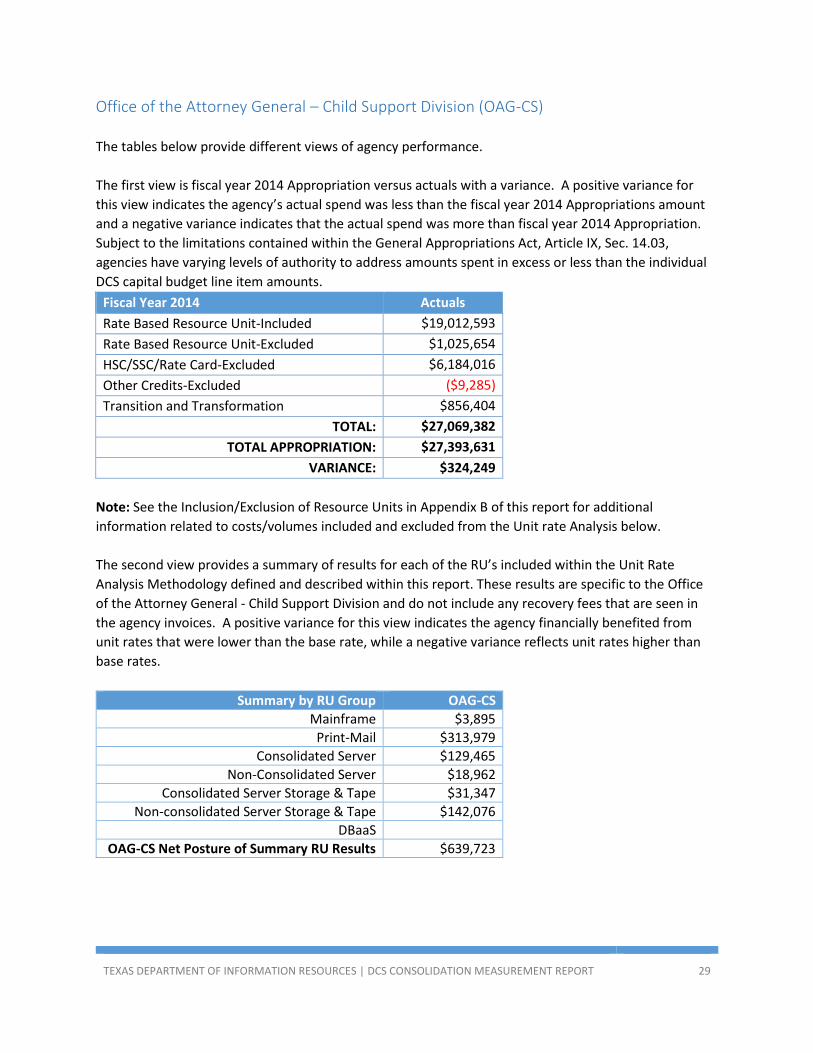
Office of the Attorney General – Child Support Division (OAG-CS)
The tables below provide different views of agency performance.
The first view is fiscal year 2014 Appropriation versus actuals with a variance. A positive variance for
this view indicates the agency’s actual spend was less than the fiscal year 2014 Appropriations amount
and a negative variance indicates that the actual spend was more than fiscal year 2014 Appropriation.
Subject to the limitations contained within the General Appropriations Act, Article IX, Sec. 14.03,
agencies have varying levels of authority to address amounts spent in excess or less than the individual
DCS capital budget line item amounts.
Fiscal Year 2014 Actuals
Rate Based Resource Unit-Included $19,012,593
Rate Based Resource Unit-Excluded $1,025,654
HSC/SSC/Rate Card-Excluded $6,184,016
Other Credits-Excluded ($9,285)
Transition and Transformation $856,404
TOTAL: $27,069,382
TOTAL APPROPRIATION: $27,393,631
VARIANCE: $324,249
Note: See the Inclusion/Exclusion of Resource Units in Appendix B of this report for additional
information related to costs/volumes included and excluded from the Unit rate Analysis below.
The second view provides a summary of results for each of the RU’s included within the Unit Rate
Analysis Methodology defined and described within this report. These results are specific to the Office
of the Attorney General - Child Support Division and do not include any recovery fees that are seen in
the agency invoices. A positive variance for this view indicates the agency financially benefited from
unit rates that were lower than the base rate, while a negative variance reflects unit rates higher than
base rates.
Summary by RU Group OAG-CS
Mainframe $3,895
Print-Mail $313,979
Consolidated Server $129,465
Non-Consolidated Server $18,962
Consolidated Server Storage & Tape $31,347
Non-consolidated Server Storage & Tape $142,076
DBaaS
OAG-CS Net Posture of Summary RU Results $639,723

TEXAS DEPARTMENT OF INFORMATION RESOURCES | DCS CONSOLIDATION MEASUREMENT REPORT 30
Public Utility Commission (PUC) The tables below provide different views of agency performance.
The first view is fiscal year 2014 Appropriation versus actuals with a variance. A positive variance for
this view indicates the agency’s actual spend was less than the fiscal year 2014 Appropriations amount
and a negative variance indicates that the actual spend was more than fiscal year 2014 Appropriation.
Subject to the limitations contained within the General Appropriations Act, Article IX, Sec. 14.03,
agencies have varying levels of authority to address amounts spent in excess or less than the individual
DCS capital budget line item amounts.
Fiscal Year 2014 Actuals
Rate Based Resource Unit-Included $313,640
Rate Based Resource Unit-Excluded $4,488
HSC/SSC/Rate Card-Excluded $25,449
Other Credits-Excluded ($628)
Transition and Transformation $37,263
TOTAL: $380,213
TOTAL APPROPRIATION: $450,826
VARIANCE: $70,613
Note: See the Inclusion/Exclusion of Resource Units in Appendix B of this report for additional
information related to costs/volumes included and excluded from the Unit rate Analysis below.
The second view provides a summary of results for each of the RU’s included within the Unit Rate
Analysis Methodology defined and described within this report. These results are specific to the Public
Utility Commission and do not include any recovery fees that are seen in the agency invoices. A positive
variance for this view indicates the agency financially benefited from unit rates that were lower than the
base rate, while a negative variance reflects unit rates higher than base rates.
Summary by RU Group PUC
Mainframe
Print-Mail
Consolidated Server $3,612
Non-Consolidated Server $333
Consolidated Server Storage & Tape $770
Non-consolidated Server Storage & Tape $10,138
DBaaS
PUC Net Posture of Summary RU Results $14,853
TEXAS DEPARTMENT OF INFORMATION RESOURCES | DCS CONSOLIDATION MEASUREMENT REPORT 31
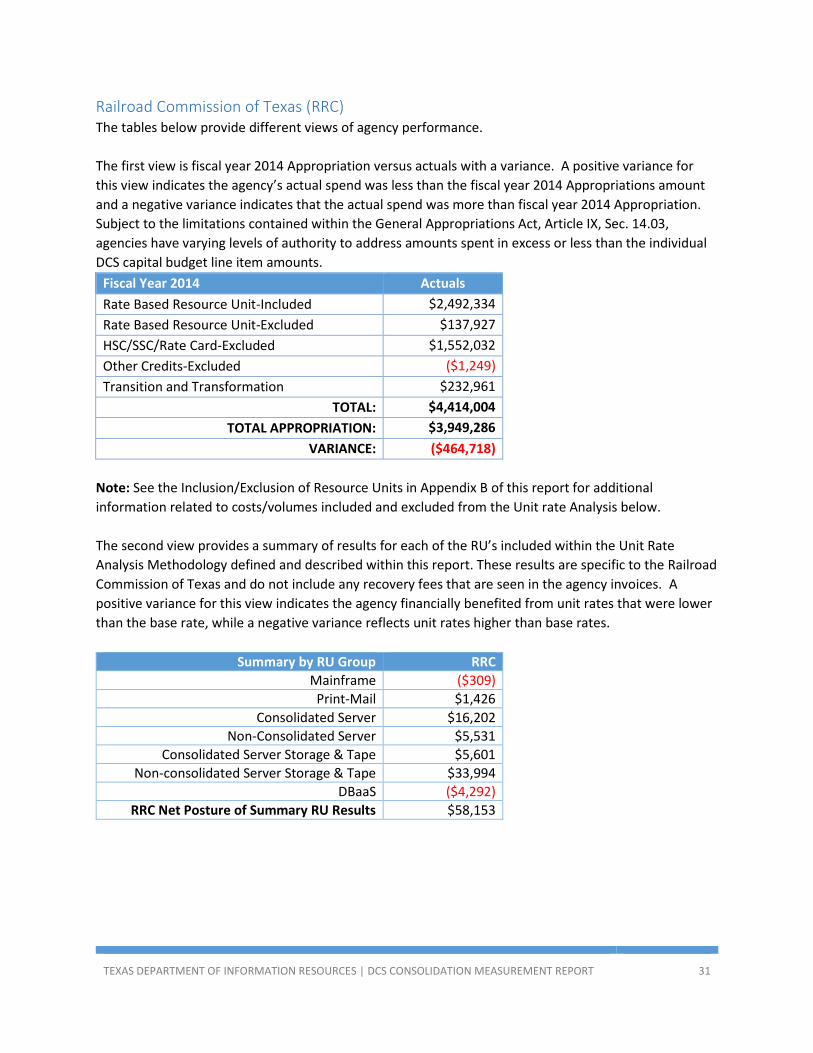
Railroad Commission of Texas (RRC) The tables below provide different views of agency performance.
The first view is fiscal year 2014 Appropriation versus actuals with a variance. A positive variance for
this view indicates the agency’s actual spend was less than the fiscal year 2014 Appropriations amount
and a negative variance indicates that the actual spend was more than fiscal year 2014 Appropriation.
Subject to the limitations contained within the General Appropriations Act, Article IX, Sec. 14.03,
agencies have varying levels of authority to address amounts spent in excess or less than the individual
DCS capital budget line item amounts.
Fiscal Year 2014 Actuals
Rate Based Resource Unit-Included $2,492,334
Rate Based Resource Unit-Excluded $137,927
HSC/SSC/Rate Card-Excluded $1,552,032
Other Credits-Excluded ($1,249)
Transition and Transformation $232,961
TOTAL: $4,414,004
TOTAL APPROPRIATION: $3,949,286
VARIANCE: ($464,718)
Note: See the Inclusion/Exclusion of Resource Units in Appendix B of this report for additional
information related to costs/volumes included and excluded from the Unit rate Analysis below.
The second view provides a summary of results for each of the RU’s included within the Unit Rate
Analysis Methodology defined and described within this report. These results are specific to the Railroad
Commission of Texas and do not include any recovery fees that are seen in the agency invoices. A
positive variance for this view indicates the agency financially benefited from unit rates that were lower
than the base rate, while a negative variance reflects unit rates higher than base rates.
Summary by RU Group RRC
Mainframe ($309)
Print-Mail $1,426
Consolidated Server $16,202
Non-Consolidated Server $5,531
Consolidated Server Storage & Tape $5,601
Non-consolidated Server Storage & Tape $33,994
DBaaS ($4,292)
RRC Net Posture of Summary RU Results $58,153
TEXAS DEPARTMENT OF INFORMATION RESOURCES | DCS CONSOLIDATION MEASUREMENT REPORT 32
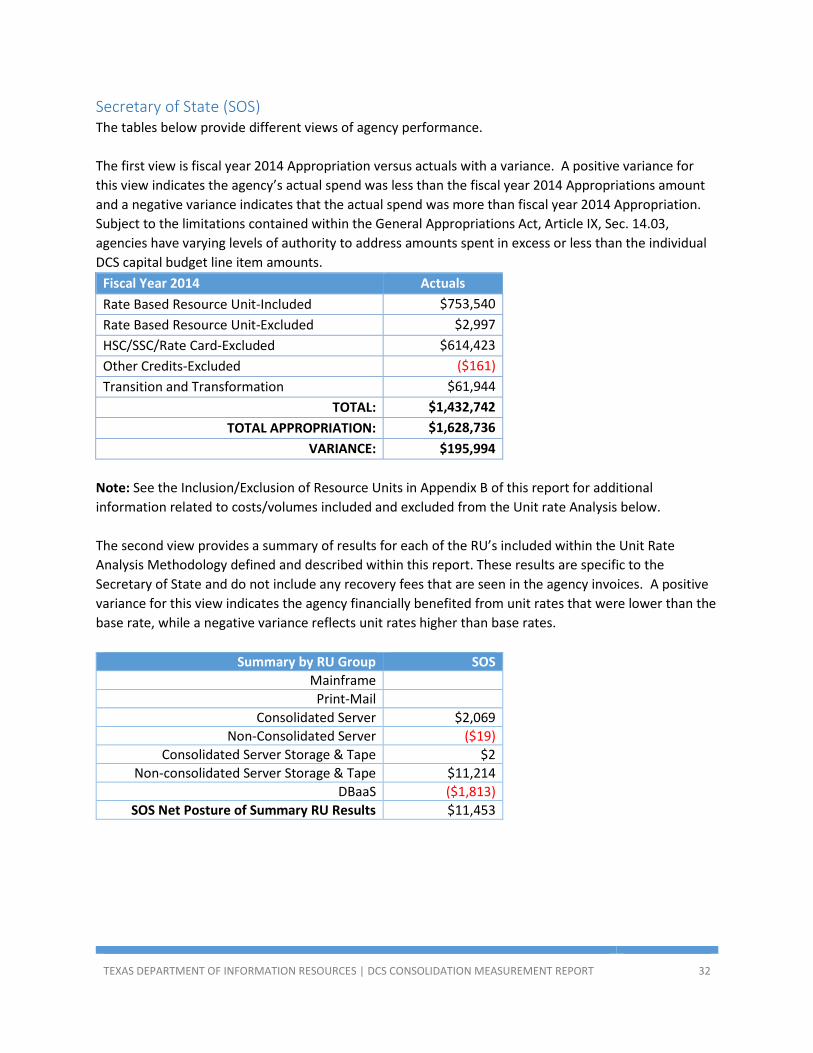
Secretary of State (SOS) The tables below provide different views of agency performance.
The first view is fiscal year 2014 Appropriation versus actuals with a variance. A positive variance for
this view indicates the agency’s actual spend was less than the fiscal year 2014 Appropriations amount
and a negative variance indicates that the actual spend was more than fiscal year 2014 Appropriation.
Subject to the limitations contained within the General Appropriations Act, Article IX, Sec. 14.03,
agencies have varying levels of authority to address amounts spent in excess or less than the individual
DCS capital budget line item amounts.
Fiscal Year 2014 Actuals
Rate Based Resource Unit-Included $753,540
Rate Based Resource Unit-Excluded $2,997
HSC/SSC/Rate Card-Excluded $614,423
Other Credits-Excluded ($161)
Transition and Transformation $61,944
TOTAL: $1,432,742
TOTAL APPROPRIATION: $1,628,736
VARIANCE: $195,994
Note: See the Inclusion/Exclusion of Resource Units in Appendix B of this report for additional
information related to costs/volumes included and excluded from the Unit rate Analysis below.
The second view provides a summary of results for each of the RU’s included within the Unit Rate
Analysis Methodology defined and described within this report. These results are specific to the
Secretary of State and do not include any recovery fees that are seen in the agency invoices. A positive
variance for this view indicates the agency financially benefited from unit rates that were lower than the
base rate, while a negative variance reflects unit rates higher than base rates.
Summary by RU Group SOS
Mainframe
Print-Mail
Consolidated Server $2,069
Non-Consolidated Server ($19)
Consolidated Server Storage & Tape $2
Non-consolidated Server Storage & Tape $11,214
DBaaS ($1,813)
SOS Net Posture of Summary RU Results $11,453
TEXAS DEPARTMENT OF INFORMATION RESOURCES | DCS CONSOLIDATION MEASUREMENT REPORT 33
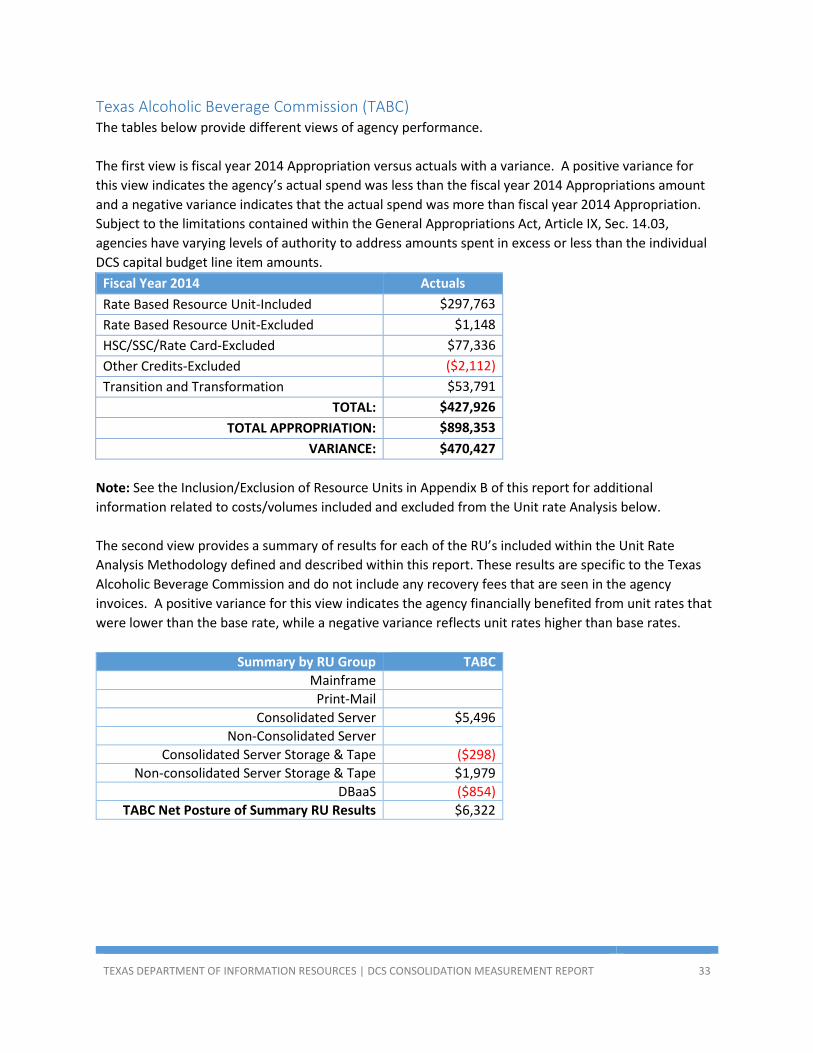
Texas Alcoholic Beverage Commission (TABC) The tables below provide different views of agency performance.
The first view is fiscal year 2014 Appropriation versus actuals with a variance. A positive variance for
this view indicates the agency’s actual spend was less than the fiscal year 2014 Appropriations amount
and a negative variance indicates that the actual spend was more than fiscal year 2014 Appropriation.
Subject to the limitations contained within the General Appropriations Act, Article IX, Sec. 14.03,
agencies have varying levels of authority to address amounts spent in excess or less than the individual
DCS capital budget line item amounts.
Fiscal Year 2014 Actuals
Rate Based Resource Unit-Included $297,763
Rate Based Resource Unit-Excluded $1,148
HSC/SSC/Rate Card-Excluded $77,336
Other Credits-Excluded ($2,112)
Transition and Transformation $53,791
TOTAL: $427,926
TOTAL APPROPRIATION: $898,353
VARIANCE: $470,427
Note: See the Inclusion/Exclusion of Resource Units in Appendix B of this report for additional
information related to costs/volumes included and excluded from the Unit rate Analysis below.
The second view provides a summary of results for each of the RU’s included within the Unit Rate
Analysis Methodology defined and described within this report. These results are specific to the Texas
Alcoholic Beverage Commission and do not include any recovery fees that are seen in the agency
invoices. A positive variance for this view indicates the agency financially benefited from unit rates that
were lower than the base rate, while a negative variance reflects unit rates higher than base rates.
Summary by RU Group TABC
Mainframe
Print-Mail
Consolidated Server $5,496
Non-Consolidated Server
Consolidated Server Storage & Tape ($298)
Non-consolidated Server Storage & Tape $1,979
DBaaS ($854)
TABC Net Posture of Summary RU Results $6,322
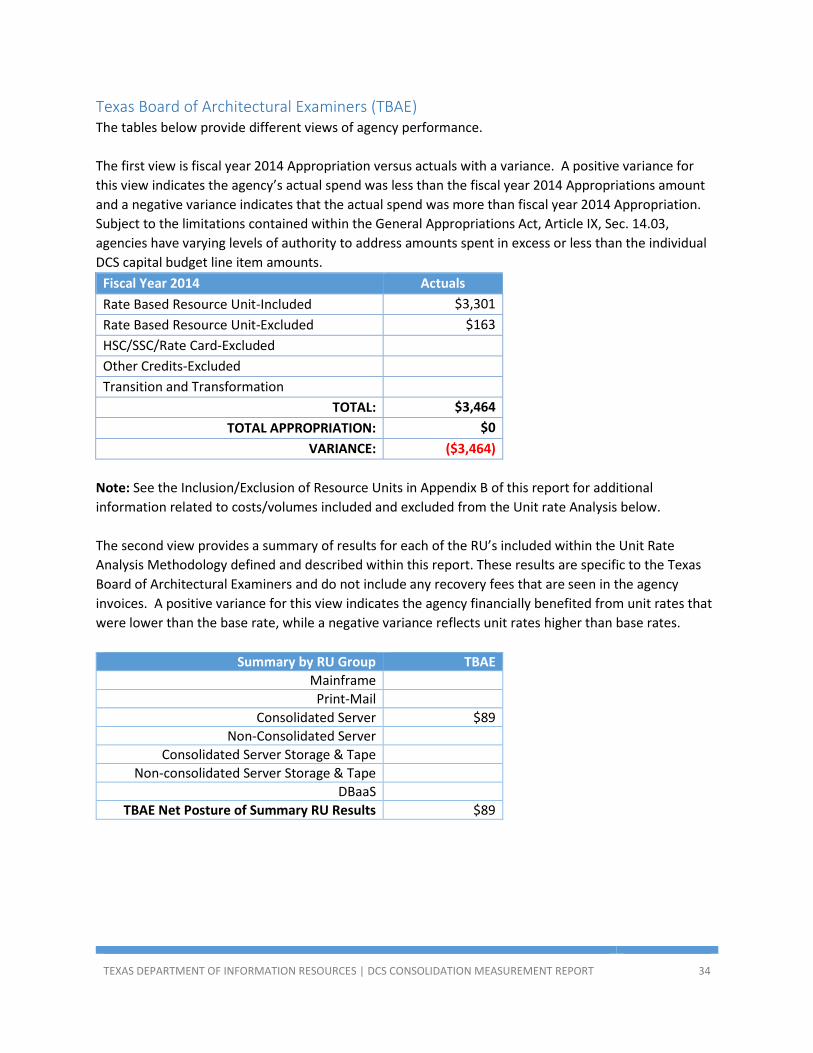
TEXAS DEPARTMENT OF INFORMATION RESOURCES | DCS CONSOLIDATION MEASUREMENT REPORT 34
Texas Board of Architectural Examiners (TBAE) The tables below provide different views of agency performance.
The first view is fiscal year 2014 Appropriation versus actuals with a variance. A positive variance for
this view indicates the agency’s actual spend was less than the fiscal year 2014 Appropriations amount
and a negative variance indicates that the actual spend was more than fiscal year 2014 Appropriation.
Subject to the limitations contained within the General Appropriations Act, Article IX, Sec. 14.03,
agencies have varying levels of authority to address amounts spent in excess or less than the individual
DCS capital budget line item amounts.
Fiscal Year 2014 Actuals
Rate Based Resource Unit-Included $3,301
Rate Based Resource Unit-Excluded $163
HSC/SSC/Rate Card-Excluded
Other Credits-Excluded
Transition and Transformation
TOTAL: $3,464
TOTAL APPROPRIATION: $0
VARIANCE: ($3,464)
Note: See the Inclusion/Exclusion of Resource Units in Appendix B of this report for additional
information related to costs/volumes included and excluded from the Unit rate Analysis below.
The second view provides a summary of results for each of the RU’s included within the Unit Rate
Analysis Methodology defined and described within this report. These results are specific to the Texas
Board of Architectural Examiners and do not include any recovery fees that are seen in the agency
invoices. A positive variance for this view indicates the agency financially benefited from unit rates that
were lower than the base rate, while a negative variance reflects unit rates higher than base rates.
Summary by RU Group TBAE
Mainframe
Print-Mail
Consolidated Server $89
Non-Consolidated Server
Consolidated Server Storage & Tape
Non-consolidated Server Storage & Tape
DBaaS
TBAE Net Posture of Summary RU Results $89

TEXAS DEPARTMENT OF INFORMATION RESOURCES | DCS CONSOLIDATION MEASUREMENT REPORT 35
Texas Commission on Environmental Quality (TCEQ) The tables below provide different views of agency performance.
The first view is fiscal year 2014 Appropriation versus actuals with a variance. A positive variance for
this view indicates the agency’s actual spend was less than the fiscal year 2014 Appropriations amount
and a negative variance indicates that the actual spend was more than fiscal year 2014 Appropriation.
Subject to the limitations contained within the General Appropriations Act, Article IX, Sec. 14.03,
agencies have varying levels of authority to address amounts spent in excess or less than the individual
DCS capital budget line item amounts.
Fiscal Year 2014 Actuals
Rate Based Resource Unit-Included $7,514,030
Rate Based Resource Unit-Excluded $17,031
HSC/SSC/Rate Card-Excluded $1,660,833
Other Credits-Excluded ($7,270)
Transition and Transformation $669,285
TOTAL: $9,853,909
TOTAL APPROPRIATION: $10,840,479
VARIANCE: $986,571
Note: See the Inclusion/Exclusion of Resource Units in Appendix B of this report for additional
information related to costs/volumes included and excluded from the Unit rate Analysis below.
The second view provides a summary of results for each of the RU’s included within the Unit Rate
Analysis Methodology defined and described within this report. These results are specific to the Texas
Commission on Environmental Quality and do not include any recovery fees that are seen in the agency
invoices. A positive variance for this view indicates the agency financially benefited from unit rates that
were lower than the base rate, while a negative variance reflects unit rates higher than base rates.
Summary by RU Group TCEQ
Mainframe
Print-Mail
Consolidated Server $40,354
Non-Consolidated Server ($10,628)
Consolidated Server Storage & Tape ($18,290)
Non-consolidated Server Storage & Tape $38,479
DBaaS
TCEQ Net Posture of Summary RU Results $49,915

TEXAS DEPARTMENT OF INFORMATION RESOURCES | DCS CONSOLIDATION MEASUREMENT REPORT 36
Texas Department of Agriculture (TDA) The tables below provide different views of agency performance.
The first view is fiscal year 2014 Appropriation versus actuals with a variance. A positive variance for
this view indicates the agency’s actual spend was less than the fiscal year 2014 Appropriations amount
and a negative variance indicates that the actual spend was more than fiscal year 2014 Appropriation.
Subject to the limitations contained within the General Appropriations Act, Article IX, Sec. 14.03,
agencies have varying levels of authority to address amounts spent in excess or less than the individual
DCS capital budget line item amounts.
Fiscal Year 2014 Actuals
Rate Based Resource Unit-Included $24,350
Rate Based Resource Unit-Excluded $1,017
HSC/SSC/Rate Card-Excluded
Other Credits-Excluded
Transition and Transformation
TOTAL: $25,367
TOTAL APPROPRIATION: $22,978
VARIANCE: ($2,389)
Note: See the Inclusion/Exclusion of Resource Units in Appendix B of this report for additional
information related to costs/volumes included and excluded from the Unit rate Analysis below.
The second view provides a summary of results for each of the RU’s included within the Unit Rate
Analysis Methodology defined and described within this report. These results are specific to the Texas
Department of Agriculture and do not include any recovery fees that are seen in the agency invoices. A
positive variance for this view indicates the agency financially benefited from unit rates that were lower
than the base rate, while a negative variance reflects unit rates higher than base rates.
Summary by RU Group TDA
Mainframe
Print-Mail $3,595
Consolidated Server
Non-Consolidated Server
Consolidated Server Storage & Tape
Non-consolidated Server Storage & Tape
DBaaS
TDA Net Posture of Summary RU Results $3,595

TEXAS DEPARTMENT OF INFORMATION RESOURCES | DCS CONSOLIDATION MEASUREMENT REPORT 37
Texas Department of Criminal Justice (TDCJ) The tables below provide different views of agency performance.
The first view is fiscal year 2014 Appropriation versus actuals with a variance. A positive variance for
this view indicates the agency’s actual spend was less than the fiscal year 2014 Appropriations amount
and a negative variance indicates that the actual spend was more than fiscal year 2014 Appropriation.
Subject to the limitations contained within the General Appropriations Act, Article IX, Sec. 14.03,
agencies have varying levels of authority to address amounts spent in excess or less than the individual
DCS capital budget line item amounts.
Fiscal Year 2014 Actuals
Rate Based Resource Unit-Included $8,549,188
Rate Based Resource Unit-Excluded $116,094
HSC/SSC/Rate Card-Excluded $471,495
Other Credits-Excluded ($2,952)
Transition and Transformation $536,350
TOTAL: $9,670,175
TOTAL APPROPRIATION: $11,656,545
VARIANCE: $1,986,370
Note: See the Inclusion/Exclusion of Resource Units in Appendix B of this report for additional
information related to costs/volumes included and excluded from the Unit rate Analysis below.
The second view provides a summary of results for each of the RU’s included within the Unit Rate
Analysis Methodology defined and described within this report. These results are specific to the Texas
Department of Criminal Justice and do not include any recovery fees that are seen in the agency
invoices. A positive variance for this view indicates the agency financially benefited from unit rates that
were lower than the base rate, while a negative variance reflects unit rates higher than base rates.
Summary by RU Group TDCJ
Mainframe $151,305
Print-Mail $16,161
Consolidated Server ($1,666)
Non-Consolidated Server $24,346
Consolidated Server Storage & Tape ($855)
Non-consolidated Server Storage & Tape $40,935
DBaaS
TDCJ Net Posture of Summary RU Results $230,226
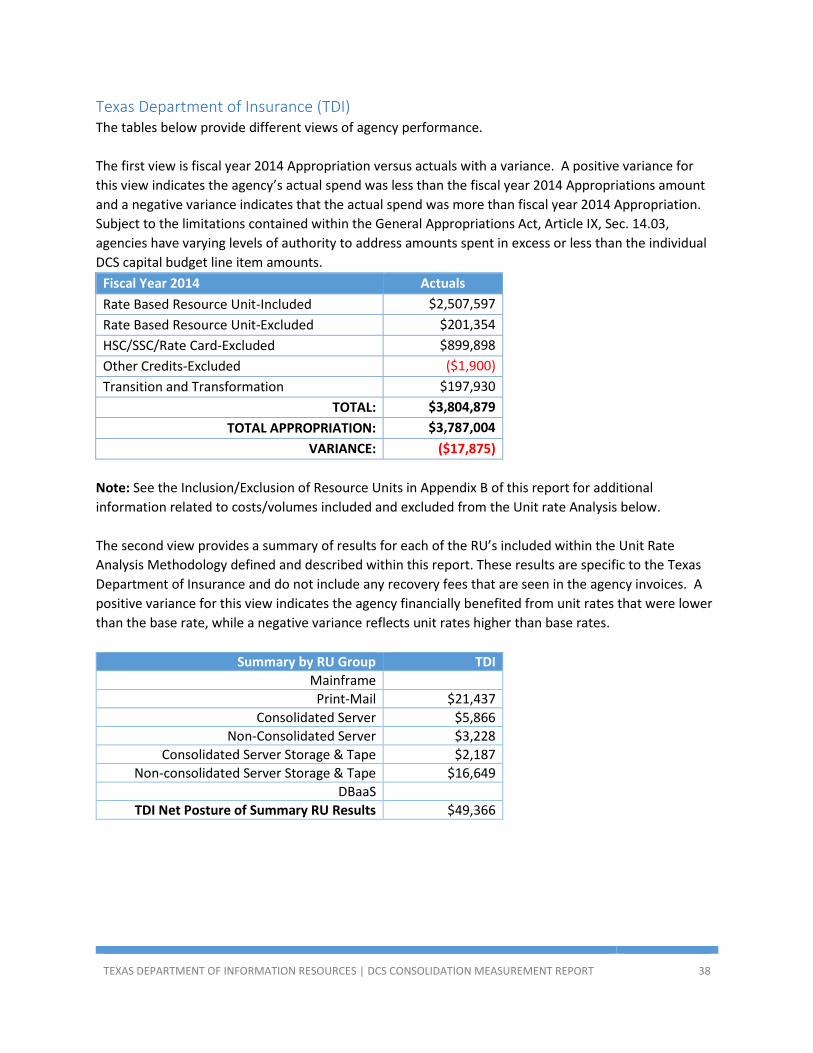
TEXAS DEPARTMENT OF INFORMATION RESOURCES | DCS CONSOLIDATION MEASUREMENT REPORT 38
Texas Department of Insurance (TDI) The tables below provide different views of agency performance.
The first view is fiscal year 2014 Appropriation versus actuals with a variance. A positive variance for
this view indicates the agency’s actual spend was less than the fiscal year 2014 Appropriations amount
and a negative variance indicates that the actual spend was more than fiscal year 2014 Appropriation.
Subject to the limitations contained within the General Appropriations Act, Article IX, Sec. 14.03,
agencies have varying levels of authority to address amounts spent in excess or less than the individual
DCS capital budget line item amounts.
Fiscal Year 2014 Actuals
Rate Based Resource Unit-Included $2,507,597
Rate Based Resource Unit-Excluded $201,354
HSC/SSC/Rate Card-Excluded $899,898
Other Credits-Excluded ($1,900)
Transition and Transformation $197,930
TOTAL: $3,804,879
TOTAL APPROPRIATION: $3,787,004
VARIANCE: ($17,875)
Note: See the Inclusion/Exclusion of Resource Units in Appendix B of this report for additional
information related to costs/volumes included and excluded from the Unit rate Analysis below.
The second view provides a summary of results for each of the RU’s included within the Unit Rate
Analysis Methodology defined and described within this report. These results are specific to the Texas
Department of Insurance and do not include any recovery fees that are seen in the agency invoices. A
positive variance for this view indicates the agency financially benefited from unit rates that were lower
than the base rate, while a negative variance reflects unit rates higher than base rates.
Summary by RU Group TDI
Mainframe
Print-Mail $21,437
Consolidated Server $5,866
Non-Consolidated Server $3,228
Consolidated Server Storage & Tape $2,187
Non-consolidated Server Storage & Tape $16,649
DBaaS
TDI Net Posture of Summary RU Results $49,366

TEXAS DEPARTMENT OF INFORMATION RESOURCES | DCS CONSOLIDATION MEASUREMENT REPORT 39
Texas Department of Licensing and Regulation (TDLR) The tables below provide different views of agency performance.
The first view is fiscal year 2014 Appropriation versus actuals with a variance. A positive variance for
this view indicates the agency’s actual spend was less than the fiscal year 2014 Appropriations amount
and a negative variance indicates that the actual spend was more than fiscal year 2014 Appropriation.
Subject to the limitations contained within the General Appropriations Act, Article IX, Sec. 14.03,
agencies have varying levels of authority to address amounts spent in excess or less than the individual
DCS capital budget line item amounts.
Fiscal Year 2014 Actuals
Rate Based Resource Unit-Included $322,429
Rate Based Resource Unit-Excluded $5,113
HSC/SSC/Rate Card-Excluded $133,164
Other Credits-Excluded ($595)
Transition and Transformation $46,346
TOTAL: $506,457
TOTAL APPROPRIATION: $485,970
VARIANCE: ($20,487)
Note: See the Inclusion/Exclusion of Resource Units in Appendix B of this report for additional
information related to costs/volumes included and excluded from the Unit rate Analysis below.
The second view provides a summary of results for each of the RU’s included within the Unit Rate
Analysis Methodology defined and described within this report. These results are specific to the Texas
Department of Licensing and Regulation and do not include any recovery fees that are seen in the
agency invoices. A positive variance for this view indicates the agency financially benefited from unit
rates that were lower than the base rate, while a negative variance reflects unit rates higher than base
rates.
Summary by RU Group TDLR
Mainframe
Print-Mail
Consolidated Server $6,662
Non-Consolidated Server $247
Consolidated Server Storage & Tape $986
Non-consolidated Server Storage & Tape $6,270
DBaaS
TDLR Net Posture of Summary RU Results $14,165

TEXAS DEPARTMENT OF INFORMATION RESOURCES | DCS CONSOLIDATION MEASUREMENT REPORT 40
Texas Education Agency (TEA) The tables below provide different views of agency performance.
The first view is fiscal year 2014 Appropriation versus actuals with a variance. A positive variance for
this view indicates the agency’s actual spend was less than the fiscal year 2014 Appropriations amount
and a negative variance indicates that the actual spend was more than fiscal year 2014 Appropriation.
Subject to the limitations contained within the General Appropriations Act, Article IX, Sec. 14.03,
agencies have varying levels of authority to address amounts spent in excess or less than the individual
DCS capital budget line item amounts.
Fiscal Year 2014 Actuals
Rate Based Resource Unit-Included $7,057,977
Rate Based Resource Unit-Excluded $119,577
HSC/SSC/Rate Card-Excluded $3,622,468
Other Credits-Excluded ($2,350)
Transition and Transformation $595,466
TOTAL: $11,393,138
TOTAL APPROPRIATION: $11,244,179
VARIANCE: ($148,959)
Note: See the Inclusion/Exclusion of Resource Units in Appendix B of this report for additional
information related to costs/volumes included and excluded from the Unit rate Analysis below.
The second view provides a summary of results for each of the RU’s included within the Unit Rate
Analysis Methodology defined and described within this report. These results are specific to the Texas
Education Agency and do not include any recovery fees that are seen in the agency invoices. A positive
variance for this view indicates the agency financially benefited from unit rates that were lower than the
base rate, while a negative variance reflects unit rates higher than base rates.
Summary by RU Group TEA
Mainframe
Print-Mail $144
Consolidated Server $52,367
Non-Consolidated Server ($69,724)
Consolidated Server Storage & Tape $14,383
Non-consolidated Server Storage & Tape $104,974
DBaaS ($9,976)
TEA Net Posture of Summary RU Results $92,168

TEXAS DEPARTMENT OF INFORMATION RESOURCES | DCS CONSOLIDATION MEASUREMENT REPORT 41
Texas Facilities Commission (TFC) The tables below provide different views of agency performance.
The first view is fiscal year 2014 Appropriation versus actuals with a variance. A positive variance for
this view indicates the agency’s actual spend was less than the fiscal year 2014 Appropriations amount
and a negative variance indicates that the actual spend was more than fiscal year 2014 Appropriation.
Subject to the limitations contained within the General Appropriations Act, Article IX, Sec. 14.03,
agencies have varying levels of authority to address amounts spent in excess or less than the individual
DCS capital budget line item amounts.
Fiscal Year 2014 Actuals
Rate Based Resource Unit-Included $114,105
Rate Based Resource Unit-Excluded $23,847
HSC/SSC/Rate Card-Excluded $13,967
Other Credits-Excluded ($208)
Transition and Transformation $18,390
TOTAL: $170,101
TOTAL APPROPRIATION: $175,528
VARIANCE: $5,428
Note: See the Inclusion/Exclusion of Resource Units in Appendix B of this report for additional
information related to costs/volumes included and excluded from the Unit rate Analysis below.
The second view provides a summary of results for each of the RU’s included within the Unit Rate
Analysis Methodology defined and described within this report. These results are specific to the Texas
Facilities Commission and do not include any recovery fees that are seen in the agency invoices. A
positive variance for this view indicates the agency financially benefited from unit rates that were lower
than the base rate, while a negative variance reflects unit rates higher than base rates.
Summary by RU Group TFC
Mainframe
Print-Mail
Consolidated Server $1,678
Non-Consolidated Server $454
Consolidated Server Storage & Tape $498
Non-consolidated Server Storage & Tape $1,431
DBaaS
TFC Net Posture of Summary RU Results $4,061
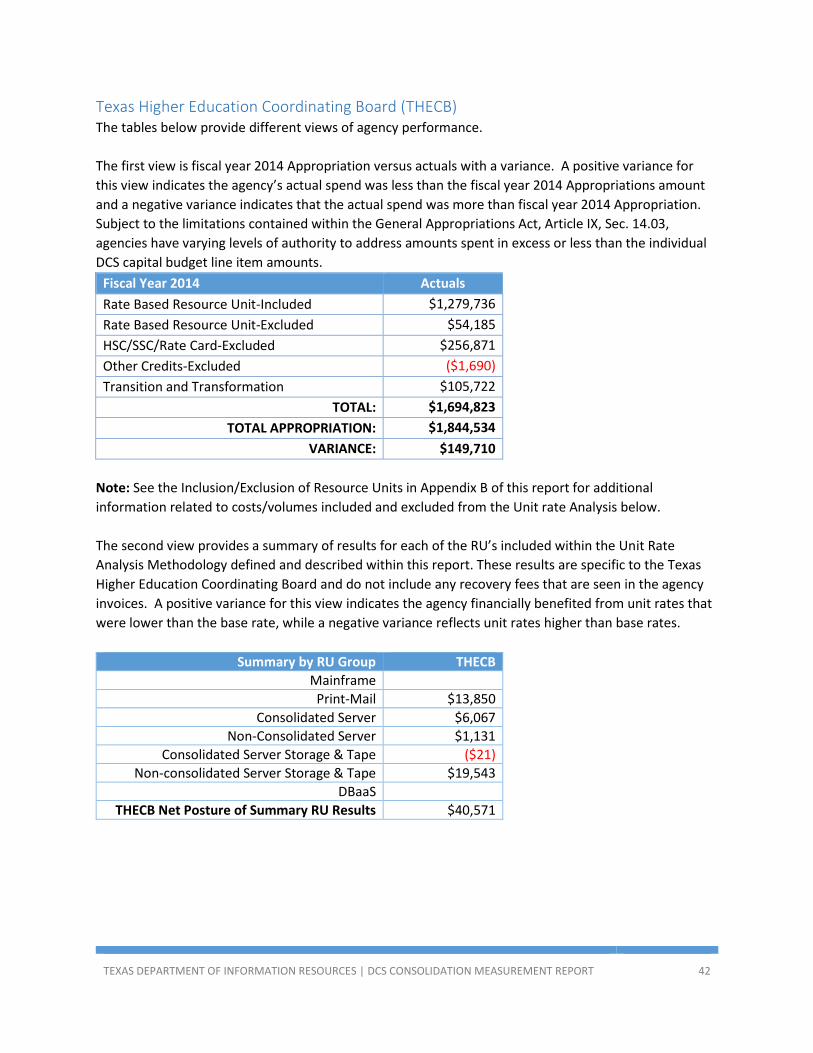
TEXAS DEPARTMENT OF INFORMATION RESOURCES | DCS CONSOLIDATION MEASUREMENT REPORT 42
Texas Higher Education Coordinating Board (THECB) The tables below provide different views of agency performance.
The first view is fiscal year 2014 Appropriation versus actuals with a variance. A positive variance for
this view indicates the agency’s actual spend was less than the fiscal year 2014 Appropriations amount
and a negative variance indicates that the actual spend was more than fiscal year 2014 Appropriation.
Subject to the limitations contained within the General Appropriations Act, Article IX, Sec. 14.03,
agencies have varying levels of authority to address amounts spent in excess or less than the individual
DCS capital budget line item amounts.
Fiscal Year 2014 Actuals
Rate Based Resource Unit-Included $1,279,736
Rate Based Resource Unit-Excluded $54,185
HSC/SSC/Rate Card-Excluded $256,871
Other Credits-Excluded ($1,690)
Transition and Transformation $105,722
TOTAL: $1,694,823
TOTAL APPROPRIATION: $1,844,534
VARIANCE: $149,710
Note: See the Inclusion/Exclusion of Resource Units in Appendix B of this report for additional
information related to costs/volumes included and excluded from the Unit rate Analysis below.
The second view provides a summary of results for each of the RU’s included within the Unit Rate
Analysis Methodology defined and described within this report. These results are specific to the Texas
Higher Education Coordinating Board and do not include any recovery fees that are seen in the agency
invoices. A positive variance for this view indicates the agency financially benefited from unit rates that
were lower than the base rate, while a negative variance reflects unit rates higher than base rates.
Summary by RU Group THECB
Mainframe
Print-Mail $13,850
Consolidated Server $6,067
Non-Consolidated Server $1,131
Consolidated Server Storage & Tape ($21)
Non-consolidated Server Storage & Tape $19,543
DBaaS
THECB Net Posture of Summary RU Results $40,571
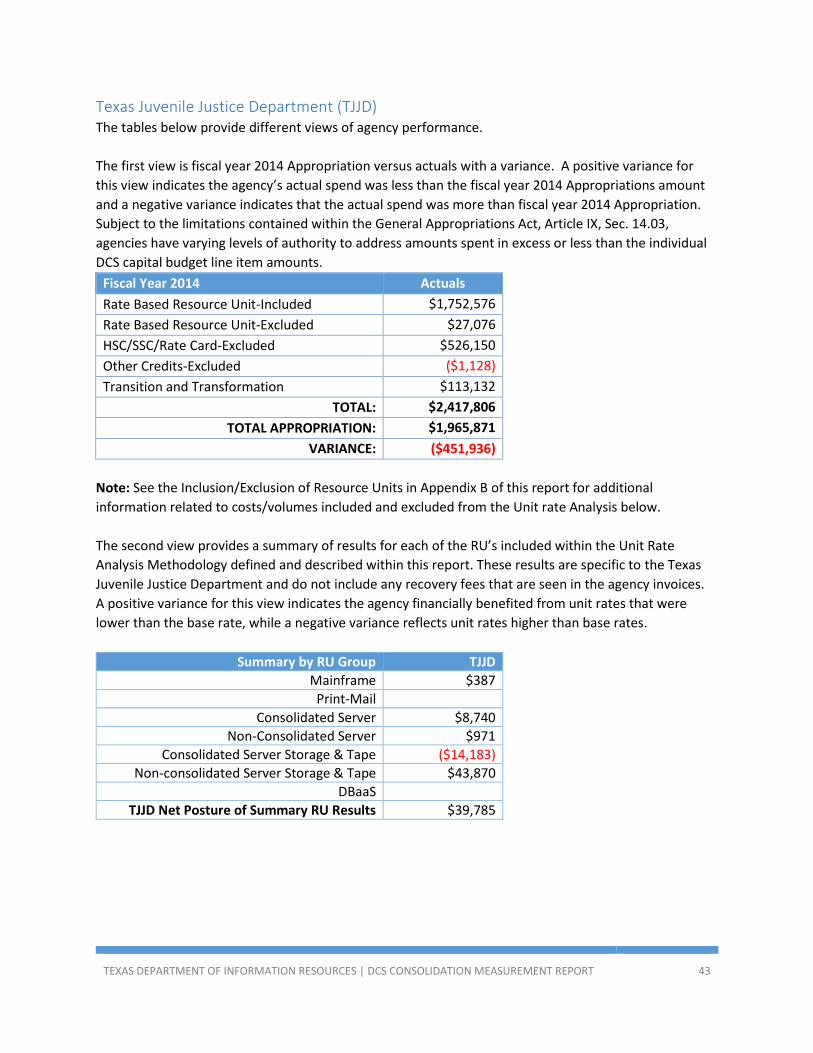
TEXAS DEPARTMENT OF INFORMATION RESOURCES | DCS CONSOLIDATION MEASUREMENT REPORT 43
Texas Juvenile Justice Department (TJJD) The tables below provide different views of agency performance.
The first view is fiscal year 2014 Appropriation versus actuals with a variance. A positive variance for
this view indicates the agency’s actual spend was less than the fiscal year 2014 Appropriations amount
and a negative variance indicates that the actual spend was more than fiscal year 2014 Appropriation.
Subject to the limitations contained within the General Appropriations Act, Article IX, Sec. 14.03,
agencies have varying levels of authority to address amounts spent in excess or less than the individual
DCS capital budget line item amounts.
Fiscal Year 2014 Actuals
Rate Based Resource Unit-Included $1,752,576
Rate Based Resource Unit-Excluded $27,076
HSC/SSC/Rate Card-Excluded $526,150
Other Credits-Excluded ($1,128)
Transition and Transformation $113,132
TOTAL: $2,417,806
TOTAL APPROPRIATION: $1,965,871
VARIANCE: ($451,936)
Note: See the Inclusion/Exclusion of Resource Units in Appendix B of this report for additional
information related to costs/volumes included and excluded from the Unit rate Analysis below.
The second view provides a summary of results for each of the RU’s included within the Unit Rate
Analysis Methodology defined and described within this report. These results are specific to the Texas
Juvenile Justice Department and do not include any recovery fees that are seen in the agency invoices.
A positive variance for this view indicates the agency financially benefited from unit rates that were
lower than the base rate, while a negative variance reflects unit rates higher than base rates.
Summary by RU Group TJJD
Mainframe $387
Print-Mail
Consolidated Server $8,740
Non-Consolidated Server $971
Consolidated Server Storage & Tape ($14,183)
Non-consolidated Server Storage & Tape $43,870
DBaaS
TJJD Net Posture of Summary RU Results $39,785

TEXAS DEPARTMENT OF INFORMATION RESOURCES | DCS CONSOLIDATION MEASUREMENT REPORT 44
Texas Military Department (TMD) The tables below provide different views of agency performance.
The first view is fiscal year 2014 Appropriation versus actuals with a variance. A positive variance for
this view indicates the agency’s actual spend was less than the fiscal year 2014 Appropriations amount
and a negative variance indicates that the actual spend was more than fiscal year 2014 Appropriation.
Subject to the limitations contained within the General Appropriations Act, Article IX, Sec. 14.03,
agencies have varying levels of authority to address amounts spent in excess or less than the individual
DCS capital budget line item amounts.
Fiscal Year 2014 Actuals
Rate Based Resource Unit-Included $9,574
Rate Based Resource Unit-Excluded $325
HSC/SSC/Rate Card-Excluded
Other Credits-Excluded
Transition and Transformation
TOTAL: $9,899
TOTAL APPROPRIATION: $0
VARIANCE: ($9,899)
Note: See the Inclusion/Exclusion of Resource Units in Appendix B of this report for additional
information related to costs/volumes included and excluded from the Unit rate Analysis below.
The second view provides a summary of results for each of the RU’s included within the Unit Rate
Analysis Methodology defined and described within this report. These results are specific to the Texas
Military Department and do not include any recovery fees that are seen in the agency invoices. A
positive variance for this view indicates the agency financially benefited from unit rates that were lower
than the base rate, while a negative variance reflects unit rates higher than base rates.
Summary by RU Group TMD
Mainframe
Print-Mail
Consolidated Server $277
Non-Consolidated Server
Consolidated Server Storage & Tape
Non-consolidated Server Storage & Tape
DBaaS
TMD Net Posture of Summary RU Results $277

TEXAS DEPARTMENT OF INFORMATION RESOURCES | DCS CONSOLIDATION MEASUREMENT REPORT 45
Texas Parks and Wildlife Department (TPWD) The tables below provide different views of agency performance.
The first view is fiscal year 2014 Appropriation versus actuals with a variance. A positive variance for
this view indicates the agency’s actual spend was less than the fiscal year 2014 Appropriations amount
and a negative variance indicates that the actual spend was more than fiscal year 2014 Appropriation.
Subject to the limitations contained within the General Appropriations Act, Article IX, Sec. 14.03,
agencies have varying levels of authority to address amounts spent in excess or less than the individual
DCS capital budget line item amounts.
Fiscal Year 2014 Actuals
Rate Based Resource Unit-Included $2,154,072
Rate Based Resource Unit-Excluded $69,014
HSC/SSC/Rate Card-Excluded $1,770,809
Other Credits-Excluded ($931)
Transition and Transformation $294,122
TOTAL: $4,287,085
TOTAL APPROPRIATION: $3,960,202
VARIANCE: ($326,883)
Note: See the Inclusion/Exclusion of Resource Units in Appendix B of this report for additional
information related to costs/volumes included and excluded from the Unit rate Analysis below.
The second view provides a summary of results for each of the RU’s included within the Unit Rate
Analysis Methodology defined and described within this report. These results are specific to the Texas
Parks and Wildlife Department and do not include any recovery fees that are seen in the agency
invoices. A positive variance for this view indicates the agency financially benefited from unit rates that
were lower than the base rate, while a negative variance reflects unit rates higher than base rates.
Summary by RU Group TPWD
Mainframe
Print-Mail
Consolidated Server $2,178
Non-Consolidated Server ($8,039)
Consolidated Server Storage & Tape ($236)
Non-consolidated Server Storage & Tape $48,823
DBaaS ($1,343)
TPWD Net Posture of Summary RU Results $41,383

TEXAS DEPARTMENT OF INFORMATION RESOURCES | DCS CONSOLIDATION MEASUREMENT REPORT 46
Texas State Library and Archives Commission (TSLAC) The tables below provide different views of agency performance.
The first view is fiscal year 2014 Appropriation versus actuals with a variance. A positive variance for
this view indicates the agency’s actual spend was less than the fiscal year 2014 Appropriations amount
and a negative variance indicates that the actual spend was more than fiscal year 2014 Appropriation.
Subject to the limitations contained within the General Appropriations Act, Article IX, Sec. 14.03,
agencies have varying levels of authority to address amounts spent in excess or less than the individual
DCS capital budget line item amounts.
Fiscal Year 2014 Actuals
Rate Based Resource Unit-Included $280,277
Rate Based Resource Unit-Excluded ($331)
HSC/SSC/Rate Card-Excluded $6,781
Other Credits-Excluded ($1,353)
Transition and Transformation $26,319
TOTAL: $311,693
TOTAL APPROPRIATION: $379,452
VARIANCE: $67,759
Note: See the Inclusion/Exclusion of Resource Units in Appendix B of this report for additional
information related to costs/volumes included and excluded from the Unit rate Analysis below.
The second view provides a summary of results for each of the RU’s included within the Unit Rate
Analysis Methodology defined and described within this report. These results are specific to the Texas
State Library and Archives Commission and do not include any recovery fees that are seen in the agency
invoices. A positive variance for this view indicates the agency financially benefited from unit rates that
were lower than the base rate, while a negative variance reflects unit rates higher than base rates.
Summary by RU Group TSLAC
Mainframe
Print-Mail
Consolidated Server $2,584
Non-Consolidated Server $454
Consolidated Server Storage & Tape $837
Non-consolidated Server Storage & Tape $1,624
DBaaS
TSLAC Net Posture of Summary RU Results $5,498

TEXAS DEPARTMENT OF INFORMATION RESOURCES | DCS CONSOLIDATION MEASUREMENT REPORT 47
Texas Veterans Commission (TVC) The tables below provide different views of agency performance.
The first view is fiscal year 2014 Appropriation versus actuals with a variance. A positive variance for
this view indicates the agency’s actual spend was less than the fiscal year 2014 Appropriations amount
and a negative variance indicates that the actual spend was more than fiscal year 2014 Appropriation.
Subject to the limitations contained within the General Appropriations Act, Article IX, Sec. 14.03,
agencies have varying levels of authority to address amounts spent in excess or less than the individual
DCS capital budget line item amounts.
Fiscal Year 2014 Actuals
Rate Based Resource Unit-Included $47,602
Rate Based Resource Unit-Excluded $1,879
HSC/SSC/Rate Card-Excluded $7,864
Other Credits-Excluded ($34)
Transition and Transformation $1,861
TOTAL: $59,172
TOTAL APPROPRIATION: $67,550
VARIANCE: $8,377
Note: See the Inclusion/Exclusion of Resource Units in Appendix B of this report for additional
information related to costs/volumes included and excluded from the Unit rate Analysis below.
The second view provides a summary of results for each of the RU’s included within the Unit Rate
Analysis Methodology defined and described within this report. These results are specific to the Texas
Veterans Commission and do not include any recovery fees that are seen in the agency invoices. A
positive variance for this view indicates the agency financially benefited from unit rates that were lower
than the base rate, while a negative variance reflects unit rates higher than base rates.
Summary by RU Group TVC
Mainframe
Print-Mail
Consolidated Server $1,655
Non-Consolidated Server
Consolidated Server Storage & Tape $109
Non-consolidated Server Storage & Tape $667
DBaaS
TVC Net Posture of Summary RU Results $2,430

TEXAS DEPARTMENT OF INFORMATION RESOURCES | DCS CONSOLIDATION MEASUREMENT REPORT 48
Texas Workforce Commission (TWC) The tables below provide different views of agency performance.
The first view is fiscal year 2014 Appropriation versus actuals with a variance. A positive variance for
this view indicates the agency’s actual spend was less than the fiscal year 2014 Appropriations amount
and a negative variance indicates that the actual spend was more than fiscal year 2014 Appropriation.
Subject to the limitations contained within the General Appropriations Act, Article IX, Sec. 14.03,
agencies have varying levels of authority to address amounts spent in excess or less than the individual
DCS capital budget line item amounts.
Fiscal Year 2014 Actuals
Rate Based Resource Unit-Included $15,855,800
Rate Based Resource Unit-Excluded $359,093
HSC/SSC/Rate Card-Excluded $2,980,120
Other Credits-Excluded ($2,272)
Transition and Transformation $747,689
TOTAL: $19,940,430
TOTAL APPROPRIATION: $22,844,821
VARIANCE: $2,904,391
Note: See the Inclusion/Exclusion of Resource Units in Appendix B of this report for additional
information related to costs/volumes included and excluded from the Unit rate Analysis below.
The second view provides a summary of results for each of the RU’s included within the Unit Rate
Analysis Methodology defined and described within this report. These results are specific to the Texas
Workforce Commission and do not include any recovery fees that are seen in the agency invoices. A
positive variance for this view indicates the agency financially benefited from unit rates that were lower
than the base rate, while a negative variance reflects unit rates higher than base rates.
Summary by RU Group TWC
Mainframe $166,907
Print-Mail $344,865
Consolidated Server $37,231
Non-Consolidated Server $6,182
Consolidated Server Storage & Tape $20,836
Non-consolidated Server Storage & Tape $20,709
DBaaS
TWC Net Posture of Summary RU Results $596,730

TEXAS DEPARTMENT OF INFORMATION RESOURCES | DCS CONSOLIDATION MEASUREMENT REPORT 49
Texas Water Development Board (TWDB) The tables below provide different views of agency performance.
The first view is fiscal year 2014 Appropriation versus actuals with a variance. A positive variance for
this view indicates the agency’s actual spend was less than the fiscal year 2014 Appropriations amount
and a negative variance indicates that the actual spend was more than fiscal year 2014 Appropriation.
Subject to the limitations contained within the General Appropriations Act, Article IX, Sec. 14.03,
agencies have varying levels of authority to address amounts spent in excess or less than the individual
DCS capital budget line item amounts.
Fiscal Year 2014 Actuals
Rate Based Resource Unit-Included $997,204
Rate Based Resource Unit-Excluded $14,677
HSC/SSC/Rate Card-Excluded $76,273
Other Credits-Excluded ($1,179)
Transition and Transformation $106,652
TOTAL: $1,193,627
TOTAL APPROPRIATION: $1,936,140
VARIANCE: $742,513
Note: See the Inclusion/Exclusion of Resource Units in Appendix B of this report for additional
information related to costs/volumes included and excluded from the Unit rate Analysis below.
The second view provides a summary of results for each of the RU’s included within the Unit Rate
Analysis Methodology defined and described within this report. These results are specific to the Texas
Water Development Board and do not include any recovery fees that are seen in the agency invoices. A
positive variance for this view indicates the agency financially benefited from unit rates that were lower
than the base rate, while a negative variance reflects unit rates higher than base rates.
Summary by RU Group TWDB
Mainframe
Print-Mail
Consolidated Server $707
Non-Consolidated Server $1,362
Consolidated Server Storage & Tape $168
Non-consolidated Server Storage & Tape $49,962
DBaaS
TWDB Net Posture of Summary RU Results $52,199

TEXAS DEPARTMENT OF INFORMATION RESOURCES | DCS CONSOLIDATION MEASUREMENT REPORT 50
Texas Department of Motor Vehicles (TXDMV) The tables below provide different views of agency performance.
The first view is fiscal year 2014 Appropriation versus actuals with a variance. A positive variance for
this view indicates the agency’s actual spend was less than the fiscal year 2014 Appropriations amount
and a negative variance indicates that the actual spend was more than fiscal year 2014 Appropriation.
Subject to the limitations contained within the General Appropriations Act, Article IX, Sec. 14.03,
agencies have varying levels of authority to address amounts spent in excess or less than the individual
DCS capital budget line item amounts.
Fiscal Year 2014 Actuals
Rate Based Resource Unit-Included $4,081,283
Rate Based Resource Unit-Excluded $25,109
HSC/SSC/Rate Card-Excluded $788,847
Other Credits-Excluded ($2,412)
Transition and Transformation $188,159
TOTAL: $5,080,986
TOTAL APPROPRIATION: $3,808,156
VARIANCE: ($1,272,830)
Note: See the Inclusion/Exclusion of Resource Units in Appendix B of this report for additional
information related to costs/volumes included and excluded from the Unit rate Analysis below.
The second view provides a summary of results for each of the RU’s included within the Unit Rate
Analysis Methodology defined and described within this report. These results are specific to the Texas
Department of Motor Vehicles and do not include any recovery fees that are seen in the agency
invoices. A positive variance for this view indicates the agency financially benefited from unit rates that
were lower than the base rate, while a negative variance reflects unit rates higher than base rates.
Summary by RU Group TxDMV
Mainframe $8,536
Print-Mail $101,803
Consolidated Server $21,582
Non-Consolidated Server $3,829
Consolidated Server Storage & Tape $8,478
Non-consolidated Server Storage & Tape $26,271
DBaaS
TxDMV Net Posture of Summary RU Results $170,499
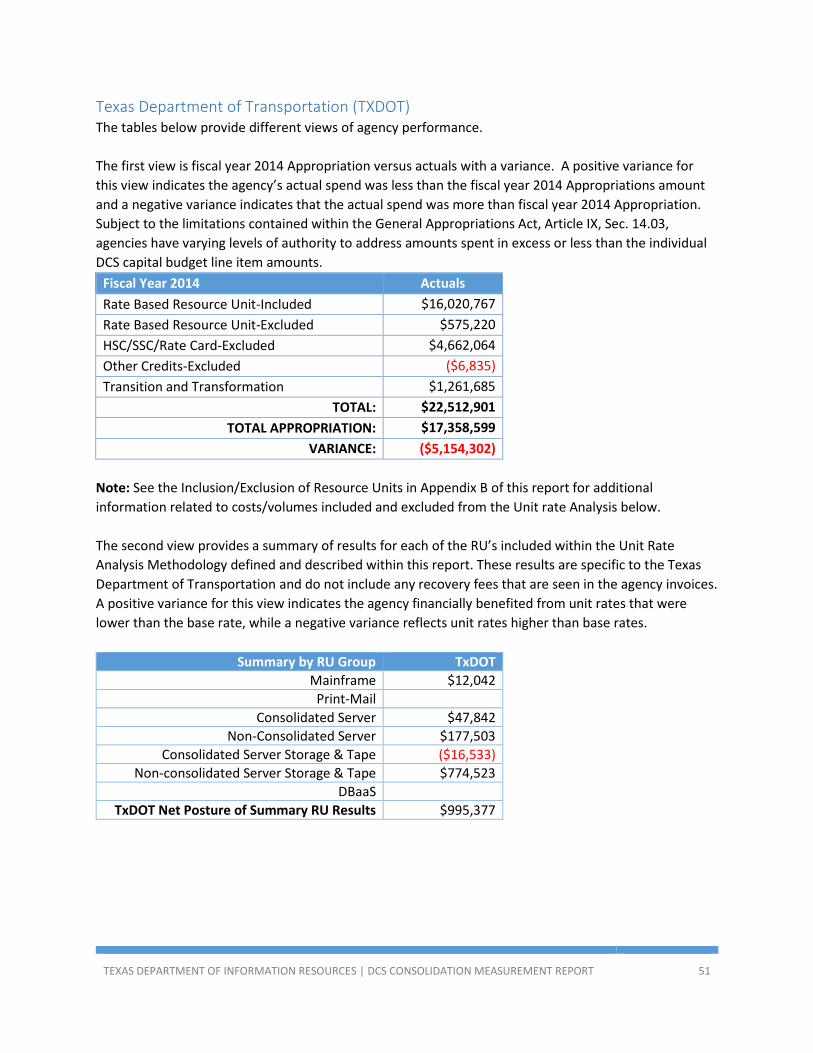
TEXAS DEPARTMENT OF INFORMATION RESOURCES | DCS CONSOLIDATION MEASUREMENT REPORT 51
Texas Department of Transportation (TXDOT) The tables below provide different views of agency performance.
The first view is fiscal year 2014 Appropriation versus actuals with a variance. A positive variance for
this view indicates the agency’s actual spend was less than the fiscal year 2014 Appropriations amount
and a negative variance indicates that the actual spend was more than fiscal year 2014 Appropriation.
Subject to the limitations contained within the General Appropriations Act, Article IX, Sec. 14.03,
agencies have varying levels of authority to address amounts spent in excess or less than the individual
DCS capital budget line item amounts.
Fiscal Year 2014 Actuals
Rate Based Resource Unit-Included $16,020,767
Rate Based Resource Unit-Excluded $575,220
HSC/SSC/Rate Card-Excluded $4,662,064
Other Credits-Excluded ($6,835)
Transition and Transformation $1,261,685
TOTAL: $22,512,901
TOTAL APPROPRIATION: $17,358,599
VARIANCE: ($5,154,302)
Note: See the Inclusion/Exclusion of Resource Units in Appendix B of this report for additional
information related to costs/volumes included and excluded from the Unit rate Analysis below.
The second view provides a summary of results for each of the RU’s included within the Unit Rate
Analysis Methodology defined and described within this report. These results are specific to the Texas
Department of Transportation and do not include any recovery fees that are seen in the agency invoices.
A positive variance for this view indicates the agency financially benefited from unit rates that were
lower than the base rate, while a negative variance reflects unit rates higher than base rates.
Summary by RU Group TxDOT
Mainframe $12,042
Print-Mail
Consolidated Server $47,842
Non-Consolidated Server $177,503
Consolidated Server Storage & Tape ($16,533)
Non-consolidated Server Storage & Tape $774,523
DBaaS
TxDOT Net Posture of Summary RU Results $995,377
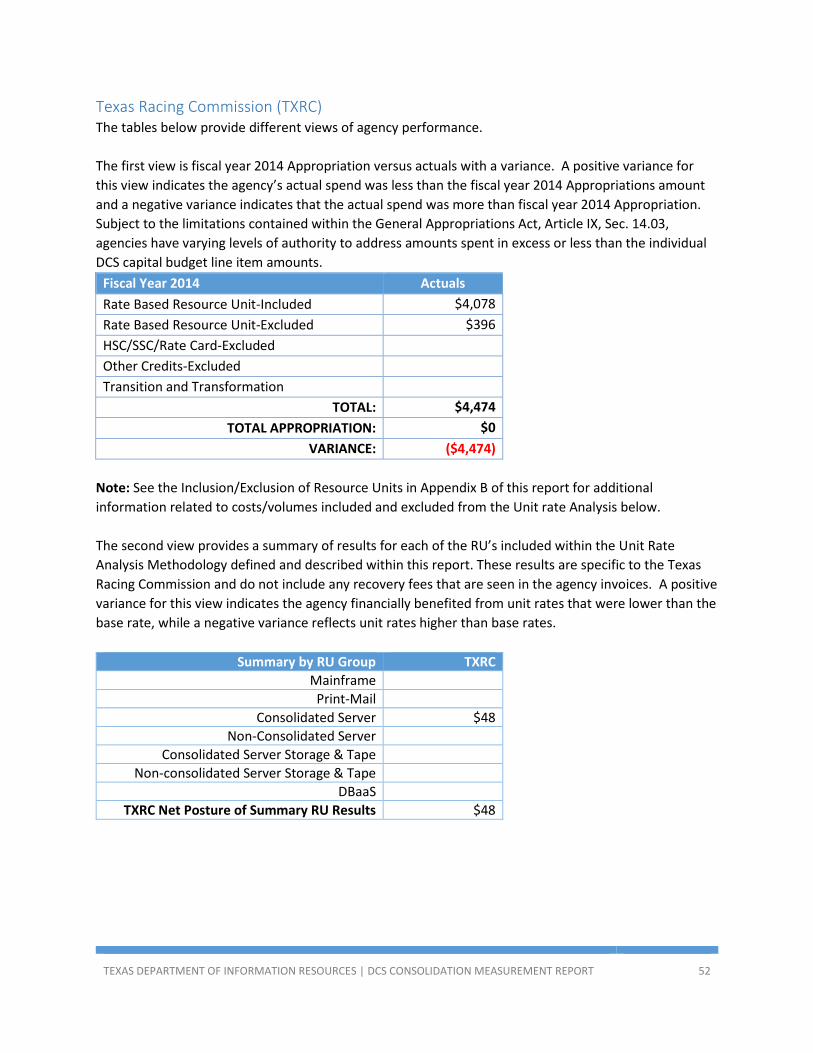
TEXAS DEPARTMENT OF INFORMATION RESOURCES | DCS CONSOLIDATION MEASUREMENT REPORT 52
Texas Racing Commission (TXRC) The tables below provide different views of agency performance.
The first view is fiscal year 2014 Appropriation versus actuals with a variance. A positive variance for
this view indicates the agency’s actual spend was less than the fiscal year 2014 Appropriations amount
and a negative variance indicates that the actual spend was more than fiscal year 2014 Appropriation.
Subject to the limitations contained within the General Appropriations Act, Article IX, Sec. 14.03,
agencies have varying levels of authority to address amounts spent in excess or less than the individual
DCS capital budget line item amounts.
Fiscal Year 2014 Actuals
Rate Based Resource Unit-Included $4,078
Rate Based Resource Unit-Excluded $396
HSC/SSC/Rate Card-Excluded
Other Credits-Excluded
Transition and Transformation
TOTAL: $4,474
TOTAL APPROPRIATION: $0
VARIANCE: ($4,474)
Note: See the Inclusion/Exclusion of Resource Units in Appendix B of this report for additional
information related to costs/volumes included and excluded from the Unit rate Analysis below.
The second view provides a summary of results for each of the RU’s included within the Unit Rate
Analysis Methodology defined and described within this report. These results are specific to the Texas
Racing Commission and do not include any recovery fees that are seen in the agency invoices. A positive
variance for this view indicates the agency financially benefited from unit rates that were lower than the
base rate, while a negative variance reflects unit rates higher than base rates.
Summary by RU Group TXRC
Mainframe
Print-Mail
Consolidated Server $48
Non-Consolidated Server
Consolidated Server Storage & Tape
Non-consolidated Server Storage & Tape
DBaaS
TXRC Net Posture of Summary RU Results $48
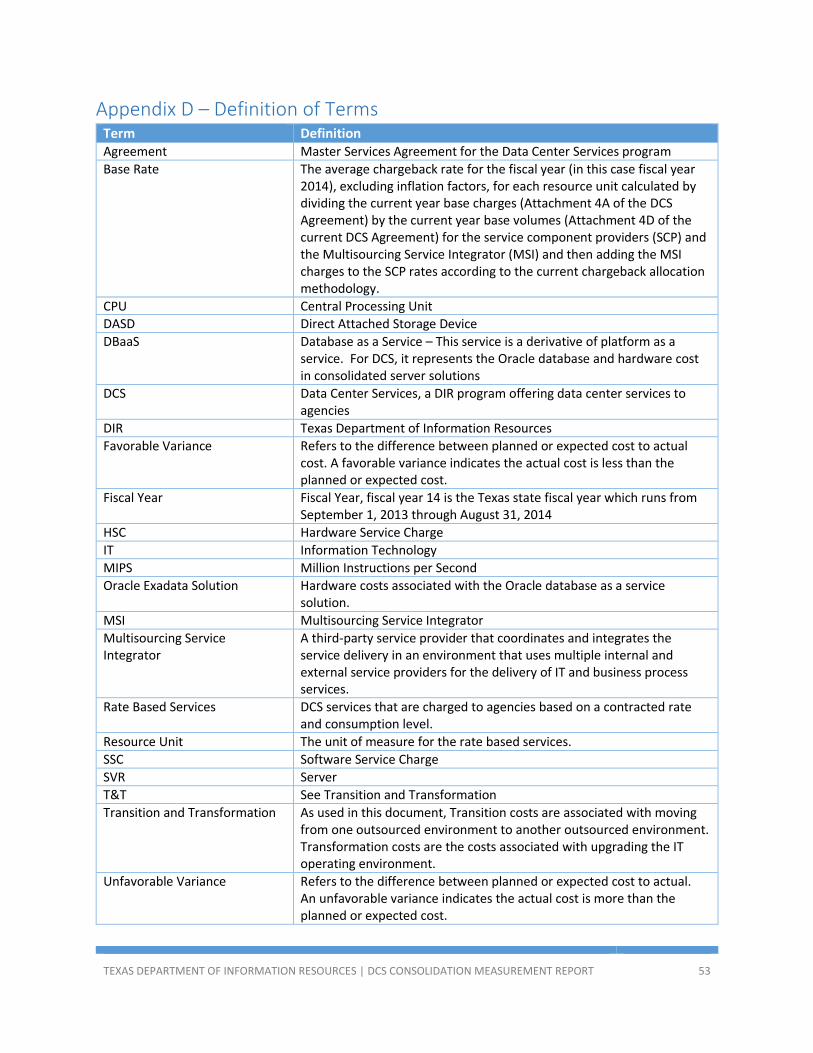
TEXAS DEPARTMENT OF INFORMATION RESOURCES | DCS CONSOLIDATION MEASUREMENT REPORT 53
Appendix D – Definition of Terms Term Definition Agreement Master Services Agreement for the Data Center Services program
Base Rate The average chargeback rate for the fiscal year (in this case fiscal year 2014), excluding inflation factors, for each resource unit calculated by dividing the current year base charges (Attachment 4A of the DCS Agreement) by the current year base volumes (Attachment 4D of the current DCS Agreement) for the service component providers (SCP) and the Multisourcing Service Integrator (MSI) and then adding the MSI charges to the SCP rates according to the current chargeback allocation methodology.
CPU Central Processing Unit DASD Direct Attached Storage Device
DBaaS Database as a Service – This service is a derivative of platform as a service. For DCS, it represents the Oracle database and hardware cost in consolidated server solutions
DCS Data Center Services, a DIR program offering data center services to agencies
DIR Texas Department of Information Resources
Favorable Variance Refers to the difference between planned or expected cost to actual cost. A favorable variance indicates the actual cost is less than the planned or expected cost.
Fiscal Year Fiscal Year, fiscal year 14 is the Texas state fiscal year which runs from September 1, 2013 through August 31, 2014
HSC Hardware Service Charge
IT Information Technology
MIPS Million Instructions per Second
Oracle Exadata Solution Hardware costs associated with the Oracle database as a service solution.
MSI Multisourcing Service Integrator
Multisourcing Service Integrator
A third-party service provider that coordinates and integrates the service delivery in an environment that uses multiple internal and external service providers for the delivery of IT and business process services.
Rate Based Services DCS services that are charged to agencies based on a contracted rate and consumption level.
Resource Unit The unit of measure for the rate based services.
SSC Software Service Charge
SVR Server
T&T See Transition and Transformation
Transition and Transformation As used in this document, Transition costs are associated with moving from one outsourced environment to another outsourced environment. Transformation costs are the costs associated with upgrading the IT operating environment.
Unfavorable Variance Refers to the difference between planned or expected cost to actual. An unfavorable variance indicates the actual cost is more than the planned or expected cost.
TEXAS DEPARTMENT OF INFORMATION RESOURCES | DCS CONSOLIDATION MEASUREMENT REPORT 54
Acknowledgements DIR would like to thank the members of the working group for their participation, collaboration, and
support in developing the cost measurement methodology:
Participant Agency DCS Partner Group
Michael Gray Office of the Attorney General – Child Support Division Partner Group 1
Laura Wolbrueck Health and Human Services Commission Partner Group 2
Robert Von Quintus Texas Workforce Commission Partner Group 3
Dana Reynolds Texas Parks and Wildlife Department Partner Group 4
Lara Coffer Texas Education Agency Partner Group 5