Embed Size (px)
Citation preview

DDoS Attack Volume Forecasting Using a Statistical Approach
Dongwoo Kwon, Hyeonwoo Kim, Donghyeok An, and Hongtaek Ju Dept. of Computer Engineering
Keimyung University Daegu, Republic of Korea
{dwkwon, hwkim84, donghyeokan, juht}@kmu.ac.kr
Abstract—In this paper, we propose a proactive security method that estimates distributed denial of service (DDoS) attack volume in order to overcome the limitation of the response time of reactive security systems based on intrusion detection. To that end, we define and discuss network intrusion forecasting and intrusion factors in comparison to intrusion detection. Intrusion factors for a DDoS attack are also analyzed and collected from the Honeynet system. Based on the data from the Honeynet system, we conduct correlation and regression analysis, both statistical approaches, to predict the potential DDoS attack volume for the network security of our university. By combining network intrusion detection with intrusion forecasting, network operators can take active countermeasures based on the forecasting results and strengthen the network security.
Keywords—DDoS attack; DDoS forecasting; proactive security; intrusion forecasting; regression analysis; network security
I. INTRODUCTION
Because of advances in network infrastructure and the proliferation of various application services based on network infrastructure, network security has become essential. Companies and organizations deploy network security appliances, such as firewalls, intrusion prevention systems (IPS), and deep packet inspection (DPI) systems, to protect their network infrastructure against malicious intruders. These security systems are reactive; when a security appliance detects intrusion, it filters the corresponding network traffic or forwards the traffic to a sinkhole.
However, the effectiveness of reactive security systems based on intrusion detection is limited by their response time to an attack. A distributed denial of service (DDoS) attack is an obvious example. A DDoS attack disables a target server by transferring malicious and massive network traffic. Due to the characteristics of a distributed attack, it is difficult precisely to distinguish attack packets from all incoming traffic. When reactive security systems detect the attack, the massive traffic is already transferred into the target network and server. The throughput of security appliances determines whether the attack can be blocked and network service can be operated normally [1]. If the volume of the DDoS attack can be predicted beforehand, network operators can cope with the attack effectively and efficiently. A proactive security system based on intrusion forecasting is therefore required to provide
high availability and stability of network service.
Various forecasting schemes were proposed in prior studies on network intrusion forecasting [2]–[5]. However, most of the studies were designed to improve the accuracy of intrusion detection, shorten detection time, or predict the next stage of a specific attack from the short-term perspective. The aim of the intrusion forecasting proposed in this paper, which assumes the long-term perspective, is to determine the possibility of network intrusion long before specific attack signs appear prior to the beginning of the attack. In particular, we predict the volume of a potential DDoS attack. Based on the result, we can prepare countermeasures and strengthen network security against the potential DDoS attack beforehand, considering the capacity of existing network devices.
In this paper, the concepts of network intrusion forecasting and intrusion factors are defined and discussed. Intrusion factors for a DDoS attack are also analyzed to predict the potential attack volume. Based on various data collected from the Honeynet system, DDoS attack volume was forecasted using the statistical approaches of correlation and regression analysis [4], [6] to protect the network infrastructure and the server systems of our university. The results then are described.
The rest of this paper is organized as follows. Section II introduces related work. Section III defines the concept of network intrusion forecasting in comparison to intrusion detection. It also discusses intrusion factors and post-processing of intrusion forecasting. Section IV conducts correlation and regression analysis to predict DDoS attack volume. It then describes the results. Finally, Section V concludes this paper and discusses future work.
II. RELATED WORK
Chen et al. [2] proposed a DDoS detection algorithm to improve detection accuracy. They predicted normal network traffic using an autoregressive model. Abnormal network traffic was also detected based on chaos theory. The proposed algorithm effectively detected DDoS attacks by training a neural network with the abnormal traffic. Olabelurin et al. [3] proposed a framework to detect DDoS attack in the preparation stage (i.e., the control stage before the attack stage) based on the analysis of multiple logs. The detection algorithm was an
This work was supported by Institute for Information & communications Technology Promotion (IITP) grant funded by the Korea government (MSIP) (R0126-16-1009, Development of Smart Mediator for Mashup Service and Information Sharing among ICBMS Platform), and Basic Science Research Program through the National Research Foundation of Korea (NRF) funded by the Ministry of Education (NRF-2015R1D1A1A01059786).
978-3-901882-89-0 @2017 IFIP 1083
entropy-based K-means clustering algorithm and demonstrated a low false positive rate.
Fachkha et al. [4] proposed a DDoS forecasting model to shorten the detection time of a DDoS attack. The model predicted botnet size and the intensity of DDoS attacks using several statistical approaches. It provided the short-term trends of the ongoing DDoS attack. Silva et al. [5] proposed a prediction model based on pseudo-random binary sequences (PRBS) and exponential weighted moving averages (EWMA) to forecast the starting point of burst attacks, such as brute-force and DDoS attacks. They also introduced the architecture of the intrusion forecasting system.
Previous work has aimed to improve the accuracy of network intrusion detection, reduce detection time, and analyze short-term intrusion trends. In contrast, our goal is to forecast intrusion as a proactive security method rather than as a means to improve the performance of reactive security systems, such as firewalls and IPSs. From the long-term perspective, intrusion forecasting can complement the limitations of intrusion detection and strengthen network security.
III. NETWORK INTRUSION FORECASTING
A. Intrusion Detection and Forecasting Most network security appliances, such as a firewall, an
IPS, and a DPI system, are reactive security systems based on intrusion detection. These security systems detect anomalous or hostile network traffic and then drop it or forward it to a sinkhole, such as a Honeypot, for security threat analysis. They inspect packet headers and payloads in real time and online to determine whether to block them. In contrast, a proactive security approach based on intrusion forecasting predicts the time, target, type, and intensity of a potential attack and responds to them before the predicted attack occurs [7]. Intrusion forecasting is performed using various logs and statistical data including network traffic traces in real-time/non-real-time modes, and online/offline modes. Table I presents a comparative summary of network intrusion detection and intrusion forecasting.
B. Intrusion Factors for Forecasting Network intrusion factors are required to predict an
intrusion. They are specific information derived from raw data and form the basis for prediction. Intrusion factors are
classified as exterior or interior intrusion factors [7]. Exterior intrusion factors originate outside of the resources that are to be protected. They represent risk factors from the external environment. For example, the number and skill level of the intruders and malicious agents can be considered exterior intrusion factors. The worm spread rate and the latest critical vulnerability of a particular operating system (OS) can be selected as exterior intrusion factors. In the case of a DDoS attack, two exterior intrusion factors can be derived: the number of command and control (C&C) servers and the size of the malicious bot agents. The number of C&C servers and bot agents conveys the number of potential attack channels and attackers, indicating the intensity of the potential attack.
Interior intrusion factors represent why the resources would be chosen as potential attack targets. They are caused by the resources to be protected or by the internal environment where the resource are located. For example, the value of the resources to be protected and the security level of the resources themselves and their environment can be considered interior intrusion factors. The value and the security level of the resources reflect their importance and the cost for attack, respectively. Exterior and interior intrusion factor data can be obtained based on network traffic traces and various log data collected from network security appliances and Honeynet systems. Statistical data gathered from computer emergency response teams (CERTs) can also be used as intrusion factors.
C. Intrusion Forecasting Post-processing The purpose of network intrusion forecasting is to predict a
potential attack in advance and take active countermeasures against the predicted attack. After performing intrusion forecasting, network operators and server administrators should discuss and post-process the forecasting results cooperatively. This intrusion forecasting post-processing can be conducted in an autonomic [8]–[10] or a manual way. According to the forecasting results, the security level of the deployed security appliances can be adjusted as follows. Advanced configuration options that degrade performance but strengthen network security are temporarily enabled. Not only are filtering thresholds related to the predicted attack adjusted but also unapplied signature sets are activated to mitigate the attack. Based on the type and the intensity of the predicted attack, server redundancy and additional security appliances may be prepared to maintain service availability and stability. As a result, intrusion forecasting complements intrusion detection and improves network security.
IV. DDOS ATTACK VOLUME FORECASTING
In this section, we predict the DDoS attack volume in the network infrastructure of our university using correlation and regression analysis. The purpose of the forecasting is to determine whether to deploy an additional IPS into the wireless network at our university.
A. Intrusion Factor Data Collection To obtain raw data for intrusion factor analysis, a Honeynet
system was deployed at our university. The system collected network traffic, IDS logs, and intrusive activity traces between
TABLE I. COMPARATIVE SUMMARY OF NETWORK INTRUSION DETECTION AND FORECASTING
Criterion Intrusion Detection Intrusion Forecasting
Purpose Detecting an intrusion occurring at the current time
Predicting a potential intrusion before the intrusion occurs
Mode Real-time, Online Real-time/Non-real-time, Online/Offline
Raw data Network traffic data Statistical data, logs, and network traffic data
Countermeasure Filtering the network traffic
Establishing and implementing countermeasure policies
Appliance Firewall, IDS/IPS, DPI Intrusion forecasting system
IFIP/IEEE IM 2017 Workshop: 3rd International Workshop on Security for Emerging Distributed Network Technologies - Short Paper1084
December 24, 2010 and August 23, 2011 [7]. We analyzed the collected Honeynet data, including the inbound and outbound network traffic, in [7]. Most of the total inbound traffic was TCP packets for a secure shell (SSH) (92.8%), and the traffic was identified as SSH brute-force attacks to obtain administrator authority of the Honeypot systems without permission. The outbound traffic could not be generated except by the OS, such as DNS queries, because practical application services did not operate in the Honeypot systems. However, after the Honeypot systems were dominated, massive outbound traffic occurred to discover and attack other systems that operate SSH and file transfer protocol (FTP) services.
B. Experimental Method To predict the DDoS attack volume, regression analysis
was applied as a forecasting algorithm. Regression analysis is used to analyze and model the relationship between a dependent value and one or more independent variables. In (1), the regression model accounts for changes in the values of the dependent variable (Y) when one or two of the independent variables (X1 and X2) are adjusted. This analysis method was used effectively to forecast network intrusions in [4] and [6].
Y = f(X) = f(X1, X2) = β0 + β1X1 + β2X2 (1)
The number of malicious bot agents and the value of the server systems at our university to be protected were used as the independent variables for regression analysis. The number of bot agents is the exterior intrusion factor and was estimated from network traffic on the Honeynet based on the following assumptions. First, the purpose of the SSH brute-force attacks on port 22 in the Honeypots is to spread malicious bot agents to create compromised systems (i.e., zombies). Second, the source IP addresses of the attack packets were not spoofed. Third, the systems used for the attack are compromised systems that were already infected by malicious bot agents. In other words, the number of malicious bot agents was estimated based on the non-duplicated number of IP addresses that launched the SSH brute-force attacks.
The value of the server systems to be protected is the interior intrusion factor and was empirically graded from 1 to 10, with 10 being the highest value, based on the importance of providing services and the stored data. The dependent variable is the number of actual detected attacks in a day and was obtained from the logs of the IPSs deployed at our university. All of the statistical analysis was conducted using IBM SPSS Statistics software.
C. Correlation Analysis Correlation analysis helps us understand the statistical
relationship between two variables. Before regression analysis, correlation analysis was conducted to measure the correlation coefficients, which represent the degree of linear dependence and which range from −1 to 1. The closer the absolute value of a correlation coefficient is to 1, the more highly correlated the two variables are.
Table II shows the result of Pearson correlation analysis after removing outliers. The correlation coefficient between the number of bot agents and the number of actual detected attacks
is 0.745. The two variables are thus highly positively correlated, and the result is significant at the 0.01 significance level. Between the value of the attack target and the number of actual attacks, the correlation coefficient of 0.581 also indicates a positive correlation and is significant at the 0.01 significance level. The model predicts that if the number of bot agents were to increase and/or the value of the attack target were higher, the number of actual attacks would increase. There is no correlation between the number of bot agents and the value of the attack target since their correlation coefficient is −0.006.
D. Regression Analysis Multivariate linear regression analysis was conducted using
the number of bot agents as an independent variable, the value of the attack target as an independent variable, and the number of actual detected attacks as a dependent variable after removing outliers. Table III summarizes the regression model. R-squared, which is the coefficient of determination, represents the proportion of variability in a data set that is accounted for by the regression model. R-squared is a number between 0 and 1. If it is 1, the regression model perfectly accounts for variability in the data set. In a multivariate regression analysis with many independent variables, adjusted R-squared is a number that yields a more honest value than estimated R-squared of how much variability in the data the model explains. As shown in Table III, the goodness of fit for our model was high because the adjusted R-squared was 0.896 and this result was significant at the 0.01 significance level.
Table IV shows the regression coefficients resulting from the regression analysis. The standardized coefficients for the number of bot agents and the value of the attack target were 0.748 and 0.585, respectively. Thus, the number of actual attacks was more highly influenced by the number of bot agents than by the value of the attack target. Both of the independent variables were significant at the 0.01 significance level. The regression equation was obtained using (1) and unstandardized coefficients in Table IV as follows.
E = −1497.248 + 396.861 × Nbot + 8621.308 × Vtarget (2)
In (2), Nbot and Vtarget represent the number of bot agents and the value of the attack target, respectively. E represents the estimated number of DDoS attacks in a day. By using (2), we predict the potential DDoS attack volume for our university given the number of bot agents and the value of the target.
TABLE II. RESULT OF CORRELATION ANALYSIS
Variable Number of bot agents
Value of attack target
Number of actual attacks
Number of bot agents
Coefficient 1
Sig. probability -
Value of attack target
Coefficient −.006 1
Sig. probability .935 -
Number of actual attacks
Coefficient .745 .581 1
Sig. probability .000 .000 -
IFIP/IEEE IM 2017 Workshop: 3rd International Workshop on Security for Emerging Distributed Network Technologies - Short Paper 1085
E. Forecasting and Application IPSs have been deployed in the wired networks of our
university. To determine whether the network operators should place an extra IPS in the wireless network, we predicted the potential DDoS attack volume in the network using (2). First, we estimated the number of bot agents in the network using the number of students at our university (i.e., the number of network users) and the percentage of bot agents in our country. The number of students was 23,020 and the percentage of bot agents was 0.49% [11]. The value of the attack target was set to 10, which was the highest possible value.
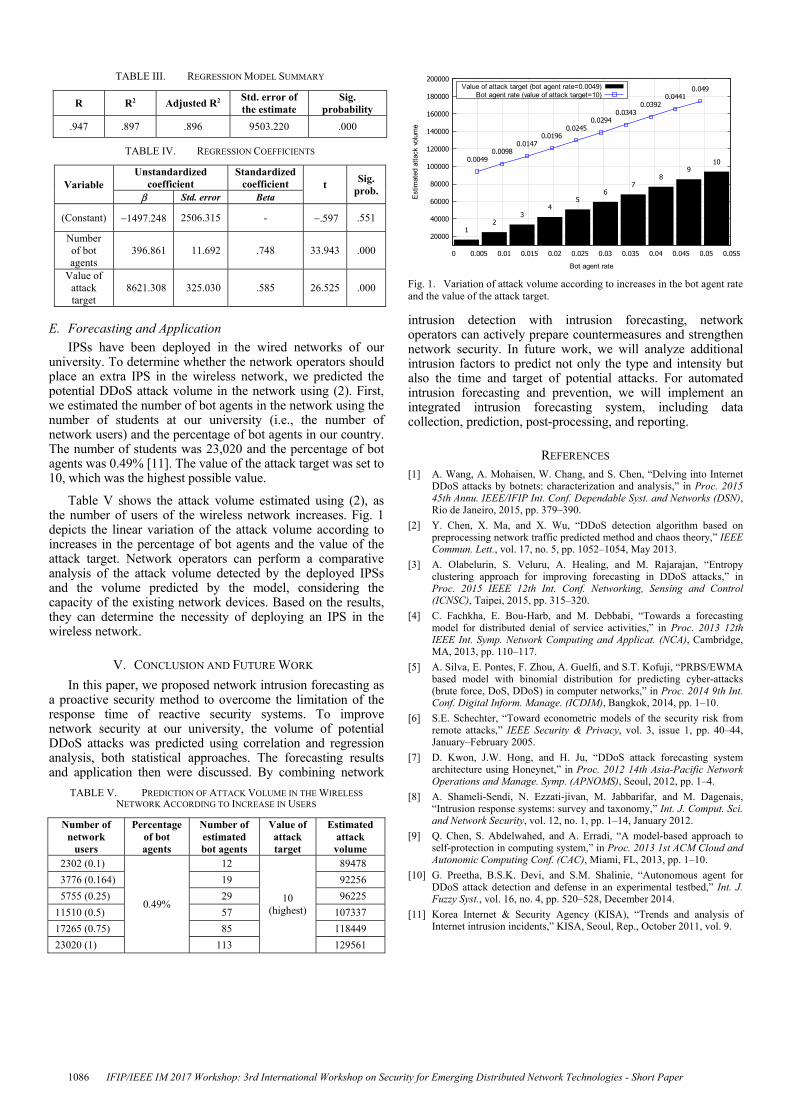
Table V shows the attack volume estimated using (2), as the number of users of the wireless network increases. Fig. 1 depicts the linear variation of the attack volume according to increases in the percentage of bot agents and the value of the attack target. Network operators can perform a comparative analysis of the attack volume detected by the deployed IPSs and the volume predicted by the model, considering the capacity of the existing network devices. Based on the results, they can determine the necessity of deploying an IPS in the wireless network.
V. CONCLUSION AND FUTURE WORK
In this paper, we proposed network intrusion forecasting as a proactive security method to overcome the limitation of the response time of reactive security systems. To improve network security at our university, the volume of potential DDoS attacks was predicted using correlation and regression analysis, both statistical approaches. The forecasting results and application then were discussed. By combining network
intrusion detection with intrusion forecasting, network operators can actively prepare countermeasures and strengthen network security. In future work, we will analyze additional intrusion factors to predict not only the type and intensity but also the time and target of potential attacks. For automated intrusion forecasting and prevention, we will implement an integrated intrusion forecasting system, including data collection, prediction, post-processing, and reporting.
REFERENCES [1] A. Wang, A. Mohaisen, W. Chang, and S. Chen, “Delving into Internet
DDoS attacks by botnets: characterization and analysis,” in Proc. 2015 45th Annu. IEEE/IFIP Int. Conf. Dependable Syst. and Networks (DSN), Rio de Janeiro, 2015, pp. 379–390.
[2] Y. Chen, X. Ma, and X. Wu, “DDoS detection algorithm based on preprocessing network traffic predicted method and chaos theory,” IEEE Commun. Lett., vol. 17, no. 5, pp. 1052–1054, May 2013.
[3] A. Olabelurin, S. Veluru, A. Healing, and M. Rajarajan, “Entropy clustering approach for improving forecasting in DDoS attacks,” in Proc. 2015 IEEE 12th Int. Conf. Networking, Sensing and Control (ICNSC), Taipei, 2015, pp. 315–320.
[4] C. Fachkha, E. Bou-Harb, and M. Debbabi, “Towards a forecasting model for distributed denial of service activities,” in Proc. 2013 12th IEEE Int. Symp. Network Computing and Applicat. (NCA), Cambridge, MA, 2013, pp. 110–117.
[5] A. Silva, E. Pontes, F. Zhou, A. Guelfi, and S.T. Kofuji, “PRBS/EWMA based model with binomial distribution for predicting cyber-attacks (brute force, DoS, DDoS) in computer networks,” in Proc. 2014 9th Int. Conf. Digital Inform. Manage. (ICDIM), Bangkok, 2014, pp. 1–10.
[6] S.E. Schechter, “Toward econometric models of the security risk from remote attacks,” IEEE Security & Privacy, vol. 3, issue 1, pp. 40–44, January–February 2005.
[7] D. Kwon, J.W. Hong, and H. Ju, “DDoS attack forecasting system architecture using Honeynet,” in Proc. 2012 14th Asia-Pacific Network Operations and Manage. Symp. (APNOMS), Seoul, 2012, pp. 1–4.
[8] A. Shameli-Sendi, N. Ezzati-jivan, M. Jabbarifar, and M. Dagenais, “Intrusion response systems: survey and taxonomy,” Int. J. Comput. Sci. and Network Security, vol. 12, no. 1, pp. 1–14, January 2012.
[9] Q. Chen, S. Abdelwahed, and A. Erradi, “A model-based approach to self-protection in computing system,” in Proc. 2013 1st ACM Cloud and Autonomic Computing Conf. (CAC), Miami, FL, 2013, pp. 1–10.
[10] G. Preetha, B.S.K. Devi, and S.M. Shalinie, “Autonomous agent for DDoS attack detection and defense in an experimental testbed,” Int. J. Fuzzy Syst., vol. 16, no. 4, pp. 520–528, December 2014.
[11] Korea Internet & Security Agency (KISA), “Trends and analysis of Internet intrusion incidents,” KISA, Seoul, Rep., October 2011, vol. 9.
TABLE III. REGRESSION MODEL SUMMARY
R R2 Adjusted R2 Std. error of the estimate
Sig. probability
.947 .897 .896 9503.220 .000
TABLE IV. REGRESSION COEFFICIENTS
Variable Unstandardized
coefficient Standardized
coefficient t Sig.
prob. β Std. error Beta
(Constant) −1497.248 2506.315 - −.597 .551
Number of bot agents
396.861 11.692 .748 33.943 .000
Value of attack target
8621.308 325.030 .585 26.525 .000
TABLE V. PREDICTION OF ATTACK VOLUME IN THE WIRELESS NETWORK ACCORDING TO INCREASE IN USERS
Number of network
users
Percentage of bot agents
Number of estimated bot agents
Value of attack target
Estimated attack volume
2302 (0.1)
0.49%
12
10 (highest)
89478
3776 (0.164) 19 92256
5755 (0.25) 29 96225
11510 (0.5) 57 107337
17265 (0.75) 85 118449
23020 (1) 113 129561
Fig. 1. Variation of attack volume according to increases in the bot agent rate and the value of the attack target.
IFIP/IEEE IM 2017 Workshop: 3rd International Workshop on Security for Emerging Distributed Network Technologies - Short Paper1086