Embed Size (px)
DESCRIPTION
Detonation waves
Citation preview

Shock Waves (2001) 11: 53–71
DDT and detonation waves in dust-air mixturesF. Zhang1, H. Gronig2, A. van de Ven2
1 Defence Research Establishment Suffield, BO 4000 Stn Main, Medicine Hat, Alberta T1A 8K6, Canada2 Shock Wave Laboratory, RWTH Aachen, Templergraben 55, 52056 Aachen, Germany
Received 11 February 2000 / Accepted 1 August 2000
Abstract. This paper summarizes the studies of DDT and stable detonation waves in dust-air mixtures atthe Stosswellenlabor of RWTH Aachen. The DDT process and propagation mechanism for stable hetero-geneous dust detonations in air are essentially the same as in the oxygen environment studied previously.The dust DDT process in tubes is composed of a reaction compression stage followed by a reaction shockstage as the pre-detonation process. The transverse waves that couple the shock wave and the chemicalenergy release are responsible for the propagation of a stable dust-air detonation. However, the transversewave spacing of dust-air mixtures is much larger. Therefore, DDT and propagation of a stable detonationin most industrial and agricultural, combustible dust-air mixtures require a tube that has a large diameterbetween 0.1m and 1m and a sufficient length-diameter ratio beyond 100, when an appropriately stronginitiation energy is used. Two dust detonation tubes, 0.14m and 0.3m in diameter, were used for obser-vation of the above-mentioned results in cornstarch, anthraquinone and aluminum dust suspended in air.Smoked-foil technique was also used to measure the cellular structure of dust detonations in the 0.3mdetonation tube.
Key words: Detonations, DDT, Heterogeneous explosions, Multiphase flow, Organic dust explosions, Alu-minum dust explosions
1 Introduction
Organic or metallic fine particles suspended in oxygen orair form an explosive dust mixture. A dust mixture cansustain a deflagration that may lead to a self-sustaineddetonation wave in tubes of sufficient diameter and lengthif the initiation energy is large enough. This was, however,by no means clear since in numerous studies the tubeshad a too small hydraulic diameter and were too short(Kauffman et al. 1984, Peraldi and Veyssiere 1986, Wolan-ski 1991, Li et al. 1993, Gronig 1997). The detonationvelocities determined in these experiments were usually20 to 30% less than those predicted by the equilibriumChapman-Jouguet theory. The observed transition fromdeflagration to detonation mainly exhibited a smooth ac-celeration to the steady state without a violent onset ofdetonation accompanied by a retonation wave. The for-mer phenomenon was termed “quasi-detonation” by Lee(1988). On the other hand, in a tube 0.6m in diameter and42m in length, Gardner et al. (1986) observed the tran-sition to detonation in a coal dust-air mixture at the endof the tube, where the velocity of the combustion wavereached 2850m/s and a peak pressure was measured of81.5 bar. However, the tube, with a length-diameter ratio
Correspondence to: Hans Gronig(e-mail: [email protected])
of 70, was still too short to demonstrate the achievementof a self-sustained detonation wave.
The conclusive evidence of the existence of a self-sustained detonation wave in dust mixtures was estab-lished through detailed observations of the transverse wavestructure of the detonation wave front (Zhang and Gronig1991a, 1992, Zhang et al. 1992). Their results are brieflysummarized in the following three aspects.
1. The propagation mechanism of a self-sustained dustdetonation wave is predominated by the transversewave structure that provides the coupling between theshock wave and the chemical reaction. However, thetransverse wave spacing is much larger than that of ahomogeneous gas detonation owing to the additionaltime scales, inherent in momentum, heat and masstransfer processes between the solid particles and theoxidizing gas environment. Consequently, the propaga-tion of a self-sustained dust detonation wave requiresa large tube diameter and a sufficient tube length.In a tube with 0.14m inner diameter and 17.4m testsection length (i.e., a length-diameter ratio of 124), asingle-head spinning detonation mode and a two-headdetonation mode were observed in 10 µm cornstarchpowder suspended in oxygen, which exhibits a trans-verse wave spacing of πd ∼ 0.4m, 27 times that of astoichiometric hydrogen-air detonation wave.

54 F. Zhang, H. Gronig, A. van de Ven: Dust-air DDT and detonation
2. Owing to the insensitivity of the heterogeneous dustmixtures, transition from deflagration to detonation(DDT) in tubes requires a strong initiation energy anda large length-diameter ratio. In general, a dust DDTprocess can be divided into a slow reaction compres-sion stage in which the compression wave amplificationis coupled with the acceleration of chemical energy re-lease, and a fast reaction shock stage that starts atthe onset of a shock wave with a critical Mach num-ber (Mcrit ∼ 3.1 − 3.5) and ends at the maximum ofan overdriven detonation. The reaction shock stageis mainly determined by the dust mixture itself andthe boundary conditions, whereas the reaction com-pression stage, though, strongly dependent on initia-tion energy and initial turbulence intensity, is respon-sible for the onset of the critical shock wave. In the0.14m tube using an initiation energy of 5 kJ, transi-tion to detonation of cornstarch-oxygen mixtures wasachieved at a distance of about 120 tube diameters.
3. It is generally expected that the equilibrium calcu-lation of the C-J detonation deviates from the ex-perimental values of a heterogeneous dust detonationwave. Except for the uncertainty of the solid particlesin the equilibrium calculations, there are three rea-sons responsible for this deviation: a) the large trans-verse wave spacing results in a non-adiabatic combus-tion; b) contrary to the fundamental postulate of theequilibrium C-J theory, momentum, temperature andchemical equilibrium between the phases may not beachieved at the sonic plane; and c) sedimentation andadhesion of the particles cause difficulties in achievinga uniform two-phase mixture assumed in the equilib-rium C-J theory. However, the deviation of the deto-nation velocity from the equilibrium C-J theory canbe controlled within ten percentages from the exper-imental average values for a self-sustained dust deto-nation wave. The equilibrium C-J theory must be cau-tiously applied to mixtures with rich dust concentra-tions for which the experiments showed a plateau ex-tending from the peak values, probably owing to thelarge time scale of heat transfer from the gaseous prod-ucts to the unburned dust fuel.
In the 0.14m tube, transition to a self-sustained det-onation was also observed in organic dust-air mixturessuch as anthraquinone (Zhang and Gronig 1993). How-ever, in the less sensitive organic dust-air mixtures likecornstarch, DDT was only successful when the initial pres-sure was raised to 2.5 bar (Zhang and Gronig 1991b). Ifthe gas phase scaling relation is valid that the detonationcell size is inversely proportional to the initial pressure(Shchelkin and Troshin 1965), a tube diameter of approx-imately 2 to 2.5 times 0.14m would be required to achievea self-sustained detonation in atmospheric cornstarch-airmixtures. Therefore, a new dust detonation tube was de-veloped with a 0.3m inner diameter and 37m test sectionlength (i.e., a length-diameter ratio of 124). Direct mea-surement of the cell size for a dust detonation wave canalso be conducted in the new 0.3m tube using the smoked-foil technique. In this paper, we summarize the studies of
DDT and detonation waves of cornstarch, anthraquinoneand aluminum dust suspended in air, using the 0.14mtube and the 0.3m tube. The three kinds of dust werechosen due to their broad coverage of different levels ofdust explosion hazard.
2 Experimental details
While the 0.14m dust detonation tube can be found inZhang and Gronig (1991b), Fig. 1 shows a sketch of anew experimental set-up of the large dust detonation tube0.3m in diameter and 40m in length. The tube is madeof stainless steel with a 30mm wall thickness allowingan operational pressure of 250 bar. The whole tube is di-vided into the 3m long initiation section and the 37mlong test section that gives a length-diameter ratio of 124.The latter is composed of 12 tube elements, each 3m long,and additional instrumentation rings clamped between theflanges. All tubes can be interchanged since they are pro-vided with different arrangements of measurement ports.A dump tank, 1.4m in diameter and 6m in length, is lo-cated at the end of the tube to avoid the reflection of thedetonation wave from the end wall. The initiation sectionand dump tank are separated from the test section by thinHostaphan diaphragms prior to the experiment.
The dispersion system follows the same principle asthat of the 0.14m dust detonation tube. Considering thelarge cross section area of the 0.3m tube, each 3m tube el-ement has its own oxidizing gas reservoir of 26 dm3 in vol-ume pressurized to 20 bar. The dispersion system containsstainless steel dispersion tubing of 25mm outer diameter,fixed 6mm above the bottom of the detonation tube. Thedispersion tubing has a row of 1.2mm holes 30mm apartpointing downwards to the bottom of the detonation tube.Before the tube is closed for an experiment, a dust layerof the required concentration is laid on the bottom of thetest section by means of a particularly designed dust cartwhich moves automatically through the entire tube at con-stant speed. The dust is dispersed by the gas jets out ofthe dispersion holes, generated by blowing compressed gasfrom the pressure reservoirs through solenoid valves intothe dispersion tubing. The dispersion time and the pres-sure rise of the dispersion process inside the detonationtube were calibrated in a 0.3m inner diameter Lucite tubethat was connected to the detonation tube. A fairly uni-form dispersion over the cross section was achieved withinabout 500ms as shown in Fig. 2. This dispersion time andthe pressure rise are then used to determine the fillingpressure in the detonation tube to match the desired ini-tial pressure p0 by the time of ignition.
A strong initiation is achieved by a stoichiometric H2-O2 detonation wave that is ignited by 9 spark plugs at theupstream end wall of the ignition section. For a weak ini-tiation a 300 J pyrotechnical igniter is used that consistsof a primer pill with an exploding wire and a small chargeof nitro explosive of 35mg. It is worthwhile noticing that,for determining the KG-factor, an initiation energy of 10 Jwas used, whereas for determination of the KST-factor an

F. Zhang, H. Gronig, A. van de Ven: Dust-air DDT and detonation 55
Fig. 1. Schematic of the 0.3m dust detonationtube with a dust dispersion system
Fig. 2. Dust dispersion process with gas reservoir pressure of20 bar and tube filling pressure of 60 kPa
initiation energy of 10 kJ was recommended to obtain sta-ble values (Bartknecht 1978). These K-factors are definedas the maximum rate of pressure rise multiplied by the cu-bic root of the vessel volume in a constant volume explo-sion, i.e., K = V 1/3(dp/dt)max. The subscript G refers togas and the ST to dust. Thus, an initiation energy three-order-higher was applied for dust explosions than for gasexplosions in a vessel of 20 dm3 or 1m3. This clearly in-dicates that the 300 J pyrotechnical igniter means a weakinitiation source for dust explosions in the 0.3m detona-tion tube.
The measurements included Kistler 603B pressuretransducers, ion gauges and photodiodes for the time of ar-rival of the flame front. Transient recorders with maximum1 MHz resolution were applied. To measure the cell sizedirectly, we used a smoked-foil made of a 2mm thick alu-
Fig. 3. Smoked-foil (leading edge at x/d = 63.5) and pressuretransducers (at x/d = 62.1) on the tube circumference
minum sheet, 0.8m wide and 1m long, which was formedinto a cylindrical shell of 0.3m in diameter. Hence, thesmoked-foil covered 85% of the tube inner circumferencesurface. The inner surface of the foil was smoked with thesoot from a rich acetylene flame. The smoked-foil was in-serted in the middle of the test section and fixed withoutgap on the inner surface of the tube. The leading edgeof the smoked-foil was located at a distance of x/d=63.5where d=0.3m is the tube inner diameter. Ahead of thefoil leading edge at x/d=62.1, seven pressure transduc-ers were inserted on the tube circumference at 45 degreeintervals, as displayed in Fig. 3, to measure the pressurehistories on the circumference.
The dust studied in this paper includes cornstarch, an-thraquinone and aluminum. Some of their chemical andphysical properties are summarized in Table 1. The ex-plosion hazard increases in the sequence of cornstarch, an-thraquinone and aluminum, indicated by the magnitude ofthe KST-factor. As mentioned above the KST-factor is de-fined by the maximum rate of the pressure rise and hencereflects the sensitivity of dust-air mixtures to explosion.To improve the dust fluidity and to reduce the agglomera-tion, 0.5% (by mass) silicon dioxide with a particle size of0.015 µm was mixed with the test dust. Owing to the littlemass added, the influence of the silicon dioxide additiveon the combustion can be neglected.

56 F. Zhang, H. Gronig, A. van de Ven: Dust-air DDT and detonation
Table 1. Chemical and physical properties of dust used in theexperiments
Material Cornstarch Anthraquinone AluminumChemical formula (C6H10O5)n C14H8O2 AlMolecular weight,g/mole 162.14 208.23 26.98Standard enthalpy,kJ/mole −929.5 −32.68 0Material density,g/cm3 1.3 1.438 2.7Melting point, ◦C – 286 660Average size, µm 10 (spherical) 22 × 6 × 6 36 × 36 × 1KST-factor,bar·m/s 160 274 359
3 Transition to detonationin organic dust-air mixtures
3.1 Anthraquinone-air mixtures
Transition to detonation in anthraquinone-air mixtureswas observed in the 0.14m detonation tube (Zhang andGronig 1993). An example is presented in this section andcompared with the results obtained in the new 0.3m tube.Figure 4 shows the pressure records of the DDT processin a rich anthraquinone-air mixture with an equivalenceratio φ = 1.75 (dust concentration σp = 210 g/m3) andan initial pressure of p0=1bar. The initiation was madeby a 2H2+ O2 detonation wave at an initial pressure ofpi = 0.5 p0. This planar initiation results in a decayingtransmitted shock when it propagates into the dust mix-ture. The shock wave following the leading transmittedshock is caused by the reflection of the reflected 2H2+ O2initiation wave at the end wall of the initiation section.Far behind this reflected shock, a compression wave isformed and amplified by the flame at x/d > 50 where x isthe distance measured from the beginning of the test sec-tion. This fact suggests that, at the lower initial pressureof the 2H2+ O2 mixture, the ignition might not be cre-ated directly by the transmitted shock but caused by thehot products of the 2H2+ O2 detonation. Coupled withthe chemical energy release by the flame, the compressionwave is developed into a shock wave with a Mach numberof Mcrit ≈ 3.3 at x/d ≥ 90. Thereafter, within the propa-gation of the reaction shock complex, an abrupt onset ofan overdriven detonation occurs which gradually relaxesinto a spinning detonation. Thus, the DDT process can bedivided into a reaction compression stage and a reactionshock stage by formation of a critical shock wave whichwill lead to the onset of detonation. It was observed thatthe amplification of the compression wave in the reactioncompression stage depends on the initiation energy andthe initial turbulence strength produced by dispersing thedust to form the suspension. Large initiation energy andstrong initial turbulence reduce the transition distance be-fore the formation of the critical shock wave. In contrast,the fast reaction shock stage, defined from the formation
Fig. 4. Transition to detonation in a 22 × 6 × 6 µm3
anthraquinone-air mixture with φ = 1.75 at an initial pressureof 1 bar using the 0.14m tube and 0.5 bar 2H2+ O2 detonationinitiation (Zhang et al. 1991b)
of the critical shock wave to the maximum overdriven det-onation, is less dependent on the initial conditions becauseof the large energy release rate and the high flow speed.Hence, the transition distance of the reaction shock stageis mainly determined by the reaction system itself and theboundary conditions. In Fig. 4, the reaction shock stageoccurs within a transition distance of about 20 tube di-ameters.
In the 0.3m detonation tube, transition to detonationin atmospheric anthraquinone-air mixtures was repeatedin a concentration range from σp = 120 to 200 g/m3 whichcorresponds to equivalence ratios from φ = 1 to 1.67. The300 J pyrotechnical igniter described in Section 2 was usedfor the initiation. This igniter works very similar to mini-detonators and creates a spherical blast that locally initi-ates a dust flame. Figure 5 provides the pressure records ofthe DDT process and the flame front trajectory in a richanthraquinone-air mixture at φ = 1.67 and Fig. 6 showsthe flame velocity varied with the propagation distance.Owing to the weak initiation used, a transmitted shockis not distinguishable and the compression wave is ampli-fied very slowly at the early stage. The compression waveamplification coupled with the chemical energy release by

F. Zhang, H. Gronig, A. van de Ven: Dust-air DDT and detonation 57
Fig. 5. Transition to detonation in a 22 × 6 × 6 µm3
anthraquinone-air mixture with φ = 1.67 at an initial pres-sure of 1 bar using the 0.3m tube and a 300 J pyrotechnicaligniter
the flame can be clearly recognized through the flame fronttrajectory crossing the rear part of the compression wave.The critical shock wave is formed at x/d ≥ 83 with a Machnumber of Mcrit ≈ 3.4. The location of the critical shockformation can be distinguished from the formation of theshock wave in Fig. 5 and the rapid increase of the flameacceleration in Fig. 6. Within the propagation of the reac-tion shock, the abrupt onset of an overdriven detonationtakes place near x/d ≈ 95 with a peak pressure of 75 bar.Although the initiation energy and method are differentfrom those used in the 0.14m tube, the reaction shockstage starting from the onset of the critical shock waveto the maximum overdriven detonation occurs more orless within the same transition distance of about 20 tubediameters as shown in Fig. 4. This indicates the indepen-dence of the reaction shock stage from the initial condi-tions. After its maximum, the overdriven detonation wavethen begins to relax towards its stable mode, which hastwo transverse wave heads observed in the pressure pro-files on the circumference. Comparing Fig. 5 with Fig. 4where the interference of the transmitted shock generatedby the planar initiation exists, the reaction compressionstage and the reaction shock stage are more clearly iden-tified in Fig. 5 during the dust DDT process using weakinitiation.
The detailed structure of the stable spinning detona-tion for anthraquinone-air mixtures was recorded in thepressure profiles on the tube circumference. Figure 7 dis-
Fig. 6. Flame velocity versus propagation distance in a 22 ×6×6 µm3 anthraquinone-air mixture with φ = 1.67 at an initialpressure of 1 bar using the 0.3m tube and a 300 J pyrotechnicaligniter
plays a single-head spinning wave obtained in the 0.14mtube for an anthraquinone-air mixture, where the singletransverse wave head can be recognized on the profilenumbered 6. Table 2 summarizes the experimental det-onation velocity, pressure and the number of transversewave heads of the stable detonation for anthraquinone-airmixtures. Note that the recorded pressure of the trans-verse wave heads may not achieve its maximum value sincethe records were taken from the maximum front pressureof the eight pressure transducers distributed on the tubecircumference. The C-J equilibrium calculations were con-ducted using the STANJAN code (Reynolds 1986), wherethe reaction products are assumed to be gas and solid car-bon for organic dust, and gas and condensed phase for thealuminum dust (Zhang et al. 1992). The fairly good agree-ment between the experimental detonation velocities andthe theoretical equilibrium C-J values, shown in Fig. 8,indicates that the stable dust detonation velocity mainlydepends on the energetics. However, the theoretical C-Jdetonation velocities exhibit a shift towards the lean sidesimply because the nominal concentration marked in thehorizontal coordinate is larger than the real concentrationowing to sedimentation and adhesion to the tube wall.Experimental determination of the C-J detonation pres-sure is more difficult than the detonation velocity in dustmixtures, since the large transverse wave spacing of thedetonation front ascribes a number of oscillations to thepressure profiles. Figure 9 shows the detonation pressurefor anthraquinone-air mixtures. Rather than identifyingan interpretation from the oscillatory pressure record forthe C-J pressure, the “peaks” and “valleys” are plotted.The solid curve denotes the theoretical C-J value from theequilibrium calculations. If one considers a mean value, theagreement is quite good.
3.2 Cornstarch-air mixtures
For insensitive dust-air mixtures such as cornstarch-airwhose KST-factor is only 0.58 times that for anthra-quinone, the experiments in the 0.14m detonation tubeshowed that a successful transition to detonation was ob-

58 F. Zhang, H. Gronig, A. van de Ven: Dust-air DDT and detonation
Fig. 7. Pressure profiles on the 0.14m tube circumference in a 22 × 6 × 6 µm3 anthraquinone-air mixture with φ = 1.45 at aninitial pressure of 1.15 bar (Zhang and Gronig 1993)
Table 2. Detonation properties of anthraquinone-air mixtures measured in the 0.14m tube at T0 = 293K (Zhang and Gronig1993)
p0 σp φ D pp/p0 pH/p0 nbar g/m3 m/s1 195 1.63 1390 20 Lean limit
210 1.75 1650 27 56 1240 2.00 1619 26 52 1265 2.21 1607 25 52 1280 2.33 1337 18 Rich limit
1.15 97 0.70 1391 20.9 Lean limit125 0.90 1620 27.8 52.2 1138 1.00 1656 29.6 53.9 1160 1.16 1669 29.6 54.8 1200 1.45 1711 32.2 85.2 1207 1.50 1722 32.2 85.2276 2.00 1704 28.7 64.3 2350 2.54 1630 25.2 49.6414 3.00 1446 21.7 45.2 1440 3.20 1350 17.4 Rich limit
Note: p0 – initial pressure; σp – dust concentration; φ – equivalence ratio; D – detonation velocity;pp – “peak” pressure of the pressure oscillation behind the front;pH – pressure of the transverse wave head; n - number of transverse wave heads

F. Zhang, H. Gronig, A. van de Ven: Dust-air DDT and detonation 59
Fig. 8. Detonation velocities in 22×6×6 µm3 anthraquinone-air mixtures (Zhang et al. 1992)
Fig. 9. Detonation pressures in 22×6×6 µm3 anthraquinone-air mixtures (Zhang et al. 1992)
tained only when the initial pressure raised to p0=2.5 bar(Zhang and Gronig 1991b). Figure 10 shows the pressurerecords of the DDT process for a cornstarch-air mixtureat φ = 2 with σp = 1165 g/m3, using a strong initia-tion of a 2H2+ O2 detonation wave at an initial pressurepi = p0. The DDT process follows a similar way as thatin anthraquinone-air mixtures, except that the pressurelevels are much higher due to the increased initial pres-sure. Within the propagation of the reaction shock, anabrupt onset of an overdriven detonation can be recog-nized at about x/d = 113, accompanied by a strong ret-onation wave which can be seen on the pressure profiles.For an initial pressure of p0 = 2bar under the same initialconditions, an acceleration up to a shock velocity of onlyD ∼ 1400m/s was observed within the tube length. Thestable detonation of a cornstarch-air mixture at φ = 2 and2.5 bar initial pressure was observed as a single-head spin-ning wave with a detonation velocity of 1773m/s and adetonation pressure of 30.4 p0 (Zhang and Gronig 1993).
Fig. 10. Transition to detonation in a 10 µm cornstarch-airmixture with φ = 2 at an initial pressure of 2.5 bar usingthe 0.14m tube and a 2.5 bar 2H2+ O2 detonation initiation(Zhang and Gronig 1991b)
In the theory of gas detonations, the empirical correla-tion by Kogarko and Zeldovich (1948) links the minimumtube diameter for propagation of a stable, self-sustaineddetonation wave to the cell width of the cellular detona-tion by
dmin ∼= λ/π . (1)
Moreover, a scaling rule has been postulated for gaseousdetonations that the cell size is inversely proportional tothe initial pressure, i.e., λ ∼ p−ω
0 with ω ∼= 1 (Shchelkinand Troshin 1965). If this scaling rule and Eq. (1) are as-sumed to be valid for dust detonations, we obtain thatthe minimum tube diameter for the propagation of a self-sustained dust detonation wave would be inversely pro-portional to the initial pressure:
dmin ∼ p−ω0 , ω = 0(1) . (2)
From the experimental observation in the 0.14m tubeand Eqs. (1) and (2), an estimate of 0.88m ≤ λ ≤ 1.10mand 0.28m≤ dmin ≤ 0.35m was made of a self-sustaineddetonation in cornstarch-air mixtures at normal atmo-spheric pressure. This estimate was confirmed by the DDTexperiments in the 0.3m detonation tube using the weak300 J pyrotechnical igniter. Figure 11 shows the pressure

60 F. Zhang, H. Gronig, A. van de Ven: Dust-air DDT and detonation
Fig. 11. Transition to detonation in a 10 µm cornstarch-airmixture with φ = 1.72 at an initial pressure of 1 bar using the0.3m tube and a 300 J pyrotechnical igniter
records of the DDT process and the flame front trajec-tory in a rich cornstarch-air mixture at φ = 1.72 withσp = 400 g/m3. Owing to the weak initiation used, a trans-mitted shock is not distinguishable and the compressionwave is amplified very slowly at the early stage. The com-pression wave amplification coupled with the accelerationof chemical energy release can be recognized through theflame front trajectory crossing the rear part of the com-pression waves. An abrupt onset of overdriven detonationtakes place at x/d > 115 with a retonation wave prop-agating towards the beginning of the tube where the ig-niter was located. The overdriven detonation reaches apeak pressure of 49 bar and a flame front velocity of about1900m/s at the end of the tube (see Fig. 12). It is unclearif the overdriven detonation would further accelerate.
In order to observe a complete DDT process of thesame cornstarch-air mixture, the igniters were increasedto four 300 J pyrotechnical igniters. The four igniters wereinserted into the tube wall at the beginning of the tube,pairwise opposite at x/d = 0.27 and x/d = 3.55, and wereignited at the same time. Figure 13 shows the pressurerecords of the DDT process and the flame front trajectoryusing 4 igniters. The DDT process is very similar to thatusing a single igniter displayed in Fig. 11, however, thecompression wave amplification coupled with the accelera-tion of chemical energy release is faster. Thereafter, a crit-ical shock wave with a Mach number of about Mcrit ∼ 3.4is formed at x/d ≥ 95, where the flame acceleration be-
Fig. 12. Flame velocity versus propagation distance in a 10 µmcornstarch-air mixture with φ = 1.72 at an initial pressureof 1 bar using the 0.3m tube. ◦: initiation by a single 300 Jpyrotechnical igniter; ∇: initiation by four 300 J pyrotechnicaligniters
comes rapidly increased (see also in Fig. 12). The forma-tion of the critical shock wave turns the DDT process intothe reaction shock stage, in which the abrupt onset ofoverdriven detonation leads the detonation to its maxi-mum at x/d ≈ 115, accompanied by a retonation wavepropagating backwards. Thereafter, the overdriven deto-nation begins to relax towards its stable detonation state.However, the stable detonation has yet to be achieved atthe end of the tube. The reaction shock stage from the for-mation of the critical shock wave to the maximum over-driven detonation occurs within a transition distance of20 tube diameters. It is noticed in Fig. 12 that the flameacceleration has a rapid increase near x/d = 100 whenfour igniters were used, whereas the flame accelerationis increased gradually in the case of one igniter. The co-incidence of rapid increase of the flame acceleration andthe formation of the critical shock wave was also observedin the anthraquinone-air mixture displayed in Fig. 6. Al-though the measurement accuracy of the flame front islimited by the non-planarity of the flame front, the rapidincrease of the flame acceleration near the formation of thecritical shock wave might indicate that the critical shockwave would be conditioned not only by a Mach numberbut also by the slope behind the shock front.
To measure the structure and the properties of the sta-ble self-sustained detonation, direct initiation of dust det-onation was applied in the 0.3m tube using the 2H2+ O2detonation initiation with an initial pressure of pi = 2p0.Figure 14 shows that an overdriven detonation is estab-lished at the beginning of the tube for a cornstarch-airmixture of σp = 400 g/m3 at an initial pressure of p0 =1bar. The overdriven detonation relaxes into a single-headspinning detonation at about x/d = 20, recognized by theoscillating frequency of the pressure profiles. Thereafter,the detonation propagated steadily along the rest of thetube (about 100 tube diameters) at a constant velocity of1615m/s which is in agreement with the trend observedin the DDT experiments. The single-head spinning det-onation structure is clearly indicated by the structure of

F. Zhang, H. Gronig, A. van de Ven: Dust-air DDT and detonation 61
Fig. 13. Transition to detonation in a 10 µm cornstarch-airmixture with φ = 1.72 at an initial pressure of 1 bar using the0.3m tube and four 300 J pyrotechnical igniters
the wave front and the frequency of the pressure oscil-lations in the pressure profiles on the circumference atx/d = 82.7 shown in Fig. 15. The pressure transducersnumbered from 101 to 108 are ordered clockwise on thecircumference at equal intervals of 45 degrees. The spin-ning direction is clockwise and the transverse wave headcan be recognized in the pressure profile numbered 101.The single-head spinning mode results in an estimate ofa detonation cell size of λ = πd = 0.94m. Thus, the suc-cessful DDT results and the observation of the single-headspinning detonation in the 0.3m tube confirm the esti-mate of Zhang and Gronig (1991b) for the minimum tubediameter for a self-sustained cornstarch detonation in at-mospheric air.
Table 3 summarizes the experimental detonation ve-locity, pressure and the number of transverse wave headsfor the self-sustained cornstarch-air detonations at 1 barinitial pressure obtained in the 0.3m tube. The calculatedC-J detonation velocities, shown in Fig. 16 are in fairlygood agreement with the experimental detonation veloci-ties, however, with a shift towards the lean side. The rea-sons for the deviation are the same as explained earlierfor the anthraquinone-air mixtures. As the mixtures be-come richer, the calculated C-J velocity drops, however,the experimental values show only a slight decrease or a“plateau” extending from the peak values, probably owingto the large time scale of heat transfer from the gaseousproducts to the unburned dust fuel. The detonation pres-sures are shown in Fig. 17 where the experimental “peak”
Fig. 14. Direct initiation of detonation in a 10 µm cornstarch-air mixture with φ = 1.72 at an initial pressure of 1 bar usingthe 0.3m tube and 2 bar 2H2+ O2 detonation initiation
and “valley” pressures are plotted averaged over a periodof about 2ms behind the front. The equilibrium C-J pres-sures are close to the median value between the extremepressures.
4 Transition to detonationin aluminum dust-air mixtures
In the literature, aluminum dust-air detonations were in-vestigated using strong initiation and in tubes of smalllength-diameter ratios (Tulis and Selman 1982, Borisovet al. 1991). The detonation velocities observed by Tulisand Selman were widely spread out, probably due to dif-ferent geometry and sizes of the aluminum dust used. Onthe other hand, Borisov et al. studied two kinds of alu-minum dust, 1 µm spherical dust and 10 x 10 x 1 µm3
flaked dust, and observed consistent detonation velocitiesin a tube of 0.122m inner diameter and 4.2m length (i.e.,a length-diameter-ratio of 34) with strong chemical initi-ation. These results indicate that the detonation proper-ties might be influenced by the minimum thickness of thealuminum dust. For the observation of DDT and the self-sustenance of detonation for a long distance, tubes of alarge length-diameter ratio using a weak initiation sourcewould be preferred. DDT experiments using weak initia-tion may also indicate the influence of the kinetic-limited

62 F. Zhang, H. Gronig, A. van de Ven: Dust-air DDT and detonation
Fig. 15. Pressure pro-files on the 0.3m tube cir-cumference at x/d = 82.7 ina 10 µm cornstarch-air mixturewith φ = 1.72 at an initialpressure of 1 bar
surface reaction that depends on temperature and pres-sure.
The 300 J pyrotechnical igniter was used as a weakinitiation in the 0.3m detonation tube to study the DDTprocess for flaked aluminum dust which had a thicknessof about 1µm and a flake size distribution less than 36 ×36 µm2. Because the KST-factor of the aluminum dust usedis 1.3 times that for anthraquinone dust (see Table 1), onecan expect that DDT can be achieved earlier than foranthraquinone dust in air. Figure 18 shows the pressure
records of the DDT process and the flame front trajec-tory for a rich aluminum dust-air mixture with φ = 1.61(σp = 500 g/m3) at an initial pressure of 1 bar. Figure 19gives the flame and shock velocity varied with the prop-agation distance. The DDT process consists of a reactioncompression stage and a reaction shock stage, and thetwo transition stages are divided by the formation of ashock wave with a critical Mach number of Mcrit ∼ 3.4at x/d = 40. The formation of the critical shock wave ischaracterized by the shock Mach number and the rapid in-

F. Zhang, H. Gronig, A. van de Ven: Dust-air DDT and detonation 63
Table 3. Detonation properties of cornstarch-air mixtures measured in the 0.3m tube at p0 = 1 bar and T0 = 293K
σp φ D pp pv pH ng/m3 m/s bar bar bar
160 0.69 1462 22.5 9.5 98 Lean limit200 0.86 1495 24.9 10.1 1300 1.29 1581 29.0 12.5 1400 1.72 1615 28.5 11.5 98 1500 2.15 1600 24.6 12.0 1600 2.58 1575 23.0 11.5 1700 3.00 1541 22.5 10.0 Rich limit
Note: σp - dust concentration; φ - equivalence ratio; D - detonation velocity;pp - “peak” pressure of the pressure oscillation behind the front;pv - “valley” pressure of the pressure oscillation behind the front;pH - pressure of the transverse wave head; n - number of transverse wave heads
Fig. 16. Detonation velocities in 10 µm cornstarch-air mix-tures at an initial pressure of 1 bar
Fig. 17. Detonation pressures in 10 µm cornstarch-air mixturesat an initial pressure of 1 bar
crease of the flame acceleration shown in Figs. 18 and 19.The overdriven detonation reaches a maximum velocity offlame and shock at x/d between 50 and 55 with a peakpressure of 66 bar. Thus, the reaction shock stage from theonset of the critical shock wave to the maximum of theoverdriven detonation occurs within a transition distanceof about 15 tube diameters. Note that the entire tran-sition distance displayed in Fig. 18 is the shortest among
the organic and aluminum dust studied using the 300 J ig-niter. In contrast to the DDT in cornstarch-air mixtures,the retonation wave created during the onset of the alu-minum dust detonation is rather weak. After the maxi-mum, the overdriven detonation relaxes towards a stabledetonation with a propagation velocity of 1750m/s. Thestructure of the stable detonation is displayed in the pres-sure traces on the tube circumference at x/d = 82.7 shownin Fig. 20, where the pressure transducers from 101 to 108are ordered clockwise on the circumference at equal in-tervals of 45 degrees. From these pressure profiles at leastfour transverse wave heads can be recognized in the traces101, 103, 105 and 106 which, together with the oscillationfrequency, indicate a cellular detonation with a cell sizeof about 0.4m. Unlike the organic dust, the pressure os-cillations behind the detonation front exist in aluminumdust only for a short time with small amplitudes between“peaks” and “valleys”.
Transition from deflagration to detonation was also in-vestigated under the same conditions, but the aluminumconcentration was reduced towards the lean limit. Fig-ure 21 provides the pressure records and the flame fronttrajectory of the DDT process for a lean aluminum-airmixture with φ = 0.645 (σp = 200 g/m3), and Fig. 22shows its flame velocity along the propagation distance.The DDT process can still be divided into a reactioncompression stage and a reaction shock stage by the for-mation of the critical shock wave, which is identified bythe formation of the shock behind the precursor shock atx/d ≥ 100 in Fig. 21 and by the rapid increase of the flameacceleration near x/d = 100 in Fig. 22. However, owing tothe less sensitive lean mixture, the reaction compressionstage becomes a multiple compression one in which thesecond compression wave is amplified behind the precur-sor shock wave that was developed by the first compres-sion wave (see Fig. 21). The first compression wave am-plification can be recognized at 0 < x/d < 50 throughthe flame front trajectory crossing the backside of thecompression wave. This results in a precursor shock atx/d ≈ 52. The second compression wave amplification,
64 F. Zhang, H. Gronig, A. van de Ven: Dust-air DDT and detonation
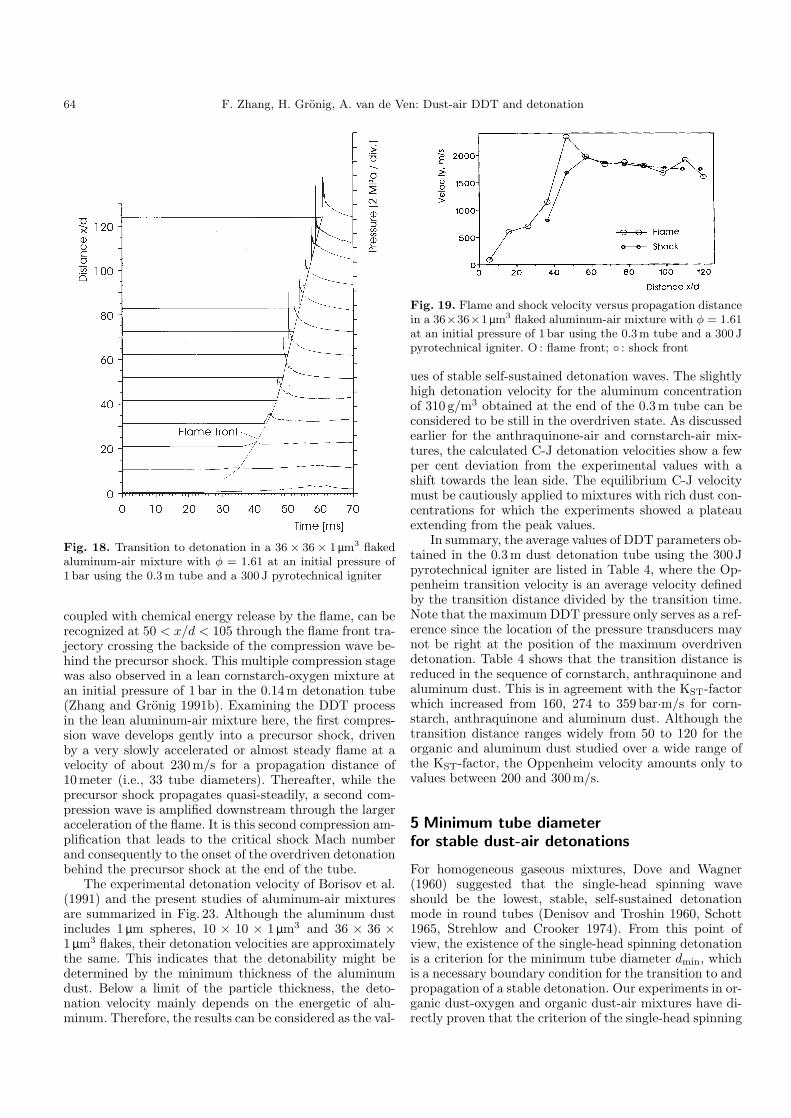
Fig. 18. Transition to detonation in a 36 × 36 × 1 µm3 flakedaluminum-air mixture with φ = 1.61 at an initial pressure of1 bar using the 0.3m tube and a 300 J pyrotechnical igniter
coupled with chemical energy release by the flame, can berecognized at 50 < x/d < 105 through the flame front tra-jectory crossing the backside of the compression wave be-hind the precursor shock. This multiple compression stagewas also observed in a lean cornstarch-oxygen mixture atan initial pressure of 1 bar in the 0.14m detonation tube(Zhang and Gronig 1991b). Examining the DDT processin the lean aluminum-air mixture here, the first compres-sion wave develops gently into a precursor shock, drivenby a very slowly accelerated or almost steady flame at avelocity of about 230m/s for a propagation distance of10meter (i.e., 33 tube diameters). Thereafter, while theprecursor shock propagates quasi-steadily, a second com-pression wave is amplified downstream through the largeracceleration of the flame. It is this second compression am-plification that leads to the critical shock Mach numberand consequently to the onset of the overdriven detonationbehind the precursor shock at the end of the tube.
The experimental detonation velocity of Borisov et al.(1991) and the present studies of aluminum-air mixturesare summarized in Fig. 23. Although the aluminum dustincludes 1 µm spheres, 10 × 10 × 1 µm3 and 36 × 36 ×1 µm3 flakes, their detonation velocities are approximatelythe same. This indicates that the detonability might bedetermined by the minimum thickness of the aluminumdust. Below a limit of the particle thickness, the deto-nation velocity mainly depends on the energetic of alu-minum. Therefore, the results can be considered as the val-
Fig. 19. Flame and shock velocity versus propagation distancein a 36×36×1 µm3 flaked aluminum-air mixture with φ = 1.61at an initial pressure of 1 bar using the 0.3m tube and a 300 Jpyrotechnical igniter. O : flame front; ◦ : shock front
ues of stable self-sustained detonation waves. The slightlyhigh detonation velocity for the aluminum concentrationof 310 g/m3 obtained at the end of the 0.3m tube can beconsidered to be still in the overdriven state. As discussedearlier for the anthraquinone-air and cornstarch-air mix-tures, the calculated C-J detonation velocities show a fewper cent deviation from the experimental values with ashift towards the lean side. The equilibrium C-J velocitymust be cautiously applied to mixtures with rich dust con-centrations for which the experiments showed a plateauextending from the peak values.
In summary, the average values of DDT parameters ob-tained in the 0.3m dust detonation tube using the 300 Jpyrotechnical igniter are listed in Table 4, where the Op-penheim transition velocity is an average velocity definedby the transition distance divided by the transition time.Note that the maximum DDT pressure only serves as a ref-erence since the location of the pressure transducers maynot be right at the position of the maximum overdrivendetonation. Table 4 shows that the transition distance isreduced in the sequence of cornstarch, anthraquinone andaluminum dust. This is in agreement with the KST-factorwhich increased from 160, 274 to 359 bar·m/s for corn-starch, anthraquinone and aluminum dust. Although thetransition distance ranges widely from 50 to 120 for theorganic and aluminum dust studied over a wide range ofthe KST-factor, the Oppenheim velocity amounts only tovalues between 200 and 300m/s.
5 Minimum tube diameterfor stable dust-air detonations
For homogeneous gaseous mixtures, Dove and Wagner(1960) suggested that the single-head spinning waveshould be the lowest, stable, self-sustained detonationmode in round tubes (Denisov and Troshin 1960, Schott1965, Strehlow and Crooker 1974). From this point ofview, the existence of the single-head spinning detonationis a criterion for the minimum tube diameter dmin, whichis a necessary boundary condition for the transition to andpropagation of a stable detonation. Our experiments in or-ganic dust-oxygen and organic dust-air mixtures have di-rectly proven that the criterion of the single-head spinning

F. Zhang, H. Gronig, A. van de Ven: Dust-air DDT and detonation 65
Fig. 20. Pressure profiles on the 0.3mtube circumference at x/d = 82.7 in a36×36×1 µm3 flaked aluminum-air mix-ture with φ = 1.61 at an initial pressureof 1 bar
mode is also valid for the transition to and propagation ofa stable heterogeneous dust detonation in tubes.
The minimum tube diameters obtained for the sta-ble dust-air detonation waves are summarized in Table 5,where the result for the sub-bituminous coal-air mixtureof Gardner et al. (1986) is also listed. For the aluminumdust-air detonation studied in the 0.3m detonation tube,a cell size of about 0.4m was obtained. If Eq. (1) thatrelates the minimum tube diameter to the cell size of thecellular detonation is also valid for the heterogeneous dustdetonation, a minimum tube diameter of about 0.12mwould be obtained for a stable aluminum dust detonationin air. This estimate is in good agreement with the spin-
ning aluminum dust-air detonation observed by Borisovet al. (1991) in a 0.122m detonation tube.
On the other hand, in the case of the closed vessel dustexplosion in air, the KST-factor, KST = V 1/3(dp/dt)max,has been used to classify the explosion hazard of variouskinds of dust. The KST-factor provides a measure of the re-action rate for constant volume explosions. However, grav-ity sedimentation, dispersion-induced turbulence, ignitiondelay time, and vessel volume can significantly influencethe KST-factor. It was concluded from numerous experi-ments in spherical vessels of different sizes that a 20 dm3
sphere is the minimum volume for determining explosionparameters (Bartknecht 1978). The KST-factors of about
66 F. Zhang, H. Gronig, A. van de Ven: Dust-air DDT and detonation
Table 4. DDT properties of organic and aluminum dust in air measured in the 0.3m tube
Dust σp φ XDDT/d Vopp PDDT VF,DDT
g/m3 m/s bar m/sCornstarch 200 0.86 – – – –10 µm diameter 250 1.07 124 ∼ 236 59 1800
300 1.29 120 236 51 1960400 1.72 114 238 49 2150500 2.15 – – – –
Anthraquinone 120 1.00 97 183 55 200022 × 6 × 6 µm3 200 1.67 96 223 75 2250
Aluminum 200 0.65 120 252 70 200036 × 36 × 1 µm3 310 1.00 65 305 49 2000
500 1.61 49 306 66 2300
Note: σp – dust concentration; φ – equivalence ratio;XDDT/d – DDT distance defined from the beginning to the location of maximum overdriven detonation;PDDT – maximum DDT pressure defined by the peak of maximum overdriven detonation;VF,DDT – maximum flame velocity defined by the value of maximum overdriven detonation.
Table 5. Experimental minimum tube diameter and KST-factor
Dust Size KST dmin
µm bar·m/s mU.S. W. Sub-Bituminous coala ≤ 100 59b 0.6Cornstarch 10 160 0.3Anthraquinone 22 × 6 × 6 274 0.14Aluminum 36 × 36 × 1 359 0.12
Note: a - Gardner et al. (1986); b - Fangrat et al. (1987).
60 kinds of dust observed in both the 20 dm3 sphere anda 1m3 cylindrical vessel with L/d ∼= 1 are in good agree-ment. Hence, both vessels have been used as reference ves-sels to determine the KST-factor. Experimental values ofthe KST-factors for the dust types studied are also summa-rized in Table 5, where the KST-factor for anthraquinoneand aluminum were obtained using the 20 dm3 sphere, andthe KST-factor for cornstarch is the average value obtainedfrom the 20 dm3 and 1 m3 vessel. However, due to the lackof a KST-factor for the American Western Sub-bituminouscoal, the value of brown coal obtained in a 5.6 liter cylin-drical vessel by Fangrat et al. (1987) was cited since bothcoal dusts have approximately the same particle sizes andvolatile contents.
Considering the expensive dust detonation tests inlarge facilities, attempt was made to correlate the mini-mum tube diameter and the KST-factor, based on the con-sideration that for insensitive dust-air mixtures, the reac-tion rate of detonation may not be far from the reactionrate of constant volume explosion. Because an increasein the reaction rate causes an increase in the KST-factorbut a decrease in the minimum tube diameter, it was as-sumed that the product of the minimum tube diameterand the KST-factor could be weakly dependent on the re-
action rate. Therefore, the empirical correlation suggestedwas (Zhang and Gronig 1993):
dmin KnST ≈ constant (3)
with n ∼= 1. This relation represents a force rate withthe dimension of N/s. Correlation (3) with the constantequal to 40 bar·m/s is plotted in Fig. 24 and is in goodagreement with the experimental data of Table 5. Themajority of industrial and agricultural dusts have a KST-factor less than 700 bar·m/s. Thus, an overall lower limitof dmin ∼ 60mm can be obtained from (3) (see dashedline in Fig. 24). The KST-factor of most dusts ranges from40 to 400 bar·m/s, which corresponds to a minimum tubediameter for stable dust-air detonations from about 1mto 0.1m.
6 Transverse wave structureof detonation fronts
In the 0.14m detonation tube, the detonation structurewas studied in detail for a single-head spinning detonationwave and a two-head spinning or a single cell detonation

F. Zhang, H. Gronig, A. van de Ven: Dust-air DDT and detonation 67
Fig. 21. Transition to detonation in a 36 × 36 × 1 µm3 flakedaluminum-air mixture at φ = 0.645 and an initial pressure of1 bar using the 0.3m tube and a 300 J pyrotechnical igniter
Fig. 22. Flame velocity versus propagation distance in a36× 36× 1 µm3 flaked aluminum-air mixture at φ = 0.645 andan initial pressure of 1 bar using the 0.3m tube and a 300 Jpyrotechnical igniter
wave, as shown in Figs. 25 and 26 for cornstarch-oxygenmixtures (Zhang and Gronig 1991a, 1992). These trans-verse wave structures were obtained by indirect methodsthrough a large number of pressure transducers and iongauges.
For a direct determination of the cellular structure,the smoked-foil technique was used in the 0.3m detona-tion tube (van de Ven 1998). The leading edge of thesmoked-foil was located at x/d = 63.5, and 0.42m aheadof the leading edge 7 pressure transducers were insertedon the tube circumference at 45 degree intervals to mea-
Fig. 23. Detonation velocities in aluminum-air mixtures at aninitial pressure of 1 bar
Fig. 24. dmin-KST diagram
sure the pressure histories (see Fig. 3). The detonation ex-periments were carried out in a cornstarch-oxygen mix-ture of σp = 440 g/m3 (φ = 0.8) and at an initial pres-sure of 0.5 bar. Using 1.2 bar 2H2+ O2 detonation initia-tion, a stable detonation wave was quickly established at asteady detonation velocity of 1895m/s. Figure 27 displaysthe circumferential pressure profiles and Fig. 28 shows thesmoked-foil record for one experiment. Figure 29 providesthe smoked-foil record for a repeated experiment underthe same conditions. The soot photographs display morethan one and a half cells within the foil width of approxi-mately 0.8m, and three transverse wave heads can also berecognized in the pressure profiles numbered by 1, 5 and6. The cell width measured from the soot photographshas an average value of λ = 0.50m and the average celllength is measured to be L = 0.77m. An average trackangle of the triple point trajectory can be estimated byα = tan−1(λ/L) = 33◦, which gives an average transversewave velocity of C ∼= 0.649D = 1230m/s. Recalling thatin the 0.14m tube, the single-head spinning detonationmode was obtained in a mixture of φ = 1 at 0.5 bar initialpressure displayed in Fig. 25, the result of λ = 0.50m herefor the cellular detonation in the slightly leaner mixtureof φ = 0.8 at the same initial pressure proves that the

68 F. Zhang, H. Gronig, A. van de Ven: Dust-air DDT and detonation
Fig. 25. Spinning detonation front structure on the 0.14mtube circumference in a cornstarch-oxygen mixture of φ = 1 atan initial pressure of 0.5 bar. x: axial coordinate; y: circumfer-ential coordinate (Zhang and Gronig 1991a)
minimum tube diameter equation (1), dmin = λ/π, is alsovalid for the stable dust detonation. Although the singlecell structure in the 0.14m tube was measured for the richmixture of φ = 3.1 at an initial pressure of 1.15 bar (seeFig. 26), the corresponding average transverse wave veloc-ity C ∼= 0.62D is very close to the value obtained in the0.3m tube for the lean mixture. This indicates that therelationship between the average transverse wave velocityand the detonation velocity may be invariant to the dustconcentration.
7 Conclusion
Self-sustained detonation waves can develop in pulverizedorganic or metallic particles suspended in air. Like dustdetonations in oxygen observed previously, the propaga-tion mechanism of the self-sustained dust detonations inair essentially depends on the transverse waves that pro-vide the coupling between the shock wave and the chemi-cal reaction. Owing to additional time scales required formass, momentum and heat transfer between the solid par-ticles and the oxidizing gas environment, the transversewave spacing of a dust detonation wave is much largerthan that for homogeneous gas detonation waves. Conse-quently, propagation of a confined self-sustained dust det-onation in air requires a large tube diameter. Two dustdetonation tubes, 0.14m and 0.3m in diameter with alength-diameter ratio of 124, were used to study the self-sustained dust detonations and the transition from defla-gration to detonation in dust-air mixtures of cornstarch,
anthraquinone and aluminum. These dusts represent threedifferent levels of explosion hazard. The studies resulted inan estimate that tubes 0.1m to 1m in diameter would berequired for the propagation of a stable detonation wavein combustible dust-air mixtures whose KST-factor rangesfrom 400 to 40 bar·m/s.
Because heterogeneous dust-air mixtures are insensi-tive to detonation, transition from deflagration to deto-nation in tubes requires a sufficient tube length-diameterratio and an initiation energy stronger than that used ingaseous DDT. In the dust DDT process using relativelyweak initiation, a shock wave having a critical Mach num-ber is formed that divides the DDT process into a slow re-action compression stage and a fast reaction shock stage.The reaction shock stage is defined as the pre-detonationstage between the onset of the critical shock wave and theachievement of the maximum overdriven detonation. De-pending on the initiation energy, the reaction compressionstage can undergo a multiple compression amplificationprocess. The above-mentioned dust-air DDT mechanismis essentially the same as that in an oxygen environmentstudied previously. It is still unknown how the reactioncompression stage quantitatively varies with initiation en-ergy and initial turbulence intensity.
It was the first time that the cell size of a cellular dustdetonation was directly measured using the smoked-foiltechnique in the 0.3m detonation tube. The cell size andthe average transverse wave velocity are in good agree-ment with the transverse wave structure of spinning andsingle cell detonation waves determined by pressure trans-ducers and ion gauges previously.
The studies of the transverse wave structure representan important step towards the physical description of het-erogeneous dust detonations. However, the fundamentalstudies of dust detonations are still in an early stage andmany fundamental problems remain unsolved. Detonationequilibrium parameters are available experimentally onlyfor a few dust-air mixtures. Few dynamic detonation pa-rameters including the ordinary cell size, critical initia-tion energy and critical tube diameter have yet to be di-rectly measured. The upper limit of the dust size has notbeen studied above which the transverse wave structureof a self-sustained dust detonation wave may not be real-ized. Although the similarity of the detonation onset andpropagation mechanism between heterogeneous dust det-onations and homogeneous gas detonations would suggestthat the chemical energy release of dust detonation couldmainly take place in the vapour phase, this postulate hasyet to be observed directly. Moreover, unlike organic fineparticles which contain volatiles and have a relatively highvapor pressure, metallic particles such as aluminum pos-sess an oxide film that has a high melting temperature,thus raising the difficulty in interpreting the shock ini-tiation and detonation. The melting temperature of alu-minum, which has often been used as its shock ignitiontemperature in the literature, only provides a very lowvapour pressure in the order of 10−6 Pa. Hence, vapourphase or diffusion-limited ignition mechanism can be ques-
F. Zhang, H. Gronig, A. van de Ven: Dust-air DDT and detonation 69
Fig. 26. Two-head detonation frontstructure on the 0.14m tube circum-ference in a cornstarch-oxygen mix-ture of φ = 3.1 at an initial pres-sure of 1.15 bar. x: axial coordinate;y: circumferential coordinate. ◦: shockfront; ✷: flame front; •: unresolvablebetween shock and flame front (Zhangand Gronig 1992)
Fig. 27. Pressure profiles on the 0.3 mtube circumference at x/d = 62.1 in a10 µm cornstarch-oxygen mixture withφ = 0.8 at an initial pressure of 0.5 bar

70 F. Zhang, H. Gronig, A. van de Ven: Dust-air DDT and detonation
Fig. 28. Cellular detonation structure of a smoked-foil recordon the 0.3m tube circumference at x/d = 63.5 in a 10 µmcornstarch-oxygen mixture with φ = 0.8 at an initial pressureof 0.5 bar. Scale length is 0.1m and the detonation propagatesfrom left to right
Fig. 29. Cellular detonation structure of a smoked-foil recordon the 0.3m tube circumference. Conditions and scale are thesame as in Fig. 28
tionable at the earlier stage of the ignition of metallic par-ticles with high melting temperatures.
Acknowledgements. The research presented in this paper waspartially supported by the Federal Ministry of Science andTechnology, Bonn, by BASF AG, Ludwigshafen, BG Chemie,Heidelberg and BG Nahrungsmittel and Gaststatten, Mann-heim. The authors are indebted to Mrs. Odenthal for her pro-fessional preparation of the manuscript. They would also liketo thank Mr. Habermann for the final version of the figures.
References
Bartknecht W (1978) Explosionen. Springer-Verlag, Berlin,Heidelberg
Borisov AA, Khasainov BA, Saneev EL, Fomin IB, KhomikSV, Veyssiere B (1991) On the detonation of aluminumsuspensions in air and in oxygen. In: Borisov AA (ed.) Dy-namic Structure of Detonation in Gaseous and DispersedMedia. Kluwer Academic Publishers, Dordrecht, 215–253
Denisov YN, Troshin YK (1960) Structure of Gaseous Detona-tion in Tubes. Z. Tekh. Fiz. 30: 450–459
Dove JE, Wagner, HG (1960) A photographic investigation ofthe mechanisms of spinning detonation. In: Proceedings ofthe 8th Symposium (Int.) on Combustion, The CombustionInstitute, Pittsburgh, 589–600
Fangrat J, Glinka W, Wolanski P, Wolinski M (1987) Detona-tion structure in organic dust-oxygen mixtures. Archivumcombustionis 7: 321–332
Gardner BR, Winter RJ, Moore MJ (1986) Explosion Devel-opment and Deflagration-to-Detonation Transition in CoalDust/Air Suspensions. In: Proceedings of the 21st Sym-posium (Int.) on Combustion, The Combustion Institute,Pittsburgh, 335–343
Gronig H (1997) Dust Detonations. JSME International Jour-nal Series B, Vol. 40: 1–15
Kauffman CW, Wolanski P, Arisoy A, Adams PR, Maker BN,Nicholls JA (1984) Dust, hybrid and dusty detonations. In:Proceedings of 9th ICDERS, AIAA Progress in Astronau-tics and Aeronautics, AIAA New York, Vol. 94: 221–240
Kogarko SM, Zeldovich YaB (1948) On detonation of gas mix-tures. Doklady Akademii Nauk SSSR, 63: 553–556
Lee JHS (1988) Dust Explosion: An Overview. In: Gronig H(ed.) Shock Tubes and Waves. VCH Weinheim, 31–38
Li YC, Alexander CG, Wolanski P, Kauffman CW, Sichel M(1993) Experimental Investigation of Accelerating Flamesand Transition to Detonation in Layered Grain Dust. In:Kuhl AL, Leyer JC, Borisov AA, Sirignano WA (eds.) Dy-namic Aspects of Explosion Phenomena, Progress in Astro-nautics and Aeronautics, AIAA New York, Vol. 154: 170–184
Lundstrom EA, Oppenheim AK (1969) On the Influence ofNonsteadiness on the Thickness of the Detonation Wave.Proc. R. Soc. London, Ser. A 310: 463
Peraldi O, Veyssiere B (1986) Experimental Study of Det-onations in Starch Particle Suspensions with O2/N2,H2/O2 and C2H4/O2 Mixtures. In: Bowen JR, Leyer JC,Soloukhin RI (eds.) Dynamics of Explosions, Progress inAstronautics and Aeronautics, AIAA New York, Vol. 106:490–504
Reynolds WC (1986) Implementation in the reactive programSTANJAN, version 3. Stanford Univ. Rep.
Shchelkin KI, Troshin YaK (1965) Gasdynamics of Combus-tion. Academy of Sciences, Moscow. Translated by Kuvshi-noff BW and Holtschlag L, Mono Book Corp., Baltimore,Md,
Schott GL (1965) Observations of the Structure of SpinningDetonation. Phys. Fluids 8: 850–865
Strehlow RA, Crooker AJ (1974) The Structure of MarginalDetonation Waves. Acta Astronaut. 1: 303–315
Tulis AJ, Selman JR (1982) Detonation tube studies of alu-minum particles dispersed in air. In: Proceedings of the19th Symposium (Int.) on Combustion, The CombustionInstitute, Pittsburgh, 655–663
van de Ven A (1998) Staubdetonationen in einer Rohrleitungmit 300mm Durchmesser. Dissertation RWTH Aachen(D82), Shock Wave Laboratory, Shaker Verlag, Aachen
Wolanski P (1991) Deflagration and detonation of dust mix-tures. In: Kuhl AL, Leyer JC Borisov AA, Sirignano WA(eds.) Dynamics of deflagration and reaction systems: Het-erogeneous combustion, Progress in Astronautics and Aero-nautics, AIAA New York, Vol. 132: 3–31
Zhang F, Gronig H (1991a) Spin Detonation in ReactiveParticles-Oxidizing Gas Flow. Phys. Fluids A 3: 1983–1990

F. Zhang, H. Gronig, A. van de Ven: Dust-air DDT and detonation 71
Zhang F, Gronig H (1991b) Transition to Detonation in Corn-starch Dust-Oxygen and -Air Mixtures. Combust. Flame86: 21–32
Zhang F, Greilich P, Gronig H (1992) Propagation Mechanismof Dust Detonations. Shock Waves 2: 81–88
Zhang F, Gronig H (1992) Two-Headed Detonation in ReactiveParticle-Oxidizing Gas Flow. Phys. Fluids A 4: 2308–2315
Zhang F, Gronig H (1993) Detonability of Organic Dust-Air Mixtures. In: Kuhl AL, Leyer JC, Borisov AA, Sirig-nano WA (eds.) Dynamic Aspects of Explosion Phenom-ena, Progress in Astronautics and Aeronautics, AIAA NewYork, Vol. 154: 195–215