Embed Size (px)
Citation preview

Dear Author, Please, note that changes made to the HTML content will be added to the article before publication, but are not reflected in this PDF. Note also that this file should not be used for submitting corrections.

Our reference: STILL 3444 P-authorquery-v9
AUTHOR QUERY FORM
Journal: STILL Please e-mail your responses and any corrections to:
Article Number: 3444 E-mail: [email protected]
Dear Author,
Please check your proof carefully and mark all corrections at the appropriate place in the proof (e.g., by using on-screenannotation in the PDF file) or compile them in a separate list. Note: if you opt to annotate the file with software other thanAdobe Reader then please also highlight the appropriate place in the PDF file. To ensure fast publication of your paper pleasereturn your corrections within 48 hours.
For correction or revision of any artwork, please consult http://www.elsevier.com/artworkinstructions.
Any queries or remarks that have arisen during the processing of your manuscript are listed below and highlighted by flags inthe proof. Click on the ‘Q’ link to go to the location in the proof.
Location in Query / Remark: click on the Q link to goarticle Please insert your reply or correction at the corresponding line in the proof
Q1 “Your article is registered as a regular item and is being processed for inclusion in a regular issue ofthe journal. If this is NOT correct and your article belongs to a Special Issue/Collection please [email protected] immediately prior to returning your corrections.”
Q2 Please confirm that given names and surnames have been identified correctly.Q3 Please check the address of the corresponding author, and correct if necessary.Q4 The p-value has represented by both "P" and "p" in the article, so to maintain consistency "P" has been
changed to "p". Please check and amend if necessary.Q5 Please check the presentation of the list in the section "Conclusions", and amend if necessary.Q6 One or more sponsor names and the sponsor country identifier may have been edited to a standard format
that enables better searching and identification of your article. Please check and correct if necessary.Q7 As Refs. "Chen et al., 2005" and "Chen et al., 2005" were identical, so one of the Ref. has been removed
from the reference list. Please check and amend if necessary.Q8 Please check the presentation of tables 1-8, and correct if necessary.
Please check this box or indicate your approval ifyou have no corrections to make to the PDF file
Thank you for your assistance.

1 Highlights
Soil & Tillage Research xxx (2015) xxx–xxxEffect of integrated reservoir tillage for in-situ rainwater harvesting andother tillage practices on soil physical properties
Haytham M. Salem a,b,*, Constantino Valero a, Miguel Ángel Muñoz a, María Gil-Rodríguez a
aDepartment of Rural Engineering, Polytechnic University of Madrid, Ciudad Universitaria s/n, 28040 Madrid, SpainbDepartment of Soil and Water Conservation, Desert Research Center, 11753 Cairo, Egypt
� A combination implement was developed and compared to the popular tillage practices.� Tillage practices had a significant differences on some soil physical properties.� The lowest value of runoff was 4.91 mm recorded under combination implement.� The lowest value of soil losses was 0.65 t ha�1 recorded under combination implement.� Combination implement showed a reasonable water harvesting efficiency.
Soil & Tillage Research xxx (2015) xxx–xxx
G Model
STILL 3444 1
Contents lists available at ScienceDirect
Soil & Tillage Research
journa l homepage: www.e lsev ier .com/ locate /st i l l
1 Effect of integrated reservoir tillage for in-situ rainwater harvesting and2 other tillage practices on soil physical propertiesQ1
3 Haytham M. Salem a,b,*Q2 , Constantino Valero a, Miguel Ángel Muñoz a,4 María Gil-Rodríguez a
5 aDepartment of Rural Engineering, Polytechnic University of Madrid, Ciudad Universitaria s/n, 28040 Madrid, Spain6 bDepartment of Soil and Water Conservation, Desert Research Center, 11753 Cairo, Egypt
A R T I C L E I N F O
Article history:Received 1 October 2014Received in revised form 23 February 2015Accepted 27 February 2015
Keywords:Bulk densityInfiltrationRunoffWater harvesting efficiency
A B S T R A C T
There is a need for in-situ soil moisture conservation in arid and semi-arid regions due to insufficientrainfall for agriculture. For this purpose, a combination implement [integrated reservoir tillage system(RT)] comprised of a single-row chisel plow, single-row spike tooth harrow, modified seeder, and spikedroller was developed and compared to the popular tillage practices, viz., minimum tillage (MT) andconventional tillage (CT) in an arid Mediterranean environment in Egypt. The different tillage practiceswere conducted at tillage depths of 15, 20, and 25 cm and forward speeds of 0.69, 1, 1.25, and 1.53 m s�1.Some soil physical properties, runoff, soil loss, water harvesting efficiency and yield of wheat wereevaluated. The different tillage practices caused significant differences in soil physical properties as theRT increased soil infiltration, producing a rate of 48% and 65% higher than that obtained in MT and CT,respectively. The lowest values of runoff and soil loss were recorded under RT as 4.91 mm and 0.65 t ha�1,whereas the highest values were recorded under CT as 11.36 mm and 1.66 t ha�1, respectively. Inconclusion, the RT enhanced the infiltration rate, increased water harvesting efficiency, reduced runoffand achieved the highest yield of wheat. The best tillage operating parameters appeared to be at a tillagedepth of 20 cm and speed between 1.00 and 1.25 m s�1.
ã 2015 Published by Elsevier B.V.
7 1. Introduction
8 Water scarcity in arid and semi-arid regions due to low rainfall9 and uneven distribution throughout the season makes rainfed
10 agriculture in such areas a precarious enterprise. In recent decades,11 there has been increased interest in the evaluation of traditional12 water management techniques (Prinz and Wolfer, 1999), such as13 rainwater harvesting for drylands agriculture, which aims to ease14 futurewaterscarcity inmanyaridand semi-aridregions of theworld.15 Of the various methods of rainwater harvesting, “in-situ”16 systems are the simplest and cheapest approaches that can be17 practiced in many farming systems including those in arid and18 semi-arid regions. Also known as soil and water conservation19 systems, in-situ systems increase the amount of water stored in the20 soil profile by trapping or holding the rainwater where it falls (Stott
21et al., 2001), which eliminates the separation between the22collection and storage areas. The in-situ systems may be close to23micro-catchments techniques, but they provide an alternative in24arid and semi-arid regions, where precipitation is low or25infrequent during the dry season. Additionally, there is a need26to store the maximum amount of rainwater during the wet season27for use at a later time, especially for agricultural and domestic28water supply (OAS, 1997). The common in-situ rainwater harvest-29ing techniques in arid and semi-arid regions are mulching, deep30tillage, contour farming and ridging (Hatibu and Mahoo, 1999).31Soils in the Mediterranean region typically have low organic32matter content, which often entails weak structure. For this reason,33conventional intensive tillage systems for rainfed crops often lead34to soil quality deterioration (Hernanz et al., 2002). This increases35the soil’s potential for erosion and also induces carbon loss, which36weakens the soil’s production capacity and stability. These37concerns gave rise to the invention of conservation tillage practices38that improve physical and biological soil properties.39Conservation tillage has several positive effects on water40productivity (Rockstrom et al., 2001) compared to traditional soil41and water conservation systems. Besides enhancing infiltration42and soil moisture storage (Kahlon et al., 2013; Liu et al., 2013), it
* Corresponding author at: Department of Rural Engineering, PolytechnicQ3
University of Madrid, Ciudad Universitaria s/n, 28040 Madrid, Spain.Tel.: +34 665164402; fax: +34 913365845.
E-mail addresses: [email protected],[email protected] (H.M. Salem).
http://dx.doi.org/10.1016/j.still.2015.02.0090167-1987/ã 2015 Published by Elsevier B.V.
Soil & Tillage Research xxx (2015) xxx–xxx
G Model
STILL 3444 1–11
Please cite this article in press as: Salem, H.M., et al., Effect of integrated reservoir tillage for in-situ rainwater harvesting and other tillagepractices on soil physical properties. Soil Tillage Res. (2015), http://dx.doi.org/10.1016/j.still.2015.02.009
Contents lists available at ScienceDirect
Soil & Tillage Research
journa l homepage: www.e lsev ier .com/ locate /st i l l

43 reduces runoff which is then available for plant uptake during dry44 periods. The main limitation in stabilizing grain yields in rainfed45 farming systems is crop water stress caused by inefficient use of46 total available seasonal rainwater (McHugh et al., 2007). Therefore,47 technologies that use rainwater more efficiently are needed.48 An alternative method to in-situ rainwater harvesting and49 conservation tillage is reservoir tillage, which has been defined as a50 system in which numerous small surface depressions are formed to51 collect and hold water during rainfall or irrigation to prevent52 surface runoff (Hackwell et al., 1991; Rochester et al., 1994; Patrick53 et al., 2007; Salem et al., 2014). This approach was developed under54 the consideration that tillage can provide increased levels of55 surface storage and may represent one of the most effective means56 of controlling both runoff and soil erosion. A large body of research57 has been conducted on reservoir tillage with variations in58 equipment and terminology including: basin tillage, micro-basin59 tillage, furrows diking, furrow blocking, soil pitting, and tied-60 ridging (Hackwell et al., 1991; Wiyo et al., 2000; Brhane et al.,61 2006; Nuti et al., 2009).62 This study used Egypt as the focus region because it lies in the63 heart of the water scarcity problem. Egypt’s rainfed agriculture is64 mainly concentrated in the north-western coastal zone, which65 extends approximately 500 km from the western city of El-Saloum66 on the border with Libya, to Alexandria in the east. It is bounded by67 the Mediterranean Sea on the north and the Sahara Desert, about68 60 km on the south.69 Water is particularly important in this region, as it is inhabited70 by an indigenous Bedouin population, 85% of which lives off of an71 extensive dryland production system, where barley and wheat are72 the main crops. Human settlements and land use are entirely73 dependent on rainfall and on various forms of water harvesting74 (Mamdouh, 1999) to increase the efficiency of runoff water use for75 human and animal consumption and cultivation and to minimize76 soil erosion.77 The area’s geography and hydrology are ideal for effective use of78 water harvesting systems. In this region, soil water management79 techniques must retain the maximum possible rainfall by methods80 that reduce storm-water runoff, improve infiltration and boost the81 water storage capacity of the soil. The system must also be cost82 effective for acceptance by the farmers.83 Currently, most farmers in the northwestern coastal zone of84 Egypt still utilize old-fashioned crop production systems. Some85 farmers have switched to mechanization systems, but these86 systems have resulted in several problems. Some of the most87 common problems include added costs related to buying or renting88 agricultural machines, difficulties in using and maintaining these89 machines, crumbling of cultivated land, and the necessity for90 multiple machines to fulfill all agricultural processes. This last91 problem has been the most decisive, as farmers have often been92 unable to obtain all of the necessary machinery. Additionally, some93 farmers who own tractors as sources of power still even broadcast94 seeds because the region only receives rainfall during a short95 period of time, and so the farmers must utilize the little moisture96 available before it dries out.97 These problems indicate a need to design integrated technolo-98 gies to increase agricultural water use efficiency through rainwater99 harvesting while conserving the soil in rainfed areas. Researchers
100 in this region recognized the need to develop an alternative system101 that was energy, water and labor efficient that could also help102 sustain soil and environmental quality and produce more at a103 lower cost. Specifically, there has been a need to produce a104 combination implement (integrated reservoir tillage system) to105 simultaneously perform multiple processes including tilling and106 planting in order to decrease the number of machines traveling on107 soil surface, which mitigates soil compaction problems (El-Saied,108 2000; Rohit and Hifjur, 2006), and consequently increases crop
109yields, and lowers the total cost for mechanization processes by110decreasing fuel consumption, labor, maintenance cost and the cost111of owning or renting machines (Tuhtaku-Ziev and Utepbergenov,1122002; D’aene et al., 2008).113The long-term effects of conservation tillage have been well114documented; however less information is available regarding the115immediate effects, particularly when switching to conservation116tillage from conventional tillage in such soil conditions, limited crop117root development due to compaction and poor water infiltration are118the major initial obstacles (Chen et al., 2005). The long-term benefit119fromconservationtillagecannot beachievedeasily,unlessproducers120see that the system works in a short term (Chen et al., 2005). This is a121very important topic from an agronomic point of view where the122adoption of conservation tillage particularly no-tillage has led to123difficulties in soil workability, forcing farmers to switch to other124systems (López-Garrido et al., 2014). In these cases it would be125desirable that farmers initially opt for other alternatives of126conservation tillage that are different from no-tillage, such as127reservoir tillage (Salem et al., 2015).128There is limited documentation on the immediate effects of129reservoir and minimum tillage practices compared to conventional130tillage on soil conditions in the north-western coastal zone of131Egypt. In this region farmers frequently only consider traditional132tillage with soil inversion to avoid compaction and eliminate133weeds. However, less aggressive tillage practices, such as reservoir134tillage and minimum tillage, could solve the problem and increase135agricultural water use efficiency through rainwater harvesting136without losing the advantages of conservation agriculture.137Therefore, the objectives of this work were: (i) to develop and138manufacture a combination implement suitable for conserving139rainwater in-situ within the root-zone using a reservoir tillage tool140and mechanical seeding; (ii) to increase soil moisture storage,141reduce runoff, and improve infiltration of harvested water through142reservoir tillage; (iii) to optimize various operating parameters143that affect the performance of tillage practices; and (iv) to compare144the influence of the combination implement and other popular145tillage practices on soil physical properties, water harvesting146efficiency, and yield of wheat.
1472. Materials and methods
1482.1. Site description and meteorological conditions
149Field experiments were carried out in Wadi Madwar located at150the El-Qasr region, which lies approximately 10 km Southwest of151the Marsa Matruh city and 3 km from the Mediterranean sea in152Egypt’s northwestern coastal zone (latitude: 31�2100800N, longi-153tude: 28�0804000E, and an altitude of 30 m above sea level). The154location of the study area is presented in Fig. 1. The soils of Wadi155Madwar are mainly sandy loam in texture, and the average slope is156between 4 and 6% in South–North direction. The climatic157conditions from the Marsa Matruh meteorological station (latitude15831�200N, longitude: 27�130E, and an altitude of 28 m above sea159level) were used to determine the meteorological data of the study160area. The arid Mediterranean climatic conditions are characterized161as short rainy seasons during October–March; about 85% of the162total annual rainfall is recorded between December and February.163During the growing season of wheat (2012–2013), the average164temperature, relative humidity and total precipitation were 15 �C,16564.2% and 161.2 mm, respectively.
1662.2. Combination implement [integrated reservoir tillage system (RT)]
167The combination implement (Figs. 2 and 3), used in this study168was manufactured from local materials to overcome the problems169associated to the imported machines like cost and power
2 H.M. Salem et al. / Soil & Tillage Research xxx (2015) xxx–xxx
G Model
STILL 3444 1–11
Please cite this article in press as: Salem, H.M., et al., Effect of integrated reservoir tillage for in-situ rainwater harvesting and other tillagepractices on soil physical properties. Soil Tillage Res. (2015), http://dx.doi.org/10.1016/j.still.2015.02.009

170 requirements. The RT was mounted via three-point hitches to a171 tractor, and its weight was 495 kg without load (seeds). It ran on172 two ground removable wheels of 60 cm diameter. The main frame173 was constructed from rectangular iron sheet steel and had the174 dimensions of 140 � 165 cm. The main structure consisted of the175 parts defined in the following sections.
1762.2.1. Chisel plow177A chisel plow was used as the primary tillage tool to plow the178soil for seedbed preparation. It consisted of four tines arranged in179one row and mounted on straight shanks constructed from iron180steel (cross section 4 �12 cm). This shape is especially used when181there is either low or heavy rainfall and can enhance the soil ability
Fig. 2. Side view of the combination implement (integrated reservoir tillage system), (1) upper hitch point; (2) main frame; (3) chisel plow; (4) spike-tooth harrow; (5)ground wheel; (6) feeding mechanism; (7) seed hopper; (8) spiked roller. Dimensions in centimeters.
Fig. 1. Location of the study area.
H.M. Salem et al. / Soil & Tillage Research xxx (2015) xxx–xxx 3
G Model
STILL 3444 1–11
Please cite this article in press as: Salem, H.M., et al., Effect of integrated reservoir tillage for in-situ rainwater harvesting and other tillagepractices on soil physical properties. Soil Tillage Res. (2015), http://dx.doi.org/10.1016/j.still.2015.02.009

182 to hold water for a longer period. The distance between the shanks183 was 30 cm. Each shank had different levels of holes to provide184 different tillage depths and was mounted on the implement’s main185 frame using stainless steel hex bolts.
186 2.2.2. Spike-tooth harrow187 A spike-tooth harrow was used as a secondary tillage tool,188 which had solid tines manufactured from iron that was arranged in189 one row and slanted to the rear to prevent clogging by debris. The190 harrow was fixed to plow the soil at a depth of 10 cm. By using the191 spike-tooth harrow in loosened soil effectively shatters and sorts192 soil clods and brings larger clods and aggregates to the surface. This193 process is recommended because of its stability under rainfall,194 which helps reduce soil erosion and produces a homogeneous195 seedbed for sowing machines.
196 2.2.3. Seeding unit (seed drill)197 The constructed seeding unit consisted of a grain box, a feed set,198 seed delivery tubes and a transmission gear attached to the199 machine frame for the feed set. The seed drill was used to carry out200 mechanical seeding in uniform rows (7 rows, 21.6 cm between201 each) at a controlled depth and in specified amounts. The seed box202 was designed and constructed from a one-millimeter thick steel203 sheet with dimensions of (40 � 120 � 60 cm). Seven adjustable204 dampers were attached to the seed box. The seed metering unit205 consisted of a tooth roller around its circumference with a curved206 plate. The bottom plate regulated the slot of each feeding set so the207 required amount of grains could flow easily without gathering.208 These seeds dropped into a hinged trough that was connected to209 the seed box. The same trough could be adjusted to drill the seeds210 at different required seeding rates. The feeding unit was connected211 to a spiked roller through a reduction and transmission gears to be212 able to use different speeds for the feeding system, when the roller213 rotates by friction with the soil, the gears transmit the rotating214 movement to the feeding unit.
215 2.2.4. Spiked roller (reservoir tillage tool)216 A spiked roller was developed and manufactured out of 2 mm217 structural steel. The tool consisted of a roller (cylindrical core has218 an outside diameter of 50 cm, and a width of 120 cm) that was219 made of 42 teeth with truncated square pyramid shapes that were220 welded radially on the roller to form six heptagram rings. The tooth221 length was 12 cm, and the spacing between the rings was222 approximately 9.6 cm. The radial basal spacing of the teeth was223 about 9.4 cm. The depressions were formed through soil compres-224 sion and shearing. The gap around the base of each tooth facilitated225 these two interacting processes with minimal soil disturbance and226 compaction and improved soil penetration while providing a dam227 between adjacent depressions for safe storage of collected rain228 until infiltration.
229The roller was mounted on the main implement’s frame with230two L shape frames on each side by stainless steel hex bolts. The231roller axle (full-length, cold-rolled steel, 5 cm in diameter), Axle232bearings (Pillow block type with cast steel housing and double233tapered roller bearings). The spiked roller had the ability to create234small depressions in the loose soil surface, which acted as235reservoirs for rainwater. Each depression had a water capacity of2361 L. The final volume of these reservoirs was dependent upon the237soil conditions, the expected rainfall intensity and duration, the238roller’s weight which can be adjusted by filling the roller to239different levels with water through an opening on the bottom of240the roller, and the speed of the tractor.241The spiked roller was designed to fit the modified seeder.242Depressions or mini-reservoirs were made in continuous rows on243both sides of the seed lines for in-situ rainwater harvesting after244seeding.
2452.3. Tillage experiments and crop management
246The field experiment was carried out on wheat during the247winter season of 2012–2013. The experiment was performed in a248split–split plot design with three replications. Tillage practices249were maintained in the main plots, tillage depths as the sub-plot250and tillage forward speeds as the sub–sub plot. The three tillage251practices used in this study were (1) minimum tillage (MT), a one-252pass tillage operation that uses the chisel plow and the spike-tooth253harrow followed by manual spreading of seeds, (2) combination254implement (integrated reservoir tillage system (RT)), and (3)255conventional tillage (CT), corresponding to the traditional method256(control) used by local farmers in this region of two passes of tillage257operation using a chisel plow, seven tines with working width of258175 cm, followed by manual spreading of seeds after tillage. The259experiment was conducted at three different levels of tillage260depths (15, 20, and 25 cm) and four forward speeds of tillage261operations (0.69, 1.00, 1.25 and 1.53 m s�1).262The main plots occupied about 0.45 ha, each, and the main plots263were divided into three subplots (about 0.15 ha) then they were264divided and randomly assigned into four sub–sub plots. Each plot265was 2.5 m in width and 40 m in length, with a buffer zone of 0.5 m266between plots. A small area of approximately 10 m long by 2.5 m267wide before the beginning of each tested plot was used to enable268the tractor and implements to reach the required tillage depth and269operation speed. A tractor model Ursus C-385 (63.4 kW) was used270in all the experiments.271The sowing rate used in the seeder and the manual spreading272was 140 kg ha�1 of winter wheat (Triticum aestivum L.), Giza273168 variety. Wheat was sowed at a depth of 4 cm and a seed rate of274300 seed m�2, with a row spacing of 21.6 cm on 16 December 2012.275All plots were fertilized according to the common practice. A276basal and single dose of superphosphate (15.5% P2O5) was applied
Fig. 3. (a) the main structure of the combination implement; (b) the combination implement during carrying out experiments; (c) the depressions or mini-reservoirs creatingby the combination implement.
4 H.M. Salem et al. / Soil & Tillage Research xxx (2015) xxx–xxx
G Model
STILL 3444 1–11
Please cite this article in press as: Salem, H.M., et al., Effect of integrated reservoir tillage for in-situ rainwater harvesting and other tillagepractices on soil physical properties. Soil Tillage Res. (2015), http://dx.doi.org/10.1016/j.still.2015.02.009

277 at a rate of 70 kg ha�1. Nitrogen fertilizer was applied as278 ammonium nitrate (33.5% N) at a rate of 100 kg ha�1 in two equal279 doses; the first was applied at the time of seeding, and the second280 was applied three weeks after seeding.
281 2.4. Measurements
282 2.4.1. Soil physical properties283 Soil samples were taken with a cylindrical core at depths of 10,284 20, and 30 cm and each was replicated three times per sub–sub285 plot. The core samples were immediately weighed and then dried286 at 105 �C for 24 h. Soil bulk density was measured according to287 (Blake, 1965). Further, to analyze soil physical and chemical288 properties, different soil samples were air-dried and sieved289 through a 2 mm sieve. The following analyses were conducted:290 The particle size distribution was determined using the pipette291 method according to Piper (1950). The water extract components292 were determined in the soil paste extract using the standard293 methods of analysis presented by Jackson (1969). Soil reaction (pH)294 was determined in the soil paste, according to the method295 proposed by Richards (1954). Collin’s calcimeter was used for296 CaCO3 determination according to the method described by Wright297 (1939). Soil organic matter content was determined following the298 modified Walkley and Black method (Jackson, 1969). The soil299 physical and chemical characteristics are shown in Table 1.300 The infiltration rate was measured by using a double ring301 infiltrometer with an inner ring of 30 cm diameter and an outer302 ring of 60 cm diameter. The double ring was hammered into the303 soil to 15 cm depth. Penetration resistance (cone index) was304 measured by using a pentrometer model (SR-2, DIK-500). The bulk305 density, infiltration rate and cone index were determined before306 tillage and three weeks after emergence and each was replicated307 three times per sub–sub plot.
308 2.4.2. Runoff and soil loss309 The runoff volume obtained on the cultivated area was collected310 in the receiving containers that were installed in auger holes at the311 down-slope edge of each sub–sub plot. Containers were covered so312 that rain could not enter, and evaporation was assumed to be313 negligible. The containers were emptied after each measurement314 to ensure enough space for the next storm runoff. The runoff315 volume was determined from the measured depth of water in each316 container, and the runoff coefficient was computed as the317 percentage of rainfall that became runoff.318 Soil loss (sediment) was deposited, separated from the water,319 dried in an oven to a constant weight at 105 �C for 24 h, and320 weighed. Soil loss rate was defined by dividing sediment weight321 per unit area. Runoff and soil loss were measured once at the322 down-slope edge of each sub–sub plot.
323 2.4.3. Moisture storage and water harvesting efficiency324 The field capacity and permanent wilting point moisture325 content were determined using undisturbed core samples326 collected using core sampler (19 cm length and 5.5 cm diameter)327 at the depths of 0–20, 20–40, and 40–60 cm. Measurements were
328performed once before the treatments and three times (6, 40, and32963 days after the last rain) in the dry season between 10 March330and 12 May 2013 and each was replicated three times per sub–sub331plot.332Soil samples were saturated for 24 h, and a pressure of 1/3 bar333(for field capacity) and 15 bar (for permanent wilting point) were334exerted until no further change in sample mass was observed.335Based on the methodology described by Or and Wraith (2000), and336IAEA (International Atomic Energy Agency, 2008), the total337available water (TAW) for plant use in the root zone was computed338as the difference between the moisture content at field capacity339and the permanent wilting point employing Eq. (1) (Allen et al.,3401998) as:
TAW ¼ Sni ðuFCi � uPWPiÞZri (1)
341342where TAW = total available soil water (mm); uFCi = moisture343content at field capacity on volume base in the ith layer of the344soil (%); uPWPi = moisture content at permanent wilting point on345volume base in the ith layer of the soil (%); Zri = depth of the ith soil346layer within the root zone (mm); and n = number of soil layers in347the soil root zone.348The water harvesting efficiency (WHE) for one season was349assessed as the ratio of the depth of stored water (Se) in mm at the350end of the rainy season to the total seasonal precipitation (Pg) in351mm (Oweis and Taimeh, 1996; Boers, 1997; Gammoh, 2013),352where:
WHE ¼ SePg
� �� 100 (2)
3532.4.4. Precipitation use efficiency and harvest index354Precipitation use efficiency (PUEg) for the cropping season was355calculated using the following equation (Hensley et al., 2000):
PUEg ¼ GYPg þ ðup � uhÞ
(3)
356where PUEg was calculated based on the grain yield (kg ha mm�1),357GY = grain yield (kg ha�1); Pg = precipitation during the cropping358season (mm); up = water content of the root zone at planting (mm);359and uh = water content of the root zone at harvesting (mm).360The harvesting date was 12 May 2013, and the grain and361biomass yield were determined from 1 m2middle area of each sub-362sub plot with three replications by clipping the plants at the soil363surface at harvest time. The harvest index was computed as364percentage grain in the total aboveground plant biomass.
3652.5. Statistical analysis
366Data were analyzed by the General Linear Model of ANOVA. The367SAS (SAS/STAT, 1999–2001) procedure was used to test the368significant differences, and Tukey’s HSD (honestly significant369difference) test was performed for post-hoc comparisons between
Table 1Physical and chemical properties Q8of the soil measured at different layers before tillage operations.
Depth(cm)
pH ECe
(dS m�1)O.M(%)
CaCO3
(%)Particle sizedistribution %
Bulk density(Mg m�3)
Cone index(M Pa)
Field capacity(vol. %)
Permanent wiltingpoint (vol. %)
TAWa (mm/20 cm)
Infiltration rate(cm h�1)
Sand Silt Clay
0–20 7.86 1.13 0.57 15.34 64.1 21.2 14.7 1.51 1.33 19.56 12.57 13.98 1.1220–40 7.78 0.96 0.51 15.48 62.9 20.1 17 1.53 1.45 22.57 13.31 18.5240–60 7.82 1.11 0.34 15.79 61.6 21.2 17.2 1.54 1.49 22.05 12.54 19.02
a (TAW) total available water.
H.M. Salem et al. / Soil & Tillage Research xxx (2015) xxx–xxx 5
G Model
STILL 3444 1–11
Please cite this article in press as: Salem, H.M., et al., Effect of integrated reservoir tillage for in-situ rainwater harvesting and other tillagepractices on soil physical properties. Soil Tillage Res. (2015), http://dx.doi.org/10.1016/j.still.2015.02.009

370 treatments mean at the 95% probability levelQ4 (p < 0.05). Levene and371 Kolmogorov–Smirnov test was applied ahead of analysis to check372 the normality, to ensure that assumptions of the model were met.
373 3. Results and discussion
374 3.1. Soil physical properties
375 Tillage practices, tillage depths, and tillage forward speeds had376 significant individual effects on bulk density, cone index and377 infiltration rate for all soil layers (0–30 cm), as shown in Table 2.378 This trend may be related to the maximum effective working depth379 among the tillage practices (15–25 cm). Simultaneously, the380 interaction effects between tillage practices, tillage depths and381 tillage forward speeds were not significant for bulk density, cone382 index and infiltration rate for all soil layers (0–30 cm).
383 3.1.1. Soil bulk density384 Soil bulk density is a very important parameter that reflects the385 status of soil compaction and soil porosity. Table 3 shows the mean386 values of bulk density in different soil layers under different tillage387 practices, tillage depths, and tillage forward speeds. Bulk density388 generally increased with depth and was significantly affected by389 tillage treatments at all sampling depths in comparison with a soil390 without any treatments (Table 1).391 There were significant differences between RT and CT in soil392 layers 10–20, and 20–30 cm, and the effect was not significant393 between MT and RT in the 20–30 cm soil layer (Table 3). Overall, in394 the 20–30 cm soil layer, tillage practice affected bulk density in the395 order: MT > RT > CT. On the other hand, in the 0–10 cm soil layer, the396 order changed to CT > RT > MT. In cases of MT and RT, this impact on397 bulk density can be attributed to the use of a spike-tooth harrow,398 which caused a breakdown of soil structure in the upper layer. CT399 was carried out in two passes, but the compaction increased due to400 the wheel traffic.401 Soil bulk density changed not only because of constructional402 properties of soil tillage implements, but also because of their
403operational variables (Taniguchi et al., 1999; Albiero et al., 2011).404Tillage depth significantly affected soil bulk density in all soil layers405except the 10–20 cm soil layer. In general, higher forward speeds406caused increases in soil bulk density at all soil layers due to the407production of fewer breakdowns of soil aggregates, while lower408forward speeds caused decreases in soil bulk density except for the4090–10 cm soil layer, due to the effective working depth among the410tillage practices (15–25 cm), for example, when forward speed411increased from 0.69 to 1.53 m s�1, soil bulk densities increased by4126.35, 6.97, and 4.44% for soil layers 0–10, 10–20, and 20–30 cm,413respectively. This is attributable to the fact that at higher speeds of414operation, the tractor tractive efficiency became very low leading415to skidding. These results generally agree with earlier findings416under varying soil conditions (Thakur et al., 1988; Rautaray et al.,4171997; Ahaneku and Ogunjirin, 2005).
4183.1.2. Soil cone index419Soil penetration resistance as measured by cone index has been420used as an important indicator for soil compaction (Tessier et al.,4211997) and crop root development (Chen et al., 2005). Table 3422represents the mean values of cone index in different soil layers423with different tillage practices, tillage depths, and tillage forward424speeds. Similar to bulk density, cone index increased with depth425and was affected by tillage treatments at all sampling depths.426Furthermore, increasing forward speed caused significant427increases in cone index at all soil layers. The lowest value4280.73 MPa was recorded at a forward speed of 0.69 m s�1. However,429tillage practices affected cone indices in a different way at different430depths. For example, no significant difference was noted in the431upper layer between RT and CT, and their values were higher than432MT. This was perhaps due to the effect of the roller weight used in433the RT treatment to create depressions or mini-reservoirs on the434soil surface and the effect of wheel traffic in the CT treatment435because it was carried out in two passes. In the shallow layers, on436the other hand, the RT and CT values were lower than the MT437treatment.438The influence of increasing tillage depth on decreasing cone439index value was clearly observed in the 20–30 cm soil layer, and the440maximum reduction in cone index was 18.3% at a tillage depth of44125 cm. In general, there were significant differences between442tillage depths and their values change in soil layers 0–10 and 20–44330 cm, according to the effective working depth.
4443.1.3. Infiltration rate445Conservation tillage practices would be expected to increase446infiltration and allow the water to flow deeper through the soil447vadose zone. Tillage practices as well as machine operating448parameters greatly affected infiltration rates. Table 4 demonstrates449that there were significant differences among tillage practices.450Overall, tillage practice affected infiltration rates in the order:451RT > MT > CT. There was little difference between the MT and CT452treatments, and the maximum mean infiltration rate of 10.69 cm453h�1 was observed with RT at tillage depth 20 cm, which decreased454to 5.99 cm h�1 with CT at the same tillage depth. In general, the RT455increased infiltration rates by 47.52 and 64.30%, compared with MT456and CT respectively, This can be explained by the fact that the large457infiltration surface area created by the numerous depressions and458the small depth of ponded water in the shallow depressions459resulting from the RT treatment compared with MT and CT460treatments (Mrabet, 2002).461Significant differences in infiltration rate also occurred among462tillage forward speed except between 0.69 and 1 m s�1, where it463was noted that increasing forward speed decreased infiltration464rate. The minimum value of 6.72 cm h�1was noticed under forward465speed 1.53 m s�1 at a tillage depth of 15 cm.
Table. 2F values derived from ANOVA for bulk density, cone index, and infiltration rateunder different tillage practices, tillage depths, and tillage forward speeds.
Property Source of variance d.f. Soil depth layers (cm)
0–10 10–20 20–30Bulk density Tillage practices (Tp) 2 8.06* 4.86* 13.09**
Tillage depths (Td) 2 29.77** 3.41* 24.91**
Tillage speeds (Ts) 3 26.49** 16.45** 13.36**
Tp � Td 4 1.63 2.73* 5.61*
Tp � Ts 6 0.54 0.16 0.75Td � Ts 6 0.21 0.67 1.16Tp � Td � Ts 12 0.32 0.17 0.39
Cone index Tillage practices (Tp) 2 14.86** 3.19* 86.66**
Tillage depths (Td) 2 18.55** 12.22** 131.82**
Tillage speeds (Ts) 3 62.15** 119.85** 30.63**
Tp � Td 4 7.78** 13.00** 4.74*
Tp � Ts 6 3.86* 1.74 1.16Td � Ts 6 0.41 0.58 2.42*
Tp � Td � Ts 12 1.51 1.29 0.91
Property Source of variance d.f.infiltration rate Tillage practices (Tp) 2 260.12**
Tillage depths (Td) 2 3.14*
Tillage speeds (Ts) 3 23.10**
Tp � Td 4 12.15**
Tp � Ts 6 3.10*
Td � Ts 6 0.77Tp � Td � Ts 12 0.84
Note: *and ** indicate significant effects at 0.05 and 0.01 levels of probability,respectively.
6 H.M. Salem et al. / Soil & Tillage Research xxx (2015) xxx–xxx
G Model
STILL 3444 1–11
Please cite this article in press as: Salem, H.M., et al., Effect of integrated reservoir tillage for in-situ rainwater harvesting and other tillagepractices on soil physical properties. Soil Tillage Res. (2015), http://dx.doi.org/10.1016/j.still.2015.02.009

Table 3Mean values � standard error of bulk density (Mg m�3), and cone index (M Pa) for different types of tillage practices, tillage depths, and tillage forward speeds in different soillayers.
Treatments Bulk density (Mg m�3) Cone index (M Pa)
Soil layers (cm)0–10 10–20 20–30 0–10 10–20 20–30
Tillage practicesMT 1.27 � 0.01 b 1.34 � 0.01 ab 1.40 � 0.02 a 0.78 � 0.02 b 0.97 � 0.02 a 1.13 � 0.01 a
RT 1.29 � 0.01 ab 1.35 � 0.02 a 1.38 � 0.01 a 0.85 � 0.01 a 0.94 � 0.02 b 0.99 � 0.02 b
CT 1.31 � 0.01 a 1.31 � 0.01 b 1.35 � 0.01 b 0.84 � 0.02 a 0.95 � 0.02 ab 0.99 � 0.02 b
SEM � 0.006 0.008 0.006 0.009 0.008 0.009HSD (p < 0.05) 0.021 0.027 0.021 0.029 0.029 0.031
Tillage depths (cm)15 1.26 � 0.01 c 1.34 � 0.01 a 1.41 � 0.01 a 0.79 � 0.02 c 0.95 � 0.02 b 1.15 � 0.01 a
20 1.29 � 0.01 b 1.32 � 0.02 a 1.37 � 0.02 b 0.82 � 0.01 b 0.92 � 0.02 b 1.02 � 0.02 b
25 1.32 � 0.01 a 1.34 � 0.01 a 1.35 � 0.01 c 0.86 � 0.02 a 0.98 � 0.02 a 0.94 � 0.02 c
SEM � 0.006 0.008 0.006 0.009 0.008 0.009HSD (p < 0.05) 0.021 0.027 0.021 0.029 0.029 0.031
Tillage speeds (m s�1)0.69 1.26 � 0.01 c 1.29 � 0.01 c 1.35 � 0.02 c 0.73 � 0.02 d 0.84 � 0.01 d 0.98 � 0.02 c
1 1.26 � 0.02 c 1.32 � 0.01 b 1.37 � 0.01 b 0.79 � 0.01 c 0.90 � 0.01 c 1.01 � 0.01 bc
1.25 1.30 � 0.01 b 1.34 � 0.01 ab 1.38 � 0.02 b 0.85 � 0.01 b 0.98 � 0.01 b 1.04 � 0.01 b
1.53 1.34 � 0.01 a 1.38 � 0.01 a 1.41 � 0.01 a 0.92 � 0.02 a 1.08 � 0.02 a 1.12 � 0.01 a
SEM � 0.007 0.009 0.007 0.010 0.010 0.010HSD (p < 0.05) 0.027 0.034 0.027 0.037 0.037 0.039
MT: Minimum tillage; RT: reservoir tillage; CT: conventional tillage. Different letters in the same column indicate significant differences (p < 0.05).
Table. 4Mean values of infiltration rate (cm h�1) for different types of tillage practices, tillage depths, and tillage forward speeds.
Tillage practices Tillage depths (cm) Tillage forward speeds (m s�1) Mean
0.69 1 1.25 1.53MT 15 8.90 (�0.95)a 7.63 (�1.10) 6.95 (�0.67) 6.30 (�0.95) 7.45RT 10.36 (�1.18) 11.07 (�0.75) 10.83 (�0.55) 8.73 (�0.59) 10.25CT 7.11 (�0.77) 6.75 (�1.05) 5.05 (�0.69) 5.14 (�0.65) 6.01
Mean 8.79 8.48 7.61 6.72MT 20 8.47 (�0.72) 8.30 (�0.82) 7.63 (�0.90) 7.00 (�0.85) 7.85RT 9.83 (�0.56) 11.47 (�0.57) 11.19 (�1.02) 10.25 (�0.77) 10.69CT 6.83 (�0.65) 6.94 (�0.58) 5.56 (�1.09) 4.63 (�0.29) 5.99
Mean 8.38 8.90 8.13 7.29MT 25 6.20 (�0.89) 6.10 (�0.95) 5.83 (�0.99) 5.23 (�0.73) 5.84RT 10.75 (�1.09) 10.68 (�0.86) 10.29 (�0.48) 9.41 (�0.96) 10.28CT 7.67 (�0.34) 8.07 (�0.49) 6.38 (�0.69) 5.77 (�0.83) 6.97
Mean 8.21 8.28 7.50 6.80
MT: Minimum tillage; RT: reservoir tillage; CT: conventional tillage.a Figures in the parentheses are the standard deviations.
Table 5Effect of rainfall storm event on runoff (mm) and soil loss (t ha�1) in a soil without any treatments.
Storm event No. Rainfall Runoff (mm) Soil loss(t ha�1)
Depth (mm) Duration (h) Intensity (mm h�1)
1 9.1 3.5 2.6 – –
2 10.3 1.6 6.4 0.81 0.313 33.6 3.1 12.0 4.6 0.744 11.6 1.2 9.7 1.02 0.445 41.3 3.5 13.3 5.3 0.916 6.5 2.3 2.8 – –
7 18.2 1.7 11.4 2.6 0.558 5.3 2.8 1.9 – –
9 13.6 1.9 7.2 1.9 0.5110 5.2 1.5 3.5 – –
11 6.5 1.6 4.1 – –
Total 161.2 16.23 3.46
H.M. Salem et al. / Soil & Tillage Research xxx (2015) xxx–xxx 7
G Model
STILL 3444 1–11
Please cite this article in press as: Salem, H.M., et al., Effect of integrated reservoir tillage for in-situ rainwater harvesting and other tillagepractices on soil physical properties. Soil Tillage Res. (2015), http://dx.doi.org/10.1016/j.still.2015.02.009
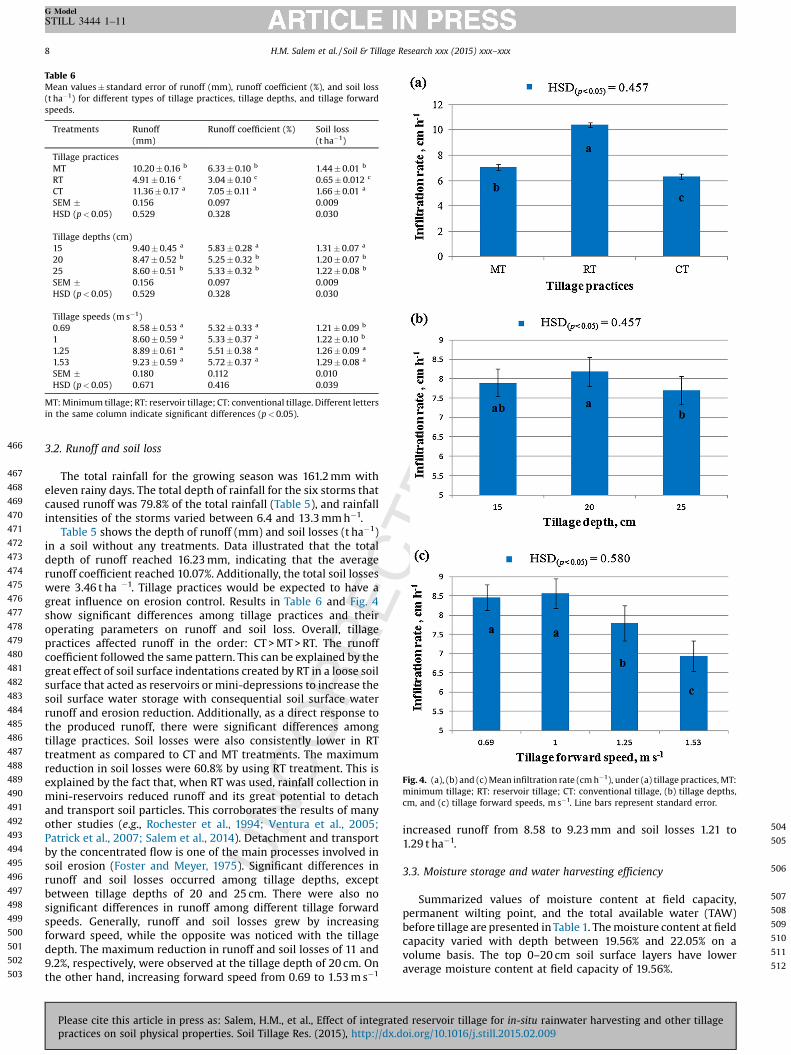
466 3.2. Runoff and soil loss
467 The total rainfall for the growing season was 161.2 mm with468 eleven rainy days. The total depth of rainfall for the six storms that469 caused runoff was 79.8% of the total rainfall (Table 5), and rainfall470 intensities of the storms varied between 6.4 and 13.3 mm h�1.471 Table 5 shows the depth of runoff (mm) and soil losses (t ha�1)472 in a soil without any treatments. Data illustrated that the total473 depth of runoff reached 16.23 mm, indicating that the average474 runoff coefficient reached 10.07%. Additionally, the total soil losses475 were 3.46 t ha �1. Tillage practices would be expected to have a476 great influence on erosion control. Results in Table 6 and Fig. 4477 show significant differences among tillage practices and their478 operating parameters on runoff and soil loss. Overall, tillage479 practices affected runoff in the order: CT > MT > RT. The runoff480 coefficient followed the same pattern. This can be explained by the481 great effect of soil surface indentations created by RT in a loose soil482 surface that acted as reservoirs or mini-depressions to increase the483 soil surface water storage with consequential soil surface water484 runoff and erosion reduction. Additionally, as a direct response to485 the produced runoff, there were significant differences among486 tillage practices. Soil losses were also consistently lower in RT487 treatment as compared to CT and MT treatments. The maximum488 reduction in soil losses were 60.8% by using RT treatment. This is489 explained by the fact that, when RT was used, rainfall collection in490 mini-reservoirs reduced runoff and its great potential to detach491 and transport soil particles. This corroborates the results of many492 other studies (e.g., Rochester et al., 1994; Ventura et al., 2005;493 Patrick et al., 2007; Salem et al., 2014). Detachment and transport494 by the concentrated flow is one of the main processes involved in495 soil erosion (Foster and Meyer, 1975). Significant differences in496 runoff and soil losses occurred among tillage depths, except497 between tillage depths of 20 and 25 cm. There were also no498 significant differences in runoff among different tillage forward499 speeds. Generally, runoff and soil losses grew by increasing500 forward speed, while the opposite was noticed with the tillage501 depth. The maximum reduction in runoff and soil losses of 11 and502 9.2%, respectively, were observed at the tillage depth of 20 cm. On503 the other hand, increasing forward speed from 0.69 to 1.53 m s�1
504increased runoff from 8.58 to 9.23 mm and soil losses 1.21 to5051.29 t ha�1.
5063.3. Moisture storage and water harvesting efficiency
507Summarized values of moisture content at field capacity,508permanent wilting point, and the total available water (TAW)509before tillage are presented in Table 1. The moisture content at field510capacity varied with depth between 19.56% and 22.05% on a511volume basis. The top 0–20 cm soil surface layers have lower512average moisture content at field capacity of 19.56%.
Table 6Mean values � standard error of runoff (mm), runoff coefficient (%), and soil loss(t ha�1) for different types of tillage practices, tillage depths, and tillage forwardspeeds.
Treatments Runoff(mm)
Runoff coefficient (%) Soil loss(t ha�1)
Tillage practicesMT 10.20 � 0.16 b 6.33 � 0.10 b 1.44 � 0.01 b
RT 4.91 � 0.16 c 3.04 � 0.10 c 0.65 � 0.012 c
CT 11.36 � 0.17 a 7.05 � 0.11 a 1.66 � 0.01 a
SEM � 0.156 0.097 0.009HSD (p < 0.05) 0.529 0.328 0.030
Tillage depths (cm)15 9.40 � 0.45 a 5.83 � 0.28 a 1.31 � 0.07 a
20 8.47 � 0.52 b 5.25 � 0.32 b 1.20 � 0.07 b
25 8.60 � 0.51 b 5.33 � 0.32 b 1.22 � 0.08 b
SEM � 0.156 0.097 0.009HSD (p < 0.05) 0.529 0.328 0.030
Tillage speeds (m s�1)0.69 8.58 � 0.53 a 5.32 � 0.33 a 1.21 � 0.09 b
1 8.60 � 0.59 a 5.33 � 0.37 a 1.22 � 0.10 b
1.25 8.89 � 0.61 a 5.51 � 0.38 a 1.26 � 0.09 a
1.53 9.23 � 0.59 a 5.72 � 0.37 a 1.29 � 0.08 a
SEM � 0.180 0.112 0.010HSD (p < 0.05) 0.671 0.416 0.039
MT: Minimum tillage; RT: reservoir tillage; CT: conventional tillage. Different lettersin the same column indicate significant differences (p < 0.05).
Fig. 4. (a), (b) and (c) Mean infiltration rate (cm h�1), under (a) tillage practices, MT:minimum tillage; RT: reservoir tillage; CT: conventional tillage, (b) tillage depths,cm, and (c) tillage forward speeds, m s�1. Line bars represent standard error.
8 H.M. Salem et al. / Soil & Tillage Research xxx (2015) xxx–xxx
G Model
STILL 3444 1–11
Please cite this article in press as: Salem, H.M., et al., Effect of integrated reservoir tillage for in-situ rainwater harvesting and other tillagepractices on soil physical properties. Soil Tillage Res. (2015), http://dx.doi.org/10.1016/j.still.2015.02.009

513 The moisture content at permanent wilting point also showed514 variation with depth having values between 12.54% and 13.31%.515 The TAW is directly related to variation in moisture content at field516 capacity and permanent wilting point. As a result, there was517 variation of TAW with depth in such a way that the highest value of518 TAW was found at 40–60 cm, whereas the lowest TAW was at the519 depth range of 0–20 cm. Variations of TAW with depth were520 observed as a result of the variations of moisture contents at field521 capacity and permanent wilting point.
522With tillage practice interventions, approximately 18–21 mm of523unavailable water were conserved with slight reduction until the524end of the growing season under all investigated techniques. Fig. 5525represents the remaining stored water as available for plant use526(TAW) in different soil layers through the dry period of the growing527season (t1, t2, t3, which correspond with 6, 40, and 63 days,528respectively) under different tillage practices, tillage depths, and529tillage forward speeds. The depth of available water under the RT530treatment was significantly greater than that under MT and CT531treatments in all layers, especially at (t1). Further, there were532significant differences between MT and CT treatments, and the533lowest TAW was observed under the CT treatment (Fig. 5a), which534was clearly due to the highest infiltration rate and the more runoff535being harvested from using RT. By the end of the growing season536(t3), it was observed that the depth of available water under RT537treatment was higher than MT and CT treatments by 44.4 and53874.5%, respectively, in all soil layers. The greatest losses were in539layers 0–20, and 20–40 cm, mainly due to evaporation and plant540consumption.541The tillage operating parameters had less significant differences542on TAW during each period (Fig. 5b and c), and it was observed that543increasing tillage depth caused slight increases in TAW, while the544opposite relationship was noticed with forward speed.545Different tillage practices had significantly different impact on546the total stored water in the soil profile (Se). The RT treatment547obtained the highest value, whereas the CT treatment had the548lowest value (Table 7). This can be explained by the fact that (Se) is549directly related to TAW. RT increased Se by 39.34% more than MT550and 115% more than CT. Tillage depth was not a determining factor551for TAW, nor were there differences observed between the forward552speeds of 0.69 and 1 m s�1. The lowest values of Se were observed553under tillage depth of 15 cm and forward speed 1.53 m s�1.554The lowest seasonal water-harvesting efficiency value (WHE)555was obtained with the CT treatment, while the highest value556obtained with the RT treatment (Table 7). This can be explained by557the fact that WHE is directly related to Se. Different tillage practices558showed significant differences in WHE in a similar pattern to their559effects on Se.
Fig. 5. (a) (b) and (c) Depth of available water as distributed in the soil layers (0–20,20–40, and 40–60 cm), through the dry period of the growing season (t1, t2, t3,which correspond with 6, 40, and 63 days, respectively, after the last rainfall event);(a) for tillage practices, MT: minimum tillage; RT: reservoir tillage; CT: conventionaltillage, (b) for tillage depths (Td) 15, 20, 25 cm, and (c) for tillage forward speeds (Ts)0.69, 1, 1.25, and 1.53 m s�1. Line bars represent standard error.
Table 7Mean values � standard error of stored water in the soil profile and water harvestingefficiency (WHE) for different types of tillage practices, tillage depths, and tillageforward speeds.
Treatments Stored water in the soil profile (mm) WHE (%)
Tillage practicesMT 66.59 � 0.68 b 41.31 � 0.42 b
RT 92.72 � 0.71 a 57.52 � 0.44 a
CT 43.39 � 0.56 c 26.92 � 0.35 c
SEM � 0.664 0.412HSD (p < 0.05) 2.248 1.395
Tillage depths (cm)15 66.39 � 3.44 a 41.19 � 2.13 a
20 68.05 � 3.52 a 42.22 � 2.18 a
25 68.26 � 3.43 a 42.34 � 2.14 a
SEM � 0.664 0.412HSD (p < 0.05) 2.248 1.395
Tillage speeds(m s�1)0.69 69.16 � 4.40 a 42.90 � 2.48 a
1 68.36 � 4.18 a 42.40 � 2.59 a
1.25 67.43 � 4.01 ab 41.83 � 2.49 ab
1.53 65.32 � 3.87 b 40.52 � 2.40 b
SEM � 0.767 0.476HSD (p < 0.05) 2.852 1.770
MT: Minimum tillage; RT: reservoir tillage; CT: conventional tillage. Different lettersin the same column indicate significant differences (p < 0.05).
H.M. Salem et al. / Soil & Tillage Research xxx (2015) xxx–xxx 9
G Model
STILL 3444 1–11
Please cite this article in press as: Salem, H.M., et al., Effect of integrated reservoir tillage for in-situ rainwater harvesting and other tillagepractices on soil physical properties. Soil Tillage Res. (2015), http://dx.doi.org/10.1016/j.still.2015.02.009

560 3.4. Precipitation use efficiency and harvest index
561 Results in Table 8 reveal that there were significant differences562 in grain yield among tillage practices. Overall, tillage practice563 affected grain yield and precipitation use efficiency in the order:564 RT > MT > CT. In other words, RT increased grain yield by 40.9%565 more than MT and 50.6% more than CT. The highest value of566 precipitation use efficiency of 11.87 kg ha�1mm�1 was observed567 under RT, while the lowest value of 7.14 kg ha�1mm�1 was568 recorded under CT treatment. In addition to previously addressed569 reasons, the efficiency of the RT is related to the fact that the570 seeding process was carried out mechanically in a controlled depth571 and in a specified amount of seeds per unit area using the modified572 seeder unit in the RT. Furthermore, it provided proper distance for573 optimum sunlight penetration for photosynthesis and proper574 depth to roots for uptake of water resulting in good water use575 efficiency. This corroborates the results of many other studies (e.g.,576 Krezel and Sobkowicz, 1996; Soomro et al., 2009).577 On the other hand, the seeding processes in the MT and CT578 treatments were carried out by manually spreading the seeds after579 tillage operations, which greatly decreased the germination ratio580 and consequently, the total yield.581 The biomass yield can be estimated from the harvest index582 value, and it shows that RT had the highest biomass yield583 compared with MT and CT treatments.584 There were no significant differences in grain yield or585 precipitation use efficiency between tillage depths of 20 and586 25 cm, and the lowest values were recorded under the tillage depth587 of 15 cm and forward speed of 1.53 m s�1. In other words, it was588 observed that increasing tillage depth increased grain yield and589 precipitation use efficiency, while the opposite was noted with590 forward speed. For example, increasing forward speed from 0.69 to591 1.53 m s�1 decreased grain yield and precipitation use efficiency by592 8.6 and 9.1%, respectively. Tillage depth and tillage forward speed593 did not significantly influence the harvest index.
5944. Conclusions
595Based on the results of this research, we draw the following596conclusions:
1. 597The combination Q5implement (integrated reservoir tillage598system) enhanced infiltration rate, increased water harvesting599efficiency, reduced runoff and soil losses, and exhibited the600highest yield of wheat.
2. 601The proper tillage operating parameters for the combination602implement appeared to be at tillage depth of 20 cm and forward603speed between 1 and 1.25 m s�1. The combination implement604provided, therefore, a viable option that has positive effects on605soil physical properties and increased crop yields compared to606minimum tillage and conventional tillage and provided an607opportunity to increase agricultural water use efficiency608through rainwater harvesting. Furthermore, it could be useful609in saving fuel, time and production costs due to the performance610of multiple processes at the same time. It is therefore desirable611to encourage farmers to initially opt for this technique when612switching from conventional tillage to conservation tillage.613Nevertheless, continued research is needed to determine the614longer term effects of these tillage practices on soil properties615and crop yield.
616Acknowledgments
617This study was financed and supported by the Q6Desert Research618Center, Cairo, Egypt, and the Rural Engineering Department,619Polytechnic University of Madrid, Spain. Special thanks to workers620and technicians at the Sustainable Development Center, Marsa621Matruh, Egypt for their efforts as well as material support.
622References
623Ahaneku, I.E., Ogunjirin, O.A., 2005. Effect of tractor forward speed on sandy loam624soil physical properties conditions during tillage. Niger. J. Technol. 24 (1), 51–57.625Albiero, D., Maciel, A.J.S., Gamero, C.A., Lanças, K.P., Mion, R.L., Viliotti, C.A.,626Monteiro, L.A., 2011. Dimensional analysis of soil properties after treatment627with the rotary paraplow, a new conservationist tillage tool. Span. J. Agric. Res. 9628(3), 693–701.629Allen, R.G., Pereira, D., Raes, D., Smith, M., 1998. Crop evapotranspiration. Irrigation630and Drainage Paper. FAO, No. 56, Rome.631Blake, G.R., 1965. Bulk density. In: Black, C.A. (Ed.), Methods of Soil Analysis. Part I632Physical and Mineralogical Properties. SSSA Inc., Madison, WI, USA, pp. 374–633390.634Boers, T.M., 1997. Rain Water Harvesting in Arid and Semi-Arid Zones (Reprinted).635International Institute for Land Reclamation and Improvement, Wageningen,636The Netherlands publication, no. 55, pp. 2–6.637Brhane, G., Wortmann, C.S., Mamo, M., Gebrekidan, H., Belay, A., 2006. Micro-basin638tillage for grain sorghum production in semiarid areas of Northern Ethiopia.639Agron. J. 98, 124–128.640Chen, Y., Cavers, C., Tessier, S., Monero, F., Lobb, D., 2005. Short-term tillage Q7effects641on soil cone index and plant development in a poorly drained, heavy clay soil.642Soil Till. Res. 82, 161–171.643D’aene, K., Vermang, J., Cornelis, W.M., Leroy, B.L.M., Schiettecatte, W., De Neve, S.,644Gabriels, D., Hofman, G., 2008. Reduced tillage effects on physical properties of645silt loam soils growing root crops. Soil Till. Res. 99, 279–290.646El-Saied, R.A., 2000. Effect of combination tillage machines on compaction soil and647energy requirements. MSc. Thesis. Faculty of Agriculture, Ain Shams University648p. 66.649Foster, G.R., Meyer, L.D., 1975. Mathematical simulation of upland erosion by650fundamental erosion mechanics. In: present and prospective technology for651predicting sediment yields and sources. Proceedings of the Sediment-Yield652Workshop, USDA Sediment Lab. Oxford, Miss. USA p. 285.653Gammoh, I.A., 2013. An improved wide furrow micro-catchment for large-scale654implementation of water-harvesting systems in arid areas. J. Arid Environ. 88,65550–56.656Hackwell, S.G., Rochester, E.W., Yoo, K.H., Burt, E.C., Monroe, G.E., 1991. Impact of657reservoir tillage on water intake and soil erosion. Trans. Am. Soc. Agric. Eng. 34,658436–442.659Hatibu, N., Mahoo, H., 1999. Rainwater Harvesting Technologies for Agricultural660Production: A Case for Dodoma, Tanzania. Sokoine University of agriculture,661Department of Agricultural Engineering and Land Planning.
Table 8Mean values � standard error of grain yield (kg ha�1), precipitation use efficiency(kg ha�1mm�1), and harvest index (%) for different types of tillage practices, tillagedepths, and tillage forward speeds.
Treatments Grain yield(kg ha�1)
Precipitation useefficiency(kg ha�1mm�1)
Harvest index (%)
Tillage practicesMT 1323.4 � 19.75 b 7.78 � 0.13 b 34.96 � 0.41 a
RT 1864.1 � 29.21 a 11.87 � 0.20 a 33.03 � 0.39 b
CT 1237.8 � 21.55 c 7.14 � 0.13 c 35.26 � 0.56 a
SEM � 22.06 0.134 0.512HSD(p < 0.05)
74.69 0.454 1.732
Tillage depths (cm)15 1391.6 � 45.55 b 8.35 � 0.33 b 34.31 � 0.53 a
20 1516.1 � 54.53 a 9.22 � 0.40 a 34.40 � 0.49 a
25 1517.5 � 54.31 a 9.23 � 0.39 a 34.53 � 0.44 a
SE� 22.06 0.134 0.512HSD(p < 0.05)
74.69 0.454 1.732
Tillage speeds (m s�1)0.69 1528.3 � 60.19 a 9.23 � 0.42 a 34.93 � 0.51 a
1 1521.2 � 58.47 a 9.26 � 0.44 a 35.03 � 0.59 a
1.25 1453.5 � 65.39ab
8.85 � 0.49 ab 33.97 � 0.54 a
1.53 1397.4 � 56 b 8.39 � 0.41 b 33.73 � 0.60 a
SEM � 25.48 0.155 0.591HSD(p < 0.05)
94.76 0.576 2.198
MT: Minimum tillage; RT: reservoir tillage; CT: conventional tillage. Different lettersin the same column indicate significant differences (p < 0.05).
10 H.M. Salem et al. / Soil & Tillage Research xxx (2015) xxx–xxx
G Model
STILL 3444 1–11
Please cite this article in press as: Salem, H.M., et al., Effect of integrated reservoir tillage for in-situ rainwater harvesting and other tillagepractices on soil physical properties. Soil Tillage Res. (2015), http://dx.doi.org/10.1016/j.still.2015.02.009

662 Hensley, M., Botha, J.J., Anderson, J.J., van Staden, P.P., du Toit, A., 2000. Optimizing663 rainfall use efficiency for developing farmers with limited access to irrigation664 water. WRC Report No 878/1/00. Water Research Commission, Pretoria, South665 Africa.666 Hernanz, J., López, R., Navarrete, L., Sanchez-Giron, V., 2002. Long-term effects of667 tillage systems and rotations on soil structural stability and organic carbon668 stratification in semiarid central Spain. Soil Till. Res. 66, 129–141.669 IAEA (International Atomic Energy Agency), 2008. Field estimation of soil water670 content. In: A Practical Guide to Methods. Instrumentation and Sensor671 Technology. TCS-30 IAEA, Vienna, p. 3.672 Jackson, A.L., 1969. Soil Chemical Analysis – Advanced Course. Pub. By Author, Dept.673 of Soils, Univ. of Wisc, Madison, Wisc., USA.674 Kahlon, M.S., Lal, R., Ann-Varughese, M., 2013. Twenty two years of tillage and675 mulching impacts on soil physical characteristics and carbon sequestration in676 Central Ohio. Soil Till. Res. 126, 151–158.677 Krezel, R., Sobkowicz, P., 1996. The effect of sowing rates and methods on winter678 triticale grown on light soil. Roczniki Nauk Rolniczych Seria A: Produkeja679 Roslinna 111 (3/4), 69–78.680 Liu, Y., Sui, Y., Gu, D., Wen, X., Chen, Y., Li, C., Liao, Y., 2013. Effects of conservation681 tillage on grain filling and hormonal changes in wheat under simulated rainfall682 conditions. Field Crops Res. 144, 43–51.683 López-Garrido, R., Madejón, E., León-Camacho, M., Girón, I., Moreno, F., Murillo, G.
M., 2014. Reduced tillage as an alternative to no-tillage under Mediterranean684 conditions: a case study. Soil Till. Res. 140, 40–47.685 Mamdouh, N., 1999. Assessing Desertification and Water Harvesting in the Middle686 East and North Africa. Bonn, Germany: Zentrum für Entwicklungsforschung687 (ZEF).688 McHugh, O.V., Steenhuis, T.S., Abebe, B., Fernandes, E.C.M., 2007. Performance of in689 situ rainwater conservation tillage techniques in dry spell mitigation and690 erosion control in the drought-prone North Wello zone of the Ethiopian691 highlands. Soil Till. Res. 97, 19–36.692 Mrabet, R., 2002. Stratification of soil and organic matter under tillage systems in693 Africa. Soil Till. Res. 66, 119–128.694 Nuti, R.C., Lamb, M.C., Sorensen, R.B., Truman, C.C., 2009. Agronomic and economic695 response to furrow diking tillage in irrigated and non-irrigated cotton696 (Gossypium hirsutum L.). Agric. Water Manage. 96, 1078–1084.697 OAS, 1997. Organization of American States). Source Book of Alternative698 Technologies for Freshwater Augmentation in Latin America and the Caribbean.699 Unit of Sustainable Development and Environment General Secretariat.700 Organization of American States Washington, D.C..701 Or, D., Wraith, J.M., 2000. Soil water content and water potential relationships. In:702 Sumner, M.E. (Ed.), Handbook of Soil Science. CRC Press, Boca Raton, FL, USA, pp.703 54–64.704 Oweis, T.Y., Taimeh, A.Y., 1996. Evaluation of a small basin water harvesting system705 in the arid region of Jordan. Water Resour. Manage. 10, 21–34.706 Patrick, C., Kechavarzi, C., James, I.T., Dogherty, M.O., Godwin, R.J., 2007. Developing707 reservoir tillage technology for semi-arid environments. Soil Use Manage. 23708 (June), 185–191.
709Piper, C.S., 1950. Soil and plant analysis. A Monograph from Wait Agric. Research710Institute, Univ. of Adelaide, Australia.711Prinz, D., Wolfer, S., 1999. Traditional techniques of water management to cover712future irrigation water demand. Z. f. Bewässerungswirtschaft 34 (1), 41–60 ISSN7130049-8602.714Rautaray, S.K., Watts, C.W., Dexter, A.R., 1997. Pudding effects on soil physical715parameters. AMA 28 (3), 37–40.716Richards, L.A., 1954. Diagnosis and improvement of saline and alkali soils. U.S. Dept.717of Agric, Hand Book N, pp. 60–$9.718Rochester, E.W., Hill, D.T., Yoo, K.H., 1994. Impact of reservoir tillage on run-off719quality and quantity. Trans. Am. Soc. Agric. Eng. 37 (4), 1183–1186.720Rockstrom, J., Barron, J., Fox, P., 2001. Water productivity in rainfed agriculture:721challenges and opportunities for smallholder farmers in drought-prone tropical722agro-systems. Paper Presented at an IWMI Workshop, Colombo, Sri Lanka,723November 12–14.724Rohit, K.S., Hifjur, R., 2006. An approach for draft prediction of combination tillage725implements in sandy clay loam soil. Soil Till. Res. 90, 145–155.726Salem, H.M., Valero, C., Muñoz, M.A., Rodríguez, M.G., Barreiro, P., 2014. Effect of727reservoir tillage on rainwater harvesting and soil erosion control under a728developed rainfall simulator. Catena 113, 353–362.729Salem, H.M., Valero, C., Muñoz, M.A., Rodríguez, M.G., Silva, L.L., 2015. Short-term730effects of four tillage practices on soil physical properties, soil water potential,731and maize yield. Geoderma 237–238, 60–70.732SAS/STAT,1999–2001. SAS 7. In: STAT User’s Guide (Release 8.2). SAS Inst. Inc., Cary, NC.733Soomro, U.A., Rahman, M.U., Odhano, E.A., Gul, S., Tareen, A.Q., 2009. Effects of734sowing method and seed rate on growth and yield of wheat (Triticum aestivum).735World J. Agric. Sci. 5 (2), 159–162.736Stott, D.E., Mohtar, R.H., Steinhardt, G.C., 2001. Water conservation, harvesting and737management (WCHM) – Kenyan experience.738Taniguchi, T., Makanga, J.T., Ohtoma, K., Kishimoto, T., 1999. Draft and soil739manipulation by a moldboard plow under different forward speed and body740attachments. Trans. ASAE 42, 1517–1521.741Tessier, S., Lachance, B., Laguë, C., Chen, Y., Chi, L., Bachand, D., 1997. Soil compaction742reduction with a modified one-way disker. Soil Till. Res. 42, 63–77.743Thakur, T.C., Yadav, A., Varshney, B.P., Chand, P., 1988. Effects of load and speed on744performance of clod crushers. AMA 19 (4), 1520.745Tuhtaku-Ziev, A., Utepbergenov, B.K., 2002. Combined implements for746simultaneous loosening and leveling of soil surface. J. Agric. Mech. Asia Africa747Latin Am. 33 (2), 15–16.748Ventura, E., Norton, L.D., Ward, K., López-Bautista, M., Tapia-Naranjo, A., 2005. A749new reservoir tillage system for crop production in semiarid areas. ASAE Annual750Meeting. American Society of Agricultural Engineers . http://asae.frymulti.com/751request.asp?.752Wiyo, K.A., Kasomekera, Z.M., Feyen, J., 2000. Effect of tied-ridging on soil water753status of a maize crop under Malawi conditions. Agric. Water Manage. 45, 101–754125.755Wright, C.H., 1939. Soil analysis. A Handbook of Physical and Chemical Methods.756Thomas Murby and Co., London.
H.M. Salem et al. / Soil & Tillage Research xxx (2015) xxx–xxx 11
G Model
STILL 3444 1–11
Please cite this article in press as: Salem, H.M., et al., Effect of integrated reservoir tillage for in-situ rainwater harvesting and other tillagepractices on soil physical properties. Soil Tillage Res. (2015), http://dx.doi.org/10.1016/j.still.2015.02.009