Embed Size (px)
Citation preview

debug clns esis events through debug dbconntcp
• debug clns esis events through debug dbconn tcp, page 1
debug clns esis events through debug dbconn tcp
Cisco IOS Debug Command Reference - Commands A through D 1

debug clns esis eventsTo display uncommon End System-to-Intermediate System (ES-IS) events, including previously unknownneighbors, neighbors that have aged out, and neighbors that have changed roles (ES-IS, for example), use thedebugclnsesisevents command in privileged EXEC mode. To disable debugging output, use the no form ofthis command.
debug clns esis events
no debug clns esis events
Syntax Description This command has no arguments or keywords.
Command Modes Privileged EXEC
Examples The following is sample output from the debugclnsesisevents command:
Router# debug clns esis eventsES-IS: ISH from aa00.0400.2c05 (Ethernet1), HT 30ES-IS: ESH from aa00.0400.9105 (Ethernet1), HT 150ES-IS: ISH sent to All ESs (Ethernet1): NET 49.0001.AA00.0400.6904.00, HT 299, HLEN 20The following line indicates that the router received a hello packet ( ISH) from the IS at MAC addressaa00.0400.2c05 on Ethernet interface 1. The hold time (or number of seconds to consider this packet validbefore deleting it) for this packet is 30 seconds.
ES-IS: ISH from aa00.0400.2c05 (Ethernet1), HT 30The following line indicates that the router received a hello packet (ESH) from the ES at MAC addressaa00.0400.9105 on the Ethernet interface 1. The hold time is 150 seconds.
ES-IS: ESH from aa00.0400.9105 (Ethernet1), HT 150The following line indicates that the router sent an IS hello packet on the Ethernet interface 0 to all ESs onthe network. The network entity title (NET) address of the router is 49.0001.0400.AA00.6904.00; the holdtime for this packet is 299 seconds; and the header length of this packet is 20 bytes.
ES-IS: ISH sent to All ESs (Ethernet1): NET 49.0001.AA00.0400.6904.00, HT 299, HLEN 20
Cisco IOS Debug Command Reference - Commands A through D2
debug clns esis events through debug dbconn tcpdebug clns esis events

debug clns esis packetsTo enable display information on End System-to-Intermediate System ( ES-IS) packets that the router hasreceived and sent, use the debugclnsesispackets command in privileged EXEC mode. To disable debuggingoutput, use the no form of this command.
debug clns esis packets
no debug clns esis packets
Syntax Description This command has no arguments or keywords.
Command Modes Privileged EXEC
Examples The following is sample output from thedebugclnsesispackets command:
Router# debug clns esis packets
ES-IS: ISH sent to All ESs (Ethernet0): NET47.0005.80ff.ef00.0000.0001.5940.1600.8906.4023.00, HT 299, HLEN 33ES-IS: ISH sent to All ESs (Ethernet1): NET47.0005.80ff.ef00.0000.0001.5940.1600.8906.4023.00, HT 299, HLEN 34ES-IS: ISH from aa00.0400.6408 (Ethernet0), HT 299ES-IS: ISH sent to All ESs (Tunnel0): NET47.0005.80ff.ef00.0000.0001.5940.1600.O906.4023.00, HT 299, HLEN 34IS-IS: ESH from 0000.0c00.bda8 (Ethernet0), HT 300The following line indicates that the router has sent an IS hello packet on Ethernet interface 0 to all ESs onthe network. This hello packet indicates that the NET of the router is47.0005.80ff.ef00.0000.0001.5940.1600.8906.4023.00. The hold time for this packet is 299 seconds. Thepacket header is 33 bytes in length.
ES-IS: ISH sent to All ESs (Ethernet0): NET47.0005.80ff.ef00.0000.0001.5940.1600.8906.4023.00, HT 299, HLEN 33The following line indicates that the router has sent an IS hello packet on Ethernet interface 1 to all ESs onthe network. This hello packet indicates that the NET of the router is47.0005.80ff.ef00.0000.0001.5940.1600.8906.4023.00. The hold time for this packet is 299 seconds. Thepacket header is 33 bytes in length.
ES-IS: ISH sent to All ESs (Ethernet1): NET47.0005.80ff.ef00.0000.0001.5940.1600.8906.4023.00, HT 299, HLEN 34The following line indicates that the router received a hello packet on Ethernet interface 0 from an intermediatesystem, aa00.0400.6408. The hold time for this packet is 299 seconds.
ES-IS: ISH from aa00.0400.6408 (Ethernet0), HT 299The following line indicates that the router has sent an IS hello packet on Tunnel interface 0 to all ESs on thenetwork. This hello packet indicates that the NET of the router is47.0005.80ff.ef00.0000.0001.5940.1600.8906.4023.00. The hold time for this packet is 299 seconds. Thepacket header is 33 bytes in length.
ES-IS: ISH sent to All ESs (Tunnel0): NET 47.0005.80ff.ef00.0000.0001.5940.1600.8906.4023.00,HT 299, HLEN 34
Cisco IOS Debug Command Reference - Commands A through D 3
debug clns esis events through debug dbconn tcpdebug clns esis packets

The following line indicates that on Ethernet interface 0, the router received a hello packet from an end systemwith an SNPA of 0000.0c00.bda8. The hold time for this packet is 300 seconds.
IS-IS: ESH from 0000.0c00.bda8 (Ethernet0), HT 300
Cisco IOS Debug Command Reference - Commands A through D4
debug clns esis events through debug dbconn tcpdebug clns esis packets
debug clns eventsTo display Connectionless Network Service (CLNS) events that are occurring at the router, use thedebugclnsevents command in privileged EXEC mode. To disable debugging output, use the no form of thiscommand.
debug clns events
no debug clns events
Syntax Description This command has no arguments or keywords.
Command Modes Privileged EXEC
Examples The following is sample output from thedebugclnsevents command:
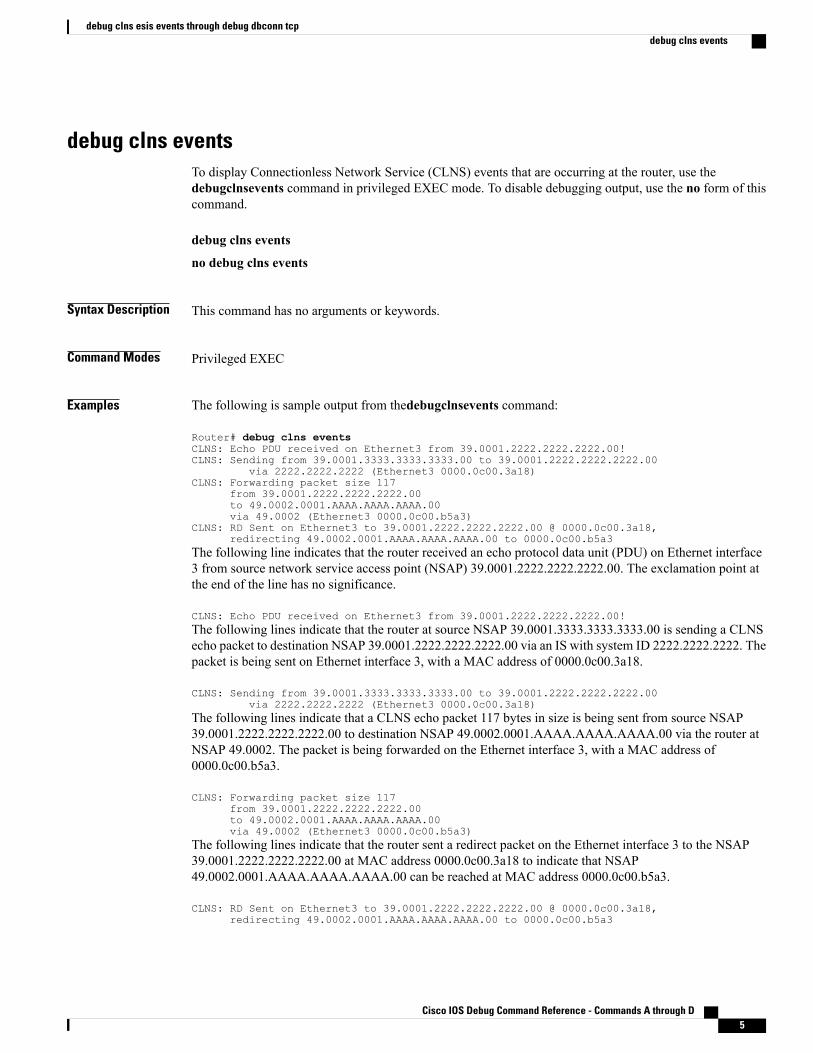
Router# debug clns eventsCLNS: Echo PDU received on Ethernet3 from 39.0001.2222.2222.2222.00!CLNS: Sending from 39.0001.3333.3333.3333.00 to 39.0001.2222.2222.2222.00
via 2222.2222.2222 (Ethernet3 0000.0c00.3a18)CLNS: Forwarding packet size 117
from 39.0001.2222.2222.2222.00to 49.0002.0001.AAAA.AAAA.AAAA.00via 49.0002 (Ethernet3 0000.0c00.b5a3)
CLNS: RD Sent on Ethernet3 to 39.0001.2222.2222.2222.00 @ 0000.0c00.3a18,redirecting 49.0002.0001.AAAA.AAAA.AAAA.00 to 0000.0c00.b5a3
The following line indicates that the router received an echo protocol data unit (PDU) on Ethernet interface3 from source network service access point (NSAP) 39.0001.2222.2222.2222.00. The exclamation point atthe end of the line has no significance.
CLNS: Echo PDU received on Ethernet3 from 39.0001.2222.2222.2222.00!The following lines indicate that the router at source NSAP 39.0001.3333.3333.3333.00 is sending a CLNSecho packet to destination NSAP 39.0001.2222.2222.2222.00 via an IS with system ID 2222.2222.2222. Thepacket is being sent on Ethernet interface 3, with a MAC address of 0000.0c00.3a18.
CLNS: Sending from 39.0001.3333.3333.3333.00 to 39.0001.2222.2222.2222.00via 2222.2222.2222 (Ethernet3 0000.0c00.3a18)
The following lines indicate that a CLNS echo packet 117 bytes in size is being sent from source NSAP39.0001.2222.2222.2222.00 to destination NSAP 49.0002.0001.AAAA.AAAA.AAAA.00 via the router atNSAP 49.0002. The packet is being forwarded on the Ethernet interface 3, with a MAC address of0000.0c00.b5a3.
CLNS: Forwarding packet size 117from 39.0001.2222.2222.2222.00to 49.0002.0001.AAAA.AAAA.AAAA.00via 49.0002 (Ethernet3 0000.0c00.b5a3)
The following lines indicate that the router sent a redirect packet on the Ethernet interface 3 to the NSAP39.0001.2222.2222.2222.00 at MAC address 0000.0c00.3a18 to indicate that NSAP49.0002.0001.AAAA.AAAA.AAAA.00 can be reached at MAC address 0000.0c00.b5a3.
CLNS: RD Sent on Ethernet3 to 39.0001.2222.2222.2222.00 @ 0000.0c00.3a18,redirecting 49.0002.0001.AAAA.AAAA.AAAA.00 to 0000.0c00.b5a3
Cisco IOS Debug Command Reference - Commands A through D 5
debug clns esis events through debug dbconn tcpdebug clns events

debug clns igrp packetsTo display debugging information on all ISO-IGRP routing activity, use the debugclnsigrppackets privilegedEXEC command. The no form of this command disables debugging output.
debug clns igrp packets
no debug clns igrp packets
Syntax Description This command has no arguments or keywords.
Command History ModificationRelease
This command was introduced.10.0
This command is no longer supported in Cisco IOS Mainline orTechnology-based (T) releases. It may continue to appear in Cisco IOS12.2S-family releases.
12.2(13)T
Examples The following is sample output from thedebugclnsigrppackets command:
Router# debug clns igrp packetsISO-IGRP: Hello sent on Ethernet3 for DOMAIN_green1ISO-IGRP: Received hello from 39.0001.3333.3333.3333.00, (Ethernet3), ht 51ISO-IGRP: Originating level 1 periodic updateISO-IGRP: Advertise dest: 2222.2222.2222ISO-IGRP: Sending update on interface: Ethernet3ISO-IGRP: Originating level 2 periodic updateISO-IGRP: Advertise dest: 0001ISO-IGRP: Sending update on interface: Ethernet3ISO-IGRP: Received update from 3333.3333.3333 (Ethernet3)ISO-IGRP: Opcode: areaISO-IGRP: Received level 2 adv for 0001 metric 1100ISO-IGRP: Opcode: stationISO-IGRP: Received level 1 adv for 3333.3333.3333 metric 1100The following line indicates that the router is sending a hello packet to advertise its existence in theDOMAIN_green1 domain:
ISO-IGRP: Hello sent on Ethernet3 for DOMAIN_green1The following line indicates that the router received a hello packet from a certain network service access point(NSAP) on Ethernet interface 3. The hold time for this information is 51 seconds.
ISO-IGRP: Received hello from 39.0001.3333.3333.3333.00, (Ethernet3), ht 51The following lines indicate that the router is generating a Level 1 update to advertise reachability to destinationNSAP 2222.2222.2222 and that it is sending that update to all systems that can be reached through Ethernetinterface 3:
ISO-IGRP: Originating level 1 periodic updateISO-IGRP: Advertise dest: 2222.2222.2222ISO-IGRP: Sending update on interface: Ethernet3
Cisco IOS Debug Command Reference - Commands A through D6
debug clns esis events through debug dbconn tcpdebug clns igrp packets
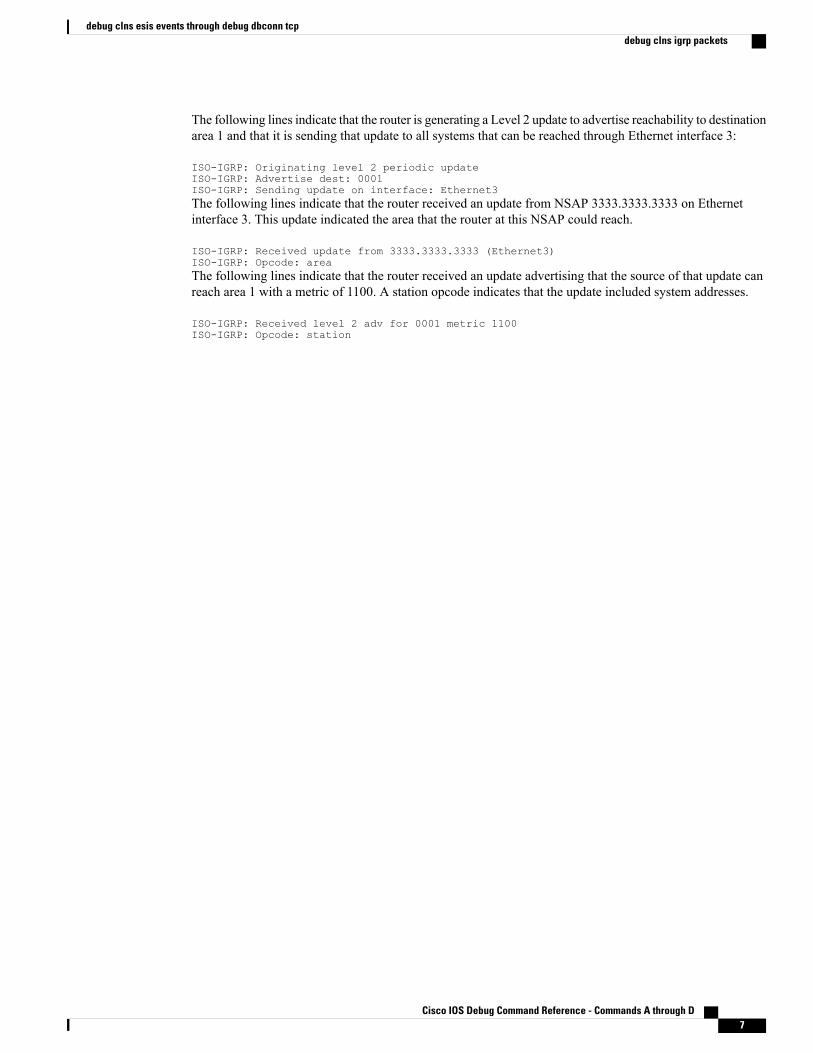
The following lines indicate that the router is generating a Level 2 update to advertise reachability to destinationarea 1 and that it is sending that update to all systems that can be reached through Ethernet interface 3:
ISO-IGRP: Originating level 2 periodic updateISO-IGRP: Advertise dest: 0001ISO-IGRP: Sending update on interface: Ethernet3The following lines indicate that the router received an update from NSAP 3333.3333.3333 on Ethernetinterface 3. This update indicated the area that the router at this NSAP could reach.
ISO-IGRP: Received update from 3333.3333.3333 (Ethernet3)ISO-IGRP: Opcode: areaThe following lines indicate that the router received an update advertising that the source of that update canreach area 1 with a metric of 1100. A station opcode indicates that the update included system addresses.
ISO-IGRP: Received level 2 adv for 0001 metric 1100ISO-IGRP: Opcode: station
Cisco IOS Debug Command Reference - Commands A through D 7
debug clns esis events through debug dbconn tcpdebug clns igrp packets

debug clns packetTo display information about packet receipt and forwarding to the next interface, use the debugclnspacketcommand in privileged EXEC mode. To disable debugging output, use the no form of this command.
debug clns packet
no debug clns packet
Syntax Description This command has no arguments or keywords.
Command Modes Privileged EXEC
Examples The following is sample output from thedebugclnspacket command:
Router# debug clns packetCLNS: Forwarding packet size 157
from 47.0023.0001.0000.0000.0003.0001.1920.3614.3002.00 STUPI-RBSto 47.0005.80ff.ef00.0000.0001.5940.1600.8906.4017.00via 1600.8906.4017 (Ethernet0 0000.0c00.bda8)
CLNS: Echo PDU received on Ethernet0 from47.0005.80ff.ef00.0000.0001.5940.1600.8906.4017.00!CLNS: Sending from 47.0005.80ff.ef00.0000.0001.5940.1600.8906.4023.00 to
47.0005.80ff.ef00.0000.0001.5940.1600.8906.4017.00via 1600.8906.4017 (Ethernet0 0000.0c00.bda8)
In the following lines, the first line indicates that a Connectionless Network Service (CLNS) packet of size157 bytes is being forwarded. The second line indicates the network service access point ( NSAP) and systemname of the source of the packet. The third line indicates the destination NSAP for this packet. The fourthline indicates the next hop system ID, interface, and subnetwork point of attachment (SNPA) of the routerinterface used to forward this packet.
CLNS: Forwarding packet size 157from 47.0023.0001.0000.0000.0003.0001.1920.3614.3002.00 STUPI-RBSto 47.0005.80ff.ef00.0000.0001.5940.1600.8906.4017.00via 1600.8906.4017 (Ethernet0 0000.0c00.bda8)
In the following lines, the first line indicates that the router received an echo protocol data unit (PDU) on thespecified interface from the source NSAP. The second line indicates which source NSAP is used to send aCLNS packet to the destination NSAP, as shown on the third line. The fourth line indicates the next hopsystem ID, interface, and SNPA of the router interface used to forward this packet.
CLNS: Echo PDU received on Ethernet0 from47.0005.80ff.ef00.0000.0001.5940.1600.8906.4017.00!CLNS: Sending from 47.0005.80ff.ef00.0000.0001.5940.1600.8906.4023.00 to47.0005.80ff.ef00.0000.0001.5940.1600.8906.4017.00
via 1600.8906.4017 (Ethernet0 0000.0c00.bda8)
Cisco IOS Debug Command Reference - Commands A through D8
debug clns esis events through debug dbconn tcpdebug clns packet

debug clns routingTo display debugging information for all Connectionless Network Service (CLNS) routing cache updates andactivities involving the CLNS routing table, use the debugclnsrouting command in privileged EXEC mode.To disable debugging output, use the no form of this command.
debug clns routing
no debug clns routing
Syntax Description This command has no arguments or keywords.
Command Modes Privileged EXEC
Examples The following is sample output from the debugclnsrouting command:
Router# debug clns routingCLNS-RT: cache increment:17CLNS-RT: Add 47.0023.0001.0000.0000.0003.0001 to prefix table, next hop 1920.3614.3002CLNS-RT: Aging cache entry for: 47.0023.0001.0000.0000.0003.0001.1920.3614.3002.06CLNS-RT: Deleting cache entry for: 47.0023.0001.0000.0000.0003.0001.1920.3614.3002.06The following line indicates that a change to the routing table has resulted in an addition to the fast-switchingcache:
CLNS-RT: cache increment:17The following line indicates that a specific prefix route was added to the routing table, and indicates the nexthop system ID to that prefix route. In other words, when the router receives a packet with the prefix47.0023.0001.0000.0000.0003.0001 in the destination address of that packet, it forwards that packet to therouter with the MAC address 1920.3614.3002.
CLNS-RT: Add 47.0023.0001.0000.0000.0003.0001 to prefix table, next hop 1920.3614.3002The following lines indicate that the fast-switching cache entry for a certain network service access point(NSAP) has been invalidated and then deleted:
CLNS-RT: Aging cache entry for: 47.0023.0001.0000.0000.0003.0001.1920.3614.3002.06CLNS-RT: Deleting cache entry for: 47.0023.0001.0000.0000.0003.0001.1920.3614.3002.06
Cisco IOS Debug Command Reference - Commands A through D 9
debug clns esis events through debug dbconn tcpdebug clns routing

debug cls messageTo display information about Cisco Link Services (CLS) messages, use the debugclsmessagecommand inprivileged EXEC mode. To disable debugging output, use the no form of this command.
debug cls message
no debug cls message
Syntax Description This command has no arguments or keywords.
Command Modes Privileged EXEC
Usage Guidelines The debugclsmessagecommand displays the primitives (state), selector, header length, and data size.
Examples The following is sample output from thedebugclsmessagecommand. For example, CLS-->DLU indicates thedirection of the flow that is described by the status. From CLS to dependent logical unit (DLU), a request wasestablished to the connection endpoint. The header length is 48 bytes, and the data size is 104 bytes.
Router# debug cls message(FRAS Daemon:CLS-->DLU):
ID_STN.Ind to uSAP: 0x607044C4 sel: LLC hlen: 40, dlen: 54(FRAS Daemon:CLS-->DLU):
ID_STN.Ind to uSAP: 0x6071B054 sel: LLC hlen: 40, dlen: 46(FRAS Daemon:DLU-->SAP):
REQ_OPNSTN.Req to pSAP: 0x608021F4 sel: LLC hlen: 48, dlen: 104(FRAS Daemon:CLS-->DLU):
REQ_OPNSTN.Cfm(NO_REMOTE_STN) to uCEP: 0x607FFE84 sel: LLC hlen: 48, dlen: 104The status possibilities include the following: enabled, disabled, request open station, open station, closestation, activate SA, deactivate service access point (SAP), XID, exchange identification (XID) station, connectstation, signal station, connect, disconnect, connected, data, flow, unnumbered data, modify SAP, test, activatering, deactivate ring, test station, and unnumbered data station.
Related Commands DescriptionCommand
Displays information about FRAS protocol errors.debug fras error
Displays general information about FRASmessages.debug fras message
Displays information about FRAS data-link controlstate changes.
debug fras state
Cisco IOS Debug Command Reference - Commands A through D10
debug clns esis events through debug dbconn tcpdebug cls message

debug cls vdlcTo display information about Cisco Link Services (CLS) Virtual Data Link Control (VDLC), use thedebugclsvdlccommand in privileged EXEC mode. To disable debugging output, use the no form of thiscommand.
debug cls vdlc
no debug cls vdlc
Syntax Description This command has no arguments or keywords.
Command Modes Privileged EXEC
Usage Guidelines The debugclsmessage command displays primitive state transitions, selector, and source and destinationMAC and service access points (SAPs).
Also use the showcls command to display additional information on CLS VDLC.
Use the debugclsvdlc command with caution because it can generate a substantial amount of output.Caution
Examples The following messages are sample output from the debugclsvdlc command. In the following scenario, thesystems network architecture (SNA) service point--also called nativeservicepoint(NSP)--is setting up twoconnections through VDLC and data-link switching (DLSw): one from NSP to VDLC and one from DLSwto VDLC. VDLC joins the two.
The NSP initiates a connection from 4000.05d2.0001 as follows:
VDLC: Req Open Stn Req PSap 0x7ACE00, port 0x79DF984000.05d2.0001(0C)->4000.1060.1000(04)In the next message, VDLC sends a test station request to DLSw for destination address 4000.1060.1000.
VDLC: Send UFrame E3: 4000.05d2.0001(0C)->4000.1060.1000(00)In the next two messages, DLSw replies with test station response, and NSP goes to a half-open state. NSPis waiting for the DLSw connection to VDLC.
VDLC: Sap to Sap TEST_STN_RSP VSap 0x7B68C0 4000.1060.1000(00)->4000.05d2.0001(0C)VDLC: 4000.05d2.0001(0C)->4000.1060.1000(04): VDLC_OPENING->VDLC_HALF_OPENThe NSP sends an exchange identification (XID) and changes state as follows:
VDLC: 4000.05d2.0001(0C)->4000.1060.1000(04): VDLC_HALF_OPEN->VDLC_XID_RSP_PENDINGVDLC: CEP to SAP ID_REQ 4000.05d2.0001(0C)->4000.1060.1000(04) via bridging SAP (DLSw)In the next several messages, DLSw initiates its connection, which matches the half-open connection withNSP:
VDLC: Req Open Stn Req PSap 0x7B68C0, port 0x7992A04000.1060.1000(04)->4000.05d2.0001(0C)
Cisco IOS Debug Command Reference - Commands A through D 11
debug clns esis events through debug dbconn tcpdebug cls vdlc

VDLC: two-way connection establishedVDLC: 4000.1060.1000(04)->4000.05d2.0001(0C): VDLC_IDLE->VDLC_OPENIn the following messages, DLSw sends an XID response, and the NSP connection goes from the state XIDResponse Pending to Open. The XID exchange follows:
VDLC: CEP to CEP ID_RSP 4000.1060.1000(04)->4000.05d2.0001(0C)VDLC: 4000.05d2.0001(0C)->4000.1060.1000(04): VDLC_XID_RSP_PENDING->VDLC_OPENVDLC: 4000.05d2.0001(0C)->4000.1060.1000(04): VDLC_OPEN->VDLC_XID_RSP_PENDINGVDLC: CEP to CEP ID_REQ 4000.05d2.0001(0C)->4000.1060.1000(04)VDLC: CEP to CEP ID_RSP 4000.1060.1000(04)->4000.05d2.0001(0C)VDLC: 4000.05d2.0001(0C)->4000.1060.1000(04): VDLC_XID_RSP_PENDING->VDLC_OPENVDLC: 4000.05d2.0001(0C)->4000.1060.1000(04): VDLC_OPEN->VDLC_XID_RSP_PENDINGVDLC: CEP to CEP ID_REQ 4000.05d2.0001(0C)->4000.1060.1000(04)VDLC: CEP to CEP ID_RSP 4000.1060.1000(04)->4000.05d2.0001(0C)VDLC: 4000.05d2.0001(0C)->4000.1060.1000(04): VDLC_XID_RSP_PENDING->VDLC_OPENVDLC: 4000.05d2.0001(0C)->4000.1060.1000(04): VDLC_OPEN->VDLC_XID_RSP_PENDINGVDLC: CEP to CEP ID_REQ 4000.05d2.0001(0C)->4000.1060.1000(04)VDLC: CEP to CEP ID_RSP 4000.1060.1000(04)->4000.05d2.0001(0C)VDLC: 4000.05d2.0001(0C)->4000.1060.1000(04): VDLC_XID_RSP_PENDING->VDLC_OPENVDLC: 4000.05d2.0001(0C)->4000.1060.1000(04): VDLC_OPEN->VDLC_XID_RSP_PENDINGVDLC: CEP to CEP ID_REQ 4000.05d2.0001(0C)->4000.1060.1000(04)When DLSw is ready to connect, the front-end processor (FEP) sends a set asynchronous balanced modeextended (SABME) command as follows:
VDLC: CEP to CEP CONNECT_REQ 4000.1060.1000(04)->4000.05d2.0001(0C)VDLC: 4000.05d2.0001(0C)->4000.1060.1000(04): VDLC_XID_RSP_PENDING->VDLC_OPENIn the following messages, NSP accepts the connection and sends an unnumbered acknowledgment (UA) tothe FEP:
VDLC: CEP to CEP CONNECT_RSP 4000.05d2.0001(0C)->4000.1060.1000(04)VDLC: FlowReq QUENCH OFF 4000.1060.1000(04)->4000.05d2.0001(0C)The following messages show the data flow:
VDLC: DATA 4000.1060.1000(04)->4000.05d2.0001(0C)VDLC: DATA 4000.05d2.0001(0C)->4000.1060.1000(04)...VDLC: DATA 4000.1060.1000(04)->4000.05d2.0001(0C)VDLC: DATA 4000.05d2.0001(0C)->4000.1060.1000(04)
Related Commands DescriptionCommand
Displays information about CLS messages.debug cls message
Cisco IOS Debug Command Reference - Commands A through D12
debug clns esis events through debug dbconn tcpdebug cls vdlc

debug cme-xmlTo generate debug messages for the Cisco Unified CallManager Express XML application, use thedebugcme-xml command in privileged EXECmode. To disable debugging, use the no form of the command.
debug cme-xml
no debug cme-xml
Syntax Description This command has no keywords or arguments.
Command Modes Privileged EXEC
Command History ModificationCisco IOS Release
This command was introduced.12.4(4)XC
This command was integrated into Cisco IOS Release 12.4(9)T.12.4(9)T
Usage Guidelines The showfb-its-log command displays the contents of the XML event table.
Examples The following example shows the progress of an XML request that has been sent to Cisco Unified CallManagerExpress:
Router# debug cme-xml*Aug 5 06:27:25.727: CME got a raw XML message.*Aug 5 06:27:25.727: doc 0x63DB85E8, doc->doc_type 3, req 0x655FDCD0*Aug 5 06:27:25.727: CME extracted a XML document*Aug 5 06:27:25.727: Response buffer 0x63DCFD58, len = 4096*Aug 5 06:27:25.727: First Tag ID SOAP_HEADER_TAG_ID 58720257*Aug 5 06:27:25.727: First Attribute ID SOAP_ENV_ATTR 50331649*Aug 5 06:27:25.727: cme_xml_process_soap_header*Aug 5 06:27:25.727: cme_xml_process_soap_body*Aug 5 06:27:25.731: cme_xml_process_axl*Aug 5 06:27:25.731: cme_xml_process_request*Aug 5 06:27:25.731: cme_xml_process_ISgetGlobal*Aug 5 06:27:25.731: CME XML sent 811 bytes response.
Related Commands DescriptionCommand
Displays Cisco Unified CallManager Express XMLAPI information.
show fb-its-log
Cisco IOS Debug Command Reference - Commands A through D 13
debug clns esis events through debug dbconn tcpdebug cme-xml

debug cns configTo turn on debugging messages related to the Cisco Networking Services (CNS) configuration agent, use thedebugcnsconfig command in privileged EXEC mode. To disable debugging output, use the no form of thiscommand.
debug cns config {agent| all| connection| notify}
no debug cns config {agent| all| connection| notify}
Syntax Description Displays debugging messages related to the CNSconfiguration agent.
agent
Displays all debugging messages.all
Displays debuggingmessages related to configurationconnections.
connection
Displays debugging messages related to CNSconfigurations.
notify
Command Default No default behavior or values
Command Modes Privileged EXEC (#)
Command History ModificationRelease
This command was introduced.12.2(2)T
This command was integrated into Cisco IOS Release 12.0(18)ST.12.0(18)ST
This command was implemented on the Cisco 2600 and Cisco 3600series.
12.2(8)T
This command was integrated into Cisco IOS Release 12.2(33)SRA.12.2(33)SRA
This command was integrated into Cisco IOS Release 12.2(33)SB.12.2(33)SB
This command was integrated into Cisco IOS Release 12.2(33)SXI.12.2(33)SXI
Usage Guidelines Use this command to turn on or turn off debugging messages related to the CNS Configuration Agent.
Cisco IOS Debug Command Reference - Commands A through D14
debug clns esis events through debug dbconn tcpdebug cns config

Examples In the following example, debugging messages are enabled for CNS configuration processes:
Router# debug cns config all
00:04:09: config_id_get: entered00:04:09: config_id_get: Invoking cns_id_mode_get()00:04:09: config_id_get: cns_id_mode_get() returned INTERNAL00:04:09: config_id_get: successful exit cns_config_id=minna1,cns_config_id_len=600:04:09: cns_establish_connect_intf(): The device is already connected with the configserver00:04:09: cns_initial_config_agent(): connecting with port 8000:04:09: pull_config() entered00:04:09: cns_config_id(): returning config_id=minna100:04:09: Message finished 150 readend00:04:09: %CNS-4-NOTE: SUCCESSFUL_COMPLETION-Process= "CNS Initial Configuration Agent", ipl= 0, pid= 8200:04:10: %SYS-5-CONFIG_I: Configured from console by console
Related Commands DescriptionCommand
Cancels a CNS configuration.cns config cancel
Starts the initial CNS Configuration Agent.cns config initial
Starts the partial CNS Configuration Agent.cns config partial
Gets the configuration of a routing device using CNS.cns config retrieve
Displays information on CNS events.debug cns event
Displays information on CNS management.debug cns exec
Displays information on the CNS XML parser.debug cns xml-parser
Displays information about the CNS ConfigurationAgent.
show cns config
Cisco IOS Debug Command Reference - Commands A through D 15
debug clns esis events through debug dbconn tcpdebug cns config
debug cns eventsTo turn on debugging messages related to the Cisco Networking Services (CNS) Event Gateway, use thedebugcnsevent command in privileged EXEC mode. To disable debugging output, use the no form of thiscommand.
debug cns event {agent| all| connection| subscriber}
no debug cns event {agent| all| connection| subscriber}
Syntax Description Displays debugging messages related to the event agent.agent
Displays all debugging messages.all
Displays debugging messages related to event connections.connection
Displays debugging messages related to subscribers.subscriber
Command Default No default behavior or values
Command Modes Privileged EXEC
Command History ModificationRelease
This command was introduced.12.2(2)T
This command was integrated into the Cisco IOS Release 12.0(18)ST.12.0(18)ST
This command was implemented on Cisco 2600 series and Cisco 3600series routers.
12.2(8)T
This command was integrated into Cisco IOS Release 12.2(31)SB2.12.2(31)SB2
Usage Guidelines Use this command to turn on or turn off debugging messages related to the CNS Event Gateway.
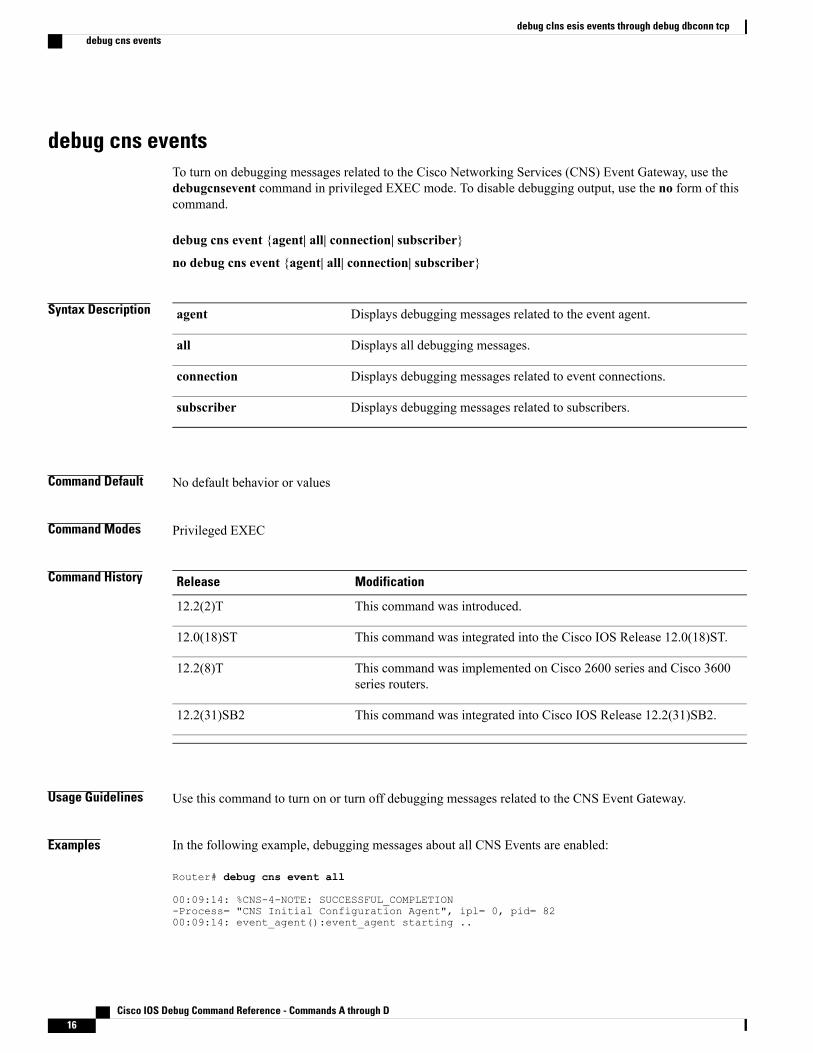
Examples In the following example, debugging messages about all CNS Events are enabled:
Router# debug cns event all
00:09:14: %CNS-4-NOTE: SUCCESSFUL_COMPLETION-Process= "CNS Initial Configuration Agent", ipl= 0, pid= 8200:09:14: event_agent():event_agent starting ..
Cisco IOS Debug Command Reference - Commands A through D16
debug clns esis events through debug dbconn tcpdebug cns events

00:09:14: event_agent_open_connection(): attempting socket connect to Primary Gateway00:09:14: event_agent_open_connection():cns_socket_connect() succeeded:return_code=000:09:14: event_agent_open_connection():timeout_len=1:ka_total_timeout =0:
total_timeout=000:09:14: event_id_get: entered00:09:14: event_id_get: Invoking cns_id_mode_get()00:09:14: event_id_get: cns_id_mode_get() returned INTERNAL00:09:14: event_id_get: successful exit cns_event_id=test1, cns_event_id_len=500:09:14: ea_devid_send(): devid sent DUMP OF DEVID MSG82C920A0: 00120000 00010774 .......t82C920B0: 65737431 00000402 020000 est1.......00:09:14: event_agent_get_input(): cli timeout=0: socket:0x000:09:14: process_all_event_agent_event_items():process_get_wakeup(&major, &minor)=TRUE:major=0...00:09:14: add_subjectANDhandle_to_subject_table():p_subject_entry=0x82E3EEDC:p_subject_entry_list=0x82619CD800:09:14: add_subjectANDhandle_to_subject_table():add 'user_entry' entry succeeded:user entry =0x82C92AF4:queue_handle=0x82C913FC00:09:14: %SYS-5-CONFIG_I: Configured from console by console
Related Commands DescriptionCommand
Configures the CNS Event Gateway.cns event
Displays information about the CNS Event Agent.show cns event
Cisco IOS Debug Command Reference - Commands A through D 17
debug clns esis events through debug dbconn tcpdebug cns events

debug cns execTo display debugging messages about Cisco Networking Services (CNS) exec agent services, use thedebugcnsexec command in privileged EXEC mode. To disable debugging output, use the no or undebugform of this command.
debug cns exec {agent| all| decode| messages}
no debug cns exec {agent| all| decode| messages}
undebug cns exec {agent| all| decode| messages}
Syntax Description Displays debugging messages related to the execagent.
agent
Displays all debugging messages.all
Displays debugging messages related to image agentconnections.
decode
Displays debugging output related to messagesgenerated by exec agent services.
messages
Command Default Debugging output is disabled.
Command Modes Privileged EXEC (#)
Command History ModificationRelease
This command was introduced.12.3(1)
This command was integrated into Cisco IOS Release 12.2(25)S.12.2(25)S
This command was integrated into Cisco IOS Release 12.2(33)SRA.12.2(33)SRA
This command was integrated into Cisco IOS Release 12.2(33)SB.12.2(33)SB
This command was integrated into Cisco IOS Release 12.2(33)SXI.12.2(33)SXI
Usage Guidelines Use the debug cns exec command to troubleshoot CNS exec agent services.
Cisco IOS Debug Command Reference - Commands A through D18
debug clns esis events through debug dbconn tcpdebug cns exec

Examples The following example shows a debugging message for the CNS exec agent when a response has been postedto HTTP:
Router# debug cns exec agent
4d20h: CNS exec agent: response posted
Related Commands DescriptionCommand
Configures CNS Exec Agent services.cns exec
Cisco IOS Debug Command Reference - Commands A through D 19
debug clns esis events through debug dbconn tcpdebug cns exec

debug cns imageTo display debugging messages about Cisco Networking Services (CNS) image agent services, use the debugcns image command in privileged EXECmode. To disable debugging output, use the no form of this command.
debug cns image {agent| all| connection| error}
no debug cns image {agent| all| connection| error}
Syntax Description Displays debugging messages related to the imageagent.
agent
Displays all debugging messages.all
Displays debugging messages related to image agentconnections.
connection
Displays debugging messages related to errorsgenerated by image agent services.
error
Command Default If no keyword is specified, all debugging messages are displayed.
Command Modes Privileged EXEC (#)
Command History ModificationRelease
This command was introduced.12.3(1)
This command was integrated into Cisco IOS Release 12.2(31)SB2.12.2(31)SB2
This command was integrated into Cisco IOS Release 12.2(33)SRB.12.2(33)SRB
This command was integrated into Cisco IOS Release 12.2(33)SB.12.2(33)SB
This command was integrated into Cisco IOS Release 12.2(33)SXI.12.2(33)SXI
Usage Guidelines Use the debug cns image command to troubleshoot CNS image agent services.
Cisco IOS Debug Command Reference - Commands A through D20
debug clns esis events through debug dbconn tcpdebug cns image

debug cns managementTo display information about Cisco Networking Services (CNS)management, use the debug cnsmanagementcommand in privileged EXEC mode. To disable debugging output, use the no form of this command.
debug cns management {snmp| xml}
no debug cns management {snmp| xml}
Syntax Description Displays debugging messages related to nongranularSimple Network Management Protocol (SNMP)encapsulated CNS-management events.
snmp
Displays debugging messages related to granulareXtensible Markup Language (XML) encapsulatedCNS-management events.
xml
Command Modes Privileged EXEC
Command History ModificationRelease
This command was introduced.12.2(8)T
Examples In the following example, debugging messages about SNMP- and XML-encapsulated CNS-managementevents are enabled:
Router# debug cns management snmpRouter# debug cns management xmlRouter# show debugging
CNS Management (SNMP Encapsulation) debugging is onCNS Management (Encap XML) debugging is onRouter# show running-config | include cns
cns mib-access encapsulation snmpcns mib-access encapsulation xmlcns notifications encapsulation snmpcns notifications encapsulation xmlcns event 10.1.1.1 11011Router#00:12:50: Enqueued a notification in notif_q00:12:50: ea_produce succeeded Subject:cisco.cns.mibaccess:notification Message Length:385
00:12:50: Trap sent via CNS Transport Mapping.Router#00:13:31: Response sent via CNS Transport Mapping.Router#00:14:38: Received a request00:14:38: ea_produce succeeded Subject:cisco.cns.mibaccess:response Message Length:241
Cisco IOS Debug Command Reference - Commands A through D 21
debug clns esis events through debug dbconn tcpdebug cns management

Related Commands DescriptionCommand
Configures the CNS event gateway, which providesCNS event services to Cisco IOS clients.
cns event
Displays information on CNS configurations.debug cns config
Displays information on the CNS XML parser.debug cns xml-parser
Displays information about the types of debuggingthat are enabled for your router.
show debugging
Displays the current running configuration.show running-config
Cisco IOS Debug Command Reference - Commands A through D22
debug clns esis events through debug dbconn tcpdebug cns management

debug cns xmlTo turn on debugging messages related to the Cisco Networking Services (CNS) eXtensibleMarkup Language(XML) parser, use the debugcnsxml command in privileged EXEC mode. To disable debugging output, usethe no form of this command.
debug cns xml {all| decode| dom| parser}
no debug cns xml {all| decode| dom| parser}
Syntax Description Displays all CNS debugging.all
Reports usage of common XML decoding libraryfunctions by applications and reports the decodedcontents.
decode
Displays failures in the Document Object Model(DOM) infrastructuremessages tree built by the XMLparser.
dom
Displays failures and progress of the parsing of anXML message by the XML parser.
parser
Command Modes Privileged EXEC
Command History ModificationRelease
This command was introduced. This command replaces thedebugcnsxml-parser command.
12.3(2)T
This command was integrated into Cisco IOS Release 12.2(33)SRA.12.2(33)SRA
This command is supported in the Cisco IOS Release 12.2SX train. Supportin a specific 12.2SX release of this train depends on your feature set, platform,and platform hardware.
12.2SX
This command was integrated into Cisco IOS Release 12.2(33)SB.12.2(33)SB
This command was integrated into Cisco IOS Release 12.2(33)SXI.12.2(33)SXI
Examples In the following example, debugging messages for the CNS XML parser are enabled:
Router# debug cns xml parser
Cisco IOS Debug Command Reference - Commands A through D 23
debug clns esis events through debug dbconn tcpdebug cns xml

00:12:05: Registering tag <config-server>00:12:05: Registering tag <server-info>00:12:05: Registering tag <ip-address>00:12:05: Registering tag <web-page>00:12:05: Registering tag <config-event>00:12:05: Registering tag <identifier>00:12:05: Registering tag <config-id>00:12:05: Registering tag <config-data>00:12:05: Registering tag <cli>00:12:05: Registering tag <error-info>00:12:05: Registering tag <error-message>00:12:05: Registering tag <line-number>00:12:05: Registering tag <config-write>00:12:05: Registering tag <exec-cmd-event>00:12:05: Registering tag <identifier-exec>00:12:05: Registering tag <event-response>00:12:05: Registering tag <reply-subject>00:12:05: Registering tag <server-response>00:12:05: Registering tag <ip-address-exec>00:12:05: Registering tag <port-number>00:12:05: Registering tag <url>00:12:05: Registering tag <cli-exec>00:12:05: Registering tag <config-pwd>00:12:06: Pushing tag <config-data> on to stack00:12:06: open tag is <config-data>00:12:06: Pushing tag <config-id> on to stack00:12:06: open tag is <config-id>00:12:06: Popping tag <config-id> off stack00:12:06: close tag is </config-id>00:12:06: Pushing tag <cli> on to stack00:12:06: open tag is <cli>00:12:06: Popping tag <cli> off stack00:12:06: close tag is </cli>00:12:06: Popping tag <config-data> off stack00:12:06: close tag is </config-data>00:12:06: %CNS-4-NOTE: SUCCESSFUL_COMPLETION-Process= "CNS Initial Configuration Agent", ipl= 0, pid= 96
Related Commands DescriptionCommand
Configures the CNS Event Gateway.cns event
Displays information about the CNS Event Agent.show cns event
Cisco IOS Debug Command Reference - Commands A through D24
debug clns esis events through debug dbconn tcpdebug cns xml

debug cns xml-parser
Effective with Cisco IOS Release 12.3(2)T, the debug cns xml-parser command is replaced by the debugcns xml command. See the debug cns xml command for more information.
Note
To turn on debugging messages related to the Cisco Networking Services (CNS) eXtensibleMarkup Language(XML) parser, use the debug cns xml-parser command in privileged EXEC mode. To disable debuggingoutput, use the no form of this command.
debug cns xml-parser
no debug cns xml-parser
Syntax Description This command has no arguments or keywords.
Command Modes Privileged EXEC
Command History ModificationRelease
This command was introduced.12.2(2)T
This command was integrated into Cisco IOS Release 12.0(18)ST.12.0(18)ST
This command was implemented on the Cisco 2600 and Cisco 3600series.
12.2(8)T
This command was replaced by the debug cns xml command.12.3(2)T
Examples In the following example, debugging messages for the CNS XML parser are enabled:
Router# debug cns xml-parser
00:12:05: Registering tag <config-server>00:12:05: Registering tag <server-info>00:12:05: Registering tag <ip-address>00:12:05: Registering tag <web-page>00:12:05: Registering tag <config-event>00:12:05: Registering tag <identifier>00:12:05: Registering tag <config-id>00:12:05: Registering tag <config-data>00:12:05: Registering tag <cli>00:12:05: Registering tag <error-info>00:12:05: Registering tag <error-message>00:12:05: Registering tag <line-number>00:12:05: Registering tag <config-write>00:12:05: Registering tag <exec-cmd-event>00:12:05: Registering tag <identifier-exec>00:12:05: Registering tag <event-response>
Cisco IOS Debug Command Reference - Commands A through D 25
debug clns esis events through debug dbconn tcpdebug cns xml-parser
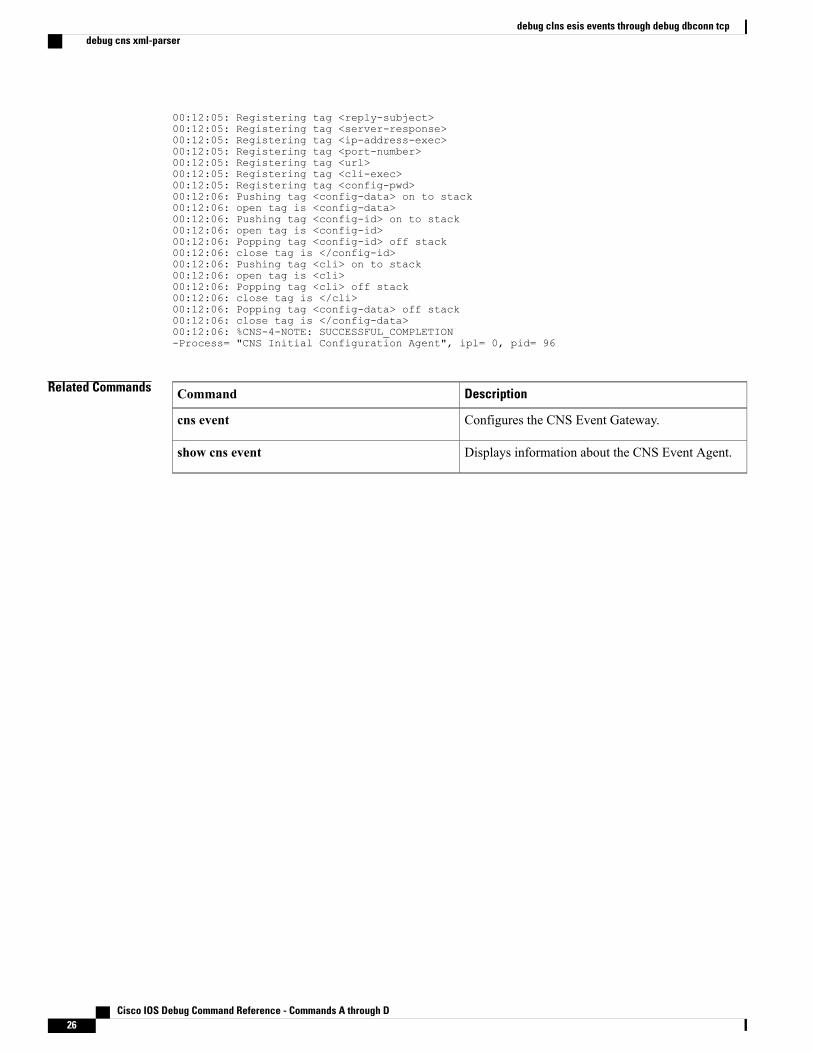
00:12:05: Registering tag <reply-subject>00:12:05: Registering tag <server-response>00:12:05: Registering tag <ip-address-exec>00:12:05: Registering tag <port-number>00:12:05: Registering tag <url>00:12:05: Registering tag <cli-exec>00:12:05: Registering tag <config-pwd>00:12:06: Pushing tag <config-data> on to stack00:12:06: open tag is <config-data>00:12:06: Pushing tag <config-id> on to stack00:12:06: open tag is <config-id>00:12:06: Popping tag <config-id> off stack00:12:06: close tag is </config-id>00:12:06: Pushing tag <cli> on to stack00:12:06: open tag is <cli>00:12:06: Popping tag <cli> off stack00:12:06: close tag is </cli>00:12:06: Popping tag <config-data> off stack00:12:06: close tag is </config-data>00:12:06: %CNS-4-NOTE: SUCCESSFUL_COMPLETION-Process= "CNS Initial Configuration Agent", ipl= 0, pid= 96
Related Commands DescriptionCommand
Configures the CNS Event Gateway.cns event
Displays information about the CNS Event Agent.show cns event
Cisco IOS Debug Command Reference - Commands A through D26
debug clns esis events through debug dbconn tcpdebug cns xml-parser
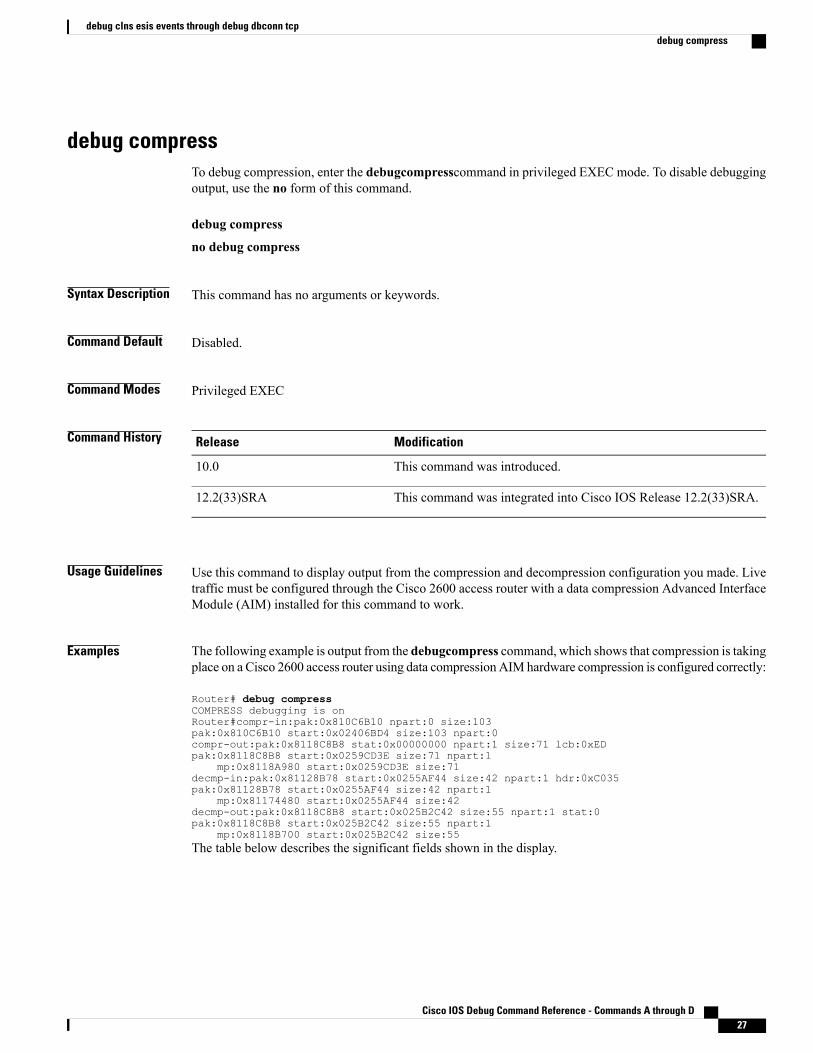
debug compressTo debug compression, enter the debugcompresscommand in privileged EXEC mode. To disable debuggingoutput, use the no form of this command.
debug compress
no debug compress
Syntax Description This command has no arguments or keywords.
Command Default Disabled.
Command Modes Privileged EXEC
Command History ModificationRelease
This command was introduced.10.0
This command was integrated into Cisco IOS Release 12.2(33)SRA.12.2(33)SRA
Usage Guidelines Use this command to display output from the compression and decompression configuration you made. Livetraffic must be configured through the Cisco 2600 access router with a data compression Advanced InterfaceModule (AIM) installed for this command to work.
Examples The following example is output from the debugcompress command, which shows that compression is takingplace on a Cisco 2600 access router using data compression AIM hardware compression is configured correctly:
Router# debug compressCOMPRESS debugging is onRouter#compr-in:pak:0x810C6B10 npart:0 size:103pak:0x810C6B10 start:0x02406BD4 size:103 npart:0compr-out:pak:0x8118C8B8 stat:0x00000000 npart:1 size:71 lcb:0xEDpak:0x8118C8B8 start:0x0259CD3E size:71 npart:1
mp:0x8118A980 start:0x0259CD3E size:71decmp-in:pak:0x81128B78 start:0x0255AF44 size:42 npart:1 hdr:0xC035pak:0x81128B78 start:0x0255AF44 size:42 npart:1
mp:0x81174480 start:0x0255AF44 size:42decmp-out:pak:0x8118C8B8 start:0x025B2C42 size:55 npart:1 stat:0pak:0x8118C8B8 start:0x025B2C42 size:55 npart:1
mp:0x8118B700 start:0x025B2C42 size:55The table below describes the significant fields shown in the display.
Cisco IOS Debug Command Reference - Commands A through D 27
debug clns esis events through debug dbconn tcpdebug compress

Table 1: debug compress Field Descriptions
DescriptionField
Indicates that a packet needs to be compressed.compr-in
Indicates completion of compression of packet.compr-out
Indicates receipt of a compressed packet that needsto be decompressed.
decmp-in
Indicates completion of decompression of a packet.decmp-out
Provides the address in memory of a softwarestructure that describes the compressed packet.
pak:0x810C6B10
The "npart:0" indicates that the packet is containedin a single, contiguous area of memory. The startaddress of the packet is 0x02406bd4 and the size ofthe packet is 103.
start:0x02406BD4 size:103 npart:0
The "npart:1" indicates that the packet is containedin 1 or more regions of memory. The start address ofthe packet is 0x0259CD3E and the size of the packetis 71.
start:0x0259CD3E size:71 npart:1
Describes one of these regions of memory.mp:0x8118A980 start:0x0259CD3e size:71
Provides the address of a structure describing thisregion.
mp:0x8118A980
Provides the address of the start of this region.start 0x0259CD3E
Related Commands DescriptionCommand
Displays debugging information about the packetsthat are received on a Frame Relay interface.
debug frame-relay
Displays information on traffic and exchanges in aninternetwork implementing the PPP.
debug ppp
Displays compression statistics.show compress
Displays hardware information including DRAM,SRAM, and the revision-level information on the linecard.
show diag
Cisco IOS Debug Command Reference - Commands A through D28
debug clns esis events through debug dbconn tcpdebug compress

debug conditionTo filter debugging output for certain debug commands on the basis of specified conditions, use thedebugcondition command in privileged EXEC mode. To remove the specified condition, use the no form of thiscommand.
debug condition {called dial-string| caller dial-string| calling tidimsi string| domain domain-name| fexfabric-extender-number module module-number| interface interface-id| ip ip-address| mac-addresshexadecimal-MAC-address| module module-number| portbundle ip ip-address bundle bundle-number|session-id session-number| switch switch-numbermodule module-number| username username| vcid vc-id|vlan vlan-id}
no debug condition {condition-id| all}
Syntax Description Filters output on the basis of the called party number.called dial-string
Filters output on the basis of the calling party number.caller dial-string
Filters debug messages for general packet radioservice (GPRS) tunneling protocol (GTP) processingon the gateway GPRS support node (GGSN) basedon the tunnel identifier (TID) or international mobilesystem identifier (IMSI) in a Packet Data Protocol(PDP) Context Create Request message.
calling tidi/imsi-string
Filters output on the basis of the specified domain.domain domain-name
Filters output on the basis of the specified fabricextender and specified module.
fex fabric-extender-number modulemodule-number
Filters output on the basis of the specified interfaceID.
interface interface-id
Filters output on the basis of the specified IP address.ip ip-address
Filters messages on the specified MAC address.mac-address hexadecimal-mac-address
Filters output on the basis of the specified modulenumber.
module module-number
Filters output on the basis of the port-bundle host key(PBHK) that uniquely identifies the session.
portbundle ip ip-address
Specifies the port bundle.bundle bundle-number
Filters output on the specified Intelligent ServiceArchitecture (ISA) session identifier.
session-id session-number
Cisco IOS Debug Command Reference - Commands A through D 29
debug clns esis events through debug dbconn tcpdebug condition
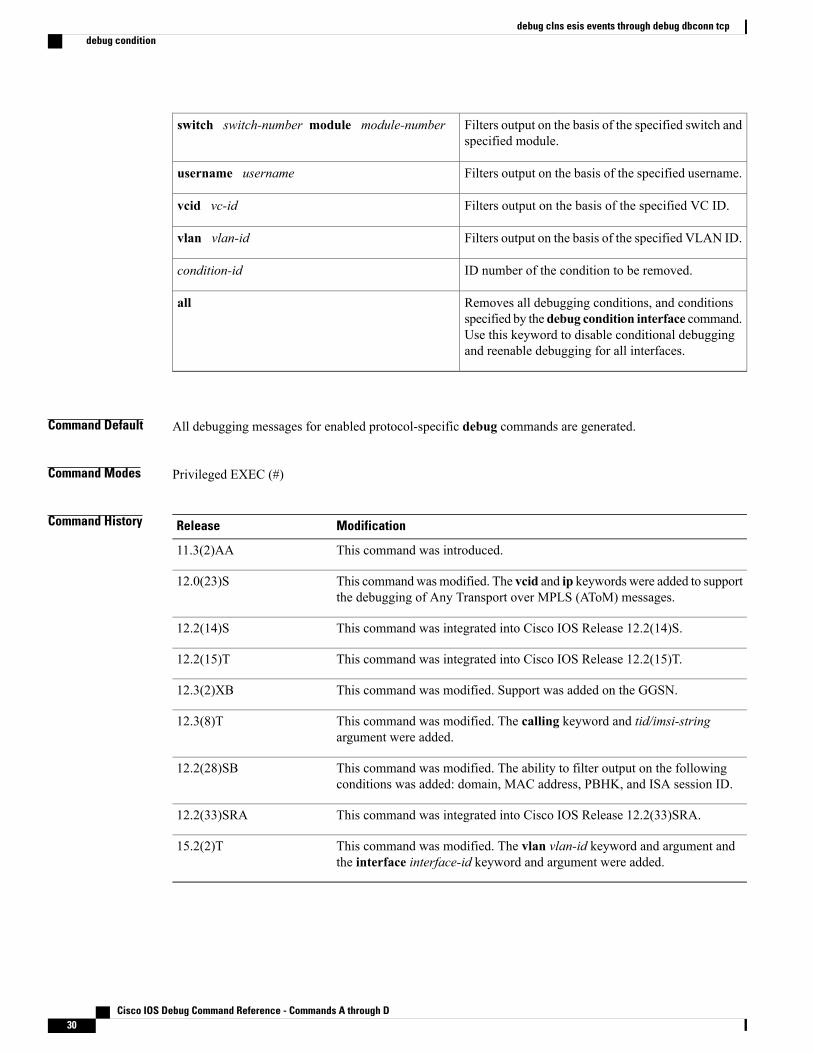
Filters output on the basis of the specified switch andspecified module.
switch switch-number module module-number
Filters output on the basis of the specified username.username username
Filters output on the basis of the specified VC ID.vcid vc-id
Filters output on the basis of the specified VLAN ID.vlan vlan-id
ID number of the condition to be removed.condition-id
Removes all debugging conditions, and conditionsspecified by the debug condition interface command.Use this keyword to disable conditional debuggingand reenable debugging for all interfaces.
all
Command Default All debugging messages for enabled protocol-specific debug commands are generated.
Command Modes Privileged EXEC (#)
Command History ModificationRelease
This command was introduced.11.3(2)AA
This commandwasmodified. The vcid and ip keywords were added to supportthe debugging of Any Transport over MPLS (AToM) messages.
12.0(23)S
This command was integrated into Cisco IOS Release 12.2(14)S.12.2(14)S
This command was integrated into Cisco IOS Release 12.2(15)T.12.2(15)T
This command was modified. Support was added on the GGSN.12.3(2)XB
This command was modified. The calling keyword and tid/imsi-stringargument were added.
12.3(8)T
This command was modified. The ability to filter output on the followingconditions was added: domain, MAC address, PBHK, and ISA session ID.
12.2(28)SB
This command was integrated into Cisco IOS Release 12.2(33)SRA.12.2(33)SRA
This command was modified. The vlan vlan-id keyword and argument andthe interface interface-id keyword and argument were added.
15.2(2)T
Cisco IOS Debug Command Reference - Commands A through D30
debug clns esis events through debug dbconn tcpdebug condition

Usage Guidelines Use the debug condition command to restrict the debug output for some commands. If any debug conditioncommands are enabled, output is generated only for interfaces associated with the specified keyword. Inaddition, this command enables debugging output for conditional debugging events. Messages are displayedas different interfaces meet specific conditions.
If multiple debug condition commands are enabled, output is displayed if at least one condition matches. Allthe conditions do not need to match.
The no form of this command removes the debug condition specified by the condition identifier. The conditionidentifier is displayed after you use a debug condition command or in the output of the show debug conditioncommand. If the last condition is removed, debugging output resumes for all interfaces. You will be askedfor confirmation before removing the last condition or all conditions.
Not all debugging output is affected by the debug condition command. Some commands generate outputwhenever they are enabled, regardless of whether they meet any conditions.
The following components are supported for Intelligent Service Architecture (ISA) distributed conditionaldebugging:
• Authentication, authorization, and accounting (AAA) and RADIUS
• ATM components
• Feature Manager
• Policy Manager
• PPP
• PPP over Ethernet (PPPoE)
• Session Manager
• Virtual Private Dialup Network (VPDN)
Ensure that you enable TID/IMSI-based conditional debugging by entering debug condition calling beforeconfiguring debug gprs gtp and debug gprs charging. In addition, ensure that you disable the debug gprsgtp and debug gprs charging commands using the no debug all command before disabling conditionaldebugging using the no debug condition command. This will prevent a flood of debugging messages whenyou disable conditional debugging.
Examples
Examples In the following example, the router displays debugging messages only for interfaces that use a username ofuser1. The condition identifier displayed after the command is entered identifies this particular condition.
Router# debug condition username user1Condition 1 set
Examples The following example specifies that the router should display debugging messages only for VC 1000:
Router# debug condition vcid 1000Condition 1 set01:12:32: 1000 Debug: Condition 1, vcid 1000 triggered, count 101:12:32: 1000 Debug: Condition 1, vcid 1000 triggered, count 1
Cisco IOS Debug Command Reference - Commands A through D 31
debug clns esis events through debug dbconn tcpdebug condition

The following example enables other debugging commands. These debugging commands will only displayinformation for VC 1000.
Router# debug mpls l2transport vc event
AToM vc event debugging is on
Router# debug mpls l2transport vc fsm
AToM vc fsm debugging is onThe following commands shut down the interface on which VC 1000 is established:
Router(config)# interface serial3/1/0Router(config-if)# shutThe debugging output shows the change to the interface where VC 1000 is established:
01:15:59: AToM MGR [13.13.13.13, 1000]: Event local down, state changed from establishedto remote ready01:15:59: AToM MGR [13.13.13.13, 1000]: Local end down, vc is down01:15:59: AToM SMGR [13.13.13.13, 1000]: Processing imposition update, vc_handle 6227BCF0,update_action 0, remote_vc_label 1801:15:59: AToM SMGR [13.13.13.13, 1000]: Imposition Disabled01:15:59: AToM SMGR [13.13.13.13, 1000]: Processing disposition update, vc_handle 6227BCF0,update_action 0, local_vc_label 75501:16:01:%LINK-5-CHANGED: Interface Serial3/1/0, changed state to administratively down01:16:02:%LINEPROTO-5-UPDOWN: Line protocol on Interface Serial3/1/0, changed state to down
Related Commands DescriptionCommand
Limits output for some debugging commands basedon the interfaces.
debug condition interface
Cisco IOS Debug Command Reference - Commands A through D32
debug clns esis events through debug dbconn tcpdebug condition
debug condition application voiceTo display debugging messages for only the specified VoiceXML application, use thedebugconditionapplicationvoicecommand in privileged EXEC mode. To disable debugging output, use theno form of this command.
debug condition application voice application-name
no debug condition application voice application-name
Syntax Description Name of the VoiceXML application for which youwant to display all enabled debugging messages.
application-name
Command Default If this command is not configured, debugging messages are enabled for all VoiceXML applications.
Command Modes Privileged EXEC
Command History ModificationRelease
This command was introduced for the Cisco 3640, Cisco 3660, CiscoAS5300, Cisco AS5350, and Cisco AS5400.
12.2(11)T
Usage Guidelines• This command filters debugging output only for the debugvxmland debughttpclient commands, exceptthat it does not filter output for the debugvxmlerror, debugvxmlbackground, debughttpclienterror,or debughttpclientbackground commands. It does not filter messages for any other debug commandssuch as the debugvoipivr command or the debugvoiceivr command.
• This command filters debugging output for all VoiceXML applications except the application named inthe command. When this command is configured, the gateway displays debugging messages only forthe specified VoiceXML application.
• To filter debugging output with this command, the <cisco-debug> element must be enabled in theVoiceXML document. For more information about the <cisco-debug> element, refer to the CiscoVoiceXML Programmer’s Guide.
• To see debugging output for VoiceXML applications, you must first configure global debug commandssuch as the debugvxmlcommand or the debughttpclientcommand. If no global debug commands areturned on, you do not see debugging messages even if the debugconditionapplicationvoice commandis configured and the <cisco-debug> element is enabled in the VoiceXML document.
• This command can be configured multiple times to display output for more than one application.
• To see which debug conditions have been set, use the showdebugcondition command.
Cisco IOS Debug Command Reference - Commands A through D 33
debug clns esis events through debug dbconn tcpdebug condition application voice

Examples The following example disables debugging output for all applications except the myapp1 application, if the<cisco-debug> element is enabled in the VoiceXML documents that are executed by myapp1:
Router# debug condition application voice myapp1
Related Commands DescriptionCommand
Displays debugging messages for the HTTP client.debug http client
Displays debugging messages for VoiceXMLfeatures.
debug vxml
Displays the debugging conditions that have beenenabled for VoiceXML application.
show debug condition
Cisco IOS Debug Command Reference - Commands A through D34
debug clns esis events through debug dbconn tcpdebug condition application voice

debug condition glbpTo display debugging messages about Gateway Load Balancing Protocol (GLBP) conditions, use thedebugconditionglbp command in privileged EXEC mode. To disable debugging output, use the no form ofthis command.
debug condition glbp interface-type interface-number group [ forwarder ]
no debug condition glbp interface-type interface-number group [ forwarder ]
Syntax Description Interface type for which output is displayed.interface-type
Interface number for which output is displayed.interface-number
GLBP group number in the range from 0 to 1023.group
(Optional) Number in the range from 1 to 255 usedto identify a virtual MAC address.
forwarder
Command Modes Privileged EXEC
Command History ModificationRelease
This command was introduced.12.2(14)S
This command was integrated into Cisco IOS Release 12.2(15)T.12.2(15)T
This command was integrated into Cisco IOS Release 12.2(17b)SXA.12.2(17b)SXA
This command was integrated into Cisco IOS Release 12.2(33)SRA.12.2(33)SRA
Examples The following is sample output from the debugconditionglbpcommand:
Router# debug condition glbp fastethernet 0/0 10 1Condition 1 set5d23h: Fa0/0 GLBP10.1 Debug: Condition 1, glbp Fa0/0 GLBP10.1 triggered, count 1
Related Commands DescriptionCommand
Displays debugging messages about GLBP errors.debug glbp errors
Displays debugging messages about GLBP events.debug glbp events
Cisco IOS Debug Command Reference - Commands A through D 35
debug clns esis events through debug dbconn tcpdebug condition glbp
DescriptionCommand
Displays debugging messages about GLBP packets.debug glbp packets
Displays a limited range of debuggingmessages aboutGLBP errors, events, and packets.
debug glbp terse
Cisco IOS Debug Command Reference - Commands A through D36
debug clns esis events through debug dbconn tcpdebug condition glbp
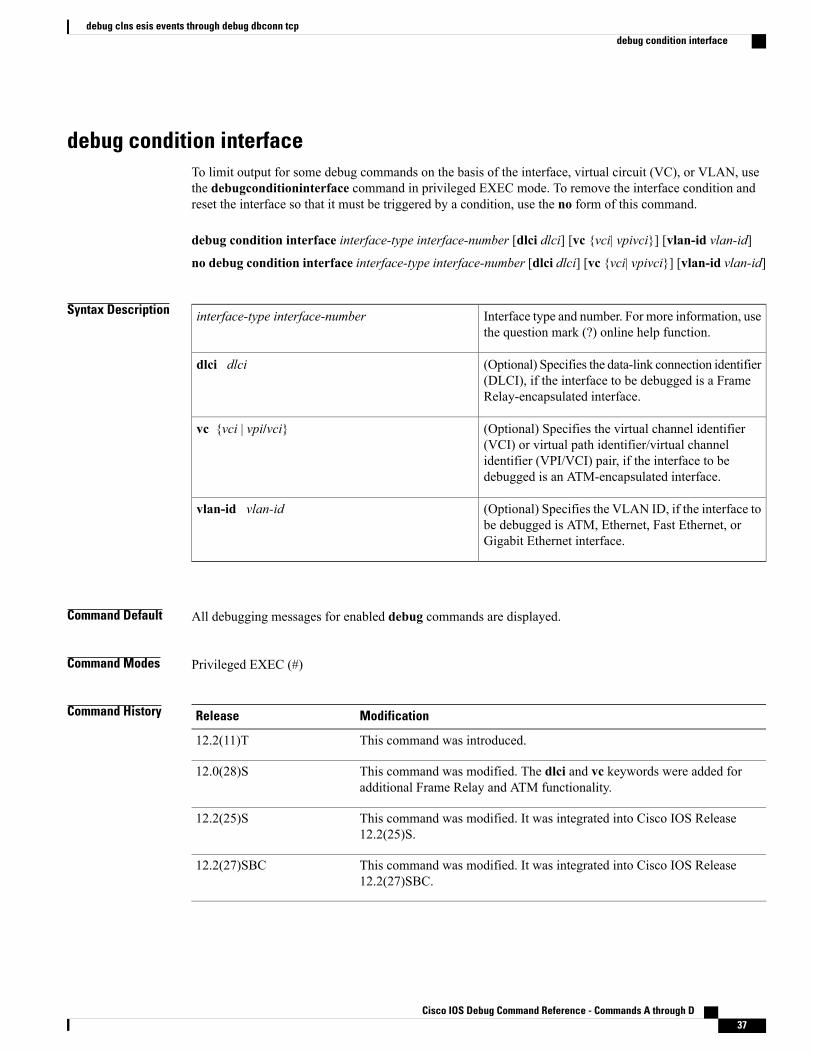
debug condition interfaceTo limit output for some debug commands on the basis of the interface, virtual circuit (VC), or VLAN, usethe debugconditioninterface command in privileged EXEC mode. To remove the interface condition andreset the interface so that it must be triggered by a condition, use the no form of this command.
debug condition interface interface-type interface-number [dlci dlci] [vc {vci| vpivci}] [vlan-id vlan-id]
no debug condition interface interface-type interface-number [dlci dlci] [vc {vci| vpivci}] [vlan-id vlan-id]
Syntax Description Interface type and number. For more information, usethe question mark (?) online help function.
interface-type interface-number
(Optional) Specifies the data-link connection identifier(DLCI), if the interface to be debugged is a FrameRelay-encapsulated interface.
dlci dlci
(Optional) Specifies the virtual channel identifier(VCI) or virtual path identifier/virtual channelidentifier (VPI/VCI) pair, if the interface to bedebugged is an ATM-encapsulated interface.
vc {vci | vpi/vci}
(Optional) Specifies the VLAN ID, if the interface tobe debugged is ATM, Ethernet, Fast Ethernet, orGigabit Ethernet interface.
vlan-id vlan-id
Command Default All debugging messages for enabled debug commands are displayed.
Command Modes Privileged EXEC (#)
Command History ModificationRelease
This command was introduced.12.2(11)T
This command was modified. The dlci and vc keywords were added foradditional Frame Relay and ATM functionality.
12.0(28)S
This command was modified. It was integrated into Cisco IOS Release12.2(25)S.
12.2(25)S
This command was modified. It was integrated into Cisco IOS Release12.2(27)SBC.
12.2(27)SBC
Cisco IOS Debug Command Reference - Commands A through D 37
debug clns esis events through debug dbconn tcpdebug condition interface

ModificationRelease
This command was modified. It was integrated into Cisco IOS Release12.2(28)SB, and the ability to filter debug output on the basis of VLAN IDwas added.
12.2(28)SB
This command was modified. It was integrated into Cisco IOS Release12.4(9)T.
12.4(9)T
This command was modified. It was integrated into Cisco IOS Release12.2(33)SRE.
12.2(33)SRE
This command was modified. It was integrated into Cisco IOS XE Release2.5.
Cisco IOS XE 2.5
Usage Guidelines Use this command to restrict the debugging output for some commands on the basis of an interface or virtualcircuit. When you enter this command, debugging output is disbaled for all interfaces except the specifiedinterface or virtual circuit. In addition, this command enables conditional debugging to limit output for specificdebugging events. Messages are displayed as different interfaces meet specific conditions.
The no form of this command performs the following functions:
• Disables the debugconditioninterface command for the specified interface. Output is no longer generatedfor the interface, assuming that the interface meets no other applicable conditions. If the interface meetsother conditions that have been set by another debugcondition command, debugging output will stillbe generated for the interface.
• If some other debugcondition command has been enabled, output is stopped for that interface until thecondition is met on the interface. You will be asked for confirmation before the last condition or allconditions are removed.
Not all debugging output is affected by the debugcondition command. Some commands generate outputwhenever they are enabled, regardless of whether they meet any conditions. The commands that are affectedby the debugcondition commands are generally related to dial access functions, where a large amount ofoutput is expected. Output from the following commands is controlled by the debugconditioncommand:
• debug aaa
• debug atm
• debug dialer events
• debug frame-relay
• debug isdn
• debug modem
• debug ppp
One or more ATM-encapsulated interfacesmust be enabled, and one or more of the following debug commandsmust be enabled to use conditional debugging with ATM:
• debug atm arp
Cisco IOS Debug Command Reference - Commands A through D38
debug clns esis events through debug dbconn tcpdebug condition interface
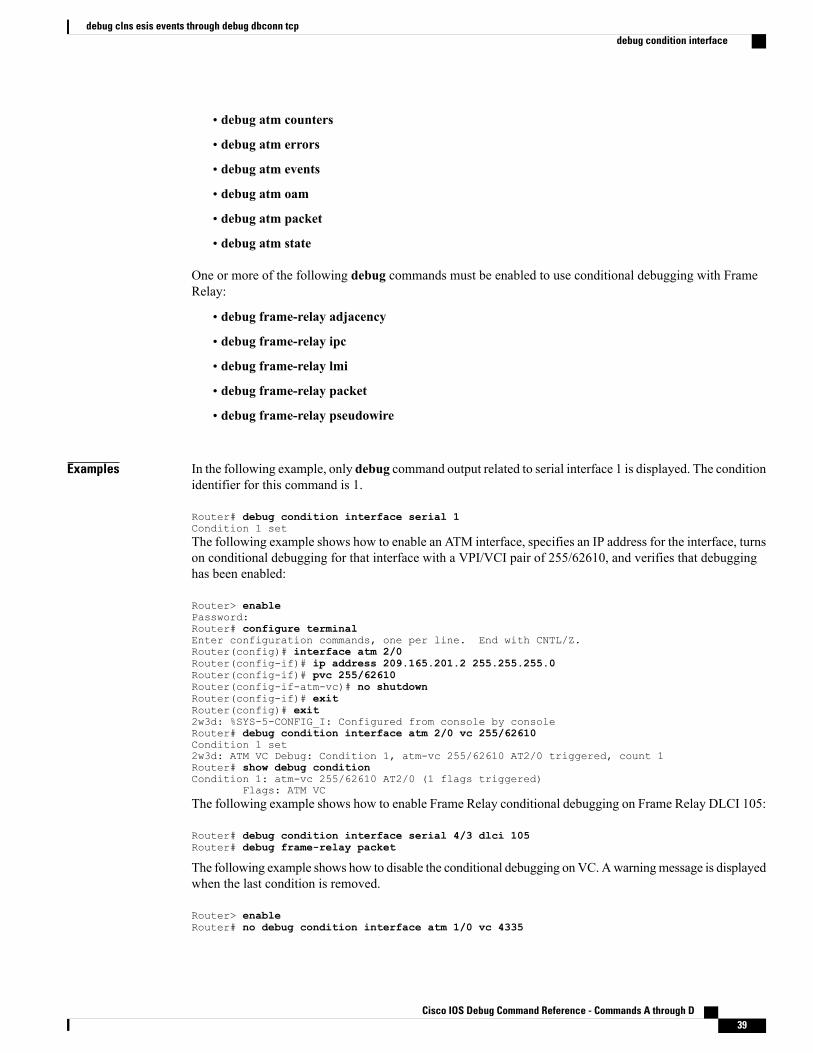
• debug atm counters
• debug atm errors
• debug atm events
• debug atm oam
• debug atm packet
• debug atm state
One or more of the following debug commands must be enabled to use conditional debugging with FrameRelay:
• debug frame-relay adjacency
• debug frame-relay ipc
• debug frame-relay lmi
• debug frame-relay packet
• debug frame-relay pseudowire
Examples In the following example, only debug command output related to serial interface 1 is displayed. The conditionidentifier for this command is 1.
Router# debug condition interface serial 1Condition 1 setThe following example shows how to enable an ATM interface, specifies an IP address for the interface, turnson conditional debugging for that interface with a VPI/VCI pair of 255/62610, and verifies that debugginghas been enabled:
Router> enablePassword:Router# configure terminalEnter configuration commands, one per line. End with CNTL/Z.Router(config)# interface atm 2/0Router(config-if)# ip address 209.165.201.2 255.255.255.0Router(config-if)# pvc 255/62610Router(config-if-atm-vc)# no shutdownRouter(config-if)# exitRouter(config)# exit2w3d: %SYS-5-CONFIG_I: Configured from console by consoleRouter# debug condition interface atm 2/0 vc 255/62610Condition 1 set2w3d: ATM VC Debug: Condition 1, atm-vc 255/62610 AT2/0 triggered, count 1Router# show debug conditionCondition 1: atm-vc 255/62610 AT2/0 (1 flags triggered)
Flags: ATM VCThe following example shows how to enable Frame Relay conditional debugging on Frame Relay DLCI 105:
Router# debug condition interface serial 4/3 dlci 105Router# debug frame-relay packet
The following example shows how to disable the conditional debugging onVC. Awarningmessage is displayedwhen the last condition is removed.
Router> enableRouter# no debug condition interface atm 1/0 vc 4335
Cisco IOS Debug Command Reference - Commands A through D 39
debug clns esis events through debug dbconn tcpdebug condition interface

This condition is the last interface condition set.Removing all conditions may cause a flood of debuggingmessages to result, unless specific debugging flagsare first removed.Proceed with removal? [yes/no]: yCondition 1 has been removed
Related Commands DescriptionCommand
Limits output for some debug commands on the basisof specific conditions.
debug condition
Displays debugging information about the packetsreceived on a Frame Relay interface.
debug frame-relay
Displays the debugging filters that have been enabledfor VoiceXML. applications, ATM-enabled interfaces,or Frame Relay interfaces
show debug condition
Cisco IOS Debug Command Reference - Commands A through D40
debug clns esis events through debug dbconn tcpdebug condition interface
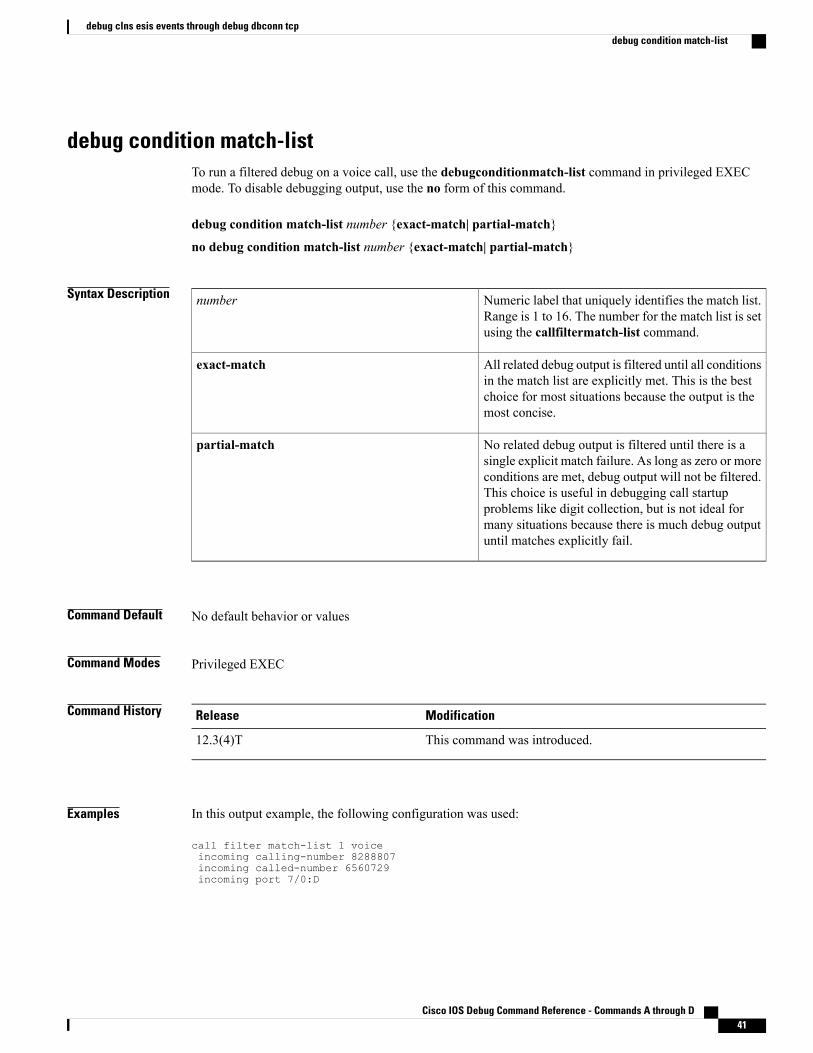
debug condition match-listTo run a filtered debug on a voice call, use the debugconditionmatch-list command in privileged EXECmode. To disable debugging output, use the no form of this command.
debug condition match-list number {exact-match| partial-match}
no debug condition match-list number {exact-match| partial-match}
Syntax Description Numeric label that uniquely identifies the match list.Range is 1 to 16. The number for the match list is setusing the callfiltermatch-list command.
number
All related debug output is filtered until all conditionsin the match list are explicitly met. This is the bestchoice for most situations because the output is themost concise.
exact-match
No related debug output is filtered until there is asingle explicit match failure. As long as zero or moreconditions are met, debug output will not be filtered.This choice is useful in debugging call startupproblems like digit collection, but is not ideal formany situations because there is much debug outputuntil matches explicitly fail.
partial-match
Command Default No default behavior or values
Command Modes Privileged EXEC
Command History ModificationRelease
This command was introduced.12.3(4)T
Examples In this output example, the following configuration was used:
call filter match-list 1 voiceincoming calling-number 8288807incoming called-number 6560729incoming port 7/0:D
Cisco IOS Debug Command Reference - Commands A through D 41
debug clns esis events through debug dbconn tcpdebug condition match-list

The following is sample output for the debugconditionmatch-list1 command. The next several lines matchthe above conditions.
Router# debug condition match-list 107:22:19://-1/3C0B9468-15C8-11D4-8013-000A8A389BA8/VTSP:(7/0:D):0:0:0/vtsp_gcfm_incoming_cond_notify:add incoming port cond success: 7/0:D07:22:19://-1/3C0B9468-15C8-11D4-8013-000A8A389BA8/VTSP:(7/0:D):0:0:0/vtsp_gcfm_incoming_cond_notify:add incoming dialpeer tag success:107:22:19://-1/3C0B9468-15C8-11D4-8013-000A8A389BA8/VTSP:(7/0:D):0:0:0/vtsp_update_dsm_stream_mgr_filter_flag:cannot find dsp_stream_mgr_t07:22:19://-1/3C0B9468-15C8-11D4-8013-000A8A389BA8/VTSP:(7/0:D):0:0:0/vtsp_update_dsm_stream_mgr_filter_flag:update dsp_stream_mgr_t debug flag07:22:19: //49/3C0B9468-15C8-11D4-8013-000A8A389BA8/VTSP:(7/0:D):0:0:0/vtsp_insert_cdb:,cdb 0x6482C518, CallID=4907:22:19://49/3C0B9468-15C8-11D4-8013-000A8A389BA8/VTSP:(7/0:D):0:0:0/vtsp_do_call_setup_ind:Call ID=98357, guid=3C0B9468-15C8-11D4-8013-000A8A389BA8The table below describes the significant fields shown in the display.
Table 2: debug condition match-list Field Descriptions
DescriptionField
Shows the global unique identifier (GUID).3C0B9468-15C8-11D4-8013-000A8A389BA8
Identifies the voice telephony service provider(VTSP) module.
VTSP:
Shows the port name, channel number, DSP slot, andDSP channel number for the VTSP module.
(7/0:D):0:0:0
Related Commands DescriptionCommand
Creates a call filter match list for debugging voicecalls.
call filter match-list voice
Displays the debug trace inside the GCFM.debug call filter inout
Displays call filter match lists.show call filter match-list
Cisco IOS Debug Command Reference - Commands A through D42
debug clns esis events through debug dbconn tcpdebug condition match-list

debug condition standbyTo filter the output of the debugstandbycommand on the basis of interface and Hot Standby Router Protocol(HSRP) group number, use thedebugconditionstandbycommand in privileged EXEC mode. To remove thespecified filter condition, use the no form of this command.
debug condition standby interface group-number
no debug condition standby interface group-number
Syntax Description Filters output on the basis of the interface.interface
Filters output on the basis of HSRP group number.The range is 0 to 255 for HSRP Version 1 and 0 to4095 for HSRP Version 2.
group-number
Command Default All debugging messages for the debugstandbycommand aregenerated.
Command Modes Privileged EXEC
Command History ModificationRelease
This command was introduced.12.1(2)
Usage Guidelines Use the debugconditionstandbycommand to restrict the debug output for the debugstandby command. Ifthe debugconditionstandbycommand is enabled, output is generated only for the interfaces and HSRP groupnumbers specified. The interface you specify must be a valid interface capable of supporting HSRP. The groupcan be any group (0 to 255 for HSRPv1 and 0 to 4095 for HSRPv2).
Use the no form of this command to remove the HSRP debug condition. If the last condition is removed,debugging output resumes for all interfaces. You will be asked for confirmation before removing the lastcondition or all conditions.
You can set debug conditions for groups that do not exist, which allows you to capture debug informationduring the initialization of a new group.
You must enable the debug standby command in order for any HSRP debug output to be produced. If you donot configure the debugconditionstandby command after entering the debugstandbycommand, then debugoutput is produced for all groups on all interfaces.
Cisco IOS Debug Command Reference - Commands A through D 43
debug clns esis events through debug dbconn tcpdebug condition standby

Examples In the following example, the router displays debugging messages only for Ethernet interface 0/0 that are partof HSRP group 23:
Router# debug standbyHSRP debugging is onRouter# debug condition standby ethernet0/0 23Condition 1 set00:27:39: HSRP: Et0/0 Grp 23 Hello out 10.0.0.1 Active pri 100 vIP 172.16.6.500:27:42: HSRP: Et0/0 Grp 23 Hello out 10.0.0.1 Active pri 100 vIP 172.16.6.500:27:45: HSRP: Et0/0 Grp 23 Hello out 10.0.0.1 Active pri 100 vIP 172.16.6.500:27:48: HSRP: Et0/0 Grp 23 Hello out 10.0.0.1 Active pri 100 vIP 172.16.6.500:27:51: HSRP: Et0/0 Grp 23 Hello out 10.0.0.1 Active pri 100 vIP 172.16.6.5The following example shows how to remove an HSRP debug condition:
Router# no debug condition standby ethernet0/0 23This condition is the last hsrp condition set.Removing all conditions may cause a flood of debuggingmessages to result, unless specific debugging flagsare first removed.Proceed with removal? [yes/no]: YCondition 1 has been removed.
Related Commands DescriptionCommand
Limits output for some debugging commands basedon the interfaces.
debug condition interface
Displays HSRP state changes.debug standby
Displays error messages related to HSRP.debug standby errors
Displays events related to HSRP.debug standby events
Displays debugging messages for the HSRP ICMPredirects filter.
debug standby events icmp
Displays debugging information for packets relatedto HSRP.
debug standby packets
Cisco IOS Debug Command Reference - Commands A through D44
debug clns esis events through debug dbconn tcpdebug condition standby
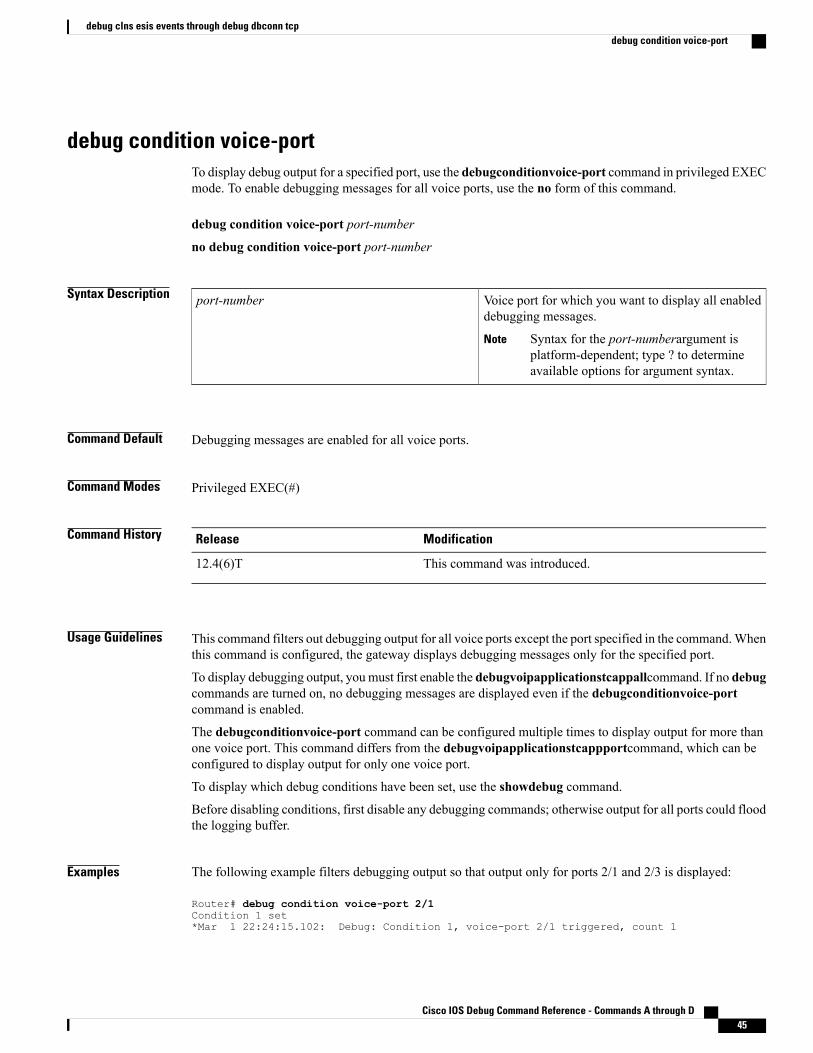
debug condition voice-portTo display debug output for a specified port, use the debugconditionvoice-port command in privileged EXECmode. To enable debugging messages for all voice ports, use the no form of this command.
debug condition voice-port port-number
no debug condition voice-port port-number
Syntax Description Voice port for which you want to display all enableddebugging messages.
Syntax for the port-numberargument isplatform-dependent; type ? to determineavailable options for argument syntax.
Note
port-number
Command Default Debugging messages are enabled for all voice ports.
Command Modes Privileged EXEC(#)
Command History ModificationRelease
This command was introduced.12.4(6)T
Usage Guidelines This command filters out debugging output for all voice ports except the port specified in the command.Whenthis command is configured, the gateway displays debugging messages only for the specified port.
To display debugging output, youmust first enable the debugvoipapplicationstcappallcommand. If no debugcommands are turned on, no debugging messages are displayed even if the debugconditionvoice-portcommand is enabled.
The debugconditionvoice-port command can be configured multiple times to display output for more thanone voice port. This command differs from the debugvoipapplicationstcappportcommand, which can beconfigured to display output for only one voice port.
To display which debug conditions have been set, use the showdebug command.
Before disabling conditions, first disable any debugging commands; otherwise output for all ports could floodthe logging buffer.
Examples The following example filters debugging output so that output only for ports 2/1 and 2/3 is displayed:
Router# debug condition voice-port 2/1Condition 1 set*Mar 1 22:24:15.102: Debug: Condition 1, voice-port 2/1 triggered, count 1
Cisco IOS Debug Command Reference - Commands A through D 45
debug clns esis events through debug dbconn tcpdebug condition voice-port

Router# debug condition voice-port 2/3Condition 2 set*Mar 1 22:24:24.794: Debug: Condition 2, voice-port 2/3 triggered, count 2Router# show debugCondition 1: voice-port 2/1 (1 flags triggered)
Flags: voice-port conditionCondition 2: voice-port 2/3 (1 flags triggered)
Flags: voice-port condition
Related Commands DescriptionCommand
Displays debugging information for SCCP.debug sccp all
Displays debugging information for the componentsof the STCAPP.
debug voip application stcapp all
Enables STCAPP debugging for a specific port.debug voip application stcapp port
Displays the types of debugging and the debuggingconditions that are enabled on your router.
show debug
Cisco IOS Debug Command Reference - Commands A through D46
debug clns esis events through debug dbconn tcpdebug condition voice-port

debug condition vrfTo limit debug output to a specific Virtual Routing and Forwarding (VRF) instance, use thedebugconditionvrfcommand in privileged EXEC mode. To remove the debug condition, use the undebugversion of the command .
debug condition vrf vrf-name
undebug condition vrf vrf-name
Syntax Description Name of a VRF.vrf-name
Command Modes Privileged EXEC (#)
Command History ModificationRelease
This command was introduced.Cisco IOS XE Release 3.2S
Usage Guidelines Use this command to limit debug output to a single VRF.
EIGRP does not support the debugconditionvrf command.Note
Examples The following example shows how to limit debugging output to VRF red:
Router# debug condition vrf red
Related Commands DescriptionCommand
Defines a virtual routing and forwarding instance.vrf definition
Cisco IOS Debug Command Reference - Commands A through D 47
debug clns esis events through debug dbconn tcpdebug condition vrf

debug condition xconnectTo conditionally filter debug messages related to xconnect configurations, use the debugconditionxconnectcommand in privileged EXEC configuration mode. To disable the filtering of xconnect debug messages, usethe no form of this command.
debug condition xconnect {fib type| interface type number [dlci| vp number| vc number]| peer ip-addressvcid vcid| segment segment-id}
no debug condition xconnect {fib type| interface type number [dlci| vp number| vc number]| peer ip-addressvcid vcid| segment segment-id}
Syntax Description Filters control-plane and data-plane debug messagesfor the xconnect segment pair specified by matchingagainst the Forwarding Information Base (FIB)Interface Descriptor Block (IDB) informationassociated with a particular interface on a line card.
fib type
Filters control-plane and data-plane debug messagesfor the xconnect segment pair specified by theinterface type and number on a Route Processor.
interface type number
(Optional) The Frame Relay data-link connectionidentifier (DLCI) for the xconnect segment pairassociated with a Frame Relay segment.
dlci
(Optional) The ATM virtual path (VP) number forthe xconnect segment pair associated with an ATMsegment.
vp number
(Optional) The ATM virtual circuit (VC) number forthe xconnect segment pair associated with an ATMsegment.
vc number
Filters control-plane and data-plane debug messagesfor the xconnect segment pair specified by the remotepeer IP address and the pseudowire virtual circuit ID(VCID).
peer
The IP address of the remote peer router.ip-address
The VCID of the xconnect pseudowire.vcid vcid
Filters data-plane debug messages for the xconnectsegment pair specified by a segment ID.
segment
The segment ID. The segment ID value can be foundin the output of the showssmid command.
segment-id
Cisco IOS Debug Command Reference - Commands A through D48
debug clns esis events through debug dbconn tcpdebug condition xconnect

Command Default Debug messages are not filtered.
Command Modes Privileged EXEC
Command History ModificationRelease
This command was introduced.12.2(28)SB
This command was integrated in Cisco IOS Release 15.3(1)S.15.3(1)S
Usage Guidelines Use the debugconditionxconnect command to specify conditions for filtering the debug messages displayedby related subscriber service switch (SSS), xconnect, and attachment circuit debug commands.
Examples The following example sets filter conditions that allow related debug commands to display debug messagesfor only the xconnect segment pair specified by the remote peer IP address and the pseudowire VCID:
debug condition xconnect peer 10.0.0.1 vcid 100The following example sets filter conditions that allow related debug commands to display debug messagesfor only the xconnect segment pair specified by the serial interface number and DLCI:
debug condition xconnect interface serial 0/0 100The following example sets filter conditions that allow related debug commands to display debug messagesfor only the xconnect segment pair specified by the port mode ATM interface number:
debug condition xconnect interface atm 0/0The following example sets filter conditions that allow related debug commands to display debug messagesfor only the xconnect segment pair specified by the VP mode ATM interface number:
debug condition xconnect interface atm 0/0 vp 1The following example sets filter conditions that allow related debug commands to display debug messagesfor only the xconnect segment pair specified by the VC mode ATM interface number:
debug condition xconnect interface atm 0/0 vc 1/40The following example finds the segment ID associated with an L2TPv3 xconnect segment pair and sets filterconditions that allow related debug commands to display debug messages for only that xconnect segmentpair:
Router# show ssm id!Segment-ID: 8193 Type: L2TPv3[8]!Router# debug conditional xconnect segment 8193
Cisco IOS Debug Command Reference - Commands A through D 49
debug clns esis events through debug dbconn tcpdebug condition xconnect

Related Commands DescriptionCommand
Displays errors and events that occur on theattachment circuits.
debug acircuit
Displays messages about AAA authorization eventsthat are part of normal call establishment.
debug sss aaa authorization event
Displays information about AAA authorization statechanges.
debug sss aaa authorization fsm
Displays diagnostic information about errors that mayoccur during SSS call setup.
debug sss error
Displays diagnostic information about SSS call setupevents.
debug sss event
Displays diagnostic information about the SSS callsetup state.
debug sss fsm
Displays debug messages related to an xconnectconfiguration.
debug xconnect
Displays SSM information for switched Layer 2segments.
show ssm id
Cisco IOS Debug Command Reference - Commands A through D50
debug clns esis events through debug dbconn tcpdebug condition xconnect

debug configuration lockTo enable debugging of the Cisco IOS configuration lock, use the debugconfigurationlockcommand inprivileged EXEC mode. To disable debugging output, use the no form of this command.
debug configuration lock
no debug command lock
Syntax Description This command has no arguments or keywords.
Command Modes Privileged EXEC
Command History ModificationRelease
This command was introduced.12.3(14)T
This command was integrated into Cisco IOS Release 12.0(31)S.12.0(31)S
This command was integrated into Cisco IOS Release 12.2(33)SRA.12.2(33)SRA
This command is supported in the Cisco IOS Release 12.2SX train. Supportin a specific 12.2SX release of this train depends on your feature set, platform,and platform hardware.
12.2SX
This command was integrated into Cisco IOS Release 12.2(33)SB.12.2(33)SB
Examples The following is sample output with debugconfigurationlock enabled (assuming that the feature is enabledusing the configurationmodeexclusivemanual command in global configuration mode):
Router# debug configuration lockSession1 from console==========================Router# configure terminal lockConfiguration mode locked exclusively. The lock will be cleared once you exit out ofconfiguration mode using end/exitEnter configuration commands, one per line. End with CNTL/Z.Router(config)#Parser : LOCK REQUEST in EXCLUSIVE modeParser: <configure terminal lock> - Config. Lock requested by process <3> client <PARSERClient>Parser: <configure terminal lock> - Config. Lock acquired successfully !Router(config)#Session2 VTY (User from session2 is trying to enter single user config (exclusive) configmode)=================================Router# configure terminal lock
Configuration mode locked exclusively by user 'unknown' process '3' from terminal '0'.Please try later.
Cisco IOS Debug Command Reference - Commands A through D 51
debug clns esis events through debug dbconn tcpdebug configuration lock
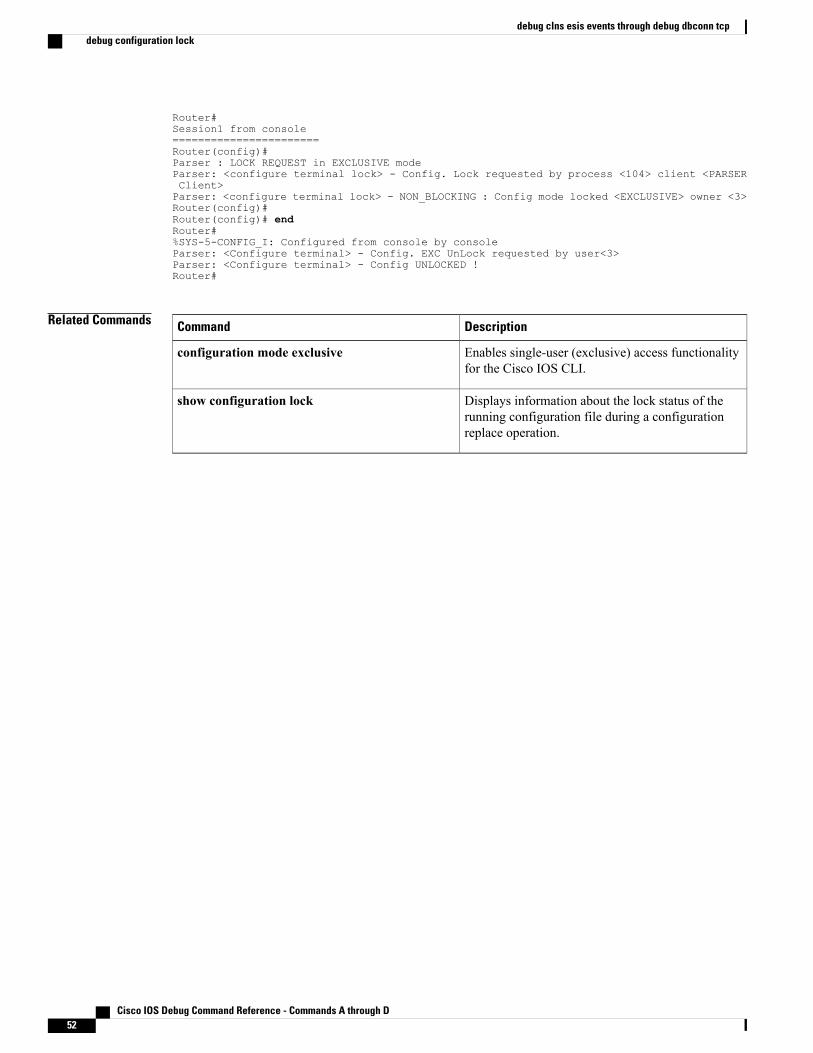
Router#Session1 from console=======================Router(config)#Parser : LOCK REQUEST in EXCLUSIVE modeParser: <configure terminal lock> - Config. Lock requested by process <104> client <PARSERClient>Parser: <configure terminal lock> - NON_BLOCKING : Config mode locked <EXCLUSIVE> owner <3>Router(config)#Router(config)# endRouter#%SYS-5-CONFIG_I: Configured from console by consoleParser: <Configure terminal> - Config. EXC UnLock requested by user<3>Parser: <Configure terminal> - Config UNLOCKED !Router#
Related Commands DescriptionCommand
Enables single-user (exclusive) access functionalityfor the Cisco IOS CLI.
configuration mode exclusive
Displays information about the lock status of therunning configuration file during a configurationreplace operation.
show configuration lock
Cisco IOS Debug Command Reference - Commands A through D52
debug clns esis events through debug dbconn tcpdebug configuration lock

debug confmodemTo display information associated with the discovery and configuration of the modem attached to the router,use the debugconfmodemcommand in privileged EXECmode. To disable debugging output, use the no formof this command.
debug confmodem
no debug confmodem
Syntax Description This command has no arguments or keywords.
Command Modes Privileged EXEC
Usage Guidelines Thedebugconfmodem command is used in debugging configurations that use themodemautoconfig command.
Examples The following is sample output from thedebugconfmodemcommand. In the first three lines, the router issearching for a speed at which it can communicate with the modem. The remaining lines show the actualsending of the modem command.
Router# debug confmodemTTY4:detection speed(115200) response ------TTY4:detection speed(57600) response ------TTY4:detection speed(38400) response ---OK---TTY4:Modem command: --AT&F&C1&D2S180=3S190=1S0=1--TTY4: Modem configuration succeededTTY4: Done with modem configuration
Cisco IOS Debug Command Reference - Commands A through D 53
debug clns esis events through debug dbconn tcpdebug confmodem
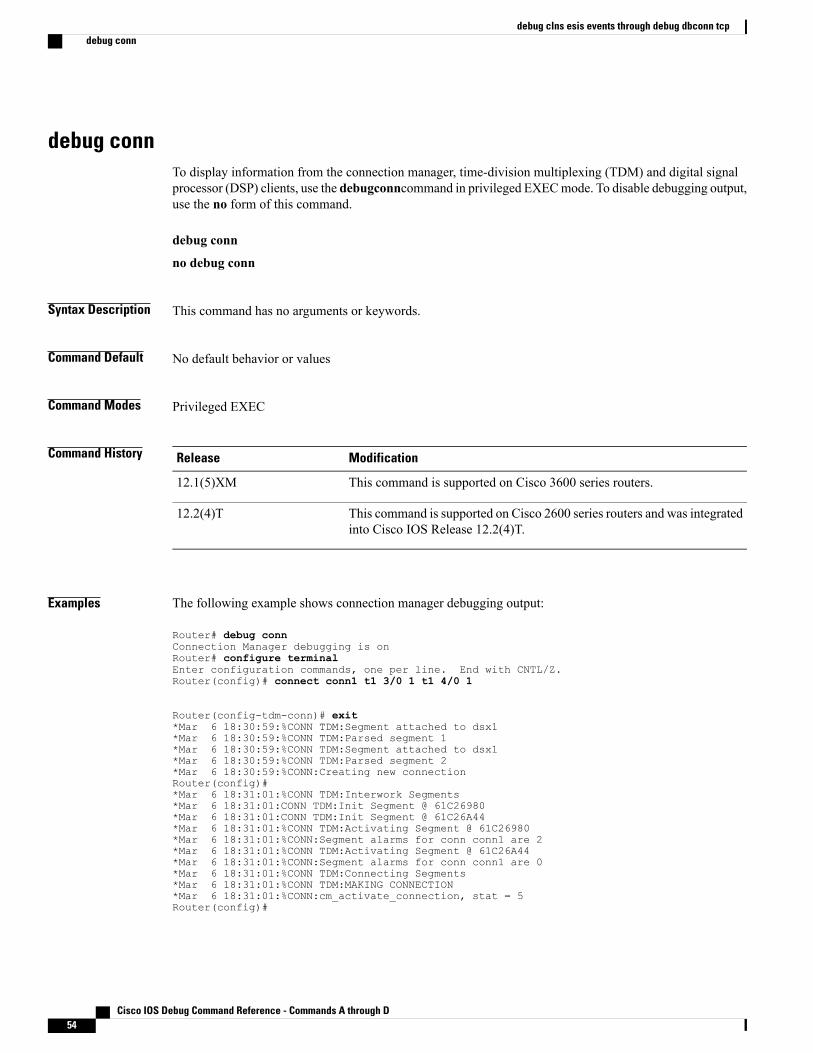
debug connTo display information from the connection manager, time-division multiplexing (TDM) and digital signalprocessor (DSP) clients, use the debugconncommand in privileged EXECmode. To disable debugging output,use the no form of this command.
debug conn
no debug conn
Syntax Description This command has no arguments or keywords.
Command Default No default behavior or values
Command Modes Privileged EXEC
Command History ModificationRelease
This command is supported on Cisco 3600 series routers.12.1(5)XM
This command is supported on Cisco 2600 series routers and was integratedinto Cisco IOS Release 12.2(4)T.
12.2(4)T
Examples The following example shows connection manager debugging output:
Router# debug connConnection Manager debugging is onRouter# configure terminalEnter configuration commands, one per line. End with CNTL/Z.Router(config)# connect conn1 t1 3/0 1 t1 4/0 1
Router(config-tdm-conn)# exit*Mar 6 18:30:59:%CONN TDM:Segment attached to dsx1*Mar 6 18:30:59:%CONN TDM:Parsed segment 1*Mar 6 18:30:59:%CONN TDM:Segment attached to dsx1*Mar 6 18:30:59:%CONN TDM:Parsed segment 2*Mar 6 18:30:59:%CONN:Creating new connectionRouter(config)#*Mar 6 18:31:01:%CONN TDM:Interwork Segments*Mar 6 18:31:01:CONN TDM:Init Segment @ 61C26980*Mar 6 18:31:01:CONN TDM:Init Segment @ 61C26A44*Mar 6 18:31:01:%CONN TDM:Activating Segment @ 61C26980*Mar 6 18:31:01:%CONN:Segment alarms for conn conn1 are 2*Mar 6 18:31:01:%CONN TDM:Activating Segment @ 61C26A44*Mar 6 18:31:01:%CONN:Segment alarms for conn conn1 are 0*Mar 6 18:31:01:%CONN TDM:Connecting Segments*Mar 6 18:31:01:%CONN TDM:MAKING CONNECTION*Mar 6 18:31:01:%CONN:cm_activate_connection, stat = 5Router(config)#
Cisco IOS Debug Command Reference - Commands A through D54
debug clns esis events through debug dbconn tcpdebug conn
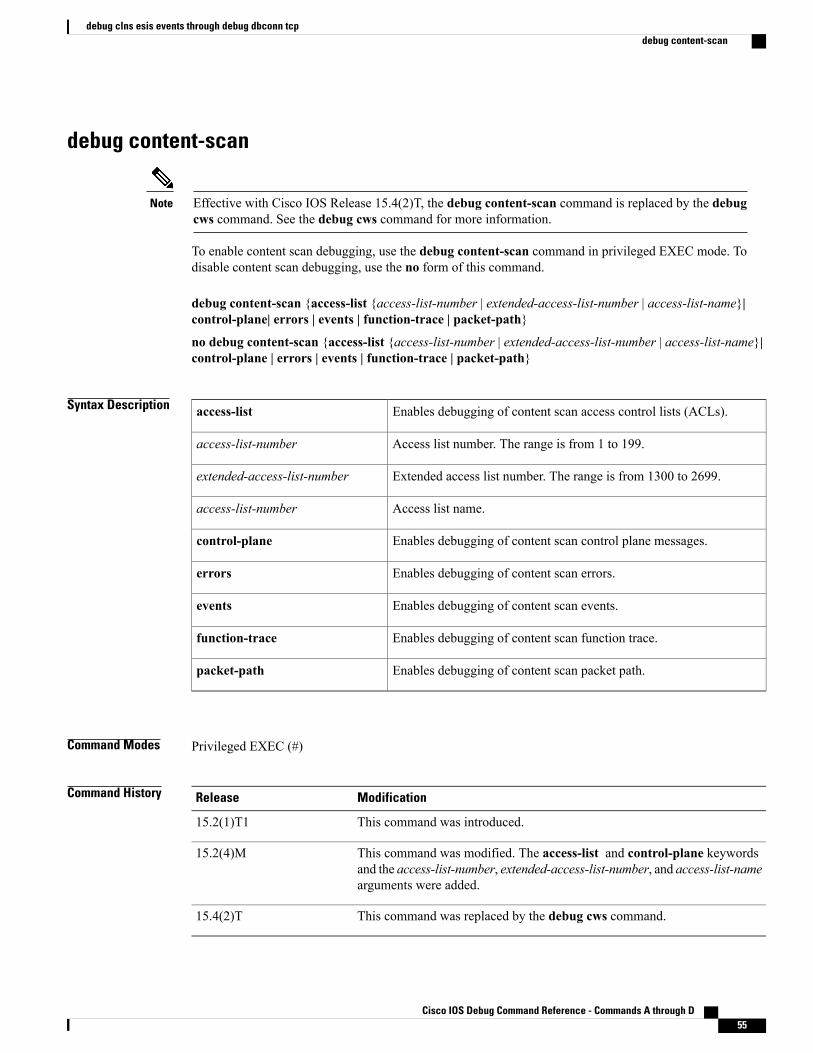
debug content-scan
Effective with Cisco IOS Release 15.4(2)T, the debug content-scan command is replaced by the debugcws command. See the debug cws command for more information.
Note
To enable content scan debugging, use the debug content-scan command in privileged EXEC mode. Todisable content scan debugging, use the no form of this command.
debug content-scan {access-list {access-list-number | extended-access-list-number | access-list-name}|control-plane| errors | events | function-trace | packet-path}
no debug content-scan {access-list {access-list-number | extended-access-list-number | access-list-name}|control-plane | errors | events | function-trace | packet-path}
Syntax Description Enables debugging of content scan access control lists (ACLs).access-list
Access list number. The range is from 1 to 199.access-list-number
Extended access list number. The range is from 1300 to 2699.extended-access-list-number
Access list name.access-list-number
Enables debugging of content scan control plane messages.control-plane
Enables debugging of content scan errors.errors
Enables debugging of content scan events.events
Enables debugging of content scan function trace.function-trace
Enables debugging of content scan packet path.packet-path
Command Modes Privileged EXEC (#)
Command History ModificationRelease
This command was introduced.15.2(1)T1
This command was modified. The access-list and control-plane keywordsand the access-list-number, extended-access-list-number, and access-list-namearguments were added.
15.2(4)M
This command was replaced by the debug cws command.15.4(2)T
Cisco IOS Debug Command Reference - Commands A through D 55
debug clns esis events through debug dbconn tcpdebug content-scan
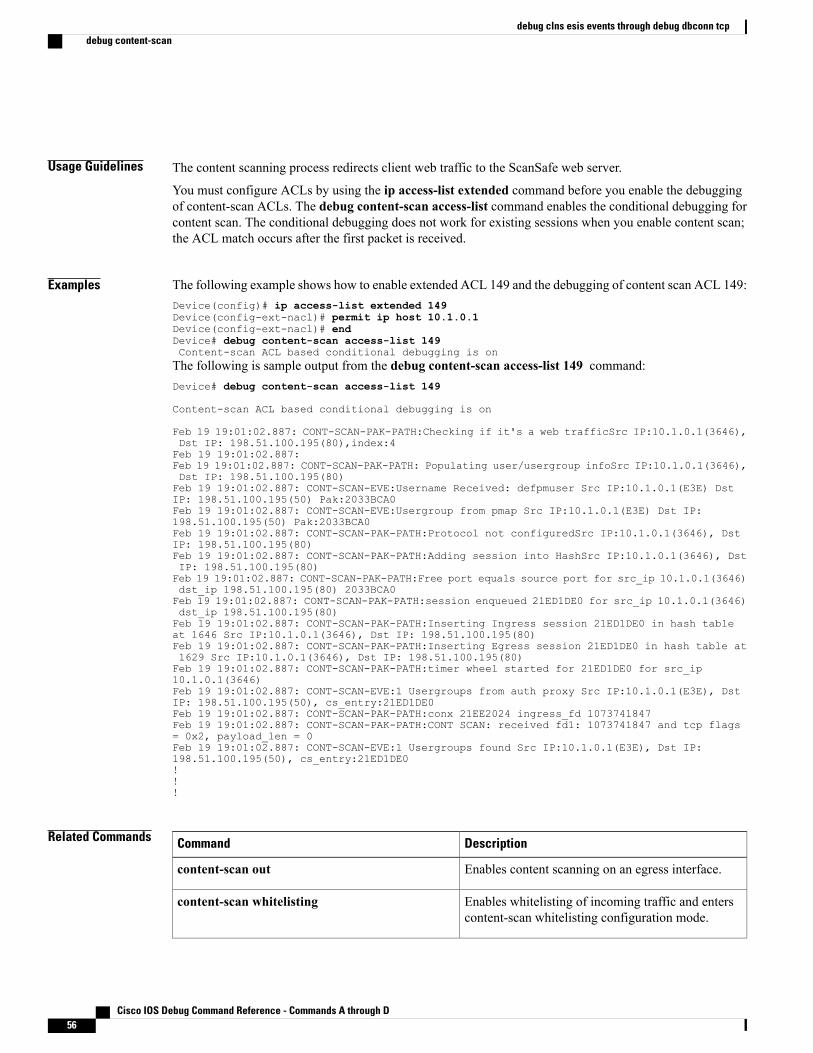
Usage Guidelines The content scanning process redirects client web traffic to the ScanSafe web server.
You must configure ACLs by using the ip access-list extended command before you enable the debuggingof content-scan ACLs. The debug content-scan access-list command enables the conditional debugging forcontent scan. The conditional debugging does not work for existing sessions when you enable content scan;the ACL match occurs after the first packet is received.
Examples The following example shows how to enable extended ACL 149 and the debugging of content scan ACL 149:Device(config)# ip access-list extended 149Device(config-ext-nacl)# permit ip host 10.1.0.1Device(config-ext-nacl)# endDevice# debug content-scan access-list 149Content-scan ACL based conditional debugging is onThe following is sample output from the debug content-scan access-list 149 command:Device# debug content-scan access-list 149
Content-scan ACL based conditional debugging is on
Feb 19 19:01:02.887: CONT-SCAN-PAK-PATH:Checking if it's a web trafficSrc IP:10.1.0.1(3646),Dst IP: 198.51.100.195(80),index:4Feb 19 19:01:02.887:Feb 19 19:01:02.887: CONT-SCAN-PAK-PATH: Populating user/usergroup infoSrc IP:10.1.0.1(3646),Dst IP: 198.51.100.195(80)Feb 19 19:01:02.887: CONT-SCAN-EVE:Username Received: defpmuser Src IP:10.1.0.1(E3E) DstIP: 198.51.100.195(50) Pak:2033BCA0Feb 19 19:01:02.887: CONT-SCAN-EVE:Usergroup from pmap Src IP:10.1.0.1(E3E) Dst IP:198.51.100.195(50) Pak:2033BCA0Feb 19 19:01:02.887: CONT-SCAN-PAK-PATH:Protocol not configuredSrc IP:10.1.0.1(3646), DstIP: 198.51.100.195(80)Feb 19 19:01:02.887: CONT-SCAN-PAK-PATH:Adding session into HashSrc IP:10.1.0.1(3646), DstIP: 198.51.100.195(80)Feb 19 19:01:02.887: CONT-SCAN-PAK-PATH:Free port equals source port for src_ip 10.1.0.1(3646)dst_ip 198.51.100.195(80) 2033BCA0Feb 19 19:01:02.887: CONT-SCAN-PAK-PATH:session enqueued 21ED1DE0 for src_ip 10.1.0.1(3646)dst_ip 198.51.100.195(80)Feb 19 19:01:02.887: CONT-SCAN-PAK-PATH:Inserting Ingress session 21ED1DE0 in hash tableat 1646 Src IP:10.1.0.1(3646), Dst IP: 198.51.100.195(80)Feb 19 19:01:02.887: CONT-SCAN-PAK-PATH:Inserting Egress session 21ED1DE0 in hash table at1629 Src IP:10.1.0.1(3646), Dst IP: 198.51.100.195(80)Feb 19 19:01:02.887: CONT-SCAN-PAK-PATH:timer wheel started for 21ED1DE0 for src_ip10.1.0.1(3646)Feb 19 19:01:02.887: CONT-SCAN-EVE:1 Usergroups from auth proxy Src IP:10.1.0.1(E3E), DstIP: 198.51.100.195(50), cs_entry:21ED1DE0Feb 19 19:01:02.887: CONT-SCAN-PAK-PATH:conx 21EE2024 ingress_fd 1073741847Feb 19 19:01:02.887: CONT-SCAN-PAK-PATH:CONT SCAN: received fd1: 1073741847 and tcp flags= 0x2, payload_len = 0Feb 19 19:01:02.887: CONT-SCAN-EVE:1 Usergroups found Src IP:10.1.0.1(E3E), Dst IP:198.51.100.195(50), cs_entry:21ED1DE0!!!
Related Commands DescriptionCommand
Enables content scanning on an egress interface.content-scan out
Enables whitelisting of incoming traffic and enterscontent-scan whitelisting configuration mode.
content-scan whitelisting
Cisco IOS Debug Command Reference - Commands A through D56
debug clns esis events through debug dbconn tcpdebug content-scan

DescriptionCommand
Displays content scan information.show content-scan
Cisco IOS Debug Command Reference - Commands A through D 57
debug clns esis events through debug dbconn tcpdebug content-scan
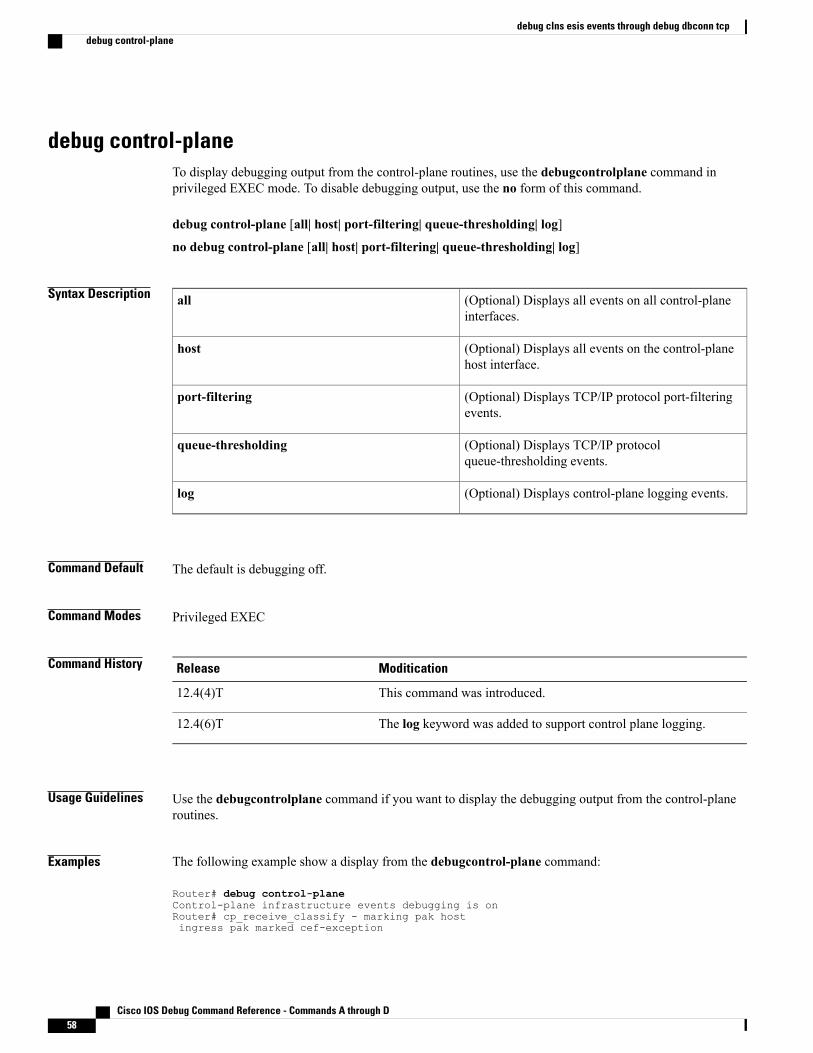
debug control-planeTo display debugging output from the control-plane routines, use the debugcontrolplane command inprivileged EXEC mode. To disable debugging output, use the no form of this command.
debug control-plane [all| host| port-filtering| queue-thresholding| log]
no debug control-plane [all| host| port-filtering| queue-thresholding| log]
Syntax Description (Optional) Displays all events on all control-planeinterfaces.
all
(Optional) Displays all events on the control-planehost interface.
host
(Optional) Displays TCP/IP protocol port-filteringevents.
port-filtering
(Optional) Displays TCP/IP protocolqueue-thresholding events.
queue-thresholding
(Optional) Displays control-plane logging events.log
Command Default The default is debugging off.
Command Modes Privileged EXEC
Command History ModiticationRelease
This command was introduced.12.4(4)T
The log keyword was added to support control plane logging.12.4(6)T
Usage Guidelines Use the debugcontrolplane command if you want to display the debugging output from the control-planeroutines.
Examples The following example show a display from the debugcontrol-plane command:
Router# debug control-planeControl-plane infrastructure events debugging is onRouter# cp_receive_classify - marking pak hostingress pak marked cef-exception
Cisco IOS Debug Command Reference - Commands A through D58
debug clns esis events through debug dbconn tcpdebug control-plane

The following example shows a display from the debugcontrol-plane command using the port-filteringoption:
Router# debug control-plane port-filtering
TCP/IP Port filtering events debugging is onDropped UDP dport 1243 sport 62134 saddr 209.165.200.225The table below describes the significant fields shown in the display.
Table 3: debug control plane field descriptions
DescriptionField
UPD destination port.dport
UPD source port.sport
Source address of the IP packets.saddr
Related Commands DescriptionCommand
Clears packet counters for control-plane interfacesand subinterfaces.
clear control-plane
Enters control-plane configuration mode, whichallows users to associate or modify attributes orparameters that are associated with the control planeof the device.
control-plane
Displays the control plane packet counters for thecontrol plane CEF-exception subinterface.
show control-plane cef-exception counters
Displays the configured features for the control planeCEF-exception subinterface.
show control-plane cef-exception features
Displays the control-plane packet counters for theaggregate control-plane interface.
show control-plane counters
Displays the configured features for the aggregatecontrol-plane interface.
show control-plane features
Displays the control plane packet counters for thecontrol plane host subinterface.
show control-plane host counters
Displays the configured features for the control planehost subinterface.
show control-plane host features
Displays a list of open TCP/UDP ports that areregistered with the port-filter database.
show control-plane host open-ports
Cisco IOS Debug Command Reference - Commands A through D 59
debug clns esis events through debug dbconn tcpdebug control-plane

Displays the control plane packet counters for thecontrol plane transit subinterface.
show control-plane transit counters
Cisco IOS Debug Command Reference - Commands A through D60
debug clns esis events through debug dbconn tcpdebug control-plane

debug copsTo display a one-line summary of each CommonOpen Policy Service (COPS) message sent from and receivedby the router, use the debugcops command in privileged EXEC mode. To disable debugging output, use theno form of this command.
debug cops [detail]
no debug cops [detail]
Syntax Description (Optional) Displays additional debug information,including the contents of COPS and ResourceReservation Protocol (RSVP) messages.
detail
Command Default COPS process debugging is not enabled.
Command Modes Privileged EXEC
Command History ModificationRelease
This command was introduced.12.1(1)T
This command was integrated into Cisco IOS Release 12.2(33)SRA.12.2(33)SRA
Usage Guidelines To generate a complete record of the policy process, enter this command and, after entering a carriage return,enter the additional command debug ip rsvp policy.
Examples This first example displays the one-line COPS message summaries, as the router goes through six differentevents.
Router# debug copsCOPS debugging is on
Examples The router becomes configured to communicate with a policy server:
Router# configure terminalEnter configuration commands, one per line. End with CNTL/Z.Router(config)# ip rsvp policy cops servers 2.0.0.1Router(config)#15:13:45:COPS: Opened TCP connection to 2.0.0.1/328815:13:45:COPS: ** SENDING MESSAGE **15:13:45:COPS OPN message, Client-type:1, Length:28. Handle:[NONE]15:13:45:COPS: ** RECEIVED MESSAGE **
Cisco IOS Debug Command Reference - Commands A through D 61
debug clns esis events through debug dbconn tcpdebug cops

15:13:45:COPS CAT message, Client-type:1, Length:16. Handle:[NONE]Router(config)#
Examples The router receives a Path message:
15:13:53:COPS:** SENDING MESSAGE **15:13:53:COPS REQ message, Client-type:1, Length:216. Handle:[ 00 00 04 01]15:13:53:COPS:** RECEIVED MESSAGE **15:13:53:COPS DEC message, Client-type:1, Length:104. Handle:[ 00 00 04 01]Router(config)#
Examples The router receives a unicast FF Resv message:
15:14:00:COPS:** SENDING MESSAGE **15:14:00:COPS REQ message, Client-type:1, Length:148. Handle:[ 00 00 05 01]15:14:00:COPS:** RECEIVED MESSAGE **15:14:00:COPS DEC message, Client-type:1, Length:64. Handle:[ 00 00 05 01]15:14:00:COPS:** SENDING MESSAGE **15:14:00:COPS RPT message, Client-type:1, Length:24. Handle:[ 00 00 05 01]Router(config)#
Examples The router receives a Resv tear:
15:14:06:COPS:** SENDING MESSAGE **15:14:06:COPS DRQ message, Client-type:1, Length:24. Handle:[ 00 00 05 01]Router(config)#
Examples The router receives a Path tear:
15:14:11:COPS:** SENDING MESSAGE **15:14:11:COPS DRQ message, Client-type:1, Length:24. Handle:[ 00 00 04 01]Router(config)#
Examples The router gets configured to cease communicating with the policy server:
Router(config)# no ip rsvp policy cops servers15:14:23:COPS:** SENDING MESSAGE **15:14:23:COPS CC message, Client-type:1, Length:16. Handle:[NONE]15:14:23:COPS:Closed TCP connection to 2.0.0.1/3288Router(config)#This second example uses the detail keyword to display the contents of the COPS and RSVP messages, andadditional debugging information:
Router# debug cops detailCOPS debugging is on02:13:29:COPS:** SENDING MESSAGE **
COPS HEADER:Version 1, Flags 0, Opcode 1 (REQ), Client-type:1, Length:216HANDLE (1/1) object. Length:8. 00 00 21 01CONTEXT (2/1) object. Length:8. R-type:5. M-type:1IN_IF (3/1) object. Length:12. Address:10.1.2.1. If_index:4OUT_IF (4/1) object. Length:12. Address:10.33.0.1. If_index:3CLIENT SI (9/1) object. Length:168. CSI data:
02:13:29: SESSION type 1 length 12:02:13:29: Destination 10.33.0.1, Protocol_Id 17, Don't Police , DstPort 4402:13:29: HOP type 1 length 12:0A01020102:13:29: :0000000002:13:29: TIME_VALUES type 1 length 8 :0000753002:13:29: SENDER_TEMPLATE type 1 length 12:
Cisco IOS Debug Command Reference - Commands A through D62
debug clns esis events through debug dbconn tcpdebug cops

02:13:29: Source 10.31.0.1, udp_source_port 4402:13:29: SENDER_TSPEC type 2 length 36:02:13:29: version=0, length in words=702:13:29: Token bucket fragment (service_id=1, length=6 words02:13:29: parameter id=127, flags=0, parameter length=502:13:29: average rate=1250 bytes/sec, burst depth=10000 bytes02:13:29: peak rate =1250000 bytes/sec02:13:29: min unit=0 bytes, max unit=1514 bytes02:13:29: ADSPEC type 2 length 84:02:13:29: version=0 length in words=1902:13:29: General Parameters break bit=0 service length=802:13:29: IS Hops:102:13:29: Minimum Path Bandwidth (bytes/sec):125000002:13:29: Path Latency (microseconds):002:13:29: Path MTU:150002:13:29: Guaranteed Service break bit=0 service length=802:13:29: Path Delay (microseconds):19200002:13:29: Path Jitter (microseconds):120002:13:29: Path delay since shaping (microseconds):19200002:13:29: Path Jitter since shaping (microseconds):120002:13:29: Controlled Load Service break bit=0 service length=002:13:29:COPS:Sent 216 bytes on socket,02:13:29:COPS:Message event!02:13:29:COPS:State of TCP is 402:13:29:In read function02:13:29:COPS:Read block of 96 bytes, num=104 (len=104)02:13:29:COPS:** RECEIVED MESSAGE **
COPS HEADER:Version 1, Flags 1, Opcode 2 (DEC), Client-type:1, Length:104HANDLE (1/1) object. Length:8. 00 00 21 01CONTEXT (2/1) object. Length:8. R-type:1. M-type:1DECISION (6/1) object. Length:8. COMMAND cmd:1, flags:0DECISION (6/3) object. Length:56. REPLACEMENT 00 10 0E 01 61 62 63 64 65 66 67
68 69 6A 6B 6C 00 24 0C 02 0000 00 07 01 00 00 06 7F 00 00 05 44 9C 40 00 46 1C 40 00 49 9896 80 00 00 00 C8 00 00 01 C8
CONTEXT (2/1) object. Length:8. R-type:4. M-type:1DECISION (6/1) object. Length:8. COMMAND cmd:1, flags:0
02:13:29:Notifying client (callback code 2)02:13:29:COPS:** SENDING MESSAGE **
COPS HEADER:Version 1, Flags 1, Opcode 3 (RPT), Client-type:1, Length:24HANDLE (1/1) object. Length:8. 00 00 21 01REPORT (12/1) object. Length:8. REPORT type COMMIT (1)
02:13:29:COPS:Sent 24 bytes on socket,02:13:29:Timer for connection entry is zero
To see an example where the debugcops command is used along with the debugiprsvppolicy command,refer to the second example of the debugiprsvppolicy command.
Related Commands DescriptionCommand
Displays debugging messages for RSVP policyprocessing.
debug ip rsvp policy
Cisco IOS Debug Command Reference - Commands A through D 63
debug clns esis events through debug dbconn tcpdebug cops
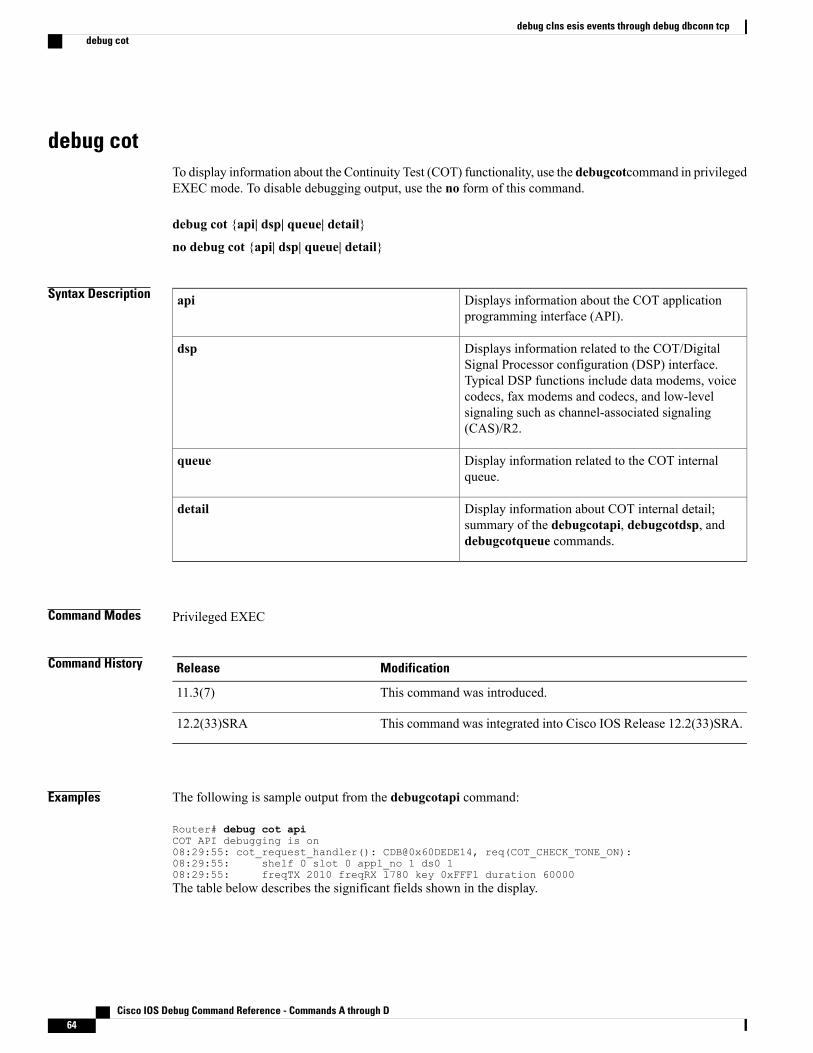
debug cotTo display information about the Continuity Test (COT) functionality, use the debugcotcommand in privilegedEXEC mode. To disable debugging output, use the no form of this command.
debug cot {api| dsp| queue| detail}
no debug cot {api| dsp| queue| detail}
Syntax Description Displays information about the COT applicationprogramming interface (API).
api
Displays information related to the COT/DigitalSignal Processor configuration (DSP) interface.Typical DSP functions include data modems, voicecodecs, fax modems and codecs, and low-levelsignaling such as channel-associated signaling(CAS)/R2.
dsp
Display information related to the COT internalqueue.
queue
Display information about COT internal detail;summary of the debugcotapi, debugcotdsp, anddebugcotqueue commands.
detail
Command Modes Privileged EXEC
Command History ModificationRelease
This command was introduced.11.3(7)
This command was integrated into Cisco IOS Release 12.2(33)SRA.12.2(33)SRA
Examples The following is sample output from the debugcotapi command:
Router# debug cot apiCOT API debugging is on08:29:55: cot_request_handler(): CDB@0x60DEDE14, req(COT_CHECK_TONE_ON):08:29:55: shelf 0 slot 0 appl_no 1 ds0 108:29:55: freqTX 2010 freqRX 1780 key 0xFFF1 duration 60000The table below describes the significant fields shown in the display.
Cisco IOS Debug Command Reference - Commands A through D64
debug clns esis events through debug dbconn tcpdebug cot

Table 4: debug cot api Field Descriptions
DescriptionField
Internal controller information.CDB
Type of COT operation requested.req
Shelf ID of the COT operation request.shelf
Designates the slot number, 1 to 4.slot
Hardware unit that provides the external interfaceconnections from a router to the network.
appl-no
Number of the COT operation request.ds0
COT operation identifier.key
Timeout duration of the COT operation.duration
Requested transmit tone frequency.freqTX
Requested receive tone frequency.freqRX
The following is sample output from the debugcotdsp command:
Router# debug cot dspRouter#00:10:42:COT:DSP (1/1) Allocated00:10:43:In cot_callback00:10:43: returned key 0xFFF1, status = 000:10:43:COT:Received DSP Q Event00:10:43:COT:DSP (1/1) Done00:10:43:COT:DSP (1/1) De-allocatedThe table below describes the significant fields shown in the display.
Table 5: debug cot dsp Field Descriptions
DescriptionField
Slot and port of the DSP allocated for the COToperation.
DSP (1/1) Allocated
Indicates the COT subsystem received an event fromthe DSP.
Received DSP Q Event
Slot and port of the DSP transitioning to IDLE state.DSP (1/1) Done
Slot and port of the DSP de-allocated after thecompletion of the COT operation.
DSP (1/1) De-allocated
Cisco IOS Debug Command Reference - Commands A through D 65
debug clns esis events through debug dbconn tcpdebug cot
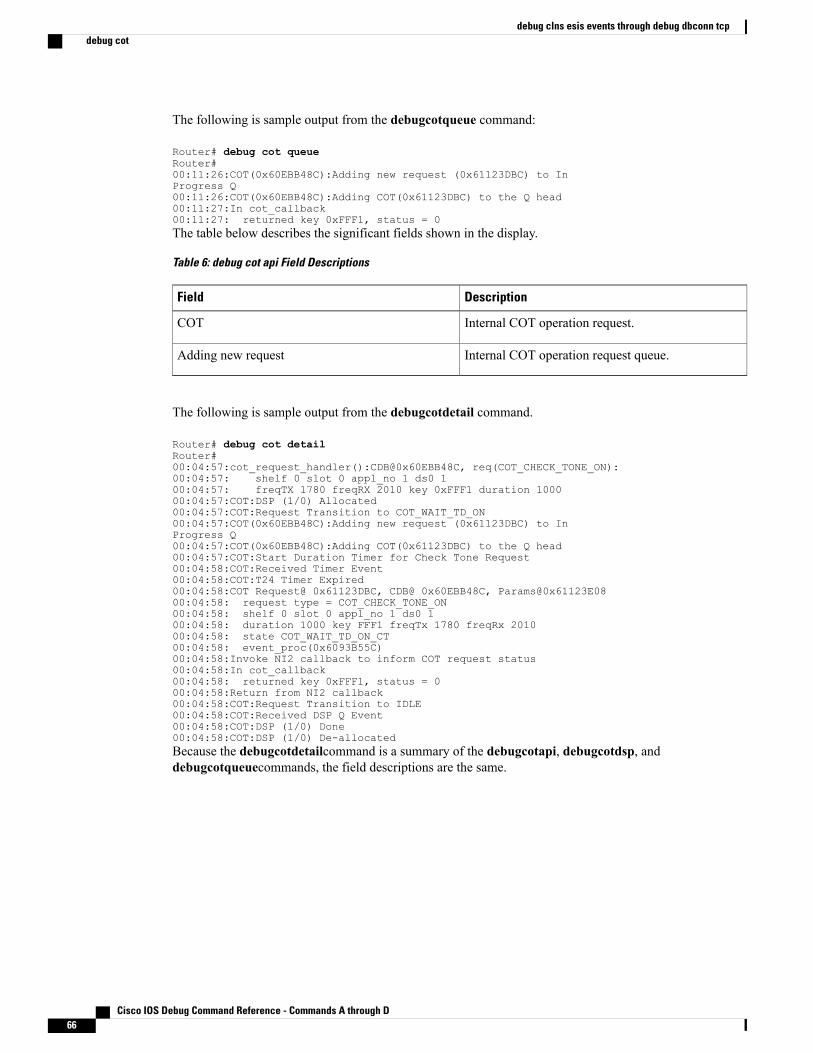
The following is sample output from the debugcotqueue command:
Router# debug cot queueRouter#00:11:26:COT(0x60EBB48C):Adding new request (0x61123DBC) to InProgress Q00:11:26:COT(0x60EBB48C):Adding COT(0x61123DBC) to the Q head00:11:27:In cot_callback00:11:27: returned key 0xFFF1, status = 0The table below describes the significant fields shown in the display.
Table 6: debug cot api Field Descriptions
DescriptionField
Internal COT operation request.COT
Internal COT operation request queue.Adding new request
The following is sample output from the debugcotdetail command.
Router# debug cot detailRouter#00:04:57:cot_request_handler():CDB@0x60EBB48C, req(COT_CHECK_TONE_ON):00:04:57: shelf 0 slot 0 appl_no 1 ds0 100:04:57: freqTX 1780 freqRX 2010 key 0xFFF1 duration 100000:04:57:COT:DSP (1/0) Allocated00:04:57:COT:Request Transition to COT_WAIT_TD_ON00:04:57:COT(0x60EBB48C):Adding new request (0x61123DBC) to InProgress Q00:04:57:COT(0x60EBB48C):Adding COT(0x61123DBC) to the Q head00:04:57:COT:Start Duration Timer for Check Tone Request00:04:58:COT:Received Timer Event00:04:58:COT:T24 Timer Expired00:04:58:COT Request@ 0x61123DBC, CDB@ 0x60EBB48C, Params@0x61123E0800:04:58: request type = COT_CHECK_TONE_ON00:04:58: shelf 0 slot 0 appl_no 1 ds0 100:04:58: duration 1000 key FFF1 freqTx 1780 freqRx 201000:04:58: state COT_WAIT_TD_ON_CT00:04:58: event_proc(0x6093B55C)00:04:58:Invoke NI2 callback to inform COT request status00:04:58:In cot_callback00:04:58: returned key 0xFFF1, status = 000:04:58:Return from NI2 callback00:04:58:COT:Request Transition to IDLE00:04:58:COT:Received DSP Q Event00:04:58:COT:DSP (1/0) Done00:04:58:COT:DSP (1/0) De-allocatedBecause the debugcotdetailcommand is a summary of the debugcotapi, debugcotdsp, anddebugcotqueuecommands, the field descriptions are the same.
Cisco IOS Debug Command Reference - Commands A through D66
debug clns esis events through debug dbconn tcpdebug cot

debug cpp event
Effective with Release 12.3(4)T, the debugcppevent command is no longer available in Cisco IOS 12.3(T)releases.
Note
To display general Combinet Proprietary Protocol (CPP) events, use the debugcppeventcommand in privilegedEXEC mode. The noform of this command disables debugging output.
debug cpp event
no debug cpp event
Syntax Description This command has no arguments or keywords.
Command History ModificationRelease
This command was introduced.11.2
This command is no longer available in Cisco IOS 12.(3)T releases.12.3(4)T
This command was integrated into Cisco IOS Release 12.2(33)SRA.12.2(33)SRA
Usage Guidelines CPP allows a router to engage in negotiation over an ISDNB channel to establish connections with a Combinetbridge.
The debugcppeventcommand displays events such as CPP sequencing, group creation, and keepalives.
Examples One or more of the messages in the table below appear when you use thedebugcppevent command. Eachmessage begins with the short name of the interface the event occurred on (for example, SERIAL0:1 orBRI0:1) and might contain one or more packet sequence numbers or remote site names.
Table 7: debug cpp event Messages
DescriptionMessage
Call was set up on the interface (in this example,BRI0:1).
BRI0:1: negotiation complete
Call timed out.BRI0:1: negotiation timed out
Negotiation packet was sent to set up the call.BRI0:1: sending negotiation packet
Cisco IOS Debug Command Reference - Commands A through D 67
debug clns esis events through debug dbconn tcpdebug cpp event
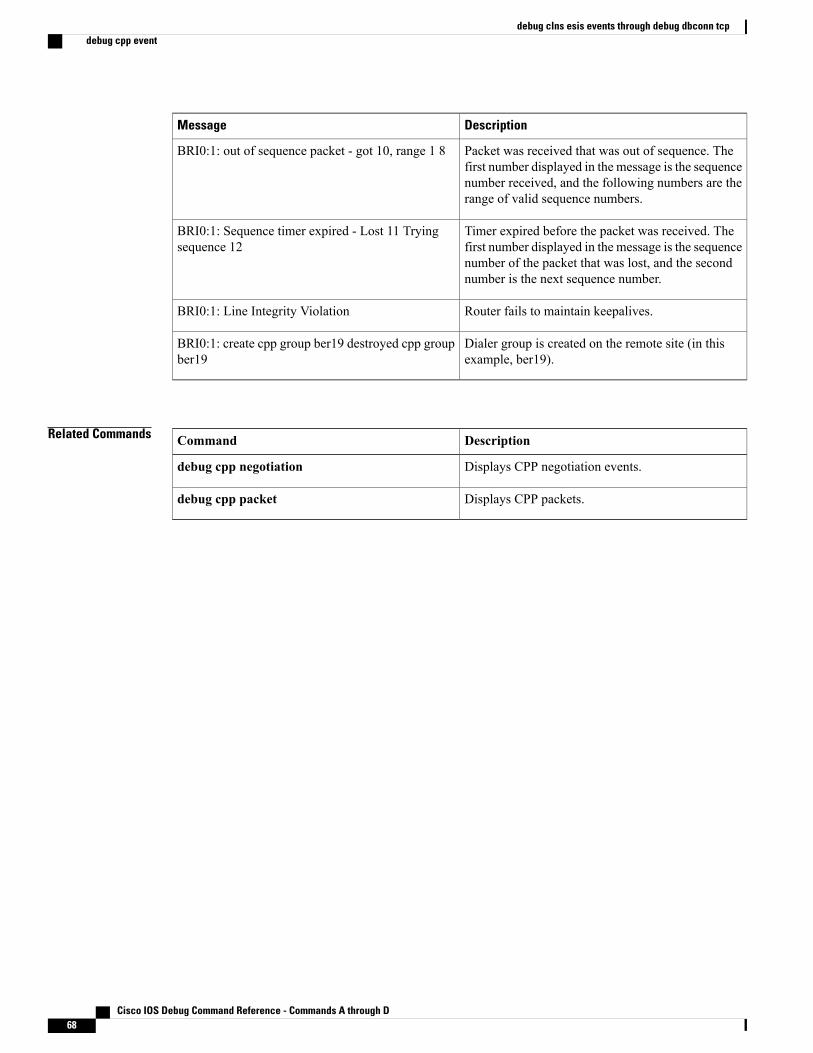
DescriptionMessage
Packet was received that was out of sequence. Thefirst number displayed in the message is the sequencenumber received, and the following numbers are therange of valid sequence numbers.
BRI0:1: out of sequence packet - got 10, range 1 8
Timer expired before the packet was received. Thefirst number displayed in the message is the sequencenumber of the packet that was lost, and the secondnumber is the next sequence number.
BRI0:1: Sequence timer expired - Lost 11 Tryingsequence 12
Router fails to maintain keepalives.BRI0:1: Line Integrity Violation
Dialer group is created on the remote site (in thisexample, ber19).
BRI0:1: create cpp group ber19 destroyed cpp groupber19
Related Commands DescriptionCommand
Displays CPP negotiation events.debug cpp negotiation
Displays CPP packets.debug cpp packet
Cisco IOS Debug Command Reference - Commands A through D68
debug clns esis events through debug dbconn tcpdebug cpp event
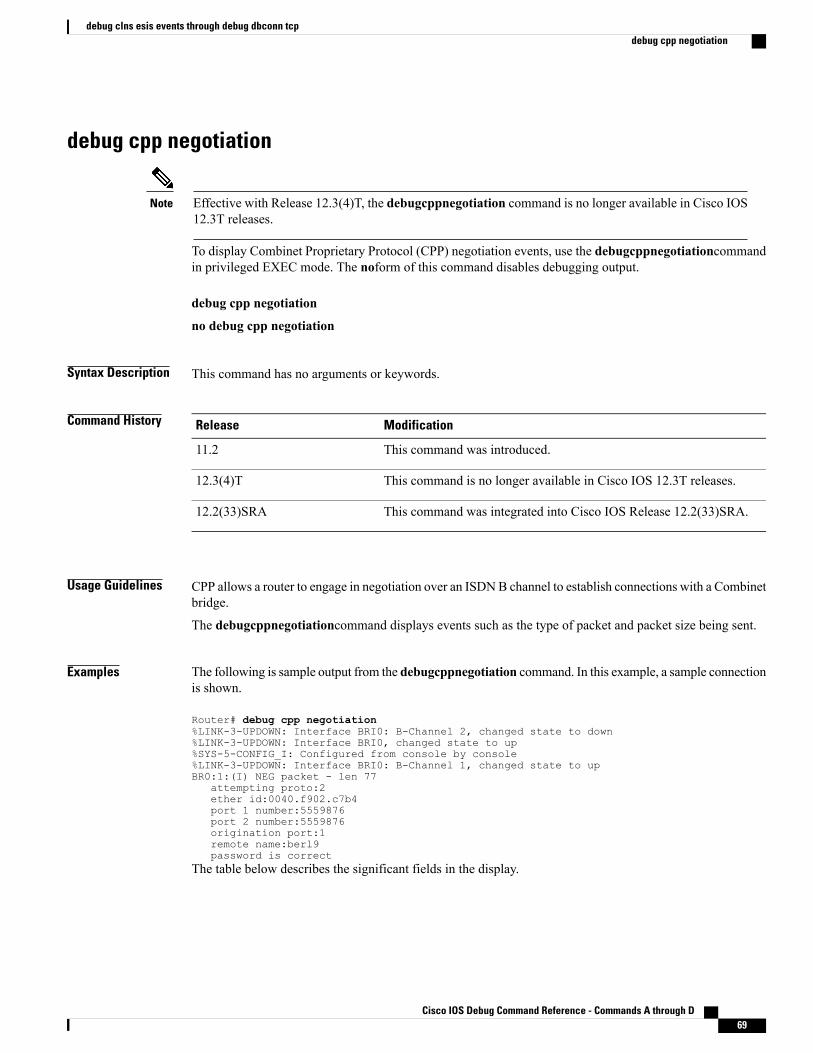
debug cpp negotiation
Effective with Release 12.3(4)T, the debugcppnegotiation command is no longer available in Cisco IOS12.3T releases.
Note
To display Combinet Proprietary Protocol (CPP) negotiation events, use the debugcppnegotiationcommandin privileged EXEC mode. The noform of this command disables debugging output.
debug cpp negotiation
no debug cpp negotiation
Syntax Description This command has no arguments or keywords.
Command History ModificationRelease
This command was introduced.11.2
This command is no longer available in Cisco IOS 12.3T releases.12.3(4)T
This command was integrated into Cisco IOS Release 12.2(33)SRA.12.2(33)SRA
Usage Guidelines CPP allows a router to engage in negotiation over an ISDNB channel to establish connections with a Combinetbridge.
The debugcppnegotiationcommand displays events such as the type of packet and packet size being sent.
Examples The following is sample output from the debugcppnegotiation command. In this example, a sample connectionis shown.
Router# debug cpp negotiation%LINK-3-UPDOWN: Interface BRI0: B-Channel 2, changed state to down%LINK-3-UPDOWN: Interface BRI0, changed state to up%SYS-5-CONFIG_I: Configured from console by console%LINK-3-UPDOWN: Interface BRI0: B-Channel 1, changed state to upBR0:1:(I) NEG packet - len 77
attempting proto:2ether id:0040.f902.c7b4port 1 number:5559876port 2 number:5559876origination port:1remote name:berl9password is correct
The table below describes the significant fields in the display.
Cisco IOS Debug Command Reference - Commands A through D 69
debug clns esis events through debug dbconn tcpdebug cpp negotiation

Table 8: debug CPP negotiation Field Descriptions
DescriptionField
Interface name, packet type, and packet size.BR0:1 (I) NEG packet - len 77
CPP protocol type.attempting proto:
Ethernet address of the destination router.ether id:
ISDN phone number of remote B channel #1.port 1 number:
ISDN phone number of remote B channel #2.port 2 number:
B channel 1 or 2 called.origination port:
Remote site name to which this call is connecting.remote name:
Password is accepted so the connection is established.password is correct
Related Commands DescriptionCommand
Displays information about the COT functionality.debug cot
Displays CPP packets.debug cpp packet
Cisco IOS Debug Command Reference - Commands A through D70
debug clns esis events through debug dbconn tcpdebug cpp negotiation

debug cpp packet
Effective with Release 12.3(4)T, the debugcpppacketcommand is no longer available in Cisco IOS 12.3TReleases.
Note
To display Combinet Proprietary Protocol (CPP) packets, use the debugcpppacketcommand in privilegedEXEC mode. The noform of this command disables debugging output.
debug cpp packet
no debug cpp packet
Syntax Description This command has no arguments or keywords.
Command History ModificationRelease
This command was introduced.11.2
This command is no longer available in Cisco IOS 12.3T releases.12.3(4)T
This command was integrated into Cisco IOS Release 12.2(33)SRA.12.2(33)SRA
Usage Guidelines CPP allows a router to engage in negotiation over an ISDNB channel to establish connections with a Combinetbridge.
The debugcpppacketcommand displays the hexadecimal values of the packets.
Examples The following is sample output from the debugcpppacket command. This example shows the interface name,packet type, packet size, and the hexadecimal values of the packet.
Router# debug cpp packetBR0:1:input packet - len 6000 00 00 00 00 00 00 40 F9 02 C7 B4 08 0.!6 00 0108 00 06 04 00 02 00 40 F9 02 C7 B4 83 6C A1 02!!!Success rate is 80 percent (4/5), round-trip min/avg/max = 64/66/68 msBR0:1 output packet - len 11606 00 00 40 F9 02 C7 B4 00 00 0C 3E 12 3A 08 0045 00 00 64 00 01 00 00 FF 01 72 BB 83 6C A1 01
Related Commands DescriptionCommand
Displays information about the COT functionality.debug cot
Displays CPP negotiation events.debug cpp negotiation
Cisco IOS Debug Command Reference - Commands A through D 71
debug clns esis events through debug dbconn tcpdebug cpp packet

Cisco IOS Debug Command Reference - Commands A through D72
debug clns esis events through debug dbconn tcpdebug cpp packet
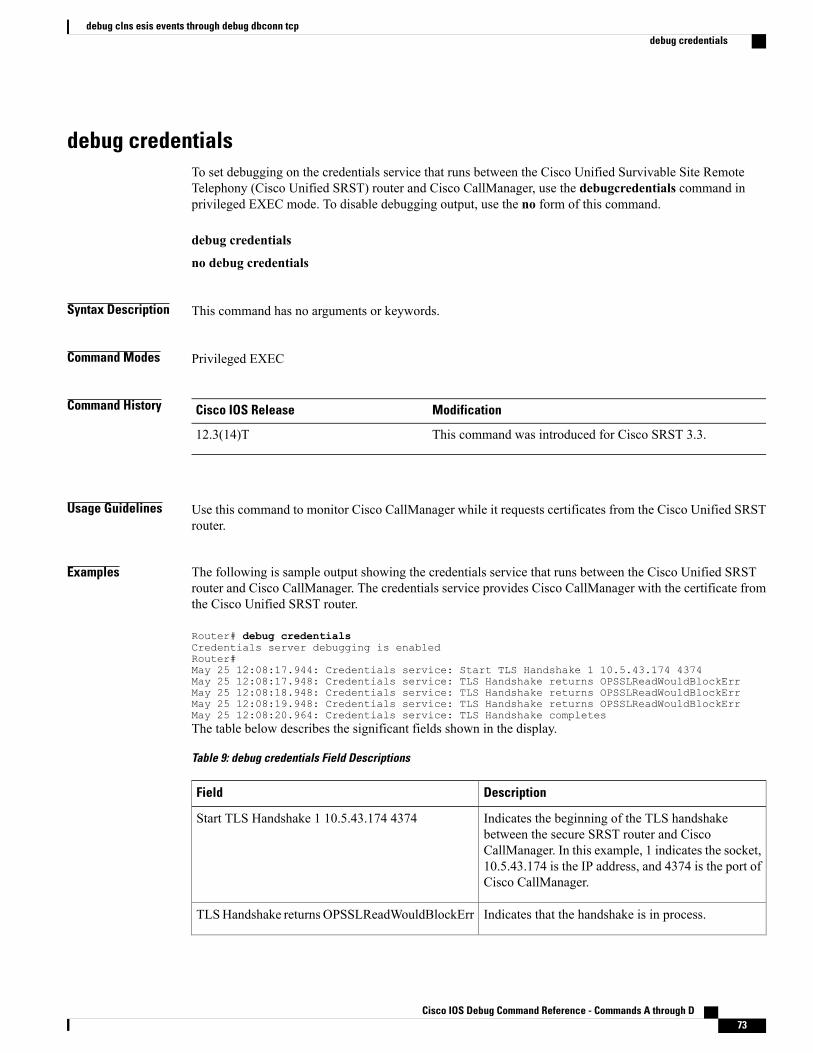
debug credentialsTo set debugging on the credentials service that runs between the Cisco Unified Survivable Site RemoteTelephony (Cisco Unified SRST) router and Cisco CallManager, use the debugcredentials command inprivileged EXEC mode. To disable debugging output, use the no form of this command.
debug credentials
no debug credentials
Syntax Description This command has no arguments or keywords.
Command Modes Privileged EXEC
Command History ModificationCisco IOS Release
This command was introduced for Cisco SRST 3.3.12.3(14)T
Usage Guidelines Use this command to monitor Cisco CallManager while it requests certificates from the Cisco Unified SRSTrouter.
Examples The following is sample output showing the credentials service that runs between the Cisco Unified SRSTrouter and Cisco CallManager. The credentials service provides Cisco CallManager with the certificate fromthe Cisco Unified SRST router.
Router# debug credentialsCredentials server debugging is enabledRouter#May 25 12:08:17.944: Credentials service: Start TLS Handshake 1 10.5.43.174 4374May 25 12:08:17.948: Credentials service: TLS Handshake returns OPSSLReadWouldBlockErrMay 25 12:08:18.948: Credentials service: TLS Handshake returns OPSSLReadWouldBlockErrMay 25 12:08:19.948: Credentials service: TLS Handshake returns OPSSLReadWouldBlockErrMay 25 12:08:20.964: Credentials service: TLS Handshake completesThe table below describes the significant fields shown in the display.
Table 9: debug credentials Field Descriptions
DescriptionField
Indicates the beginning of the TLS handshakebetween the secure SRST router and CiscoCallManager. In this example, 1 indicates the socket,10.5.43.174 is the IP address, and 4374 is the port ofCisco CallManager.
Start TLS Handshake 1 10.5.43.174 4374
Indicates that the handshake is in process.TLSHandshake returns OPSSLReadWouldBlockErr
Cisco IOS Debug Command Reference - Commands A through D 73
debug clns esis events through debug dbconn tcpdebug credentials
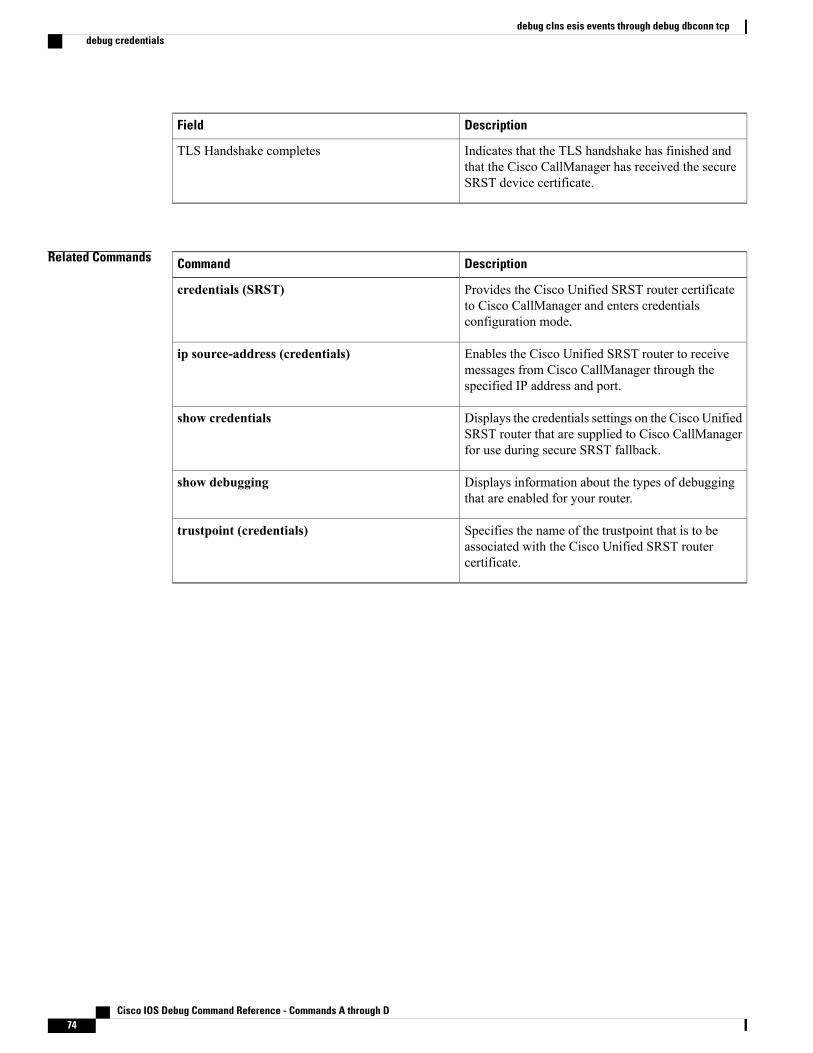
DescriptionField
Indicates that the TLS handshake has finished andthat the Cisco CallManager has received the secureSRST device certificate.
TLS Handshake completes
Related Commands DescriptionCommand
Provides the Cisco Unified SRST router certificateto Cisco CallManager and enters credentialsconfiguration mode.
credentials (SRST)
Enables the Cisco Unified SRST router to receivemessages from Cisco CallManager through thespecified IP address and port.
ip source-address (credentials)
Displays the credentials settings on the Cisco UnifiedSRST router that are supplied to Cisco CallManagerfor use during secure SRST fallback.
show credentials
Displays information about the types of debuggingthat are enabled for your router.
show debugging
Specifies the name of the trustpoint that is to beassociated with the Cisco Unified SRST routercertificate.
trustpoint (credentials)
Cisco IOS Debug Command Reference - Commands A through D74
debug clns esis events through debug dbconn tcpdebug credentials

debug crmTo troubleshoot the Carrier Resource Manager (CRM), use the debugcrm command in privileged EXECmode. To disable debugging output, use the no form of this command.
debug crm [all| default| detail| error [call [informational]| software [informational]]| function| inout]
no debug crm
Syntax Description (Optional) Displays all CRM debugging messages.all
(Optional) Displays detail, error, and inoutinformation. This option also runs if no keywords areadded.
default
(Optional) Displays non-inout information related tocall processing, such as call updates or call acceptancechecking.
detail
(Optional) Displays CRM error messages.error
(Optional) Displays call processing errors.call
(Optional) Displays minor errors and major errors.Without the informational keyword, only majorerrors are displayed.
informational
(Optional) Displays software errors.software
(Optional) Displays CRM function names and exitpoints from each function so that call processing canbe traced within the CRM subsystem.
function
(Optional) Displays information from the functionsthat form the external interfaces of CRM to othermodules or subsystems.
inout
Command Default Debugging is not enabled.
Command Modes Privileged EXEC
Command History ModificationRelease
This command was introduced.12.2(11)T
Cisco IOS Debug Command Reference - Commands A through D 75
debug clns esis events through debug dbconn tcpdebug crm
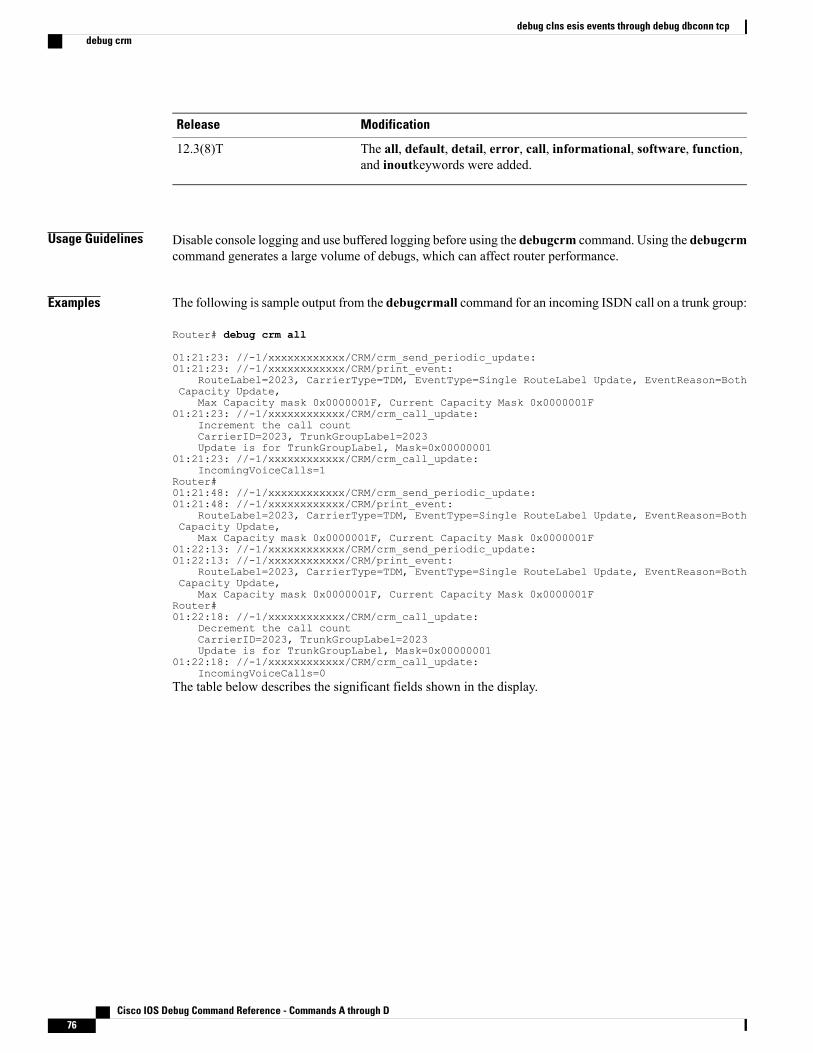
ModificationRelease
The all, default, detail, error, call, informational, software, function,and inoutkeywords were added.
12.3(8)T
Usage Guidelines Disable console logging and use buffered logging before using the debugcrm command. Using the debugcrmcommand generates a large volume of debugs, which can affect router performance.
Examples The following is sample output from the debugcrmall command for an incoming ISDN call on a trunk group:
Router# debug crm all
01:21:23: //-1/xxxxxxxxxxxx/CRM/crm_send_periodic_update:01:21:23: //-1/xxxxxxxxxxxx/CRM/print_event:
RouteLabel=2023, CarrierType=TDM, EventType=Single RouteLabel Update, EventReason=BothCapacity Update,
Max Capacity mask 0x0000001F, Current Capacity Mask 0x0000001F01:21:23: //-1/xxxxxxxxxxxx/CRM/crm_call_update:
Increment the call countCarrierID=2023, TrunkGroupLabel=2023Update is for TrunkGroupLabel, Mask=0x00000001
01:21:23: //-1/xxxxxxxxxxxx/CRM/crm_call_update:IncomingVoiceCalls=1
Router#01:21:48: //-1/xxxxxxxxxxxx/CRM/crm_send_periodic_update:01:21:48: //-1/xxxxxxxxxxxx/CRM/print_event:
RouteLabel=2023, CarrierType=TDM, EventType=Single RouteLabel Update, EventReason=BothCapacity Update,
Max Capacity mask 0x0000001F, Current Capacity Mask 0x0000001F01:22:13: //-1/xxxxxxxxxxxx/CRM/crm_send_periodic_update:01:22:13: //-1/xxxxxxxxxxxx/CRM/print_event:
RouteLabel=2023, CarrierType=TDM, EventType=Single RouteLabel Update, EventReason=BothCapacity Update,
Max Capacity mask 0x0000001F, Current Capacity Mask 0x0000001FRouter#01:22:18: //-1/xxxxxxxxxxxx/CRM/crm_call_update:
Decrement the call countCarrierID=2023, TrunkGroupLabel=2023Update is for TrunkGroupLabel, Mask=0x00000001
01:22:18: //-1/xxxxxxxxxxxx/CRM/crm_call_update:IncomingVoiceCalls=0
The table below describes the significant fields shown in the display.
Cisco IOS Debug Command Reference - Commands A through D76
debug clns esis events through debug dbconn tcpdebug crm
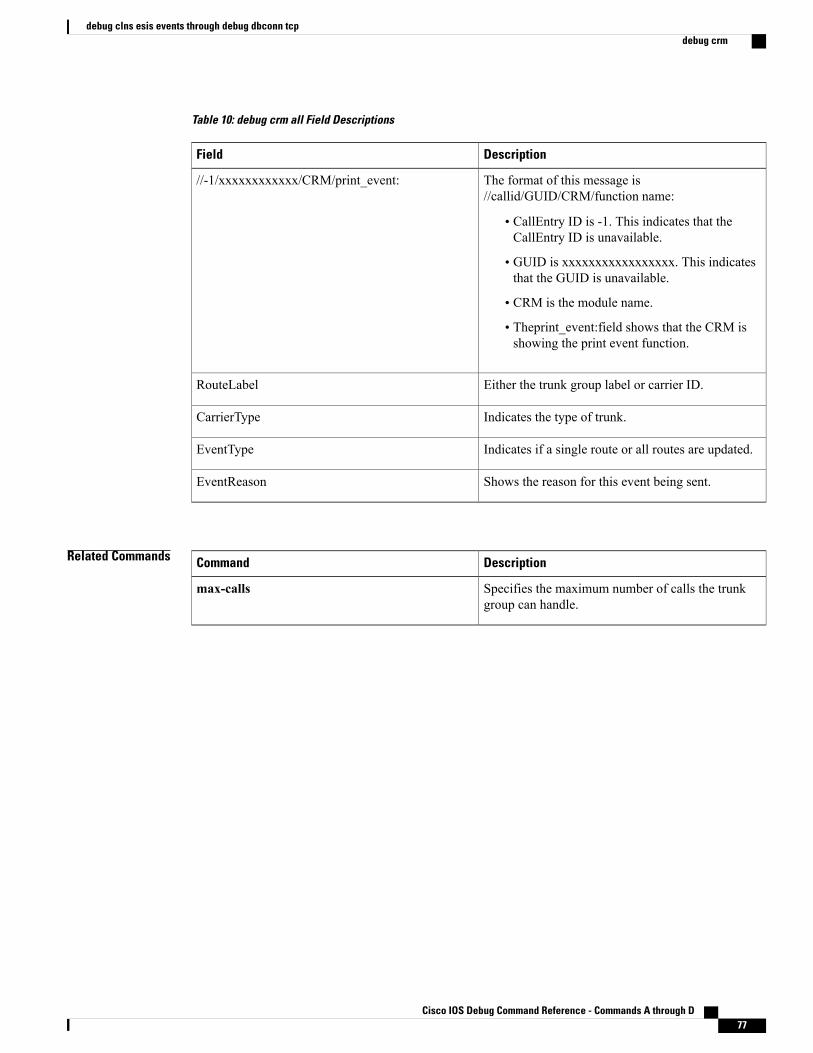
Table 10: debug crm all Field Descriptions
DescriptionField
The format of this message is//callid/GUID/CRM/function name:
• CallEntry ID is -1. This indicates that theCallEntry ID is unavailable.
• GUID is xxxxxxxxxxxxxxxxx. This indicatesthat the GUID is unavailable.
• CRM is the module name.
• Theprint_event:field shows that the CRM isshowing the print event function.
//-1/xxxxxxxxxxxx/CRM/print_event:
Either the trunk group label or carrier ID.RouteLabel
Indicates the type of trunk.CarrierType
Indicates if a single route or all routes are updated.EventType
Shows the reason for this event being sent.EventReason
Related Commands DescriptionCommand
Specifies the maximum number of calls the trunkgroup can handle.
max-calls
Cisco IOS Debug Command Reference - Commands A through D 77
debug clns esis events through debug dbconn tcpdebug crm
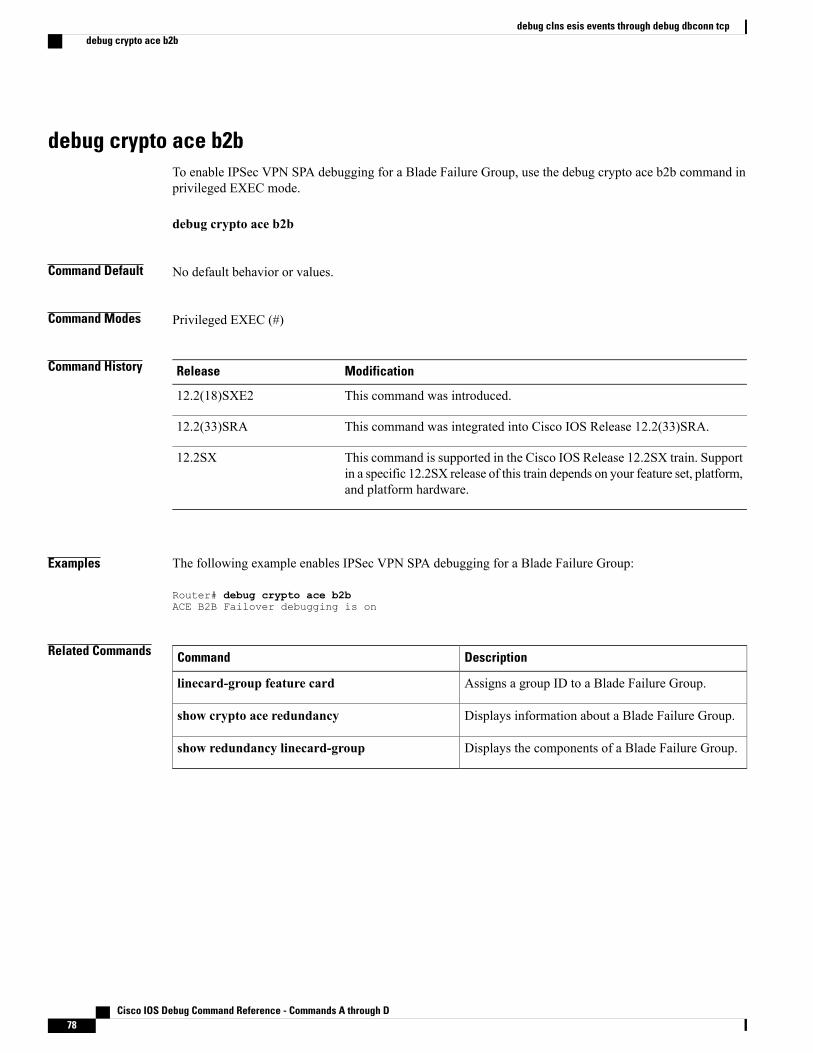
debug crypto ace b2bTo enable IPSec VPN SPA debugging for a Blade Failure Group, use the debug crypto ace b2b command inprivileged EXEC mode.
debug crypto ace b2b
Command Default No default behavior or values.
Command Modes Privileged EXEC (#)
Command History ModificationRelease
This command was introduced.12.2(18)SXE2
This command was integrated into Cisco IOS Release 12.2(33)SRA.12.2(33)SRA
This command is supported in the Cisco IOS Release 12.2SX train. Supportin a specific 12.2SX release of this train depends on your feature set, platform,and platform hardware.
12.2SX
Examples The following example enables IPSec VPN SPA debugging for a Blade Failure Group:
Router# debug crypto ace b2bACE B2B Failover debugging is on
Related Commands DescriptionCommand
Assigns a group ID to a Blade Failure Group.linecard-group feature card
Displays information about a Blade Failure Group.show crypto ace redundancy
Displays the components of a Blade Failure Group.show redundancy linecard-group
Cisco IOS Debug Command Reference - Commands A through D78
debug clns esis events through debug dbconn tcpdebug crypto ace b2b

debug crypto ace bootTo enable ACE boot API debugging, use the debug crypto ace boot command in privileged EXEC mode. Todisable ACE boot API debugging, use the no form of this command.
debug crypto ace boot
no debug crypto ace boot
Syntax Description This command has no arguments or keywords.
Command Default None
Command Modes Privileged EXEC (#)
Command History ModificationRelease
This command was introduced.12.2(33)SXI5
Examples The following example enables ACE boot API debugging:
Router# debug crypto ace bootACE Boot debugging is on
Cisco IOS Debug Command Reference - Commands A through D 79
debug clns esis events through debug dbconn tcpdebug crypto ace boot

debug crypto ace cfgmonTo enable ACE CFGMON transactions debugging, use the debug crypto ace cfgmon command in privilegedEXEC mode. To disable ACE CFGMON transactions debugging, use the no form of this command.
debug crypto ace cfgmon
no debug crypto ace cfgmon
Syntax Description This command has no arguments or keywords.
Command Default None
Command Modes Privileged EXEC (#)
Command History ModificationRelease
This command was introduced.12.2(33)SXI5
Examples The following example enables ACE CFGMON transaction debugging:
Router# debug crypto ace cfgmonACE CFGMON Transactions debugging is on
Cisco IOS Debug Command Reference - Commands A through D80
debug clns esis events through debug dbconn tcpdebug crypto ace cfgmon

debug crypto ace congestion-mgrTo enable ACE Crypto engine congestion manager debugging, use the debug crypto ace congestion-mgrcommand in privileged EXEC mode. To disable ACE Crypto engine congestion manager debugging, use theno form of this command.
debug crypto ace congestion-mgr
no debug crypto ace congestion-mgr
Syntax Description This command has no arguments or keywords.
Command Default None
Command Modes Privileged EXEC (#)
Command History ModificationRelease
This command was introduced.12.2(33)SXI5
Examples The following example enables ACE Crypto engine congestion manager debugging:
Router# debug crypto ace congestion-mgrACE Crypto Engine Congestion Manager debugging is on
Cisco IOS Debug Command Reference - Commands A through D 81
debug clns esis events through debug dbconn tcpdebug crypto ace congestion-mgr

debug crypto ace dpdTo enable ACEDPD debugging, use the debug crypto ace dpd command in privileged EXECmode. To disableACE DPD debugging, use the no form of this command.
debug crypto ace dpd
no debug crypto ace dpd
Syntax Description This command has no arguments or keywords.
Command Default None
Command Modes Privileged EXEC (#)
Command History ModificationRelease
This command was introduced.12.2(33)SXI5
Examples The following example enables ACE DPD debugging:
Router# debug crypto ace dpdACE-DPD debugging is on
Cisco IOS Debug Command Reference - Commands A through D82
debug clns esis events through debug dbconn tcpdebug crypto ace dpd

debug crypto ace errorTo enable error logging debugging, use the debug crypto ace error command in privileged EXEC mode. Todisable ACE error logging debugging, use the no form of this command.
debug crypto ace error
no debug crypto ace error
Syntax Description This command has no arguments or keywords.
Command Default None
Command Modes Privileged EXEC (#)
Command History ModificationRelease
This command was introduced.12.2(33)SXI5
Examples The following example enables error log debugging:
Router# debug crypto ace errorACE Error logging debugging is on
Cisco IOS Debug Command Reference - Commands A through D 83
debug clns esis events through debug dbconn tcpdebug crypto ace error

debug crypto ace hapiTo enable ACE HAPI transactions debugging, use the debug crypto ace hapi command in privileged EXECmode. To disable ACE HAPI transactions debugging, use the no form of this command.
debug crypto ace hapi
no debug crypto ace hapi
Syntax Description This command has no arguments or keywords.
Command Default None
Command Modes Privileged EXEC (#)
Command History ModificationRelease
This command was introduced.12.2(33)SXI5
Examples The following example enables ACE HAPI transaction debugging:
Router# debug crypto ace hapiACE HAPI transactions debugging is on
Cisco IOS Debug Command Reference - Commands A through D84
debug clns esis events through debug dbconn tcpdebug crypto ace hapi

debug crypto ace ikeaTo enable ACE IKEA transactions debugging, use the debug crypto ace ikea command in privileged EXECmode. To disable ACE IKEA transactions debugging, use the no form of this command.
debug crypto ace ikea
no debug crypto ace ikea
Syntax Description This command has no arguments or keywords.
Command Default None
Command Modes Privileged EXEC (#)
Command History ModificationRelease
This command was introduced.12.2(33)SXI5
Examples The following example enables ACE IKEA transaction debugging:
Router# debug crypto ace ikeaACE IKEA transactions debugging is on
Cisco IOS Debug Command Reference - Commands A through D 85
debug clns esis events through debug dbconn tcpdebug crypto ace ikea
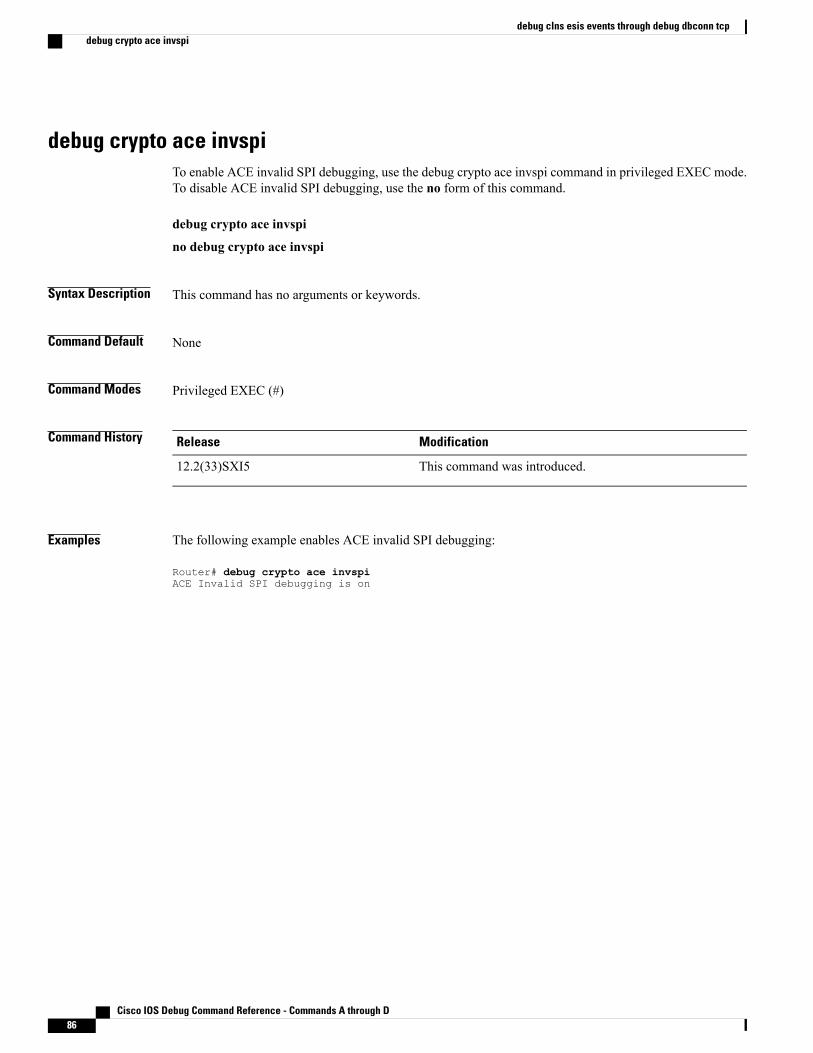
debug crypto ace invspiTo enable ACE invalid SPI debugging, use the debug crypto ace invspi command in privileged EXEC mode.To disable ACE invalid SPI debugging, use the no form of this command.
debug crypto ace invspi
no debug crypto ace invspi
Syntax Description This command has no arguments or keywords.
Command Default None
Command Modes Privileged EXEC (#)
Command History ModificationRelease
This command was introduced.12.2(33)SXI5
Examples The following example enables ACE invalid SPI debugging:
Router# debug crypto ace invspiACE Invalid SPI debugging is on
Cisco IOS Debug Command Reference - Commands A through D86
debug clns esis events through debug dbconn tcpdebug crypto ace invspi

debug crypto ace ipdTo enable ACE IPD debugging, use the debug crypto ace ipd command in privileged EXECmode. To disableACE IPD debugging, use the no form of this command.
debug crypto ace ipd
no debug crypto ace ipd
Syntax Description This command has no arguments or keywords.
Command Default None
Command Modes Privileged EXEC (#)
Command History ModificationRelease
This command was introduced.12.2(33)SXI5
Examples The following example enables ACE IPD debugging:
Router# debug crypto ace ipdACE IPD debugging is on
Cisco IOS Debug Command Reference - Commands A through D 87
debug clns esis events through debug dbconn tcpdebug crypto ace ipd

debug crypto ace maceTo enable multi-ACE messages debugging, use the debug crypto ace mace command in privileged EXECmode. To disable multi-ACE messages debugging, use the no form of this command.
debug crypto ace mace
no debug crypto ace mace
Syntax Description This command has no arguments or keywords.
Command Default None
Command Modes Privileged EXEC (#)
Command History ModificationRelease
This command was introduced.12.2(33)SXI5
Examples The following example enables multi-ACE debugging:
Router# debug crypto ace maceMULTI-ACE messages debugging is on
Cisco IOS Debug Command Reference - Commands A through D88
debug clns esis events through debug dbconn tcpdebug crypto ace mace
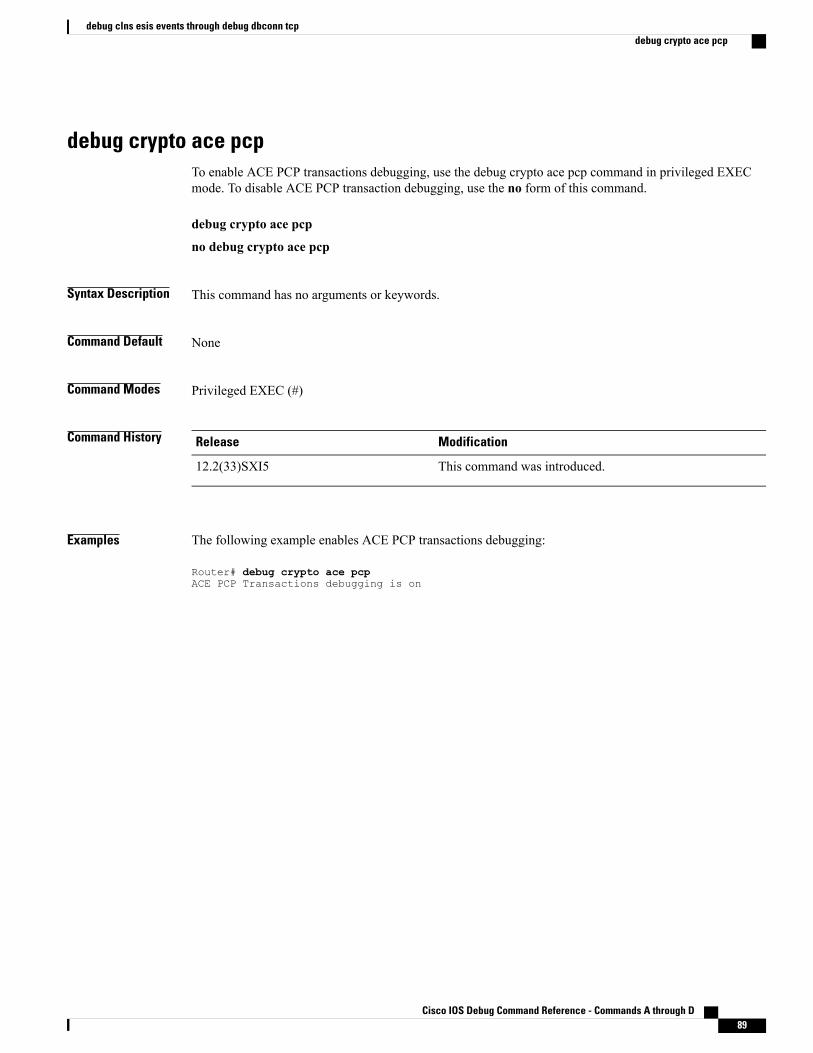
debug crypto ace pcpTo enable ACE PCP transactions debugging, use the debug crypto ace pcp command in privileged EXECmode. To disable ACE PCP transaction debugging, use the no form of this command.
debug crypto ace pcp
no debug crypto ace pcp
Syntax Description This command has no arguments or keywords.
Command Default None
Command Modes Privileged EXEC (#)
Command History ModificationRelease
This command was introduced.12.2(33)SXI5
Examples The following example enables ACE PCP transactions debugging:
Router# debug crypto ace pcpACE PCP Transactions debugging is on
Cisco IOS Debug Command Reference - Commands A through D 89
debug clns esis events through debug dbconn tcpdebug crypto ace pcp

debug crypto ace poloTo enable ACE policy loader debugging, use the debug crypto ace polo command in privileged EXEC mode.To disable ACE policy loader debugging, use the no form of this command.
debug crypto ace polo
no debug crypto ace polo
Syntax Description This command has no arguments or keywords.
Command Default None
Command Modes Privileged EXEC (#)
Command History ModificationRelease
This command was introduced.12.2(33)SXI5
Examples The following example enables ACE policy loader debugging:
Router# debug crypto ace poloACE Policy Loader debugging is on
Cisco IOS Debug Command Reference - Commands A through D90
debug clns esis events through debug dbconn tcpdebug crypto ace polo

debug crypto ace propcfgTo enable ACE propagate configuration debugging, use the debug crypto ace propcfg command in privilegedEXEC mode. To disable ACE propagate configuration debugging, use the no form of this command.
debug crypto ace propcfg
no debug crypto ace propcfg
Syntax Description This command has no arguments or keywords.
Command Default None
Command Modes Privileged EXEC (#)
Command History ModificationRelease
This command was introduced.12.2(33)SXI5
Examples The following example enables ACE propagate configuration debugging:
Router# debug crypto ace propcfgACE Propagate Config debugging is on
Cisco IOS Debug Command Reference - Commands A through D 91
debug clns esis events through debug dbconn tcpdebug crypto ace propcfg

debug crypto ace qosTo enable ACEQoS debugging, use the debug crypto ace qos command in privileged EXECmode. To disableACE QoS debugging, use the no form of this command.
debug crypto ace qos
no debug crypto ace qos
Syntax Description This command has no arguments or keywords.
Command Default None
Command Modes Privileged EXEC (#)
Command History ModificationRelease
This command was introduced.12.2(33)SXI5
Examples The following example enables ACE QoS debugging:
Router# debug crypto ace qosACE QoS debugging is on
Cisco IOS Debug Command Reference - Commands A through D92
debug clns esis events through debug dbconn tcpdebug crypto ace qos

debug crypto ace rconTo enable ACE RCON messages debugging, use the debug crypto ace rcon command in privileged EXECmode. To disable ACE RCON messages debugging, use the no form of this command.
debug crypto ace rcon
no debug crypto ace rcon
Syntax Description This command has no arguments or keywords.
Command Default None
Command Modes Privileged EXEC (#)
Command History ModificationRelease
This command was introduced.12.2(33)SXI5
Examples The following example enables ACE RCON messages debugging:
Router# debug crypto ace rconACE RCON messages debugging is on
Cisco IOS Debug Command Reference - Commands A through D 93
debug clns esis events through debug dbconn tcpdebug crypto ace rcon

debug crypto ace redundancyTo enable ACE HA debugging, use the debug crypto ace redundancy command in privileged EXEC mode.To disable ACE HA debugging, use the no form of this command.
debug crypto ace redundancy
no debug crypto ace redundancy
Syntax Description This command has no arguments or keywords.
Command Default None
Command Modes Privileged EXEC (#)
Command History ModificationRelease
This command was introduced.12.2(33)SXI5
Examples The following example enables ACE HA debugging:
Router# debug crypto ace redundancyACE HA debugging is on
Cisco IOS Debug Command Reference - Commands A through D94
debug clns esis events through debug dbconn tcpdebug crypto ace redundancy

debug crypto ace spiTo enable ACE SPI debugging, use the debug crypto ace spi command in privileged EXEC mode. To disableACE SPI debugging, use the no form of this command.
debug crypto ace spi
no debug crypto ace spi
Syntax Description This command has no arguments or keywords.
Command Default None
Command Modes Privileged EXEC (#)
Command History ModificationRelease
This command was introduced.12.2(33)SXI5
Examples The following example enables ACE SPI debugging:
Router# debug crypto ace spiACE SPI debugging is on
Cisco IOS Debug Command Reference - Commands A through D 95
debug clns esis events through debug dbconn tcpdebug crypto ace spi

debug crypto ace statsTo enable ACE stats module debugging, use the debug crypto ace stats command in privileged EXEC mode.To disable ACE stats module debugging, use the no form of this command.
debug crypto ace stats
no debug crypto ace stats
Syntax Description This command has no arguments or keywords.
Command Default None
Command Modes Privileged EXEC (#)
Command History ModificationRelease
This command was introduced.12.2(33)SXI5
Examples The following example enables ACE stats module debugging:
Router# debug crypto ace statsACE Stats Module debugging is on
Cisco IOS Debug Command Reference - Commands A through D96
debug clns esis events through debug dbconn tcpdebug crypto ace stats

debug crypto ace syslogTo enable ACE syslog messages debugging, use the debug crypto ace syslog command in privileged EXECmode. To disable ACE syslog messages debugging, use the no form of this command.
debug crypto ace syslog
no debug crypto ace syslog
Syntax Description This command has no arguments or keywords.
Command Default None
Command Modes Privileged EXEC (#)
Command History ModificationRelease
This command was introduced.12.2(33)SXI5
Examples The following example enables ACE syslog messages debugging:
Router# debug crypto ace syslogACE Syslog messages debugging is on
Cisco IOS Debug Command Reference - Commands A through D 97
debug clns esis events through debug dbconn tcpdebug crypto ace syslog

debug crypto ace tftpTo enable ACE TFTP boot debugging, use the debug crypto ace tftp command in privileged EXEC mode.To disable ACE TFTP boot debugging, use the no form of this command.
debug crypto ace tftp
no debug crypto ace tftp
Syntax Description This command has no arguments or keywords.
Command Default None
Command Modes Privileged EXEC (#)
Command History ModificationRelease
This command was introduced.12.2(33)SXI5
Examples The following example enables ACE TFTP boot debugging:
Router# debug crypto ace tftpACE TFTP Boot debugging is on
Cisco IOS Debug Command Reference - Commands A through D98
debug clns esis events through debug dbconn tcpdebug crypto ace tftp

debug crypto ace topnTo enable ACE-TOPN-HELPER debugging, use the debug crypto ace topn command in privileged EXECmode. To disable ACE-TOPN-HELPER debugging, use the no form of this command.
debug crypto ace topn
no debug crypto ace topn
Syntax Description This command has no arguments or keywords.
Command Default None
Command Modes Privileged EXEC (#)
Command History ModificationRelease
This command was introduced.12.2(33)SXI5
Examples The following example enables ACE-TOPN-HELPER debugging:
Router# debug crypto ace topnACE-TOPN-HELPER debugging is on
Cisco IOS Debug Command Reference - Commands A through D 99
debug clns esis events through debug dbconn tcpdebug crypto ace topn

debug crypto ace warningTo enable ACE warning log debugging, use the debug crypto ace warning command in privileged EXECmode. To disable ACE warning logging debugging, use the no form of this command.
debug crypto ace warning
no debug crypto ace warning
Syntax Description This command has no arguments or keywords.
Command Default None
Command Modes Privileged EXEC (#)
Command History ModificationRelease
This command was introduced.12.2(33)SXI5
Examples The following example enables ACE warning log debugging:
Router# debug crypto ace warningACE Warning logging debugging is on
Cisco IOS Debug Command Reference - Commands A through D100
debug clns esis events through debug dbconn tcpdebug crypto ace warning
debug crypto condition unmatchedTo display crypto conditional debug messages when context information is unavailable to check against debugconditions, use the debugcryptoconditionunmatchedcommand in privileged EXEC mode. To disabledebugging, use the no form of this command.
debug crypto condition unmatched [isakmp| ipsec| ikev2| engine| gdoi-group]
no debug crypto condition unmatched [isakmp| ipsec| ikev2| engine| gdoi-group]
Syntax Description (Optional) One or more of these keywords can beenabled to display debug messages for the specifiedareas. If none of these keywords are entered, debugmessages for all crypto areas will be shown.
isakmp | ipsec | ikev2 | engine | gdoi-group
Command Default Debug messages that do not have context information to match any debug conditions (filters) will not beprinted.
Command Modes Privileged EXEC
Command History ModificationRelease
This command was introduced.12.3(2)T
This command was integrated into Cisco IOS Release 12.2(18)SXD.12.2(18)SXD
This command was modified. The gdoi-group keyword was replacedby the groupkeyword of thedebugcryptogdoiconditioncommand.
15.1(3)T
This command was integrated into Cisco IOS XE Release 3.8S.Cisco IOS XE Release 3.8S
Usage Guidelines After the debugcryptocondition command has been enabled, you can use thedebugcryptoconditionunmatched command to define whether the debug output is being printed when nocontext information is available in the code to check against the debug filters. For example, if the cryptoengine’s connection-ID is the filter that the debug conditions are being checked against, thedebugcryptoconditionunmatched command displays debug messages in the early negotiation phase whena connection-ID is unavailable to check against debug conditions.
Examples The following example shows how to enable debug messages for all crypto-related areas:
Router# debug crypto condition unmatched
Cisco IOS Debug Command Reference - Commands A through D 101
debug clns esis events through debug dbconn tcpdebug crypto condition unmatched

Related Commands DescriptionCommand
Defines conditional debug filters for GDOI.debug crypto gdoi condition
Defines conditional debug filters.debug crypto condition
Displays crypto debug conditions that have alreadybeen enabled in the router.
show crypto debug-condition
Displays the settings used by current SAs.show crypto ipsec sa
Displays all current IKE SAs at a peer.show crypto isakmp sa
Cisco IOS Debug Command Reference - Commands A through D102
debug clns esis events through debug dbconn tcpdebug crypto condition unmatched

debug crypto ctcpTo display information about a Cisco Tunnel Control Protocol (cTCP) session, use thedebugcryptoctcpcommand in privileged EXECmode. To turn off debugging, use the no form of this command.
debug crypto ctcp
no debug crypto ctcp
Syntax Description This command has no arguments or keywords.
Command Default Debugging is turned off.
Command Modes Privileged EXEC (#)
Command History ModificationRelease
This command was introduced.12.4(9)T
This command is supported in the Cisco IOS Release 12.2SX train. Support ina specific 12.2SX release of this train depends on your feature set, platform,and platform hardware.
12.2SX
Usage Guidelines You can use this command if a cTCP session fails to come up.
Examples The following example shows that debugging has been turned on for a cTCP session:
Router# debug crypto ctcp
Related Commands DescriptionCommand
Configures cTCP encapsulation for Easy VPN.crypto ctcp
Cisco IOS Debug Command Reference - Commands A through D 103
debug clns esis events through debug dbconn tcpdebug crypto ctcp
debug crypto engineTo display debugging messages about crypto engines, which perform encryption and decryption, use thedebugcryptoengine command in privileged EXEC mode. To disable debugging output, use the no form ofthis command.
debug crypto engine
no debug crypto engine
Syntax Description This command has no arguments or keywords.
Command Modes Privileged EXEC
Command History ModificationRelease
This command was introduced.12.0
This command was integrated into Cisco IOS Release 12.2(33)SRA.12.2(33)SRA
Usage Guidelines Use the debug crypto engine command to display information pertaining to the crypto engine, such as whenCisco IOS software is performing encryption or decryption operations.
The crypto engine is the actual mechanism that performs encryption and decryption. A crypto engine can besoftware or a hardware accelerator. Some platforms can have multiple crypto engines; therefore, the routerwill have multiple hardware accelerators.
Examples The following is sample output from the debugcryptoengine command. The first sample output showsmessages from a router that successfully generates Rivest, Shamir, and Adelma (RSA) keys. The secondsample output shows messages from a router that decrypts the RSA key during Internet Key Exchange (IKE)negotiation.
Router# debug crypto engine00:25:13:CryptoEngine0:generate key pair00:25:13:CryptoEngine0:CRYPTO_GEN_KEY_PAIR00:25:13:CRYPTO_ENGINE:key process suspended and continued00:25:14:CRYPTO_ENGINE:key process suspended and continuedcrRouter# debug crypto engine00:27:45:%SYS-5-CONFIG_I:Configured from console by console00:27:51:CryptoEngine0:generate alg parameter00:27:51:CRYPTO_ENGINE:Dh phase 1 status:000:27:51:CRYPTO_ENGINE:Dh phase 1 status:000:27:51:CryptoEngine0:generate alg parameter00:27:52:CryptoEngine0:calculate pkey hmac for conn id 000:27:52:CryptoEngine0:create ISAKMP SKEYID for conn id 100:27:52:Crypto engine 0:RSA decrypt with public key00:27:52:CryptoEngine0:CRYPTO_RSA_PUB_DECRYPT00:27:52:CryptoEngine0:generate hmac context for conn id 100:27:52:CryptoEngine0:generate hmac context for conn id 100:27:52:Crypto engine 0:RSA encrypt with private key
Cisco IOS Debug Command Reference - Commands A through D104
debug clns esis events through debug dbconn tcpdebug crypto engine

00:27:52:CryptoEngine0:CRYPTO_RSA_PRIV_ENCRYPT00:27:53:CryptoEngine0:clear dh number for conn id 100:27:53:CryptoEngine0:generate hmac context for conn id 100:27:53:validate proposal 000:27:53:validate proposal request 000:27:54:CryptoEngine0:generate hmac context for conn id 100:27:54:CryptoEngine0:generate hmac context for conn id 100:27:54:ipsec allocate flow 000:27:54:ipsec allocate flow 0
Related Commands DescriptionCommand
Generates RSA key pairs.crypto key generate rsa
Cisco IOS Debug Command Reference - Commands A through D 105
debug clns esis events through debug dbconn tcpdebug crypto engine
debug crypto engine accelerator logsTo enable logging of commands and associated parameters sent from the virtual private network (VPN)module driver to the VPN module hardware using a debug flag, use thedebugcryptoengineacceleratorlogscommand in privileged EXEC mode. To disable debugging output, usethe no form of this command.
debug crypto engine accelerator logs
no debug crypto engine accelerator logs
Syntax Description This command has no arguments or keywords.
Command Default The logging of commands sent from the VPN module driver to the VPN module hardware is disabled.
Command Modes Privileged EXEC
Command History ModificationRelease
This commandwas introduced on the Cisco 1720 and Cisco 1750 routers.12.1(1)XC
This command was integrated into Cisco IOS Release 12.2(33)SRA.12.2(33)SRA
Usage Guidelines Use the debugcryptoengineacceleratorlogscommand when encryption traffic is sent to the router and aproblem with the encryption module is suspected.
This command is intended only for Cisco TAC personnel to collect debugging information.
Examples The debugcryptoengineacceleratorlogs command uses a debug flag to log commands and associatedparameters sent from the VPN module driver to the VPN module hardware as follows:
Router# debug crypto engine accelerator logsencryption module logs debugging is on
Related Commands DescriptionCommand
Enables or disables the crypto engine accelerator ifit exists.
crypto engine accelerator
Prints information about the last 32 CGX Librarypacket processing commands, and associatedparameters sent from the VPN module driver to theVPN module hardware.
show crypto engine accelerator logs
Cisco IOS Debug Command Reference - Commands A through D106
debug clns esis events through debug dbconn tcpdebug crypto engine accelerator logs
DescriptionCommand
Prints active (in-use) entries in the platform-specificVPN module database.
show crypto engine accelerator sa-database
Displays the Cisco IOS crypto engine of your router.show crypto engine configuration
Cisco IOS Debug Command Reference - Commands A through D 107
debug clns esis events through debug dbconn tcpdebug crypto engine accelerator logs

debug crypto engine ism-vpnTo enable debugging for a Cisco VPN Internal Service Module (ISM), use the debug crypto engine ism-vpncommand in privileged EXEC mode. To disable debugging, use the no form of this command.
debug crypto engine ism-vpn[init| interrupt| polo[detail| dump]| shim[detail]| tftp]
no debug crypto engine ism-vpn[init| interrupt| polo[detail| dump]| shim[detail]| tftp]
Syntax Description (Optional) Enables initial state (INIT state) debugging for an Application ControlEngine (ACE) appliance in Cisco VPN ISM.
init
(Optional) Enables interrupt service debugging.interrupt
(Optional) Enables VPN ISM polo debugging.polo
(Optional) Enables detailed debugging.detail
(Optional) Enables packet dump polo debugging.dump
(Optional) Enables VPN ISM shim layer debugging.shim
(Optional) Enables debugging for TFTP download or upload on the Cisco VPNISM.
tftp
Command Default Cisco VPN ISM debugging is not enabled.
Command Modes Privileged EXEC (#)
Command History ModificationRelease
This command was introduced.15.3(2)T
Examples The following example shows how to enable initial state (INIT state) debugging.Device# debug crypto engine ism-vpn initINIT debugging is on
Related Commands DescriptionCommand
Enables debugging for Cisco VPN ISM SSL.debug crypto engine ism-vpn ssl
Cisco IOS Debug Command Reference - Commands A through D108
debug clns esis events through debug dbconn tcpdebug crypto engine ism-vpn

DescriptionCommand
Enables debugging for Cisco VPN ISM traffic.debug crypto engine ism-vpn traffic
Enables debugging for specific traffic in a Cisco VPNISM.
debug crypto engine ism-vpn traffic selector
Displays IPsec encryption statistics and error countersfor the onboard hardware accelerator of a device, theIPsec VPN SPA, or the Cisco VPN ISM.
show crypto engine accelerator statistic
Cisco IOS Debug Command Reference - Commands A through D 109
debug clns esis events through debug dbconn tcpdebug crypto engine ism-vpn

debug crypto engine ism-vpn sslTo enable debugging for Secure Sockets Layer (SSL) in a Cisco VPN Internal Service Module (VPN ISM),use the debug crypto engine ism-vpn ssl command in privileged EXEC mode. To disable debugging, usethe no form of this command.
debug crypto engine ism-vpn ssl{context rule-number session-id| direction number}
no debug crypto engine ism-vpn ssl{context rule-number session-id| direction number}
Syntax Description Enables debugging for a specific SSL depending on the rule or the session. Therange for the rule number is from 1 to 10. The range for the session ID is 0 to4294967294.
context rule-numbersession-id
Enables debugging for packets that are in the inbound or outbound direction.The range for the direction number is from 0 to 3, where 0 indicates the inboundand outbound direction, 1 indicates encryption , 2 indicates decryption, and 3indicates exceptions.
direction number
Command Default Cisco VPN ISM SSL debugging is not enabled.
Command Modes Privileged EXEC (#)
Command History ModificationRelease
This command was introduced.15.3(2)T
Examples The following example shows how to enable debugging of rule 3 and context 1:Device# debug crypto engine ism-vpn ssl context 3 1ISM-VPN Enable rule 3, ctx: 1
ISM-VPN SSL Context debugging is on
Related Commands DescriptionCommand
Enables debugging for a Cisco VPN ISM.debug crypto engine ism-vpn
Enables debugging for Cisco VPN ISM traffic.debug crypto engine ism-vpn traffic
Enables debugging for specific traffic in a Cisco VPNISM.
debug crypto engine ism-vpn traffic selector
Cisco IOS Debug Command Reference - Commands A through D110
debug clns esis events through debug dbconn tcpdebug crypto engine ism-vpn ssl

DescriptionCommand
Displays IPsec encryption statistics and error countersfor the onboard hardware accelerator of a device, theIPsec VPN SPA, or Cisco VPN ISM.
show crypto engine accelerator statistic
Cisco IOS Debug Command Reference - Commands A through D 111
debug clns esis events through debug dbconn tcpdebug crypto engine ism-vpn ssl
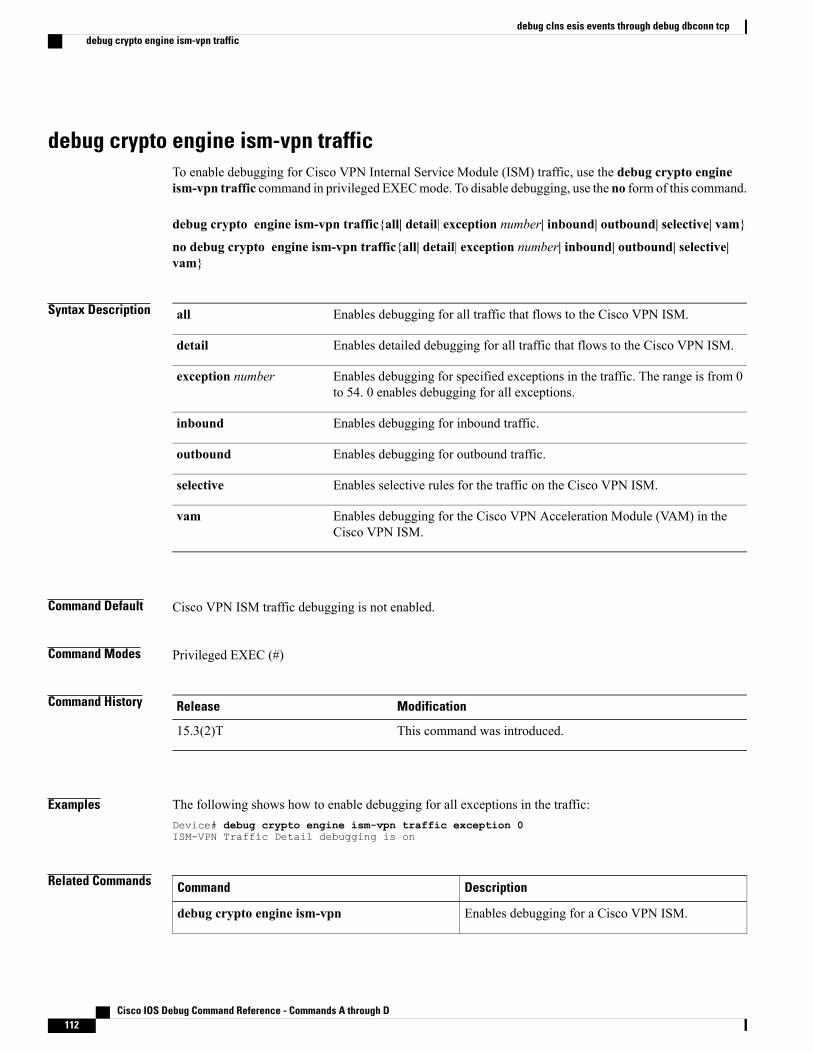
debug crypto engine ism-vpn trafficTo enable debugging for Cisco VPN Internal Service Module (ISM) traffic, use the debug crypto engineism-vpn traffic command in privileged EXECmode. To disable debugging, use the no form of this command.
debug crypto engine ism-vpn traffic{all| detail| exception number| inbound| outbound| selective| vam}
no debug crypto engine ism-vpn traffic{all| detail| exception number| inbound| outbound| selective|vam}
Syntax Description Enables debugging for all traffic that flows to the Cisco VPN ISM.all
Enables detailed debugging for all traffic that flows to the Cisco VPN ISM.detail
Enables debugging for specified exceptions in the traffic. The range is from 0to 54. 0 enables debugging for all exceptions.
exception number
Enables debugging for inbound traffic.inbound
Enables debugging for outbound traffic.outbound
Enables selective rules for the traffic on the Cisco VPN ISM.selective
Enables debugging for the Cisco VPN Acceleration Module (VAM) in theCisco VPN ISM.
vam
Command Default Cisco VPN ISM traffic debugging is not enabled.
Command Modes Privileged EXEC (#)
Command History ModificationRelease
This command was introduced.15.3(2)T
Examples The following shows how to enable debugging for all exceptions in the traffic:Device# debug crypto engine ism-vpn traffic exception 0ISM-VPN Traffic Detail debugging is on
Related Commands DescriptionCommand
Enables debugging for a Cisco VPN ISM.debug crypto engine ism-vpn
Cisco IOS Debug Command Reference - Commands A through D112
debug clns esis events through debug dbconn tcpdebug crypto engine ism-vpn traffic

DescriptionCommand
Enables debugging for specific traffic in a Cisco VPNISM.
debug crypto engine ism-vpn traffic selector
Enables debugging for Cisco VPN ISM SSL.debug crypto engine ism-vpn ssl
Displays IPsec encryption statistics and error countersfor the onboard hardware accelerator of a device, theIPsec VPN SPA, or the Cisco VPN ISM.
show crypto engine accelerator statistic
Cisco IOS Debug Command Reference - Commands A through D 113
debug clns esis events through debug dbconn tcpdebug crypto engine ism-vpn traffic

debug crypto engine ism-vpn traffic selectorTo enable debug rules for specific traffic in Cisco VPN Internal Service Module (ISM), use the debug cryptoengine ism-vpn traffic selector command in privileged EXEC mode. To disable debugging, use the no formof this command.
debug crypto engine ism-vpn traffic selector{ipv4| ipv6}{disable rule-number| enable rule-numbersource-ip-address source-address-mask destination-ip-address destination-address-mask protocols}
no debug crypto engine ism-vpn traffic selector{ipv4| ipv6}{disable rule-number| enable rule-numbersource-ip-address source-address-mask destination-ip-address destination-address-mask protocols}
Syntax Description Enables debugging rules for IPv4 addresses.ipv4
Enables debugging rules for IPv6 addresses.ipv6
Enables debugging rules are disabled.disable
Enables debugging rules are enabled.enable
A specific rule. The range is from 1 to 10.rule-number
Source IP address and network mask of the traffic for whichrules must be enabled or disabled.
source-ip-address source-address-mask
Destination IP address and network mask of the traffic forwhich rules must be enabled or disabled.
destination-ip-address destination-address-mask
Protocols in the source and destination IP addresses of thetraffic for which rules must be enabled or disabled. Therange is from 0 to 155. 0 denotes all protocols.
protocols
Command Default Cisco VPN ISM selective traffic debugging is not enabled.
Command Modes Privileged EXEC (#)
Command History ModificationRelease
This command was introduced.15.3(2)T
Cisco IOS Debug Command Reference - Commands A through D114
debug clns esis events through debug dbconn tcpdebug crypto engine ism-vpn traffic selector

Examples The following example shows how to enable the debugging of rule 0 for all protocols from source address10.0.0.1 255.255.255.0 and destination address 10.0.0.2 255.255.255.0:Device# debug crypto engine ism-vpn traffic selector enable 0 10.0.0.1 255.255.255.0 10.0.0.2255.255.255.0 1ISM-VPN Enable rule 0, s: 10.0.0.1 d: 10.0.0.2 p: 1
Related Commands DescriptionCommand
Enables debugging for a Cisco VPN ISM.debug crypto engine ism-vpn
Enables debugging for Cisco VPN ISM traffic.debug crypto engine ism-vpn traffic
Enables debugging for Cisco VPN ISM SSL.debug crypto engine ism-vpn ssl
Displays IPsec encryption statistics and error countersfor the onboard hardware accelerator of a device, theIPsec VPN SPA, or Cisco VPN ISM.
show crypto engine accelerator statistic
Cisco IOS Debug Command Reference - Commands A through D 115
debug clns esis events through debug dbconn tcpdebug crypto engine ism-vpn traffic selector

debug crypto errorTo enable error debugging for a crypto area, use the debugcryptoerrorcommand in privileged EXEC mode.To disable crypto error debugging, use the no form of this command.
debug crypto {isakmp| ipsec| engine} error
no debug crypto {isakmp| ipsec| engine} error
Syntax Description Debugmessages are shown for Internet Key Exchange(IKE)-related error operations only.
isakmp
Debug messages are shown for IP Security(IPSec)-related error operations only.
ipsec
Debug messages are shown for crypto engine-relatederror operations only.
engine
Command Default Crypto error debugging is not enabled.
Command Modes Privileged EXEC
Command History ModificationRelease
This command was introduced.12.3(2)T
This command was integrated into Cisco IOS Release 12.2(!8)SXD.12.2(18)SXD
Usage Guidelines Thedebugcryptoerrorcommand will display only error-related debug messages; that is, an error debug willnot be shown if the operation is functioning properly.
This command should be used when debug conditions cannot be determined; for example, enable this commandwhen a random, small subset of IKE peers is failing negotiation.
The global crypto command-line interfaces (CLIs) (the debugcryptoisakmp, debugcryptoipsec, anddebugcryptoengine commands) will override the debugcryptoerror command. Thus, this commandshould not be used in conjunction with the global CLIs because you may overwhelm the router.
Note
Cisco IOS Debug Command Reference - Commands A through D116
debug clns esis events through debug dbconn tcpdebug crypto error
Debug message filtering for crypto hardware engines is not supported.Note
Examples The following example shows how to enable IPSec-related error messages:
Router# debug crypto error ipsec error
Cisco IOS Debug Command Reference - Commands A through D 117
debug clns esis events through debug dbconn tcpdebug crypto error
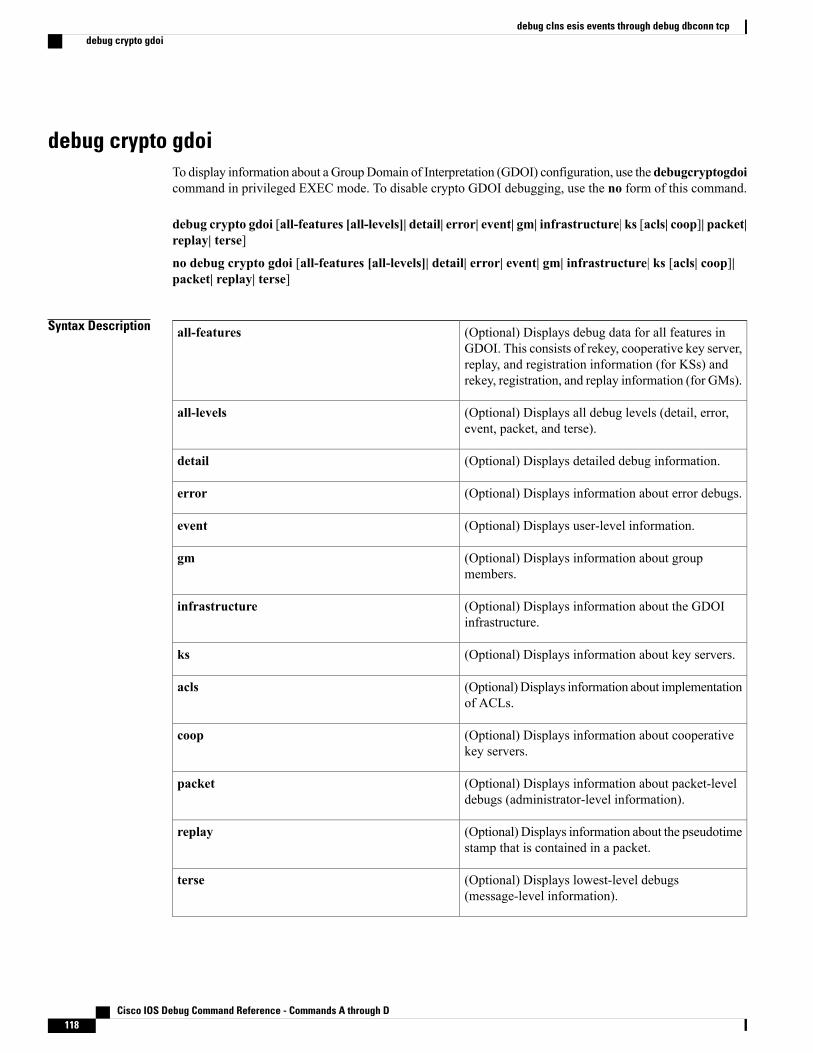
debug crypto gdoiTo display information about a GroupDomain of Interpretation (GDOI) configuration, use the debugcryptogdoicommand in privileged EXEC mode. To disable crypto GDOI debugging, use the no form of this command.
debug crypto gdoi [all-features [all-levels]| detail| error| event| gm| infrastructure| ks [acls| coop]| packet|replay| terse]
no debug crypto gdoi [all-features [all-levels]| detail| error| event| gm| infrastructure| ks [acls| coop]|packet| replay| terse]
Syntax Description (Optional) Displays debug data for all features inGDOI. This consists of rekey, cooperative key server,replay, and registration information (for KSs) andrekey, registration, and replay information (for GMs).
all-features
(Optional) Displays all debug levels (detail, error,event, packet, and terse).
all-levels
(Optional) Displays detailed debug information.detail
(Optional) Displays information about error debugs.error
(Optional) Displays user-level information.event
(Optional) Displays information about groupmembers.
gm
(Optional) Displays information about the GDOIinfrastructure.
infrastructure
(Optional) Displays information about key servers.ks
(Optional) Displays information about implementationof ACLs.
acls
(Optional) Displays information about cooperativekey servers.
coop
(Optional) Displays information about packet-leveldebugs (administrator-level information).
packet
(Optional) Displays information about the pseudotimestamp that is contained in a packet.
replay
(Optional) Displays lowest-level debugs(message-level information).
terse
Cisco IOS Debug Command Reference - Commands A through D118
debug clns esis events through debug dbconn tcpdebug crypto gdoi

The detail, error, event, packet, and tersekeywords can be used with the featurekeywords (for example, gmerror,infrastructureerror,kscoopevent,replayerror).
Note
Command Default Debugging is turned off.
Command Modes Privileged EXEC (#)
Command History ModificationRelease
This command was introduced.12.4(6)T
The detail, error, event, gm, infrastructure, ks, coop, packet, replay,andtersekeywords were added.
12.4(11)T
This command was integrated into Cisco IOS XE Release 2.3.Cisco IOS XE Release 2.3
This command was modified. The acls and replay keywords wereremoved. The all-features and all-levels keywords were added.
15.1(3)T
This command was modified. The acls and replay keywords wereremoved. The all-features and all-levels keywords were added.
Cisco IOS XE Release 3.8S
Usage Guidelines Using this command displays various GDOI debugs. For debugging information for cooperative key servers,use the debugcryptogdoikscoop command.
If you do not specify a feature (using the all-features, registration, rekey, replay, coop, or infrastructurekeywords), then messages for all features are displayed. If you do not specify a level (using the detail, error,event, packet, and terse keywords), then the terse level (which also includes the error level) is used.
You can use this command in conjunction with the debugcryptogdoiconditioncommand. When these twocommands are used together, only those messages that pass through any debug level or feature (specified bythe debugcryptogdoicommand) and pass through any condition (specified by thedebugcryptogdoiconditioncommand) are displayed.
Examples The following example shows group member registration debug output:
Router# debug crypto gdoi00:00:40: GDOI:(0:0:N/A:0):GDOI group diffint00:00:40: %CRYPTO-5-GM_REGSTER: Start registration for group diffint using address 10.0.3.100:00:40: %CRYPTO-6-ISAKMP_ON_OFF: ISAKMP is ON00:00:40: GDOI:(0:1001:HW:0:3333):beginning GDOI exchange, M-ID of 116714507500:00:40: GDOI: Group Number is 333300:00:40: GDOI:(0:1001:HW:0:3333):GDOI: GDOI ID sent successfully
Cisco IOS Debug Command Reference - Commands A through D 119
debug clns esis events through debug dbconn tcpdebug crypto gdoi

00:00:40: GDOI:(0:1001:HW:0:3333):processing GDOI SA Payload, message ID + 116714507500:00:40: GDOI:(0:1001:HW:0):processing GDOI SA KEK Payload00:00:40: GDOI:(0:0:N/A:0): KEK_ALGORITHM 500:00:40: GDOI:(0:0:N/A:0): KEY_LENGTH 2400:00:40: GDOI:(0:0:N/A:0): KEY_LIFETIME 29900:00:40: GDOI:(0:0:N/A:0): SIG_HASH_ALG 200:00:40: GDOI:(0:0:N/A:0): SIG_ALG 100:00:40: GDOI:(0:0:N/A:0): SIG_KEY_LEN 9400:00:40: GDOI:(0:0:N/A:0): Completed KEK Processing00:00:40: GDOI:(0:1001:HW:0):processing GDOI SA TEK Payload00:00:40: GDOI:(0:1001:HW:0:3333): Completed TEK Processing00:00:40: GDOI:(0:1001:HW:0):processing GDOI SA TEK Payload00:00:40: GDOI:(0:1001:HW:0:3333): Completed TEK Processing00:00:40: GDOI:(0:1001:HW:0:3333):GDOI ACK sent successfully by GM00:00:40: GDOI:received payload type 1800:00:40: GDOI:(0:1001:HW:0:3333):processing GDOI Seq Payload, message_id 116714507500:00:40: GDOI:(0:1001:HW:0:3333):Completed SEQ Processing for seq 000:00:40: GDOI:received payload type 1700:00:40: GDOI:(0:1001:HW:0:3333):processing GDOI KD Payload, message_id 116714507500:00:40: GDOI:(0:1001:HW:0:3333):processing GDOI Key Packet, message_id 3864933600:00:40: GDOI:(0:1001:HW:0:3333):procesing TEK KD: spi is 56165461, spi00:00:40: GDOI:(0:1001:HW:0:3333):TEK Integrity Key 20 bytes00:00:40: GDOI:(0:1001:HW:0:3333):Completed KeyPkt Processing00:00:40: GDOI:(0:1001:HW:0:3333):processing GDOI Key Packet, message_id 3864933600:00:40: GDOI:(0:1001:HW:0:3333):procesing TEK KD: spi is 56165522, spi00:00:40: GDOI:(0:1001:HW:0:3333):TEK Integrity Key 20 bytes00:00:40: GDOI:(0:1001:HW:0:3333):Completed KeyPkt Processing00:00:40: GDOI:(0:1001:HW:0:3333):processing GDOI Key Packet, message_id 3864933600:00:40: GDOI:(0:1001:HW:0:3333): Processing KEK KD00:00:40: GDOI:(0:1001:HW:0:3333):KEK Alg Key 32 bytes00:00:40: GDOI:(0:1001:HW:0:3333):KEK Sig Key 94 bytes00:00:40: GDOI:(0:1001:HW:0:3333):Completed KeyPkt Processing00:00:40: %GDOI-5-GM_REGS_COMPL: Registration complete for group diffint using address10.0.3.1enc(config-if)#00:00:40: GDOI:(0:0:N/A:0):Registration installed 2 new ipsec SA(s) for group diffint.
The following output example shows key server registration debugs:
Router# debug crypto gdoi00:00:40: GDOI:(0:1001:HW:0):processing GDOI ID payload, message ID = 116714507500:00:40: GDOI:(0:1001:HW:0):The GDOI ID is a Number: 333300:00:40: GDOI:(0:0:N/A:0): Adding KEK Policy to the current ks_group00:00:40: GDOI:(0:0:N/A:0):Setting MULTICAST TEK rekey lifetime 3000:00:40: GDOI:(0:0:N/A:0):Setting MULTICAST TEK rekey lifetime 3000:00:40: GDOI:(0:1001:HW:0:3333):GDOI SA sent successfully by KS00:00:40: GDOI:(0:1001:HW:0:3333):GDOI KD sent successfully by KSThe following output example shows group member rekey debugs:
Router# debug crypto gdoi00:02:00: GDOI:(0:1002:HW:0):Received Rekey Message!00:02:00: GDOI:(0:1002:HW:0):Signature Valid!00:02:00: GDOI:received payload type 1800:02:00: GDOI:(0:1002:HW:0):processing GDOI Seq Payload, message_id 000:02:00: GDOI:(0:1002:HW:0):Completed SEQ Processing for seq 800:02:00: GDOI:(0:1002:HW:0):processing GDOI SA Payload, message ID + 000:02:00: GDOI:(0:1002:HW:0):processing GDOI SA KEK Payload00:02:00: GDOI:(0:1002:HW:0): KEK_ALGORITHM 500:02:00: GDOI:(0:1002:HW:0): KEY_LENGTH 2400:02:00: GDOI:(0:1002:HW:0): KEY_LIFETIME 21900:02:00: GDOI:(0:1002:HW:0): SIG_HASH_ALG 200:02:00: GDOI:(0:1002:HW:0): SIG_ALG 100:02:00: GDOI:(0:1002:HW:0): Completed KEK Processing00:02:00: GDOI:(0:1002:HW:0):processing GDOI SA TEK Payload00:02:00: GDOI:(0:1002:HW:0): Completed TEK Processing00:02:00: GDOI:(0:1002:HW:0):processing GDOI SA TEK Payload00:02:00: GDOI:(0:1002:HW:0): Completed TEK Processing00:02:00: GDOI:received payload type 1700:02:00: GDOI:(0:1002:HW:0):processing GDOI KD Payload, message_id 000:02:00: GDOI:(0:1002:HW:0):processing GDOI Key Packet, message_id 3864933600:02:00: GDOI:(0:1002:HW:0):procesing TEK KD: spi is 49193284, spi
Cisco IOS Debug Command Reference - Commands A through D120
debug clns esis events through debug dbconn tcpdebug crypto gdoi

00:02:00: GDOI:(0:1002:HW:0):TEK Integrity Key 20 bytes00:02:00: GDOI:(0:1002:HW:0):Completed KeyPkt Processingenc(config-if)#00:02:00: GDOI:(0:1002:HW:0):processing GDOI Key Packet, message_id 3864933600:02:00: GDOI:(0:1002:HW:0):procesing TEK KD: spi is 49193345, spi00:02:00: GDOI:(0:1002:HW:0):TEK Integrity Key 20 bytes00:02:00: GDOI:(0:1002:HW:0):Completed KeyPkt Processing00:02:00: GDOI:(0:1002:HW:0):processing GDOI Key Packet, message_id 3864933600:02:00: GDOI:(0:1002:HW:0): Processing KEK KD00:02:00: GDOI:(0:1002:HW:0):Completed KeyPkt Processing
Cisco IOS Debug Command Reference - Commands A through D 121
debug clns esis events through debug dbconn tcpdebug crypto gdoi

debug crypto gdoi conditionTo configure conditional filters (based on groups and peers) for GDOI debugging, use thedebugcryptogdoiconditioncommand in privileged EXEC mode. To disable conditional filters, use the noform of this command.
debug crypto gdoi condition {[group group-name] [peer {address ipv4 ipv4-address-of-peer| hostnameipv4 ipv4-hostname}]| reset| unmatched}
no debug crypto gdoi condition {[group group-name] [peer {address ipv4 ipv4-address-of-peer| hostnameipv4 ipv4-hostname}]| reset| unmatched}
Syntax Description (Optional) Displays information for a specific group.group group-name
(Optional) Displays information for a specific IPv4peer.
address ipv4 ipv4-address-of-peer
(Optional) Displays information for a specific IPv4host.
hostname ipv4 ipv4-hostname
(Optional) Removes all debugging conditions.reset
(Optional) Displays debug messages if no context isavailable.
unmatched
Command Default Conditional bugging is turned off.
Command Modes Privileged EXEC (#)
Command History ModificationRelease
This command was introduced.15.1(3)T
This command was integrated into Cisco IOS XE Release 3.8S.Cisco IOS XE Release 3.8S
Usage Guidelines This command lets you filter the number of debug messages to make it easier to identify the problem of aparticular groupmember (GM). This command is useful whenmany (such as thousands of) GMs are registeredto a key server on which debugging is enabled.
You can use this command in conjunction with the debugcryptogdoicommand. When these two commandsare used together, only those messages that pass through any debug level or feature (specified by the
Cisco IOS Debug Command Reference - Commands A through D122
debug clns esis events through debug dbconn tcpdebug crypto gdoi condition

debugcryptogdoicommand) and pass through any condition (specified by thedebugcryptogdoiconditioncommand) are displayed.
You can use this command multiple times to configure conditional debugging for any number of GMs. Youcan have more than one group configured and more than one GM registered to each group.
If no GM is specified, debug messages will appear for all GMs (this occurs automatically when all conditionalfiltering is removed).
Also, this command lets you filter per cooperative key server on each key server. This command is usefulwhen there are many key servers in a system.
The unmatched keyword displays messages when there is insufficient information to perform conditionaldebugging. The unmatched keyword is enabled for the error, terse, and event debug levels.
To remove the debug messages for a GM or a key server, use the no form of the same command.
Examples The following example shows how to configure a conditional filter for a GDOI group named group1:
Router# debug crypto gdoi condition group group1The following output example shows how to configure a conditional filter for IPv4 peers:
Router# debug crypto gdoi condition peer
Related Commands DescriptionCommand
Defines conditional debug filters for IP Security(IPSec) tunnels.
debug crypto condition
Cisco IOS Debug Command Reference - Commands A through D 123
debug clns esis events through debug dbconn tcpdebug crypto gdoi condition

debug crypto haTo display crypto high availability debugging information, use the debugcryptohacommand in privilegedEXEC mode. To disable debugging messages, use the no form of this command.
debug crypto ha
no debug crypto ha
Syntax Description This command has no arguments or keywords.
Command Modes Privileged EXEC
Command History ModificationRelease
This command was introduced.12.3(11)T
Examples The following example is sample output from the debugcryptoha command:
Router# debug crypto ha
Active router:Router# show debug
Cryptographic Subsystem:Crypto High Availability Manager debugging is on
vrf-lite-R1#*Sep 28 21:27:50.899:Sending IKE Add SA Message*Sep 28 21:27:50.899:HA Message 0:flags=0x01 len=394 HA_IKE_MSG_ADD_SA (2)*Sep 28 21:27:50.899: ID:04000003*Sep 28 21:27:50.899: attr HA_IKE_ATT_MY_COOKIE (2) len 8*Sep 28 21:27:50.899: 9B 1A 76 AA 99 11 1A 1F*Sep 28 21:27:50.899: attr HA_IKE_ATT_HIS_COOKIE (3) len 8*Sep 28 21:27:50.899: E2 A2 A3 5F 53 1D EA 15*Sep 28 21:27:50.899: attr HA_IKE_ATT_SRC (4) len 4*Sep 28 21:27:50.899: 04 00 00 05*Sep 28 21:27:50.899: attr HA_IKE_ATT_DST (5) len 4*Sep 28 21:27:50.899: 04 00 00 03*Sep 28 21:27:50.899: attr HA_IKE_ATT_PEER_PORT (6) len 2*Sep 28 21:27:50.899: 01 F4*Sep 28 21:27:50.899: attr HA_IKE_ATT_F_VRF (7) len 1*Sep 28 21:27:50.899: 00*Sep 28 21:27:50.899: attr HA_IKE_ATT_INIT_OR_RESP (8) len 1*Sep 28 21:27:50.899: 00*Sep 28 21:27:50.899: attr HA_IKE_ATT_NAT_DISCOVERY (9) len 1*Sep 28 21:27:50.899: 02*Sep 28 21:27:50.899: attr HA_IKE_ATT_IDTYPE (38) len 1*Sep 28 21:27:50.899: 01*Sep 28 21:27:50.899: attr HA_IKE_ATT_PROTOCOL (39) len 1*Sep 28 21:27:50.899: 11*Sep 28 21:27:50.899: attr HA_IKE_ATT_PORT (40) len 2*Sep 28 21:27:50.899: 01 F4*Sep 28 21:27:50.899: attr HA_IKE_ATT_ADDR (41) len 4*Sep 28 21:27:50.899: 04 00 00 05*Sep 28 21:27:50.899: attr HA_IKE_ATT_MASK (42) len 4*Sep 28 21:27:50.899: 00 00 00 00
Cisco IOS Debug Command Reference - Commands A through D124
debug clns esis events through debug dbconn tcpdebug crypto ha
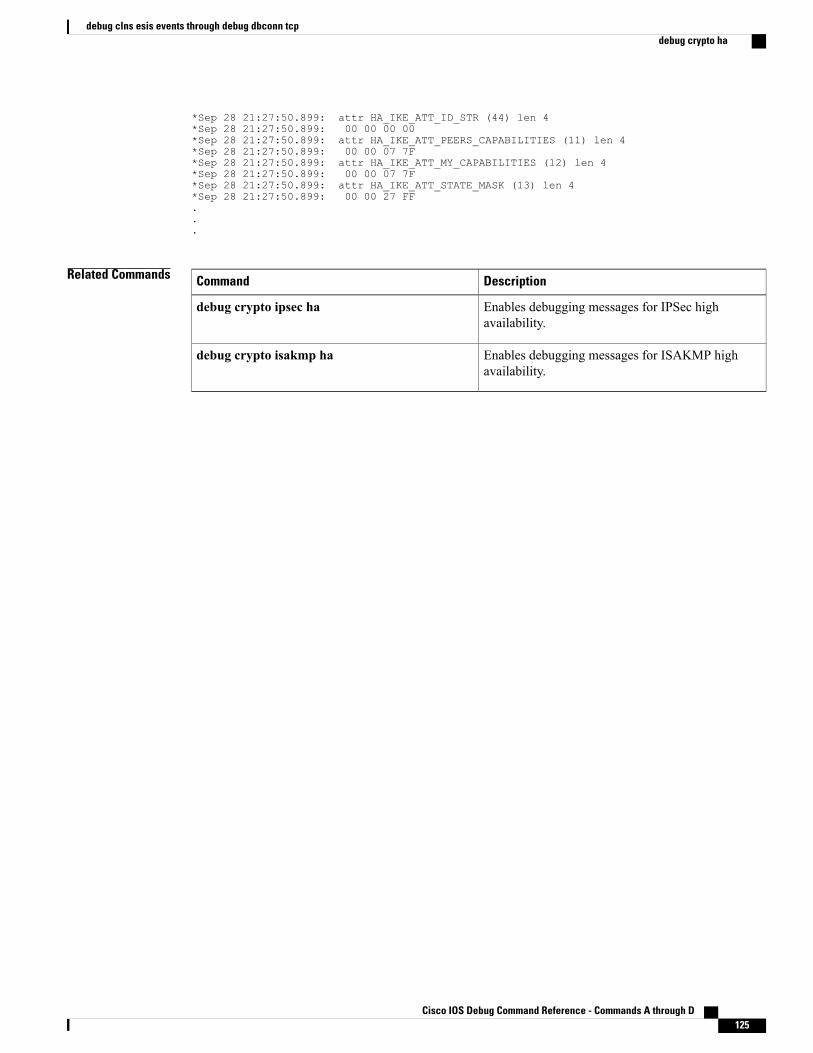
*Sep 28 21:27:50.899: attr HA_IKE_ATT_ID_STR (44) len 4*Sep 28 21:27:50.899: 00 00 00 00*Sep 28 21:27:50.899: attr HA_IKE_ATT_PEERS_CAPABILITIES (11) len 4*Sep 28 21:27:50.899: 00 00 07 7F*Sep 28 21:27:50.899: attr HA_IKE_ATT_MY_CAPABILITIES (12) len 4*Sep 28 21:27:50.899: 00 00 07 7F*Sep 28 21:27:50.899: attr HA_IKE_ATT_STATE_MASK (13) len 4*Sep 28 21:27:50.899: 00 00 27 FF...
Related Commands DescriptionCommand
Enables debugging messages for IPSec highavailability.
debug crypto ipsec ha
Enables debugging messages for ISAKMP highavailability.
debug crypto isakmp ha
Cisco IOS Debug Command Reference - Commands A through D 125
debug clns esis events through debug dbconn tcpdebug crypto ha

debug crypto ipv6 ipsecTo display IP Security (IPSec) events for IPv6 networks, use the debug crypto ipv6 ipsec command inprivileged EXEC mode. To disable debugging output, use the no form of this command.
debug crypto ipv6 ipsec
no debug crypto ipv6 ipsec
Syntax Description This command has no arguments or keywords.
Command Default Debugging for IPv6 IPSec events is not enabled.
Command Modes Privileged EXEC
Command History ModificationRelease
This command was introduced.12.3(4)T
This commandwas introduced onCiscoASR 1000 Series Routers.Cisco IOS XE Release 2.1
Usage Guidelines Use this command to display IPSec events while setting up or removing policy definitions during OSPFconfiguration.
Examples The following example enables the display of IPSec events for IPv6 networks:
Router# debug crypto ipv6 ipsec
Related Commands DescriptionCommand
Displays debugging messages about crypto engines,which perform encryption and decryption.
debug crypto engine
Displays debug messages for IPv6 packets allowingyou to see the contents of packets outbound from aCisco router when the remote node is not a Cisconode.
debug crypto ipv6 packet
Displays communication between the client and IPSecduring policy setup and removal processes.
debug crypto socket
Cisco IOS Debug Command Reference - Commands A through D126
debug clns esis events through debug dbconn tcpdebug crypto ipv6 ipsec

DescriptionCommand
Displays the interaction between OSPF and IPSec,including creation or removal of policies.
debug ipv6 ospf authentication
Cisco IOS Debug Command Reference - Commands A through D 127
debug clns esis events through debug dbconn tcpdebug crypto ipv6 ipsec

debug crypto ipv6 packetTo display the contents of IPv6 packets, use the debug crypto ipv6 packet command in privileged EXECmode. To disable debugging output, use the no form of this command.
debug crypto ipv6 packet
no debug crypto ipv6 packet
Syntax Description This command has no arguments or keywords.
Command Default Debugging for IPv6 IPSec packets is not enabled.
Command Modes Privileged EXEC
Command History ModificationRelease
This command was introduced.12.3(4)T
This commandwas introduced onCiscoASR 1000 Series Routers.Cisco IOS XE Release 2.1
Usage Guidelines Consult Cisco Technical Support before using this command.
Use this command to display the contents of IPv6 packets. This command is useful when the remote node isnot a Cisco device and communication between the Cisco and non-Cisco router cannot be established. Thiscommand enables you to look at the contents of the packets outbound from the Cisco router.
This command examines the content of every IPv6 packet and may slow network performance.
Examples This example shows the ouptut of each packet when the debug crypto ipv6 packet command is enabled:
Router# debug crypto ipv6 packetCrypto IPv6 IPSEC packet debugging is onRouter#*Oct 30 16:57:06.330:IPSECv6:before Encapsulation of IPv6 packet:0E37A7C0: 6E000000 00285901 n....(Y.0E37A7D0:FE800000 00000000 020A8BFF FED42C1D ~...........~T,.0E37A7E0:FF020000 00000000 00000000 00000005 ................0E37A7F0:03010028 01010104 00000001 8AD80000 ...(.........X..0E37A800:00000006 01000013 000A0028 0A0250CF ...........(..PO0E37A810:01010104 0A0250CF ......PO*Oct 30 16:57:06.330:IPSECv6:Encapsulated IPv6 packet:0E37A7B0:6E000000 00403301 FE800000 00000000 n....@3.~.......0E37A7C0:020A8BFF FED42C1D FF020000 00000000 ....~T,.........0E37A7D0:00000000 00000005 59040000 000022B8 ........Y....."80E37A7E0:0000001A 38AB1ED8 04C1C6FB FF1248CF ....8+.X.AF{..HO0E37A7F0:03010028 01010104 00000001 8AD80000 ...(.........X..
Cisco IOS Debug Command Reference - Commands A through D128
debug clns esis events through debug dbconn tcpdebug crypto ipv6 packet

0E37A800:00000006 01000013 000A0028 0A0250CF ...........(..PO0E37A810:01010104 0A0250CF ......PO*Oct 30 16:57:11.914:IPSECv6:Before Decapsulation of IPv6 packet:0E004A50: 6E000000 00403301 [email protected]:FE800000 00000000 023071FF FE7FE81D ~........0q.~.h.0E004A70:FF020000 00000000 00000000 00000005 ................0E004A80:59040000 000022B8 00001D88 F5AC68EE Y....."8....u,hn0E004A90:1AC00088 947C6BF2 03010028 0A0250CF .@...|kr...(..PO0E004AA0:00000001 E9080000 00000004 01000013 ....i...........0E004AB0:000A0028 0A0250CF 01010104 01010104 ...(..PO........0E004AC0:*Oct 30 16:57:11.914:IPSECv6:Decapsulated IPv6 packet:0E004A70:6E000000 00285901 FE800000 00000000 n....(Y.~.......0E004A80:023071FF FE7FE81D FF020000 00000000 .0q.~.h.........0E004A90:00000000 00000005 03010028 0A0250CF ...........(..PO0E004AA0:00000001 E9080000 00000004 01000013 ....i...........0E004AB0:000A0028 0A0250CF 01010104 01010104 ...(..PO........0E004AC0:*Oct 30 16:57:16.330:IPSECv6:before Encapsulation of IPv6 packet:0E003DC0: 6E000000 00285901 n....(Y.0E003DD0:FE800000 00000000 020A8BFF FED42C1D ~...........~T,.0E003DE0:FF020000 00000000 00000000 00000005 ................0E003DF0:03010028 01010104 00000001 8AD80000 ...(.........X..0E003E00:00000006 01000013 000A0028 0A0250CF ...........(..PO0E003E10:01010104 0A0250CF ......PO*Oct 30 16:57:16.330:IPSECv6:Encapsulated IPv6 packet:0E003DB0:6E000000 00403301 FE800000 00000000 n....@3.~.......0E003DC0:020A8BFF FED42C1D FF020000 00000000 ....~T,.........0E003DD0:00000000 00000005 59040000 000022B8 ........Y....."80E003DE0:0000001B F8E3C4E2 4CC4B690 DDF32B5C ....xcDbLD6.]s+\0E003DF0:03010028 01010104 00000001 8AD80000 ...(.........X..0E003E00:00000006 01000013 000A0028 0A0250CF ...........(..PO0E003E10:01010104 0A0250CF ......PO
Related Commands DescriptionCommand
Displays debugging messages about crypto engines,which perform encryption and decryption.
debug crypto engine
Displays IPSec events for IPv6 networks.debug crypto ipv6 ipsec
Displays communication between the client and IPSecduring policy setup and removal processes.
debug crypto socket
Cisco IOS Debug Command Reference - Commands A through D 129
debug clns esis events through debug dbconn tcpdebug crypto ipv6 packet

debug crypto ikev2To enable Internet Key Exchange Version 2(IKEv2) debug messages, use the debugcryptoikev2commandin privileged EXEC mode.
debug crypto ikev2 [error| terse| event| packet| detail]
no debug crypto ikev2 [error| terse| event| packet| detail]
Syntax Description (Optional) Enables debugmessages capturing IKEv2errors.
error
(Optional) Enables debugmessages capturing IKEv2message exchanges.
terse
(Optional) Enables debugmessages capturing IKEv2packet description, contents, and policy matching.
event
(Optional) Enables debugmessages capturing IKEv2packet dump.
packet
(Optional) Enables debugmessages capturing IKEv2state machine events.
detail
Command Modes Privileged EXEC (#)
Command History ModificationRelease
This command was introduced.15.1(1)T
This command was integrated into Cisco IOS XE Release 3.3S.Cisco IOS XE Release 3.3S
Usage Guidelines Use this command to enable IKEv2 debug messages. IKEv2 uses following debug levels.
• Level 1--error
• Level 2--terse
• Level 3--event
• Level 4--packet
• Level 5--detail
Cisco IOS Debug Command Reference - Commands A through D130
debug clns esis events through debug dbconn tcpdebug crypto ikev2

Level 1 is the lowest level and is least verbose and level 5 is highest level. Enabling debug at a higherlevel enables debug at all lower levels. You can selectively disable a debug level and enable conditionaldebug using the debugcryptocondition command.
Note
Examples The following example shows that the IKEv2 debugging is enabled:
Router# debug crypto ikev2debugging is on
Related Commands DescriptionCommand
Enables conditional debugging.debug crypto condition
Cisco IOS Debug Command Reference - Commands A through D 131
debug clns esis events through debug dbconn tcpdebug crypto ikev2
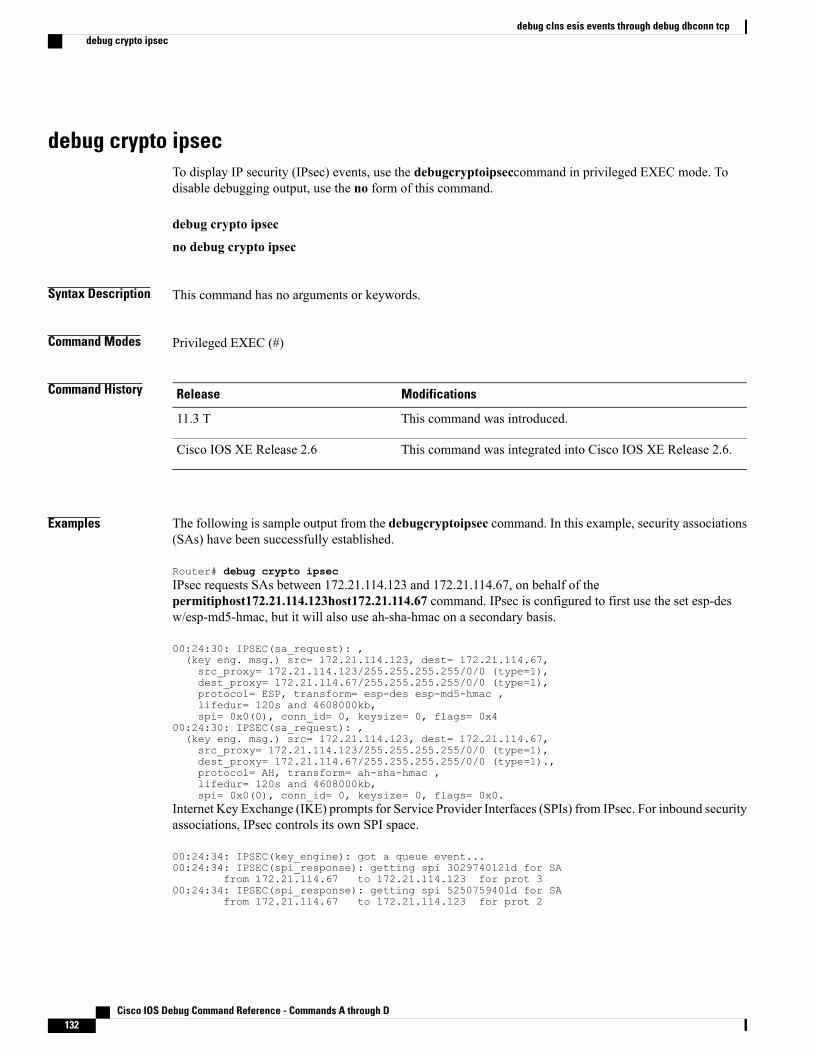
debug crypto ipsecTo display IP security (IPsec) events, use the debugcryptoipseccommand in privileged EXEC mode. Todisable debugging output, use the no form of this command.
debug crypto ipsec
no debug crypto ipsec
Syntax Description This command has no arguments or keywords.
Command Modes Privileged EXEC (#)
Command History ModificationsRelease
This command was introduced.11.3 T
This command was integrated into Cisco IOS XE Release 2.6.Cisco IOS XE Release 2.6
Examples The following is sample output from the debugcryptoipsec command. In this example, security associations(SAs) have been successfully established.
Router# debug crypto ipsecIPsec requests SAs between 172.21.114.123 and 172.21.114.67, on behalf of thepermitiphost172.21.114.123host172.21.114.67 command. IPsec is configured to first use the set esp-desw/esp-md5-hmac, but it will also use ah-sha-hmac on a secondary basis.
00:24:30: IPSEC(sa_request): ,(key eng. msg.) src= 172.21.114.123, dest= 172.21.114.67,src_proxy= 172.21.114.123/255.255.255.255/0/0 (type=1),dest_proxy= 172.21.114.67/255.255.255.255/0/0 (type=1),protocol= ESP, transform= esp-des esp-md5-hmac ,lifedur= 120s and 4608000kb,spi= 0x0(0), conn_id= 0, keysize= 0, flags= 0x4
00:24:30: IPSEC(sa_request): ,(key eng. msg.) src= 172.21.114.123, dest= 172.21.114.67,src_proxy= 172.21.114.123/255.255.255.255/0/0 (type=1),dest_proxy= 172.21.114.67/255.255.255.255/0/0 (type=1).,protocol= AH, transform= ah-sha-hmac ,lifedur= 120s and 4608000kb,spi= 0x0(0), conn_id= 0, keysize= 0, flags= 0x0.
Internet Key Exchange (IKE) prompts for Service Provider Interfaces (SPIs) from IPsec. For inbound securityassociations, IPsec controls its own SPI space.
00:24:34: IPSEC(key_engine): got a queue event...00:24:34: IPSEC(spi_response): getting spi 302974012ld for SA
from 172.21.114.67 to 172.21.114.123 for prot 300:24:34: IPSEC(spi_response): getting spi 525075940ld for SA
from 172.21.114.67 to 172.21.114.123 for prot 2
Cisco IOS Debug Command Reference - Commands A through D132
debug clns esis events through debug dbconn tcpdebug crypto ipsec

IKE will verify whether IPsec accepts the SA proposal. In this example, it is the SA proposal sent by the localIPsec that is accepted first.
00:24:34: IPSEC(validate_proposal_request): proposal part #1,(key eng. msg.) dest= 172.21.114.67, src= 172.21.114.123,dest_proxy= 172.21.114.67/255.255.255.255/0/0 (type=1),src_proxy= 172.21.114.123/255.255.255.255/0/0 (type=1),protocol= ESP, transform= esp-des esp-md5-hmac ,lifedur= 0s and 0kb,spi= 0x0(0), conn_id= 0, keysize= 0, flags= 0x4
After the proposal is accepted, IKE finishes the negotiations, generates the keying material, and then notifiesIPsec of the new security associations (one security association for each direction).
00:24:35: IPSEC(key_engine): got a queue event...The following output pertains to the inbound SA. The conn_id value references an entry in the crypto engineconnection table.
00:24:35: IPSEC(initialize_sas): ,(key eng. msg.) dest= 172.21.114.123, src= 172.21.114.67,dest_proxy= 172.21.114.123/255.255.255.255/0/0 (type=1),src_proxy= 172.21.114.67/255.255.255.255/0/0 (type=1),protocol= ESP, transform= esp-des esp-md5-hmac ,lifedur= 120s and 4608000 kb,spi= 0x120F043C(302974012), conn_id= 29, keysize= 0, flags= 0x4
The following output pertains to the outbound SA:
00:24:35: IPSEC(initialize_sas): ,(key eng. msg.) src= 172.21.114.123, dest= 172.21.114.67,src_proxy= 172.21.114.123/255.255.255.255/0/0 (type=1),dest_proxy= 172.21.114.67/255.255.255.255/0/0 (type=1),protocol= ESP, transform= esp-des esp-md5-hmac ,lifedur= 120s and 4608000kb,spi= 0x38914A4(59315364), conn_id= 30, keysize= 0, flags= 0x4
IPsec then installs the SA information into its SA database.
00:24:35: IPSEC(create_sa): sa created,(sa) sa_dest= 172.21.114.123, sa_prot= 50,sa_spi= 0x120F043C(302974012),sa_trans= esp-des esp-md5-hmac , sa_conn_id= 29
sa_lifetime(k/sec)= (4445923/500)00:24:35: IPSEC(create_sa): sa created,(sa) sa_dest= 172.21.114.67, sa_prot= 50,sa_spi= 0x38914A4(59315364),sa_trans= esp-des esp-md5-hmac , sa_conn_id= 30
sa_lifetime(k/sec)= (4445923/500)The following is sample output from the debugcryptoipsec command as seen on the peer router. In thisexample, IKE verifies whether IPsec will accept an SA proposal. Although the peer sent two proposals, IPsecaccepted the first proposal.
00:26:15: IPSEC(validate_proposal_request): proposal part #1,(key eng. msg.) dest= 172.21.114.67, src= 172.21.114.123,dest_proxy= 172.21.114.67/255.255.255.255/0/0 (type=1),src_proxy= 172.21.114.123/255.255.255.255/0/0 (type=1),protocol= ESP, transform= esp-des esp-md5-hmac ,lifedur= 0s and 0kb,spi= 0x0(0), conn_id= 0, keysize= 0, flags= 0x4
IKE prompts for SPIs.
00:26:15: IPSEC(key_engine): got a queue event...00:26:15: IPSEC(spi_response): getting spi 59315364ld for SA
from 172.21.114.123 to 172.21.114.67 for prot 3
Cisco IOS Debug Command Reference - Commands A through D 133
debug clns esis events through debug dbconn tcpdebug crypto ipsec

IKE does the remaining processing, completing the negotiation and generating keys. IKE then notifies IPsecabout the new SAs.
00:26:15: IPSEC(key_engine): got a queue event...The following output pertains to the inbound SA:
00:26:15: IPSEC(initialize_sas): ,(key eng. msg.) dest= 172.21.114.67, src= 172.21.114.123,dest_proxy= 172.21.114.67/0.0.0.0/0/0 (type=1),src_proxy= 172.21.114.123/0.0.0.0/0/0 (type=1),protocol= ESP, transform= esp-des esp-md5-hmac ,lifedur= 120s and 4608000kb,spi= 0x38914A4(59315364), conn_id= 25, keysize= 0, flags= 0x4
The following output pertains to the outbound SA:
00:26:15: IPSEC(initialize_sas): ,(key eng. msg.) src= 172.21.114.67, dest= 172.21.114.123,src_proxy= 172.21.114.67/0.0.0.0/0/0 (type=1),dest_proxy= 172.21.114.123/0.0.0.0/0/0 (type=1),protocol= ESP, transform= esp-des esp-md5-hmac ,lifedur= 120s and 4608000kb,spi= 0x120F043C(302974012), conn_id= 26, keysize= 0, flags= 0x4
IPsec then installs the SA information into its SA database:
00:26:15: IPSEC(create_sa): sa created,(sa) sa_dest= 172.21.114.67, sa_prot= 50,sa_spi= 0x38914A4(59315364),sa_trans= esp-des esp-md5-hmac , sa_conn_id= 25
sa_lifetime(k/sec)= (4445923/500)00:26:15: IPSEC(create_sa): sa created,(sa) sa_dest= 172.21.114.123, sa_prot= 50,sa_spi= 0x120F043C(302974012),sa_trans= esp-des esp-md5-hmac , sa_conn_id= 26
sa_lifetime(k/sec)= (4445923/500)
Cisco IOS Debug Command Reference - Commands A through D134
debug clns esis events through debug dbconn tcpdebug crypto ipsec
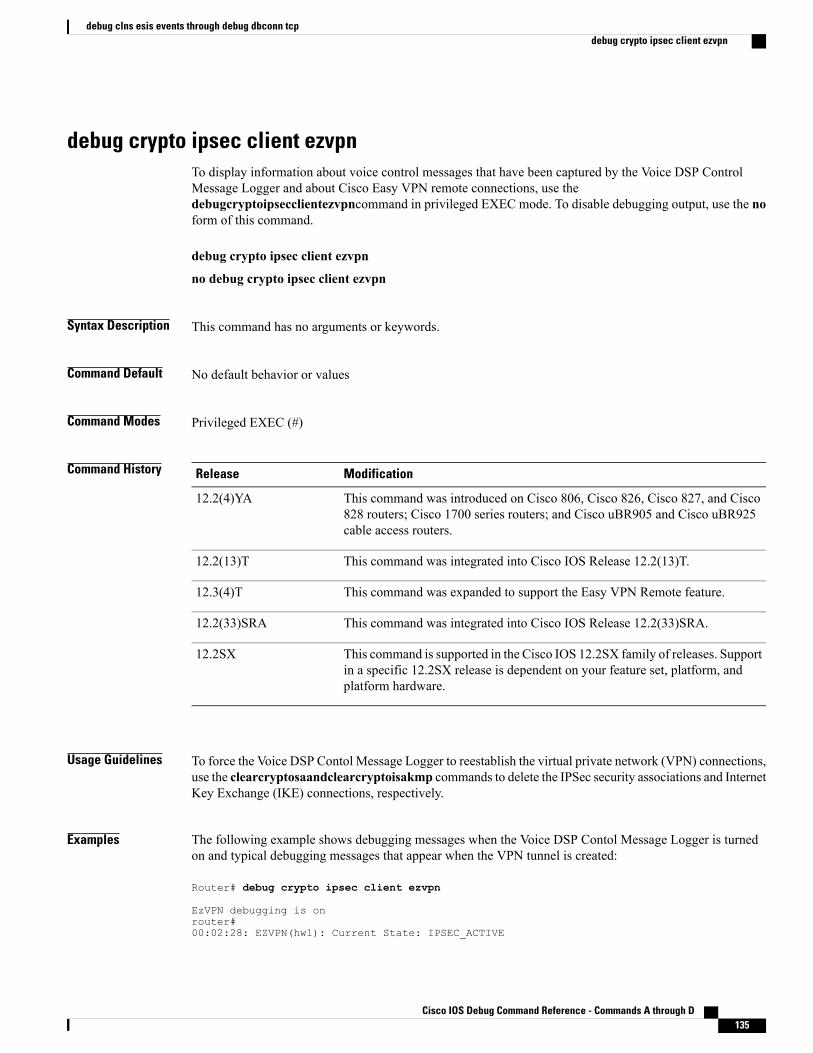
debug crypto ipsec client ezvpnTo display information about voice control messages that have been captured by the Voice DSP ControlMessage Logger and about Cisco Easy VPN remote connections, use thedebugcryptoipsecclientezvpncommand in privileged EXEC mode. To disable debugging output, use the noform of this command.
debug crypto ipsec client ezvpn
no debug crypto ipsec client ezvpn
Syntax Description This command has no arguments or keywords.
Command Default No default behavior or values
Command Modes Privileged EXEC (#)
Command History ModificationRelease
This command was introduced on Cisco 806, Cisco 826, Cisco 827, and Cisco828 routers; Cisco 1700 series routers; and Cisco uBR905 and Cisco uBR925cable access routers.
12.2(4)YA
This command was integrated into Cisco IOS Release 12.2(13)T.12.2(13)T
This command was expanded to support the Easy VPN Remote feature.12.3(4)T
This command was integrated into Cisco IOS Release 12.2(33)SRA.12.2(33)SRA
This command is supported in the Cisco IOS 12.2SX family of releases. Supportin a specific 12.2SX release is dependent on your feature set, platform, andplatform hardware.
12.2SX
Usage Guidelines To force the Voice DSP Contol Message Logger to reestablish the virtual private network (VPN) connections,use the clearcryptosaandclearcryptoisakmp commands to delete the IPSec security associations and InternetKey Exchange (IKE) connections, respectively.
Examples The following example shows debugging messages when the Voice DSP Contol Message Logger is turnedon and typical debugging messages that appear when the VPN tunnel is created:
Router# debug crypto ipsec client ezvpn
EzVPN debugging is onrouter#00:02:28: EZVPN(hw1): Current State: IPSEC_ACTIVE
Cisco IOS Debug Command Reference - Commands A through D 135
debug clns esis events through debug dbconn tcpdebug crypto ipsec client ezvpn
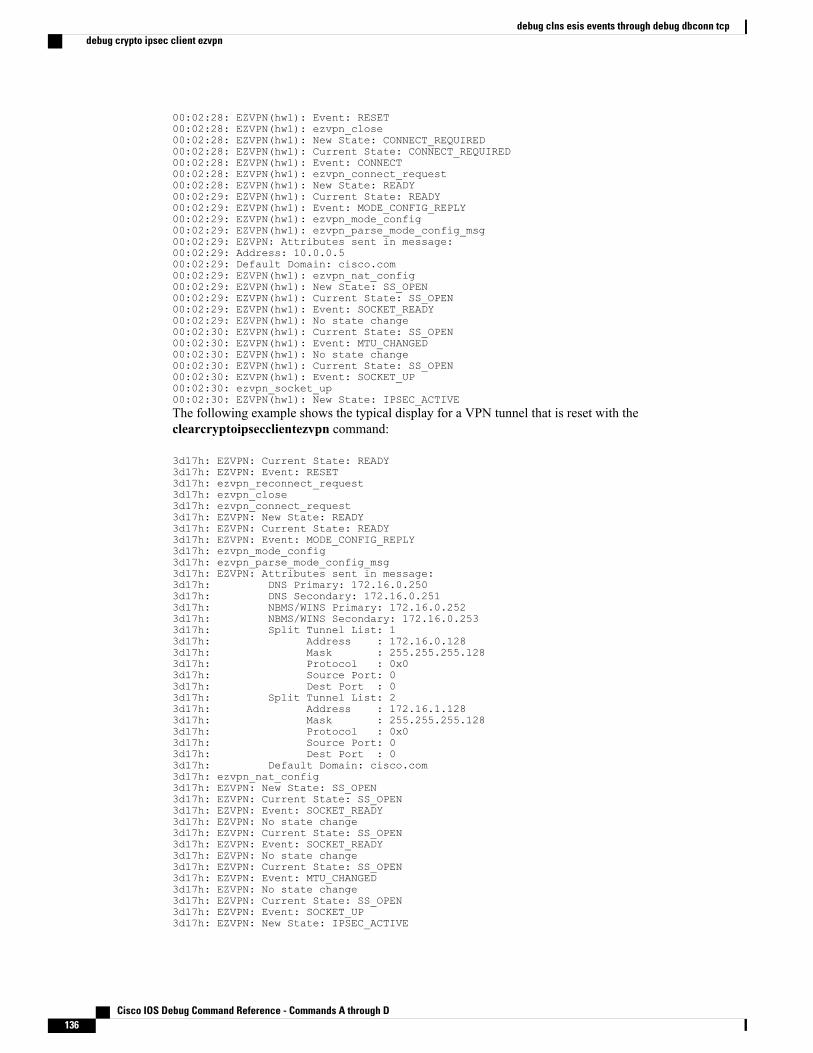
00:02:28: EZVPN(hw1): Event: RESET00:02:28: EZVPN(hw1): ezvpn_close00:02:28: EZVPN(hw1): New State: CONNECT_REQUIRED00:02:28: EZVPN(hw1): Current State: CONNECT_REQUIRED00:02:28: EZVPN(hw1): Event: CONNECT00:02:28: EZVPN(hw1): ezvpn_connect_request00:02:28: EZVPN(hw1): New State: READY00:02:29: EZVPN(hw1): Current State: READY00:02:29: EZVPN(hw1): Event: MODE_CONFIG_REPLY00:02:29: EZVPN(hw1): ezvpn_mode_config00:02:29: EZVPN(hw1): ezvpn_parse_mode_config_msg00:02:29: EZVPN: Attributes sent in message:00:02:29: Address: 10.0.0.500:02:29: Default Domain: cisco.com00:02:29: EZVPN(hw1): ezvpn_nat_config00:02:29: EZVPN(hw1): New State: SS_OPEN00:02:29: EZVPN(hw1): Current State: SS_OPEN00:02:29: EZVPN(hw1): Event: SOCKET_READY00:02:29: EZVPN(hw1): No state change00:02:30: EZVPN(hw1): Current State: SS_OPEN00:02:30: EZVPN(hw1): Event: MTU_CHANGED00:02:30: EZVPN(hw1): No state change00:02:30: EZVPN(hw1): Current State: SS_OPEN00:02:30: EZVPN(hw1): Event: SOCKET_UP00:02:30: ezvpn_socket_up00:02:30: EZVPN(hw1): New State: IPSEC_ACTIVEThe following example shows the typical display for a VPN tunnel that is reset with theclearcryptoipsecclientezvpn command:
3d17h: EZVPN: Current State: READY3d17h: EZVPN: Event: RESET3d17h: ezvpn_reconnect_request3d17h: ezvpn_close3d17h: ezvpn_connect_request3d17h: EZVPN: New State: READY3d17h: EZVPN: Current State: READY3d17h: EZVPN: Event: MODE_CONFIG_REPLY3d17h: ezvpn_mode_config3d17h: ezvpn_parse_mode_config_msg3d17h: EZVPN: Attributes sent in message:3d17h: DNS Primary: 172.16.0.2503d17h: DNS Secondary: 172.16.0.2513d17h: NBMS/WINS Primary: 172.16.0.2523d17h: NBMS/WINS Secondary: 172.16.0.2533d17h: Split Tunnel List: 13d17h: Address : 172.16.0.1283d17h: Mask : 255.255.255.1283d17h: Protocol : 0x03d17h: Source Port: 03d17h: Dest Port : 03d17h: Split Tunnel List: 23d17h: Address : 172.16.1.1283d17h: Mask : 255.255.255.1283d17h: Protocol : 0x03d17h: Source Port: 03d17h: Dest Port : 03d17h: Default Domain: cisco.com3d17h: ezvpn_nat_config3d17h: EZVPN: New State: SS_OPEN3d17h: EZVPN: Current State: SS_OPEN3d17h: EZVPN: Event: SOCKET_READY3d17h: EZVPN: No state change3d17h: EZVPN: Current State: SS_OPEN3d17h: EZVPN: Event: SOCKET_READY3d17h: EZVPN: No state change3d17h: EZVPN: Current State: SS_OPEN3d17h: EZVPN: Event: MTU_CHANGED3d17h: EZVPN: No state change3d17h: EZVPN: Current State: SS_OPEN3d17h: EZVPN: Event: SOCKET_UP3d17h: EZVPN: New State: IPSEC_ACTIVE
Cisco IOS Debug Command Reference - Commands A through D136
debug clns esis events through debug dbconn tcpdebug crypto ipsec client ezvpn

3d17h: EZVPN: Current State: IPSEC_ACTIVE3d17h: EZVPN: Event: MTU_CHANGED3d17h: EZVPN: No state change3d17h: EZVPN: Current State: IPSEC_ACTIVE3d17h: EZVPN: Event: SOCKET_UPThe following example shows the typical display for a VPN tunnel that is removed from the interface withthe nocryptoipsecclientezvpn command:
4d16h: EZVPN: Current State: IPSEC ACTIVE4d16h: EZVPN: Event: REMOVE INTERFACE CFG4d16h: ezvpn_close_and_remove4d16h: ezvpn_close4d16h: ezvpn_remove4d16h: EZVPN: New State: IDLE
Related Commands DescriptionCommand
Displays debugging messages for generic IPSecevents.
debug crypto ipsec
Displays debugging messages for IKE events.debug crypto isakmp
Cisco IOS Debug Command Reference - Commands A through D 137
debug clns esis events through debug dbconn tcpdebug crypto ipsec client ezvpn

debug crypto ipsec haTo enable debuggingmessages for IP Security (IPSec) high availability, use the debugcryptoipsechacommandin privileged EXEC mode. To disable debugging output, use the no form of this command.
debug crypto ipsec ha [detail] [update]
no debug crypto ipsec ha [detail] [update]
Syntax Description (Optional) Displays detailed debug information.detail
(Optional) Displays updates for inbound and outboundrelated data.
update
Command Modes Privileged EXEC
Command History ModificationRelease
This command was introduced.12.3(11)T
Examples The following example is sample output of the debugcryptoipsecha command for both the active and stanbyrouter:
Active RouterRouter# debug crypto ipsec ha
Crypto IPSEC High Availability debugging is on*Sep 29 17:03:01.851:IPSec HA (crypto_ha_ipsec_notify_add_sa):called*Sep 29 17:03:01.851:IPSec HA (crypto_ha_ipsec_notify_add_sa):New IPsec SA added... notifyingHA MgrStandby RouterRouter# debug crypto ipsec ha
Crypto IPSEC High Availability debugging is onvrf-lite-R1#*Sep 29 17:03:01.031:IPSec HA (crypto_ha_ipsec_mgr_recv_add_sas):HA mgr wants to insert thefollowing bundle*Sep 29 17:03:01.031:IPSec HA (crypto_ha_ipsec_mgr_recv_add_sas):This SA Supports DPD*Sep 29 17:03:01.031:IPSec HA (crypto_ha_ipsec_gen_sa):Sending Kei to IPSec num_kei 2*Sep 29 17:03:01.039:IPSec HA (crypto_ha_ipsec_notify_add_sa):called*Sep 29 17:03:01.039:IPSec HA (crypto_ha_ipsec_notify_add_sa):operation not performed asstandby ip 4.0.0.3
The following example is sample debug output with the detail keyword:
Active Router*Sep 29 17:05:48.803:IPSec HA (crypto_ha_ipsec_mgr_set_state_common):called for vip 4.0.0.3*Sep 29 17:06:11.655:IPSec HA (crypto_ha_ipsec_mgr_bulk_sync_sas):Bulk sync request fromstandby for local addr 4.0.0.3*Sep 29 17:06:44.059:IPSec HA (crypto_ha_ipsec_notify_add_sa):called
Cisco IOS Debug Command Reference - Commands A through D138
debug clns esis events through debug dbconn tcpdebug crypto ipsec ha

*Sep 29 17:06:44.059:IPSec HA (crypto_ha_ipsec_notify_add_sa):New IPsec SA added... notifyingHA MgrStandby RouterRouter# debug crypto ipsec ha detail
Crypto IPSEC High Availability Detail debugging is onvrf-lite-R1#*Sep 29 17:06:44.063:IPSec HA (crypto_ha_ipsec_mgr_recv_add_sas):HA mgr wants to insert thefollowing bundle*Sep 29 17:06:44.063:IPSec HA (crypto_ha_ipsec_mgr_recv_add_sas):This SA Supports DPD*Sep 29 17:06:44.063:IPSec HA (crypto_ha_ipsec_gen_sa):Sending Kei to IPSec num_kei 2*Sep 29 17:06:44.071:IPSec HA (crypto_ha_ipsec_notify_add_sa):called*Sep 29 17:06:44.071:IPSec HA (crypto_ha_ipsec_notify_add_sa):operation not performed asstandby ip 4.0.0.3
The following example is sample debug output with the update keyword:
Active Router*Sep 29 17:27:30.839:IPSec HA(check_and_send_replay_update):Replay triggered update seq_num1000 last-sent 0 dir inbound*Sep 29 17:27:30.839:IPSec HA(create_update_struct):Sending inbound update*Sep 29 17:27:30.839:IPSec HA(send_update_struct):
Outbound - New KB 0, New replay 0Inbound - New KB 3998772, New replay 1000
*Sep 29 17:29:30.883:IPSec HA(check_and_send_replay_update):Replay triggered update seq_num2000 last-sent 1000 dir inbound*Sep 29 17:29:30.883:IPSec HA(create_update_struct):Sending inbound update*Sep 29 17:29:30.883:IPSec HA(send_update_struct):
Outbound - New KB 0, New replay 0Inbound - New KB 3998624, New replay 2000
*Sep 29 17:30:30.899:IPSec HA(check_and_send_replay_update):Replay triggered update seq_num3000 last-sent 2000 dir inbound*Sep 29 17:30:30.899:IPSec HA(create_update_struct):Sending inbound update*Sep 29 17:30:30.899:IPSec HA(send_update_struct):
Outbound - New KB 0, New replay 0Inbound - New KB 3998476, New replay 3000
*Sep 29 17:32:30.943:IPSec HA(check_and_send_replay_update):Replay triggered update seq_num4000 last-sent 3000 dir inbound*Sep 29 17:32:30.943:IPSec HA(create_update_struct):Sending inbound update*Sep 29 17:32:30.943:IPSec HA(send_update_struct):
Outbound - New KB 0, New replay 0Inbound - New KB 3998327, New replay 4000
Standby Router*Sep 29 17:27:28.887:IPSec HA(crypto_ha_ipsec_mgr_recv_update_sa):called*Sep 29 17:27:28.887:IPSec HA(crypto_ha_ipsec_mgr_recv_update_sa):UPDATING INBOUND SA:ip =4.0.0.3, protocol = 50, spi = B8A47EC9,
NEW KB LIFE = 3998772,NEW REPLAY WINDOW START = 1000,
*Sep 29 17:29:28.915:IPSec HA(crypto_ha_ipsec_mgr_recv_update_sa):called*Sep 29 17:29:28.915:IPSec HA(crypto_ha_ipsec_mgr_recv_update_sa):UPDATING INBOUND SA:ip =4.0.0.3, protocol = 50, spi = B8A47EC9,
NEW KB LIFE = 3998624,NEW REPLAY WINDOW START = 2000,
*Sep 29 17:30:28.939:IPSec HA(crypto_ha_ipsec_mgr_recv_update_sa):called*Sep 29 17:30:28.939:IPSec HA(crypto_ha_ipsec_mgr_recv_update_sa):UPDATING INBOUND SA:ip =4.0.0.3, protocol = 50, spi = B8A47EC9,
NEW KB LIFE = 3998476,NEW REPLAY WINDOW START = 3000,
*Sep 29 17:32:28.955:IPSec HA(crypto_ha_ipsec_mgr_recv_update_sa):called*Sep 29 17:32:28.955:IPSec HA(crypto_ha_ipsec_mgr_recv_update_sa):UPDATING INBOUND SA:ip =4.0.0.3, protocol = 50, spi = B8A47EC9,
NEW KB LIFE = 3998327,NEW REPLAY WINDOW START = 4000,
Related Commands DescriptionCommand
Displays crypto high availability debugginginformation.
debug crypto ha
Cisco IOS Debug Command Reference - Commands A through D 139
debug clns esis events through debug dbconn tcpdebug crypto ipsec ha

DescriptionCommand
Enables debugging messages for ISAKMP highavailability.
debug crypto isakmp ha
Cisco IOS Debug Command Reference - Commands A through D140
debug clns esis events through debug dbconn tcpdebug crypto ipsec ha

debug crypto isakmpTo display messages about Internet Key Exchange (IKE) events, use the debug crypto isakmp command inprivileged EXEC mode. To disable debugging output, use the no form of this command.
debug crypto isakmp [aaa| errors| kmi number]
no debug crypto isakmp [aaa| errors| kmi]
Syntax Description (Optional) Specifies accounting events.aaa
(Optional) Enables error events.errors
(Optional) Captures keymanagement interface (KMI)messages.
kmi number
Command Modes Privileged EXEC (#)
Command History ModificationsRelease
This command was introduced.11.3 T
The aaa keyword was added.12.2(15)T
This command was integrated into Cisco IOS Release 12.2(18)SXD.12.2(18)SXD
This command was integrated into Cisco IOS Release 12.2(33)SRA.12.2(33)SRA
This command was integrated into Cisco IOS XE Release 2.6.Cisco IOS XE Release 2.6
This commandwasmodified. The kmi number keyword-argument pairwas added.
15.3(2)T
Usage Guidelines IKE is a key management protocol standard that is used in conjunction with the IPsec to configure basic IPsecVPNs. IPsec can be configured without IKE, but IKE enhances IPsec by providing additional features,flexibility, and ease of configuration for the IPsec standard. IKE is a hybrid protocol that implements theOakley key exchange and Skeme key exchange inside the Internet Security Association and KeyManagementProtocol (ISAKMP) framework.
The debug crypto isakmp kmi command must be enabled prior to any traffic that triggers sessions. Thiscommand enables capturing KMI sequence events along with timestamps for a particular IKE securityassociation (SA) and corresponding IPsec SA. The number argument denotes the number of KMI messagesto be captured. The KMI sequence is displayed in the output of the show crypto isakmp peers detail command.
Cisco IOS Debug Command Reference - Commands A through D 141
debug clns esis events through debug dbconn tcpdebug crypto isakmp
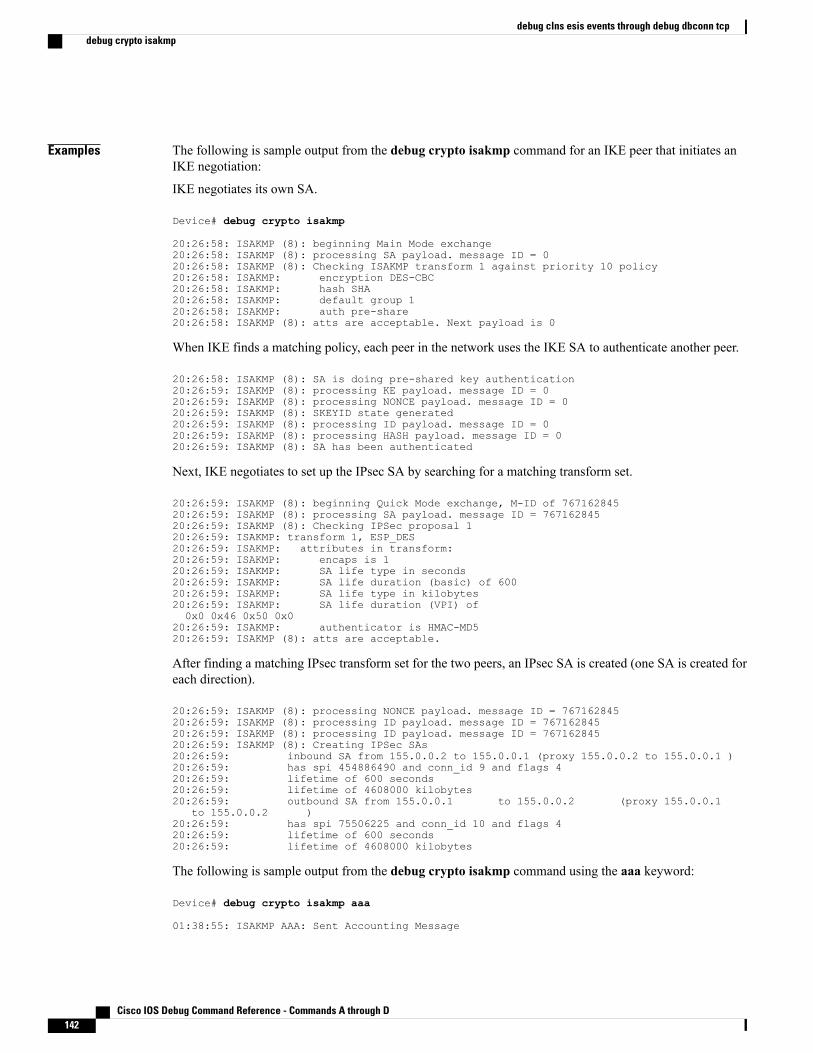
Examples The following is sample output from the debug crypto isakmp command for an IKE peer that initiates anIKE negotiation:
IKE negotiates its own SA.
Device# debug crypto isakmp
20:26:58: ISAKMP (8): beginning Main Mode exchange20:26:58: ISAKMP (8): processing SA payload. message ID = 020:26:58: ISAKMP (8): Checking ISAKMP transform 1 against priority 10 policy20:26:58: ISAKMP: encryption DES-CBC20:26:58: ISAKMP: hash SHA20:26:58: ISAKMP: default group 120:26:58: ISAKMP: auth pre-share20:26:58: ISAKMP (8): atts are acceptable. Next payload is 0
When IKE finds a matching policy, each peer in the network uses the IKE SA to authenticate another peer.
20:26:58: ISAKMP (8): SA is doing pre-shared key authentication20:26:59: ISAKMP (8): processing KE payload. message ID = 020:26:59: ISAKMP (8): processing NONCE payload. message ID = 020:26:59: ISAKMP (8): SKEYID state generated20:26:59: ISAKMP (8): processing ID payload. message ID = 020:26:59: ISAKMP (8): processing HASH payload. message ID = 020:26:59: ISAKMP (8): SA has been authenticated
Next, IKE negotiates to set up the IPsec SA by searching for a matching transform set.
20:26:59: ISAKMP (8): beginning Quick Mode exchange, M-ID of 76716284520:26:59: ISAKMP (8): processing SA payload. message ID = 76716284520:26:59: ISAKMP (8): Checking IPSec proposal 120:26:59: ISAKMP: transform 1, ESP_DES20:26:59: ISAKMP: attributes in transform:20:26:59: ISAKMP: encaps is 120:26:59: ISAKMP: SA life type in seconds20:26:59: ISAKMP: SA life duration (basic) of 60020:26:59: ISAKMP: SA life type in kilobytes20:26:59: ISAKMP: SA life duration (VPI) of0x0 0x46 0x50 0x0
20:26:59: ISAKMP: authenticator is HMAC-MD520:26:59: ISAKMP (8): atts are acceptable.
After finding a matching IPsec transform set for the two peers, an IPsec SA is created (one SA is created foreach direction).
20:26:59: ISAKMP (8): processing NONCE payload. message ID = 76716284520:26:59: ISAKMP (8): processing ID payload. message ID = 76716284520:26:59: ISAKMP (8): processing ID payload. message ID = 76716284520:26:59: ISAKMP (8): Creating IPSec SAs20:26:59: inbound SA from 155.0.0.2 to 155.0.0.1 (proxy 155.0.0.2 to 155.0.0.1 )20:26:59: has spi 454886490 and conn_id 9 and flags 420:26:59: lifetime of 600 seconds20:26:59: lifetime of 4608000 kilobytes20:26:59: outbound SA from 155.0.0.1 to 155.0.0.2 (proxy 155.0.0.1
to 155.0.0.2 )20:26:59: has spi 75506225 and conn_id 10 and flags 420:26:59: lifetime of 600 seconds20:26:59: lifetime of 4608000 kilobytes
The following is sample output from the debug crypto isakmp command using the aaa keyword:
Device# debug crypto isakmp aaa
01:38:55: ISAKMP AAA: Sent Accounting Message
Cisco IOS Debug Command Reference - Commands A through D142
debug clns esis events through debug dbconn tcpdebug crypto isakmp
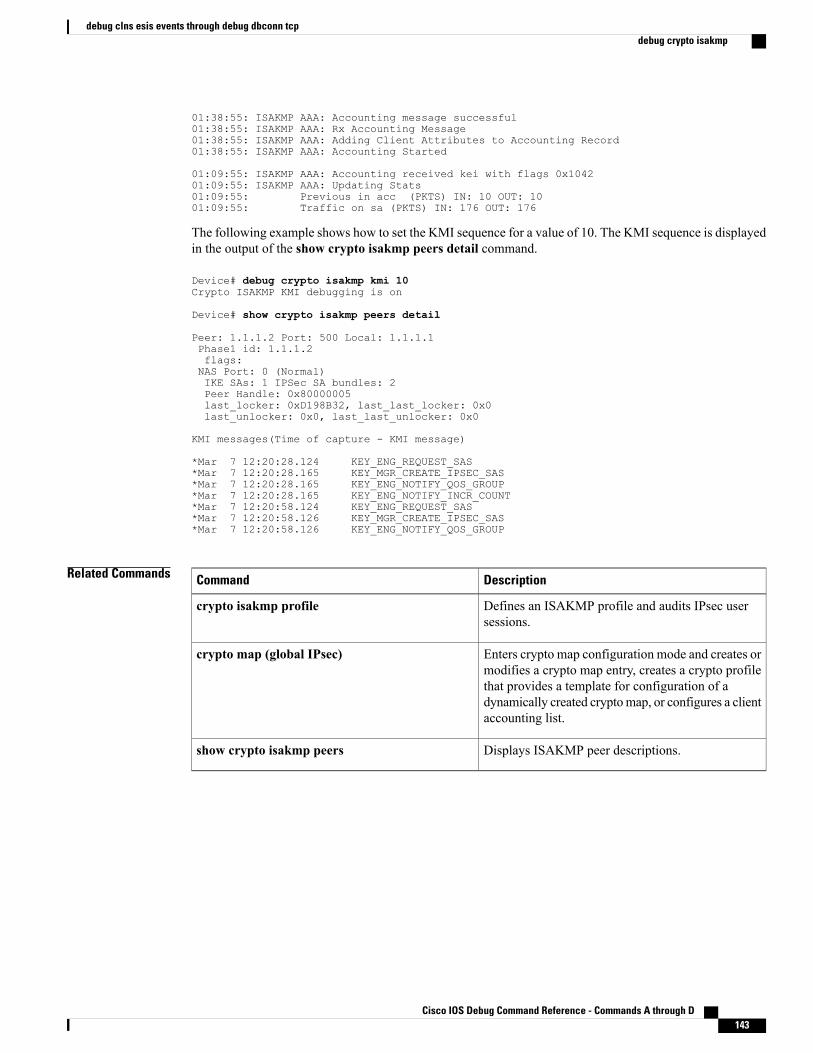
01:38:55: ISAKMP AAA: Accounting message successful01:38:55: ISAKMP AAA: Rx Accounting Message01:38:55: ISAKMP AAA: Adding Client Attributes to Accounting Record01:38:55: ISAKMP AAA: Accounting Started
01:09:55: ISAKMP AAA: Accounting received kei with flags 0x104201:09:55: ISAKMP AAA: Updating Stats01:09:55: Previous in acc (PKTS) IN: 10 OUT: 1001:09:55: Traffic on sa (PKTS) IN: 176 OUT: 176
The following example shows how to set the KMI sequence for a value of 10. The KMI sequence is displayedin the output of the show crypto isakmp peers detail command.
Device# debug crypto isakmp kmi 10Crypto ISAKMP KMI debugging is on
Device# show crypto isakmp peers detail
Peer: 1.1.1.2 Port: 500 Local: 1.1.1.1Phase1 id: 1.1.1.2flags:NAS Port: 0 (Normal)IKE SAs: 1 IPSec SA bundles: 2Peer Handle: 0x80000005last_locker: 0xD198B32, last_last_locker: 0x0last_unlocker: 0x0, last_last_unlocker: 0x0
KMI messages(Time of capture - KMI message)
*Mar 7 12:20:28.124 KEY_ENG_REQUEST_SAS*Mar 7 12:20:28.165 KEY_MGR_CREATE_IPSEC_SAS*Mar 7 12:20:28.165 KEY_ENG_NOTIFY_QOS_GROUP*Mar 7 12:20:28.165 KEY_ENG_NOTIFY_INCR_COUNT*Mar 7 12:20:58.124 KEY_ENG_REQUEST_SAS*Mar 7 12:20:58.126 KEY_MGR_CREATE_IPSEC_SAS*Mar 7 12:20:58.126 KEY_ENG_NOTIFY_QOS_GROUP
Related Commands DescriptionCommand
Defines an ISAKMP profile and audits IPsec usersessions.
crypto isakmp profile
Enters crypto map configuration mode and creates ormodifies a crypto map entry, creates a crypto profilethat provides a template for configuration of adynamically created cryptomap, or configures a clientaccounting list.
crypto map (global IPsec)
Displays ISAKMP peer descriptions.show crypto isakmp peers
Cisco IOS Debug Command Reference - Commands A through D 143
debug clns esis events through debug dbconn tcpdebug crypto isakmp
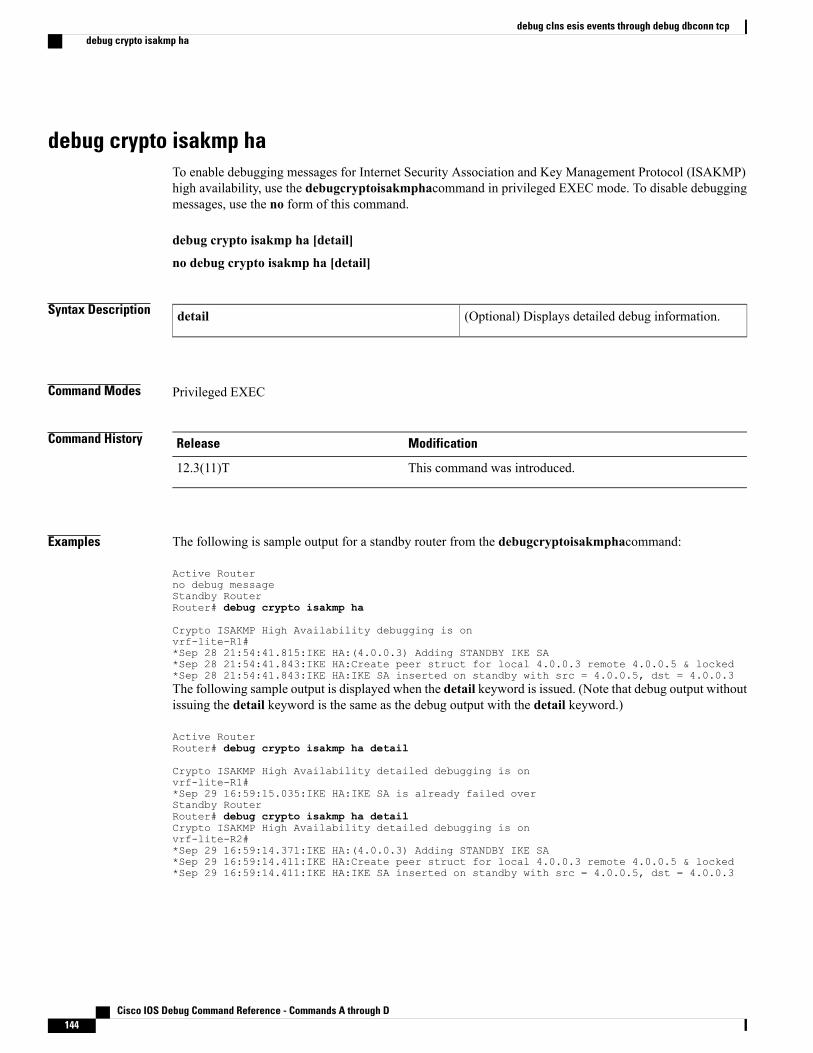
debug crypto isakmp haTo enable debugging messages for Internet Security Association and Key Management Protocol (ISAKMP)high availability, use the debugcryptoisakmphacommand in privileged EXEC mode. To disable debuggingmessages, use the no form of this command.
debug crypto isakmp ha [detail]
no debug crypto isakmp ha [detail]
Syntax Description (Optional) Displays detailed debug information.detail
Command Modes Privileged EXEC
Command History ModificationRelease
This command was introduced.12.3(11)T
Examples The following is sample output for a standby router from the debugcryptoisakmphacommand:
Active Routerno debug messageStandby RouterRouter# debug crypto isakmp ha
Crypto ISAKMP High Availability debugging is onvrf-lite-R1#*Sep 28 21:54:41.815:IKE HA:(4.0.0.3) Adding STANDBY IKE SA*Sep 28 21:54:41.843:IKE HA:Create peer struct for local 4.0.0.3 remote 4.0.0.5 & locked*Sep 28 21:54:41.843:IKE HA:IKE SA inserted on standby with src = 4.0.0.5, dst = 4.0.0.3The following sample output is displayed when the detail keyword is issued. (Note that debug output withoutissuing the detail keyword is the same as the debug output with the detail keyword.)
Active RouterRouter# debug crypto isakmp ha detail
Crypto ISAKMP High Availability detailed debugging is onvrf-lite-R1#*Sep 29 16:59:15.035:IKE HA:IKE SA is already failed overStandby RouterRouter# debug crypto isakmp ha detailCrypto ISAKMP High Availability detailed debugging is onvrf-lite-R2#*Sep 29 16:59:14.371:IKE HA:(4.0.0.3) Adding STANDBY IKE SA*Sep 29 16:59:14.411:IKE HA:Create peer struct for local 4.0.0.3 remote 4.0.0.5 & locked*Sep 29 16:59:14.411:IKE HA:IKE SA inserted on standby with src = 4.0.0.5, dst = 4.0.0.3
Cisco IOS Debug Command Reference - Commands A through D144
debug clns esis events through debug dbconn tcpdebug crypto isakmp ha

Related Commands DescriptionCommand
Displays crypto high availability debugginginformation.
debug crypto ha
Enables debugging messages for IPSec highavailability.
debug crypto ipsec ha
Cisco IOS Debug Command Reference - Commands A through D 145
debug clns esis events through debug dbconn tcpdebug crypto isakmp ha

debug crypto key-exchangeTo show Digital Signature Standard (DSS) public key exchange messages, use thedebugcryptokey-exchangecommand in privileged EXEC mode. To disable debugging output, use the noform of this command.
debug crypto key-exchange
no debug crypto key-exchange
Syntax Description This command has no arguments or keywords.
Command Modes Privileged EXEC
Usage Guidelines Encryption and authentication are provided by a software service on the router called a cryptoengine. Thecrypto engine performs authentication through DSS public and private keys when a connection is set up. DSSis a means of sending a "signature" at the end of a message that positively identifies the author of the message.The signature cannot be forged or duplicated by others, so whoever received a message with a DSS signatureknows exactly who sent the message.
If the process of exchanging DSS public keys with a peer router by means of the configcryptokey-exchangecommand is not successful, try to exchange DSS public keys again after enabling thedebugcryptokey-exchange command to help you diagnose the problem.
Examples The following is sample output from the debugcryptokey-exchange command. The first shows output fromthe initiating router in a key exchange. The second shows output from the passive router in a key exchange.The number of bytes received should match the number of bytes sent from the initiating side, although thenumber of messages can be different.
Router# debug crypto key-exchangeCRYPTO-KE: Sent 4 bytes.CRYPTO-KE: Sent 2 bytes.CRYPTO-KE: Sent 2 bytes.CRYPTO-KE: Sent 2 bytes.CRYPTO-KE: Sent 64 bytes.Router# debug crypto key-exchangeCRYPTO-KE: Received 4 bytes.CRYPTO-KE: Received 2 bytes.CRYPTO-KE: Received 2 bytes.CRYPTO-KE: Received 2 bytes.CRYPTO-KE: Received 49 bytes.CRYPTO-KE: Received 15 bytes.
Related Commands DescriptionCommand
Displays connection setup messages and their flowthrough the router.
debug crypto sesmgmt
Cisco IOS Debug Command Reference - Commands A through D146
debug clns esis events through debug dbconn tcpdebug crypto key-exchange
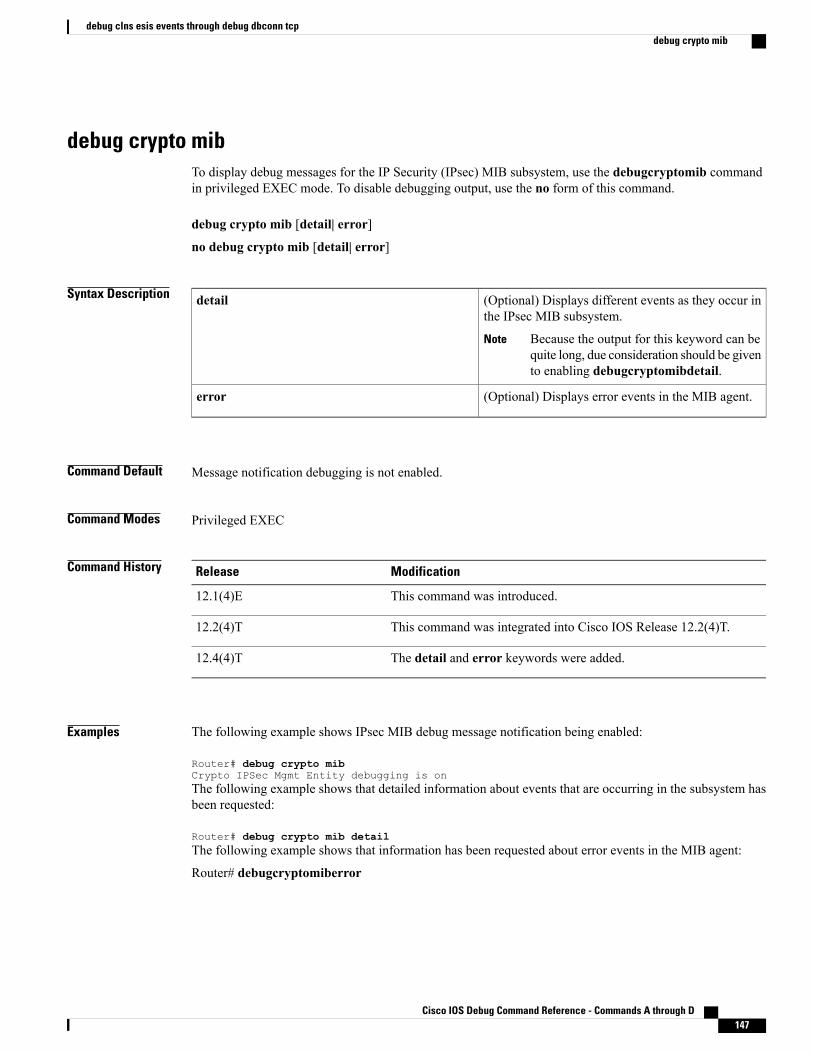
debug crypto mibTo display debug messages for the IP Security (IPsec) MIB subsystem, use the debugcryptomib commandin privileged EXEC mode. To disable debugging output, use the no form of this command.
debug crypto mib [detail| error]
no debug crypto mib [detail| error]
Syntax Description (Optional) Displays different events as they occur inthe IPsec MIB subsystem.
Because the output for this keyword can bequite long, due consideration should be givento enabling debugcryptomibdetail.
Note
detail
(Optional) Displays error events in the MIB agent.error
Command Default Message notification debugging is not enabled.
Command Modes Privileged EXEC
Command History ModificationRelease
This command was introduced.12.1(4)E
This command was integrated into Cisco IOS Release 12.2(4)T.12.2(4)T
The detail and error keywords were added.12.4(4)T
Examples The following example shows IPsec MIB debug message notification being enabled:
Router# debug crypto mibCrypto IPSec Mgmt Entity debugging is onThe following example shows that detailed information about events that are occurring in the subsystem hasbeen requested:
Router# debug crypto mib detailThe following example shows that information has been requested about error events in the MIB agent:
Router# debugcryptomiberror
Cisco IOS Debug Command Reference - Commands A through D 147
debug clns esis events through debug dbconn tcpdebug crypto mib
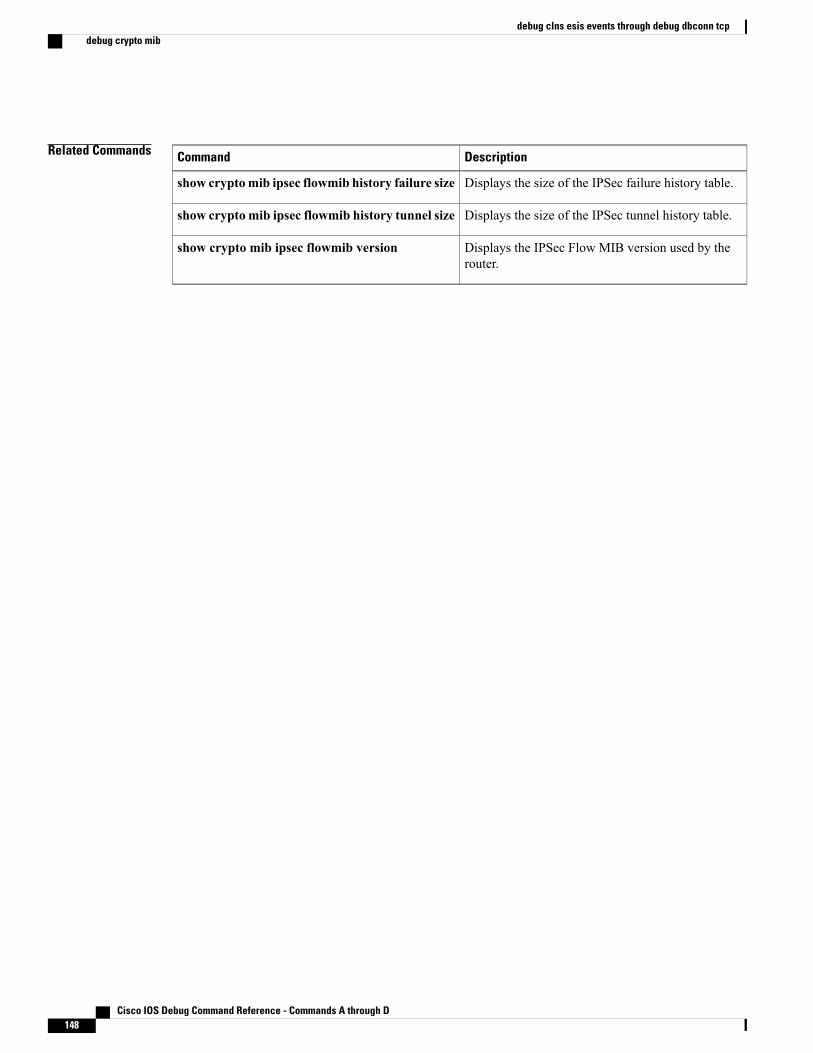
Related Commands DescriptionCommand
Displays the size of the IPSec failure history table.show cryptomib ipsec flowmib history failure size
Displays the size of the IPSec tunnel history table.show crypto mib ipsec flowmib history tunnel size
Displays the IPSec Flow MIB version used by therouter.
show crypto mib ipsec flowmib version
Cisco IOS Debug Command Reference - Commands A through D148
debug clns esis events through debug dbconn tcpdebug crypto mib
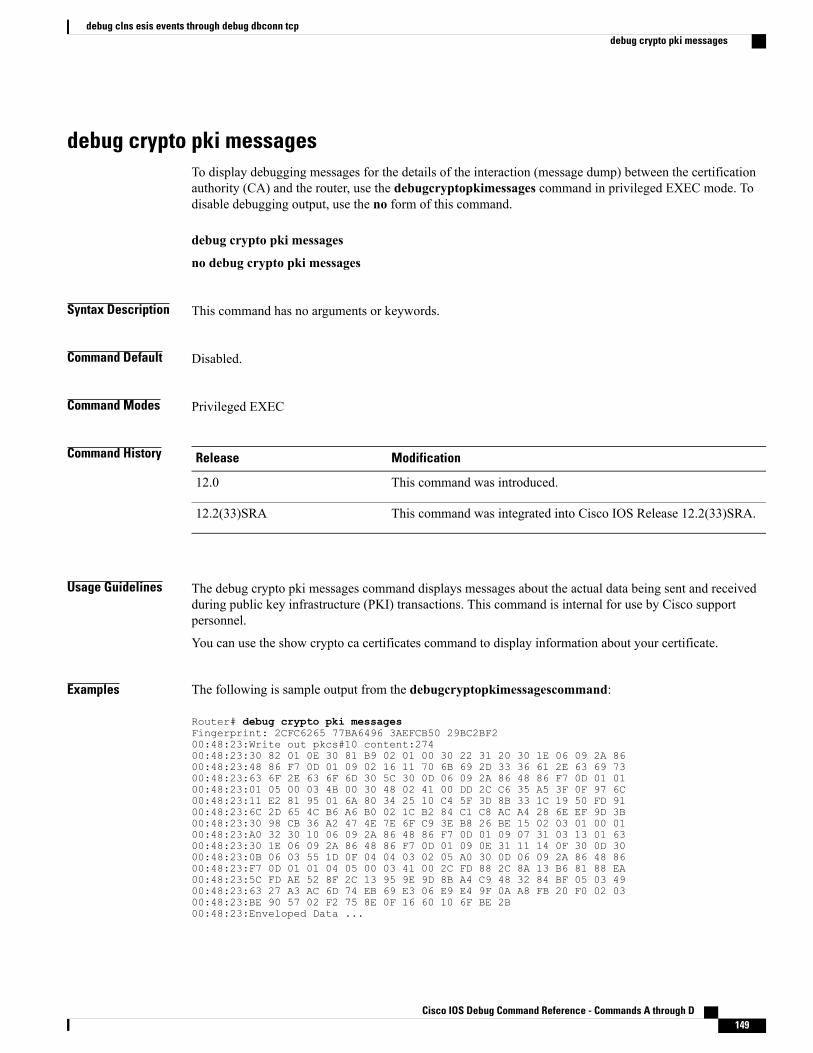
debug crypto pki messagesTo display debugging messages for the details of the interaction (message dump) between the certificationauthority (CA) and the router, use the debugcryptopkimessages command in privileged EXEC mode. Todisable debugging output, use the no form of this command.
debug crypto pki messages
no debug crypto pki messages
Syntax Description This command has no arguments or keywords.
Command Default Disabled.
Command Modes Privileged EXEC
Command History ModificationRelease
This command was introduced.12.0
This command was integrated into Cisco IOS Release 12.2(33)SRA.12.2(33)SRA
Usage Guidelines The debug crypto pki messages command displays messages about the actual data being sent and receivedduring public key infrastructure (PKI) transactions. This command is internal for use by Cisco supportpersonnel.
You can use the show crypto ca certificates command to display information about your certificate.
Examples The following is sample output from the debugcryptopkimessagescommand:
Router# debug crypto pki messagesFingerprint: 2CFC6265 77BA6496 3AEFCB50 29BC2BF200:48:23:Write out pkcs#10 content:27400:48:23:30 82 01 0E 30 81 B9 02 01 00 30 22 31 20 30 1E 06 09 2A 8600:48:23:48 86 F7 0D 01 09 02 16 11 70 6B 69 2D 33 36 61 2E 63 69 7300:48:23:63 6F 2E 63 6F 6D 30 5C 30 0D 06 09 2A 86 48 86 F7 0D 01 0100:48:23:01 05 00 03 4B 00 30 48 02 41 00 DD 2C C6 35 A5 3F 0F 97 6C00:48:23:11 E2 81 95 01 6A 80 34 25 10 C4 5F 3D 8B 33 1C 19 50 FD 9100:48:23:6C 2D 65 4C B6 A6 B0 02 1C B2 84 C1 C8 AC A4 28 6E EF 9D 3B00:48:23:30 98 CB 36 A2 47 4E 7E 6F C9 3E B8 26 BE 15 02 03 01 00 0100:48:23:A0 32 30 10 06 09 2A 86 48 86 F7 0D 01 09 07 31 03 13 01 6300:48:23:30 1E 06 09 2A 86 48 86 F7 0D 01 09 0E 31 11 14 0F 30 0D 3000:48:23:0B 06 03 55 1D 0F 04 04 03 02 05 A0 30 0D 06 09 2A 86 48 8600:48:23:F7 0D 01 01 04 05 00 03 41 00 2C FD 88 2C 8A 13 B6 81 88 EA00:48:23:5C FD AE 52 8F 2C 13 95 9E 9D 8B A4 C9 48 32 84 BF 05 03 4900:48:23:63 27 A3 AC 6D 74 EB 69 E3 06 E9 E4 9F 0A A8 FB 20 F0 02 0300:48:23:BE 90 57 02 F2 75 8E 0F 16 60 10 6F BE 2B00:48:23:Enveloped Data ...
Cisco IOS Debug Command Reference - Commands A through D 149
debug clns esis events through debug dbconn tcpdebug crypto pki messages

00:48:23:30 80 06 09 2A 86 48 86 F7 0D 01 07 03 A0 80 30 80 02 01 0000:48:23:31 80 30 82 01 0F 02 01 00 30 78 30 6A 31 0B 30 09 06 03 5500:48:23:04 06 13 02 55 53 31 0B 30 09 06 03 55 04 08 13 02 43 41 3100:48:23:13 30 11 06 03 55 04 07 13 0A 53 61 6E 74 61 20 43 72 75 7A00:48:23:31 15 30 13 06 03 55 04 0A 13 0C 43 69 73 63 6F 20 53 79 7300:48:23:74 65 6D 31 0E 30 0C 06 03 55 04 0B 13 05 49 50 49 53 55 3100:48:23:Signed Data 1382 bytes00:48:23:30 80 06 09 2A 86 48 86 F7 0D 01 07 02 A0 80 30 80 02 01 0100:48:23:31 0E 30 0C 06 08 2A 86 48 86 F7 0D 02 05 05 00 30 80 06 0900:48:23:2A 86 48 86 F7 0D 01 07 01 A0 80 24 80 04 82 02 75 30 80 0600:48:23:02 55 53 31 0B 30 09 06 03 55 04 08 13 02 43 41 31 13 30 1100:48:23:33 34 5A 17 0D 31 30 31 31 31 35 31 38 35 34 33 34 5A 30 2200:48:23:31 20 30 1E 06 09 2A 86 48 86 F7 0D 01 09 02 16 11 70 6B 6900:48:23:2D 33 36 61 2E 63 69 73 63 6F 2E 63 6F 6D 30 5C 30 0D 06 0900:48:23:2A 86 48 86 F7 0D 01 01 01 05 00 03 4B 00 30 48 02 41 00 DD00:48:23:2C C6 35 A5 3F 0F 97 6C 11 E2 81 95 01 6A 80 34 25 10 C4 5F00:48:23:3D 8B 33 1C 19 50 FD 91 6C 2D 65 4C B6 A6 B0 02 1C B2 84 C100:48:23:86 F7 0D 01 01 01 05 00 04 40 C6 24 36 D6 D5 A6 92 80 5D E500:48:23:15 F7 3E 15 6D 71 E1 D0 13 2B 14 64 1B 0C 0F 96 BF F9 2E 0500:48:23:EF C2 D6 CB 91 39 19 F8 44 68 0E C5 B5 84 18 8B 2D A4 B1 CD00:48:23:3F EC C6 04 A5 D9 7C B1 56 47 3F 5B D4 93 00 00 00 00 00 0000:48:23:00 0000:48:24:Received pki message:1778 types...
Related Commands DescriptionCommand
Obtains the certificate of your router from the CA.crypto ca enroll
Displays debugging messages for the trace ofinteraction (message type) between the CA and therouter.
debug crypto pki transactions
Displays information about your certificate, thecertificate of the CA, and any RA certificates.
show crypto ca certificates
Cisco IOS Debug Command Reference - Commands A through D150
debug clns esis events through debug dbconn tcpdebug crypto pki messages
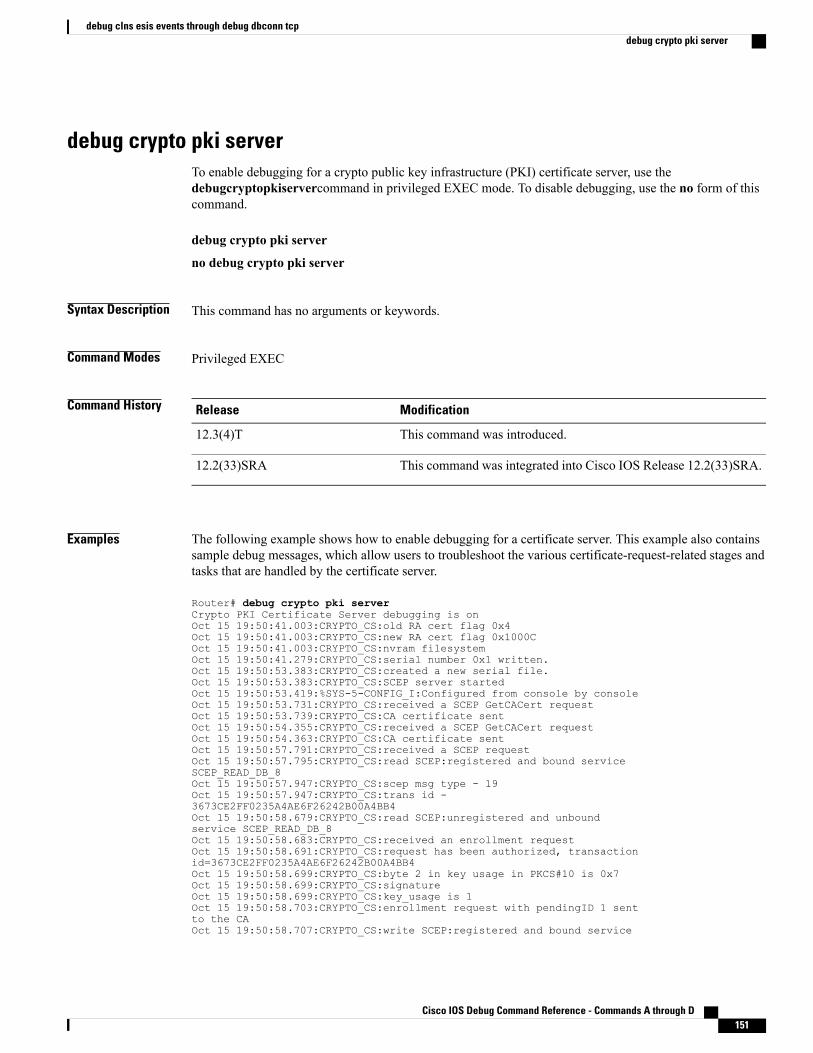
debug crypto pki serverTo enable debugging for a crypto public key infrastructure (PKI) certificate server, use thedebugcryptopkiservercommand in privileged EXEC mode. To disable debugging, use the no form of thiscommand.
debug crypto pki server
no debug crypto pki server
Syntax Description This command has no arguments or keywords.
Command Modes Privileged EXEC
Command History ModificationRelease
This command was introduced.12.3(4)T
This command was integrated into Cisco IOS Release 12.2(33)SRA.12.2(33)SRA
Examples The following example shows how to enable debugging for a certificate server. This example also containssample debug messages, which allow users to troubleshoot the various certificate-request-related stages andtasks that are handled by the certificate server.
Router# debug crypto pki serverCrypto PKI Certificate Server debugging is onOct 15 19:50:41.003:CRYPTO_CS:old RA cert flag 0x4Oct 15 19:50:41.003:CRYPTO_CS:new RA cert flag 0x1000COct 15 19:50:41.003:CRYPTO_CS:nvram filesystemOct 15 19:50:41.279:CRYPTO_CS:serial number 0x1 written.Oct 15 19:50:53.383:CRYPTO_CS:created a new serial file.Oct 15 19:50:53.383:CRYPTO_CS:SCEP server startedOct 15 19:50:53.419:%SYS-5-CONFIG_I:Configured from console by consoleOct 15 19:50:53.731:CRYPTO_CS:received a SCEP GetCACert requestOct 15 19:50:53.739:CRYPTO_CS:CA certificate sentOct 15 19:50:54.355:CRYPTO_CS:received a SCEP GetCACert requestOct 15 19:50:54.363:CRYPTO_CS:CA certificate sentOct 15 19:50:57.791:CRYPTO_CS:received a SCEP requestOct 15 19:50:57.795:CRYPTO_CS:read SCEP:registered and bound serviceSCEP_READ_DB_8Oct 15 19:50:57.947:CRYPTO_CS:scep msg type - 19Oct 15 19:50:57.947:CRYPTO_CS:trans id -3673CE2FF0235A4AE6F26242B00A4BB4Oct 15 19:50:58.679:CRYPTO_CS:read SCEP:unregistered and unboundservice SCEP_READ_DB_8Oct 15 19:50:58.683:CRYPTO_CS:received an enrollment requestOct 15 19:50:58.691:CRYPTO_CS:request has been authorized, transactionid=3673CE2FF0235A4AE6F26242B00A4BB4Oct 15 19:50:58.699:CRYPTO_CS:byte 2 in key usage in PKCS#10 is 0x7Oct 15 19:50:58.699:CRYPTO_CS:signatureOct 15 19:50:58.699:CRYPTO_CS:key_usage is 1Oct 15 19:50:58.703:CRYPTO_CS:enrollment request with pendingID 1 sentto the CAOct 15 19:50:58.707:CRYPTO_CS:write SCEP:registered and bound service
Cisco IOS Debug Command Reference - Commands A through D 151
debug clns esis events through debug dbconn tcpdebug crypto pki server
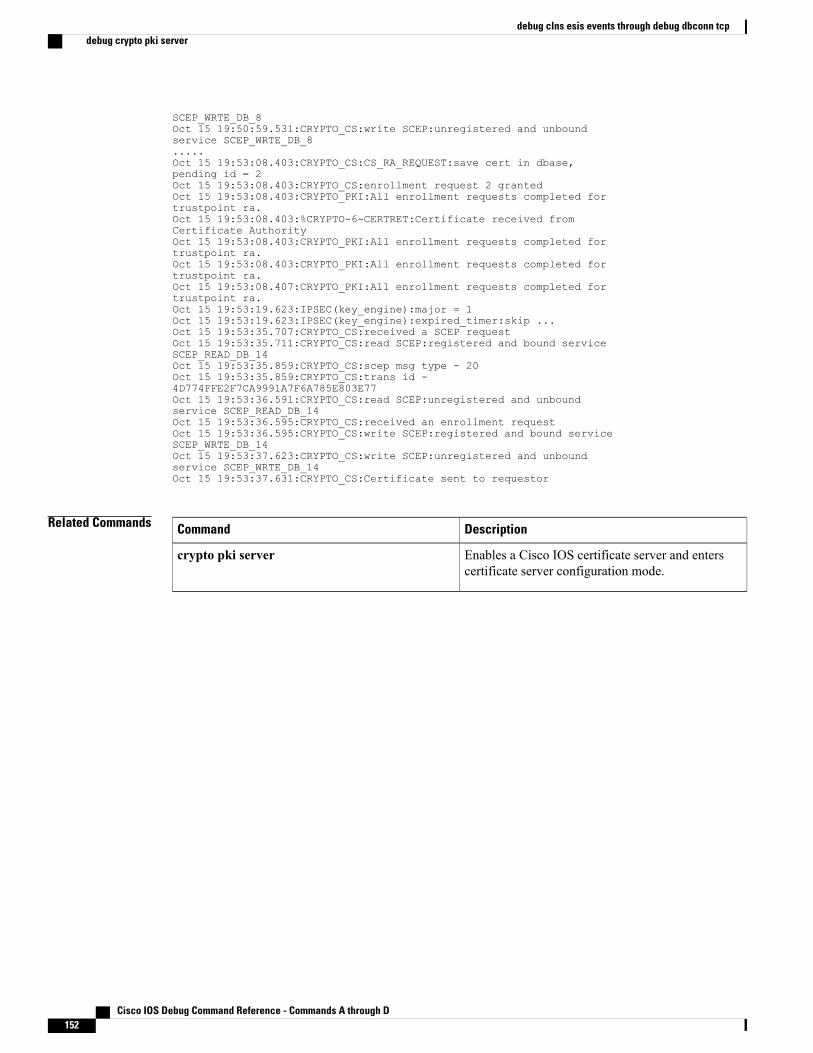
SCEP_WRTE_DB_8Oct 15 19:50:59.531:CRYPTO_CS:write SCEP:unregistered and unboundservice SCEP_WRTE_DB_8.....Oct 15 19:53:08.403:CRYPTO_CS:CS_RA_REQUEST:save cert in dbase,pending id = 2Oct 15 19:53:08.403:CRYPTO_CS:enrollment request 2 grantedOct 15 19:53:08.403:CRYPTO_PKI:All enrollment requests completed fortrustpoint ra.Oct 15 19:53:08.403:%CRYPTO-6-CERTRET:Certificate received fromCertificate AuthorityOct 15 19:53:08.403:CRYPTO_PKI:All enrollment requests completed fortrustpoint ra.Oct 15 19:53:08.403:CRYPTO_PKI:All enrollment requests completed fortrustpoint ra.Oct 15 19:53:08.407:CRYPTO_PKI:All enrollment requests completed fortrustpoint ra.Oct 15 19:53:19.623:IPSEC(key_engine):major = 1Oct 15 19:53:19.623:IPSEC(key_engine):expired_timer:skip ...Oct 15 19:53:35.707:CRYPTO_CS:received a SCEP requestOct 15 19:53:35.711:CRYPTO_CS:read SCEP:registered and bound serviceSCEP_READ_DB_14Oct 15 19:53:35.859:CRYPTO_CS:scep msg type - 20Oct 15 19:53:35.859:CRYPTO_CS:trans id -4D774FFE2F7CA9991A7F6A785E803E77Oct 15 19:53:36.591:CRYPTO_CS:read SCEP:unregistered and unboundservice SCEP_READ_DB_14Oct 15 19:53:36.595:CRYPTO_CS:received an enrollment requestOct 15 19:53:36.595:CRYPTO_CS:write SCEP:registered and bound serviceSCEP_WRTE_DB_14Oct 15 19:53:37.623:CRYPTO_CS:write SCEP:unregistered and unboundservice SCEP_WRTE_DB_14Oct 15 19:53:37.631:CRYPTO_CS:Certificate sent to requestor
Related Commands DescriptionCommand
Enables a Cisco IOS certificate server and enterscertificate server configuration mode.
crypto pki server
Cisco IOS Debug Command Reference - Commands A through D152
debug clns esis events through debug dbconn tcpdebug crypto pki server
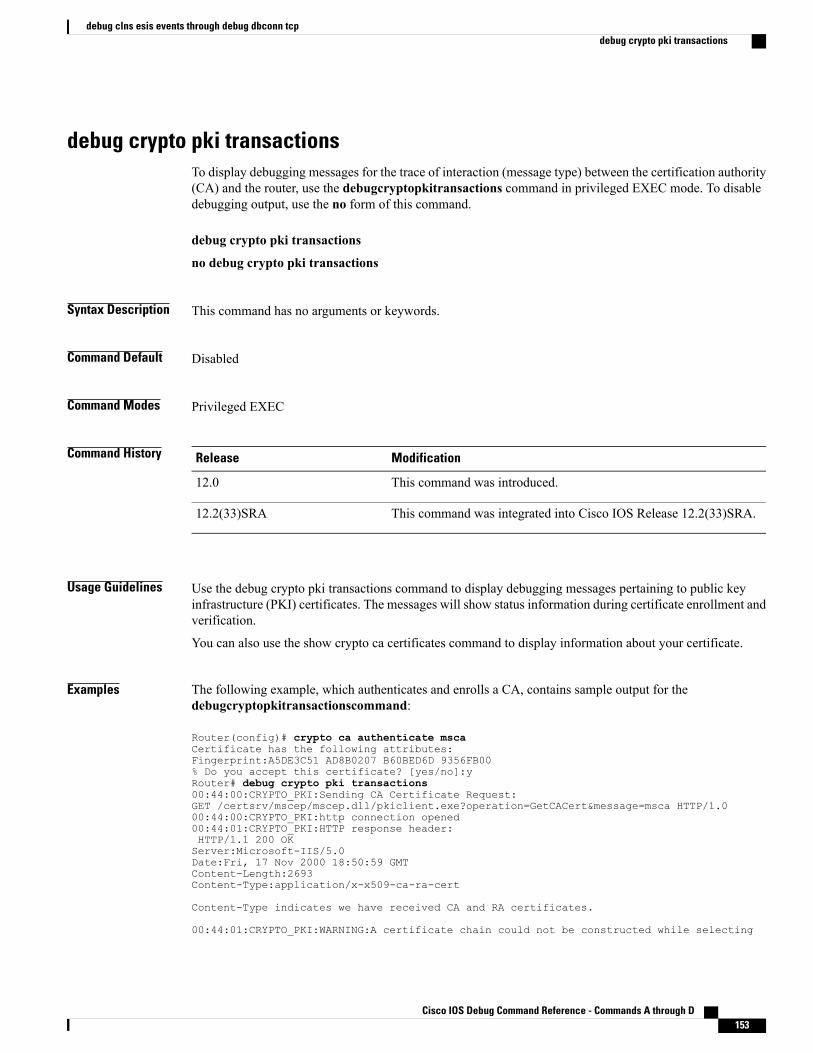
debug crypto pki transactionsTo display debugging messages for the trace of interaction (message type) between the certification authority(CA) and the router, use the debugcryptopkitransactions command in privileged EXEC mode. To disabledebugging output, use the no form of this command.
debug crypto pki transactions
no debug crypto pki transactions
Syntax Description This command has no arguments or keywords.
Command Default Disabled
Command Modes Privileged EXEC
Command History ModificationRelease
This command was introduced.12.0
This command was integrated into Cisco IOS Release 12.2(33)SRA.12.2(33)SRA
Usage Guidelines Use the debug crypto pki transactions command to display debugging messages pertaining to public keyinfrastructure (PKI) certificates. The messages will show status information during certificate enrollment andverification.
You can also use the show crypto ca certificates command to display information about your certificate.
Examples The following example, which authenticates and enrolls a CA, contains sample output for thedebugcryptopkitransactionscommand:
Router(config)# crypto ca authenticate mscaCertificate has the following attributes:Fingerprint:A5DE3C51 AD8B0207 B60BED6D 9356FB00% Do you accept this certificate? [yes/no]:yRouter# debug crypto pki transactions00:44:00:CRYPTO_PKI:Sending CA Certificate Request:GET /certsrv/mscep/mscep.dll/pkiclient.exe?operation=GetCACert&message=msca HTTP/1.000:44:00:CRYPTO_PKI:http connection opened00:44:01:CRYPTO_PKI:HTTP response header:HTTP/1.1 200 OKServer:Microsoft-IIS/5.0Date:Fri, 17 Nov 2000 18:50:59 GMTContent-Length:2693Content-Type:application/x-x509-ca-ra-cert
Content-Type indicates we have received CA and RA certificates.
00:44:01:CRYPTO_PKI:WARNING:A certificate chain could not be constructed while selecting
Cisco IOS Debug Command Reference - Commands A through D 153
debug clns esis events through debug dbconn tcpdebug crypto pki transactions
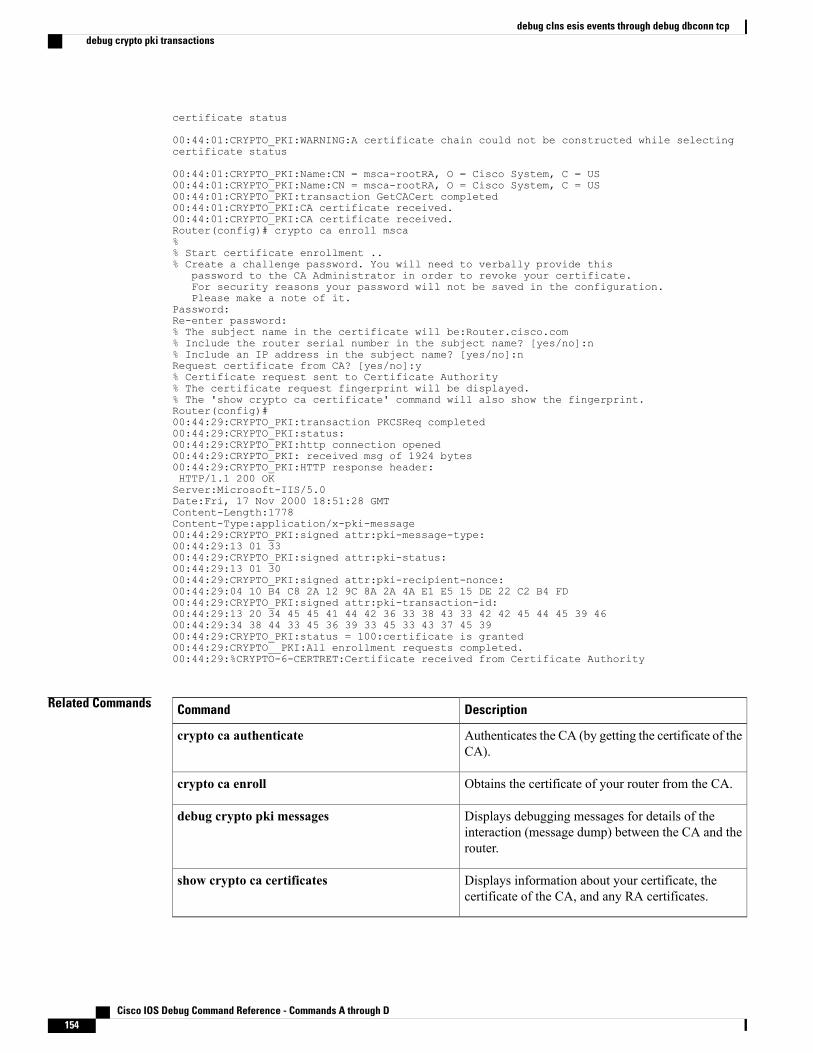
certificate status
00:44:01:CRYPTO_PKI:WARNING:A certificate chain could not be constructed while selectingcertificate status
00:44:01:CRYPTO_PKI:Name:CN = msca-rootRA, O = Cisco System, C = US00:44:01:CRYPTO_PKI:Name:CN = msca-rootRA, O = Cisco System, C = US00:44:01:CRYPTO_PKI:transaction GetCACert completed00:44:01:CRYPTO_PKI:CA certificate received.00:44:01:CRYPTO_PKI:CA certificate received.Router(config)# crypto ca enroll msca%% Start certificate enrollment ..% Create a challenge password. You will need to verbally provide this
password to the CA Administrator in order to revoke your certificate.For security reasons your password will not be saved in the configuration.Please make a note of it.
Password:Re-enter password:% The subject name in the certificate will be:Router.cisco.com% Include the router serial number in the subject name? [yes/no]:n% Include an IP address in the subject name? [yes/no]:nRequest certificate from CA? [yes/no]:y% Certificate request sent to Certificate Authority% The certificate request fingerprint will be displayed.% The 'show crypto ca certificate' command will also show the fingerprint.Router(config)#00:44:29:CRYPTO_PKI:transaction PKCSReq completed00:44:29:CRYPTO_PKI:status:00:44:29:CRYPTO_PKI:http connection opened00:44:29:CRYPTO_PKI: received msg of 1924 bytes00:44:29:CRYPTO_PKI:HTTP response header:HTTP/1.1 200 OKServer:Microsoft-IIS/5.0Date:Fri, 17 Nov 2000 18:51:28 GMTContent-Length:1778Content-Type:application/x-pki-message00:44:29:CRYPTO_PKI:signed attr:pki-message-type:00:44:29:13 01 3300:44:29:CRYPTO_PKI:signed attr:pki-status:00:44:29:13 01 3000:44:29:CRYPTO_PKI:signed attr:pki-recipient-nonce:00:44:29:04 10 B4 C8 2A 12 9C 8A 2A 4A E1 E5 15 DE 22 C2 B4 FD00:44:29:CRYPTO_PKI:signed attr:pki-transaction-id:00:44:29:13 20 34 45 45 41 44 42 36 33 38 43 33 42 42 45 44 45 39 4600:44:29:34 38 44 33 45 36 39 33 45 33 43 37 45 3900:44:29:CRYPTO_PKI:status = 100:certificate is granted00:44:29:CRYPTO__PKI:All enrollment requests completed.00:44:29:%CRYPTO-6-CERTRET:Certificate received from Certificate Authority
Related Commands DescriptionCommand
Authenticates the CA (by getting the certificate of theCA).
crypto ca authenticate
Obtains the certificate of your router from the CA.crypto ca enroll
Displays debugging messages for details of theinteraction (message dump) between the CA and therouter.
debug crypto pki messages
Displays information about your certificate, thecertificate of the CA, and any RA certificates.
show crypto ca certificates
Cisco IOS Debug Command Reference - Commands A through D154
debug clns esis events through debug dbconn tcpdebug crypto pki transactions
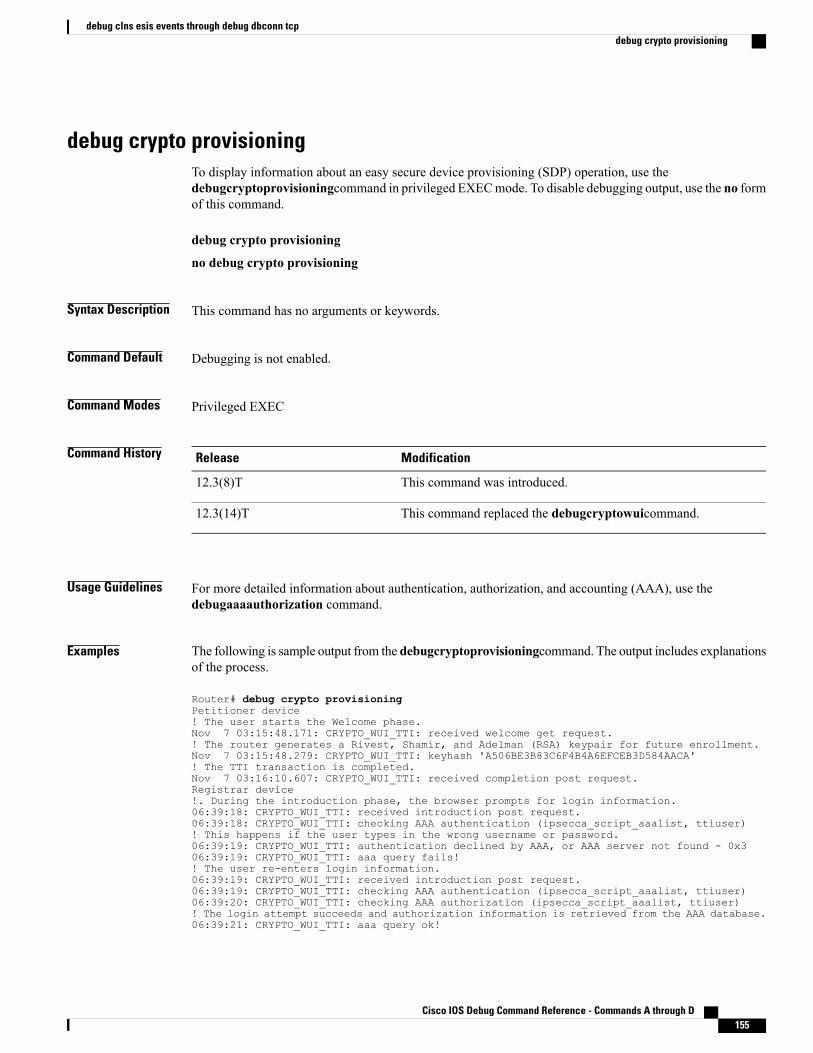
debug crypto provisioningTo display information about an easy secure device provisioning (SDP) operation, use thedebugcryptoprovisioningcommand in privileged EXECmode. To disable debugging output, use the no formof this command.
debug crypto provisioning
no debug crypto provisioning
Syntax Description This command has no arguments or keywords.
Command Default Debugging is not enabled.
Command Modes Privileged EXEC
Command History ModificationRelease
This command was introduced.12.3(8)T
This command replaced the debugcryptowuicommand.12.3(14)T
Usage Guidelines For more detailed information about authentication, authorization, and accounting (AAA), use thedebugaaaauthorization command.
Examples The following is sample output from the debugcryptoprovisioningcommand. The output includes explanationsof the process.
Router# debug crypto provisioningPetitioner device! The user starts the Welcome phase.Nov 7 03:15:48.171: CRYPTO_WUI_TTI: received welcome get request.! The router generates a Rivest, Shamir, and Adelman (RSA) keypair for future enrollment.Nov 7 03:15:48.279: CRYPTO_WUI_TTI: keyhash 'A506BE3B83C6F4B4A6EFCEB3D584AACA'! The TTI transaction is completed.Nov 7 03:16:10.607: CRYPTO_WUI_TTI: received completion post request.Registrar device!. During the introduction phase, the browser prompts for login information.06:39:18: CRYPTO_WUI_TTI: received introduction post request.06:39:18: CRYPTO_WUI_TTI: checking AAA authentication (ipsecca_script_aaalist, ttiuser)! This happens if the user types in the wrong username or password.06:39:19: CRYPTO_WUI_TTI: authentication declined by AAA, or AAA server not found - 0x306:39:19: CRYPTO_WUI_TTI: aaa query fails!! The user re-enters login information.06:39:19: CRYPTO_WUI_TTI: received introduction post request.06:39:19: CRYPTO_WUI_TTI: checking AAA authentication (ipsecca_script_aaalist, ttiuser)06:39:20: CRYPTO_WUI_TTI: checking AAA authorization (ipsecca_script_aaalist, ttiuser)! The login attempt succeeds and authorization information is retrieved from the AAA database.06:39:21: CRYPTO_WUI_TTI: aaa query ok!
Cisco IOS Debug Command Reference - Commands A through D 155
debug clns esis events through debug dbconn tcpdebug crypto provisioning

! These attributes are inserted into the configuration template.06:39:21: CRYPTO_WUI_TTI: building TTI av pairs from AAA attributes06:39:21: CRYPTO_WUI_TTI: "subjectname" = "CN=user, O=company, C=country"06:39:21: CRYPTO_WUI_TTI: "$1" = "ntp server 192.0.2.1"06:39:21: CRYPTO_WUI_TTI: "$2" = "hostname user-vpn"! The registrar stores this subject name and overrides the subject name in the subsequentenrollment request.06:39:21: CRYPTO_WUI_TTI: subjectname=CN=user, O=company, C=country! The registrar stores this key information so that it may be used to automatically grantthe subsequent enrollment request.06:39:21: CRYPTO_WUI_TTI: key_hash=A506BE3B83C6F4B4A6EFCEB3D584AACA
Related Commands DescriptionCommand
Authenticates the introducer in an SDP operation.authentication list (tti-registrar)
Specifies the appropriate authorized fields for thecertificate subject name and list of template variablesto be expanded into the Cisco IOS CLI snippet thatis sent back to the petitioner in an SDP operation.
authorization list (tti-registrar)
Displays information on AAA TACACS+authorization.
debug aaa authorization
Specifies a remote URL for a Cisco IOS CLIconfiguration template.
template config
Establishes a template username and password toaccess the configuration template on the file system.
template username
Cisco IOS Debug Command Reference - Commands A through D156
debug clns esis events through debug dbconn tcpdebug crypto provisioning

debug crypto sesmgmtTo show connection setup messages and their flow through the router, use the debugcryptosesmgmtcommandin privileged EXEC mode. To disable debugging output, use the no form of this command.
debug crypto sesmgmt
no debug crypto sesmgmt
Syntax Description This command has no arguments or keywords.
Command Modes Privileged EXEC
Usage Guidelines Encryption and authentication are provided by a software service on the router called a cryptoengine. Thecrypto engine performs authentication through Digital Signature Standard (DSS) public and private keys whena connection is set up. DSS is a means of sending a "signature" at the end of a message that positively identifiesthe author of the message. The signature cannot be forged or duplicated by others, so whoever receives amessage with a DSS signature knows exactly who sent the message.
When connections are not completing, use the debugcryptosesmgmt command to follow the progress ofconnection messages as a first step in diagnosing the problem. You see a record of each connection messageas the router discovers it, and can track its progress through the necessary signing, verifying, and encryptionsession setup operations. Other significant connection setup events, such as the pregeneration of Diffie-Hellmanpublic numbers, are also shown. For information on Diffie-Hellman public numbers, refer to the Cisco IOSSecurity Configuration Guide .
Also use the showcryptoconnections command to display additional information on connections.
Examples The following is sample output from the debugcryptosesmgmt command. The first shows messages from arouter that initiates a successful connection. The second shows messages from a router that receives aconnection.
Router# debug crypto sesmgmtCRYPTO: Dequeued a message: Inititate_ConnectionCRYPTO: DH gen phase 1 status for conn_id 2 slot 0:OKCRYPTO: Signing done. Status:OKCRYPTO: ICMP message sent: s=172.21.114.163, d=172.21.114.162CRYPTO-SDU: send_nnc_req: NNC Echo Request sentCRYPTO: Dequeued a message: CRMCRYPTO: DH gen phase 2 status for conn_id 2 slot 0:OKCRYPTO: Verify done. Status=OKCRYPTO: Signing done. Status:OKCRYPTO: ICMP message sent: s=172.21.114.163, d=172.21.114.162CRYPTO-SDU: recv_nnc_rpy: NNC Echo Confirm sentCRYPTO: Create encryption key for conn_id 2 slot 0:OKCRYPTO: Replacing -2 in crypto maps with 2 (slot 0)Router# debug crypto sesmgmtCRYPTO: Dequeued a message: CIMCRYPTO: Verify done. Status=OKCRYPTO: DH gen phase 1 status for conn_id 1 slot 0:OKCRYPTO: DH gen phase 2 status for conn_id 1 slot 0:OKCRYPTO: Signing done. Status:OKCRYPTO: ICMP message sent: s=172.21.114.162, d=172.21.114.163CRYPTO-SDU: act_on_nnc_req: NNC Echo Reply sent
Cisco IOS Debug Command Reference - Commands A through D 157
debug clns esis events through debug dbconn tcpdebug crypto sesmgmt
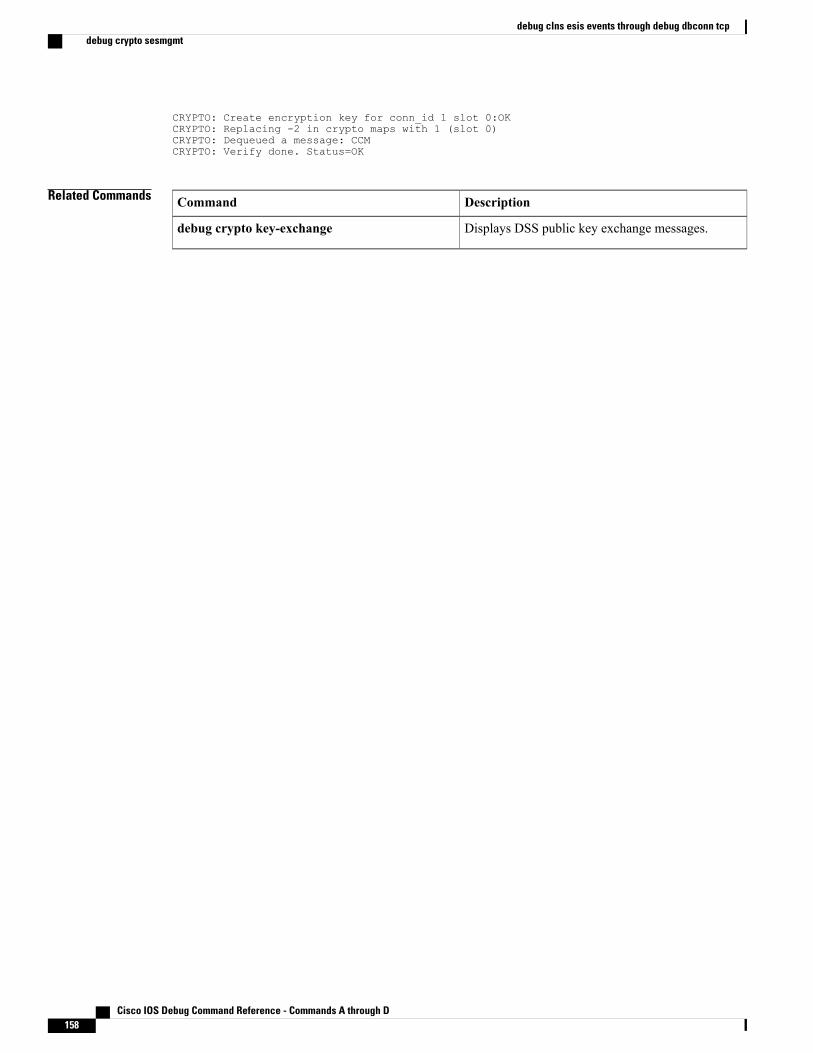
CRYPTO: Create encryption key for conn_id 1 slot 0:OKCRYPTO: Replacing -2 in crypto maps with 1 (slot 0)CRYPTO: Dequeued a message: CCMCRYPTO: Verify done. Status=OK
Related Commands DescriptionCommand
Displays DSS public key exchange messages.debug crypto key-exchange
Cisco IOS Debug Command Reference - Commands A through D158
debug clns esis events through debug dbconn tcpdebug crypto sesmgmt

debug csm neatTo turn on debugging for all Call Switching Module (CSM) Voice over IP (VoIP) calls, use thedebugcsmneatcommand in privileged EXEC mode. To disable debugging output, use the no form of thiscommand.
debug csm neat [slot| dspm| dsp| dsp-channel]
no debug csm neat [slot| dspm| dsp| dsp-channel]
Syntax Description (Optional) Identifies the location of a particular digitalsignal processor (DSP) channel.
slot | dspm | dsp | dsp-channel
Command Modes Privileged EXEC (#)
Command History ModificationRelease
This command was introduced.12.4(9)T
This command is supported in the Cisco IOS Release 12.2SX train. Supportin a specific 12.2SX release of this train depends on your feature set, platform,and platform hardware.
12.2SX
Usage Guidelines The debugcsmneatcommand turns on debugging for all CSM VoIP calls. If no arguments are specified,debugging is enabled for all voice calls.
The debugcsmneat command does not display any information if you try to debug ISDN voice calls. Toview debugging information about ISDN calls, use the debugcdapi command.
Note
The nodebugcmsneat command turns off debugging information for all voice calls.
If the slot,dspm,dsp,ordsp-channel arguments are specified (if the specified DSP channel is engaged in a CSMcall), CSM call-related debugging information is turned on for this channel. The noform of this commandturns off debugging for that particular channel.
Examples The following examples show sample output from the debugcsmneat command. The following shows thatCSM has received an event from ISDN.
Router# debug csm neatMarch 18 04:05:07.052: EVENT_FROM_ISDN::dchan_idb=0x60D7B6B8, call_id=0xCF, ces=0x1bchan=0x0, event=0x1, cause=0x0The table below describes the significant fields shown in the display.
Cisco IOS Debug Command Reference - Commands A through D 159
debug clns esis events through debug dbconn tcpdebug csm neat
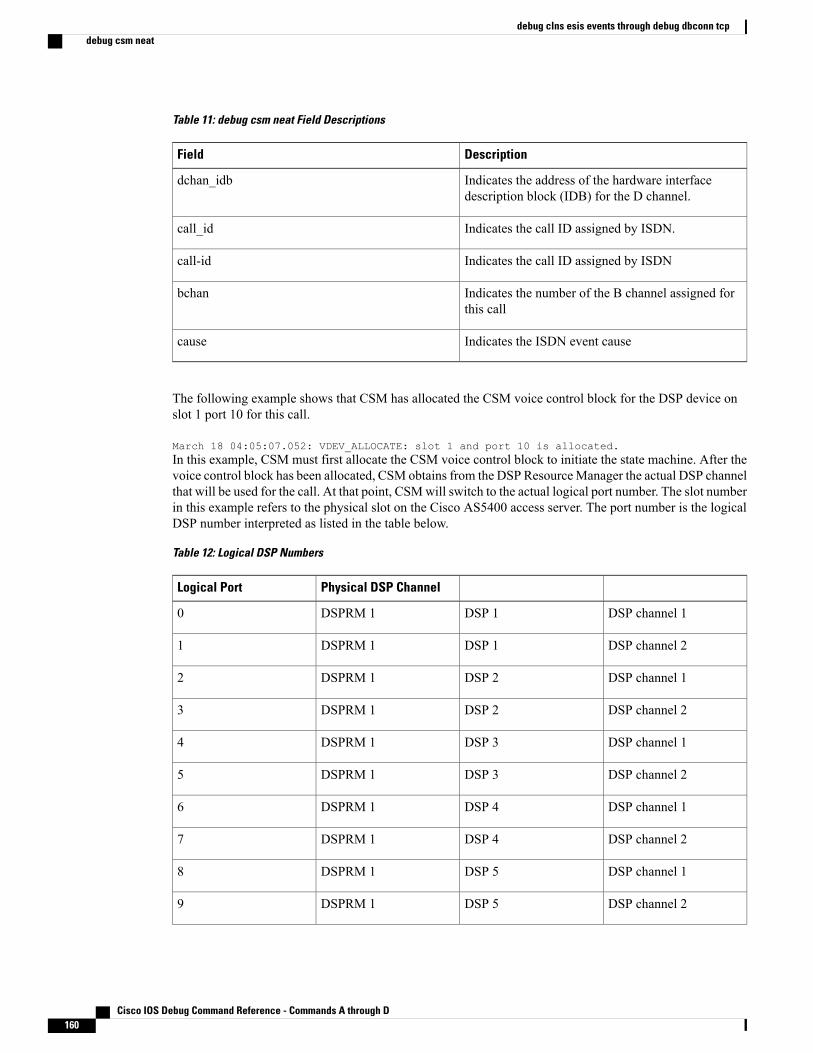
Table 11: debug csm neat Field Descriptions
DescriptionField
Indicates the address of the hardware interfacedescription block (IDB) for the D channel.
dchan_idb
Indicates the call ID assigned by ISDN.call_id
Indicates the call ID assigned by ISDNcall-id
Indicates the number of the B channel assigned forthis call
bchan
Indicates the ISDN event causecause
The following example shows that CSM has allocated the CSM voice control block for the DSP device onslot 1 port 10 for this call.
March 18 04:05:07.052: VDEV_ALLOCATE: slot 1 and port 10 is allocated.In this example, CSM must first allocate the CSM voice control block to initiate the state machine. After thevoice control block has been allocated, CSM obtains from the DSP ResourceManager the actual DSP channelthat will be used for the call. At that point, CSMwill switch to the actual logical port number. The slot numberin this example refers to the physical slot on the Cisco AS5400 access server. The port number is the logicalDSP number interpreted as listed in the table below.
Table 12: Logical DSP Numbers
Physical DSP ChannelLogical Port
DSP channel 1DSP 1DSPRM 10
DSP channel 2DSP 1DSPRM 11
DSP channel 1DSP 2DSPRM 12
DSP channel 2DSP 2DSPRM 13
DSP channel 1DSP 3DSPRM 14
DSP channel 2DSP 3DSPRM 15
DSP channel 1DSP 4DSPRM 16
DSP channel 2DSP 4DSPRM 17
DSP channel 1DSP 5DSPRM 18
DSP channel 2DSP 5DSPRM 19
Cisco IOS Debug Command Reference - Commands A through D160
debug clns esis events through debug dbconn tcpdebug csm neat
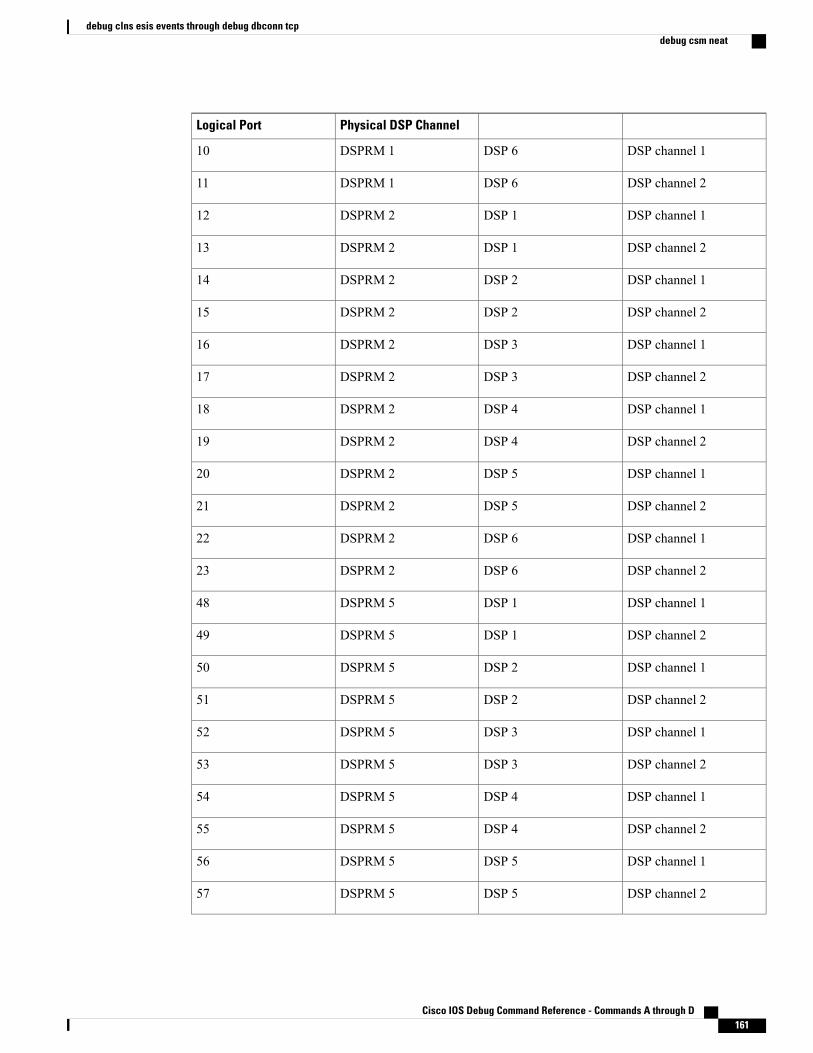
Physical DSP ChannelLogical Port
DSP channel 1DSP 6DSPRM 110
DSP channel 2DSP 6DSPRM 111
DSP channel 1DSP 1DSPRM 212
DSP channel 2DSP 1DSPRM 213
DSP channel 1DSP 2DSPRM 214
DSP channel 2DSP 2DSPRM 215
DSP channel 1DSP 3DSPRM 216
DSP channel 2DSP 3DSPRM 217
DSP channel 1DSP 4DSPRM 218
DSP channel 2DSP 4DSPRM 219
DSP channel 1DSP 5DSPRM 220
DSP channel 2DSP 5DSPRM 221
DSP channel 1DSP 6DSPRM 222
DSP channel 2DSP 6DSPRM 223
DSP channel 1DSP 1DSPRM 548
DSP channel 2DSP 1DSPRM 549
DSP channel 1DSP 2DSPRM 550
DSP channel 2DSP 2DSPRM 551
DSP channel 1DSP 3DSPRM 552
DSP channel 2DSP 3DSPRM 553
DSP channel 1DSP 4DSPRM 554
DSP channel 2DSP 4DSPRM 555
DSP channel 1DSP 5DSPRM 556
DSP channel 2DSP 5DSPRM 557
Cisco IOS Debug Command Reference - Commands A through D 161
debug clns esis events through debug dbconn tcpdebug csm neat
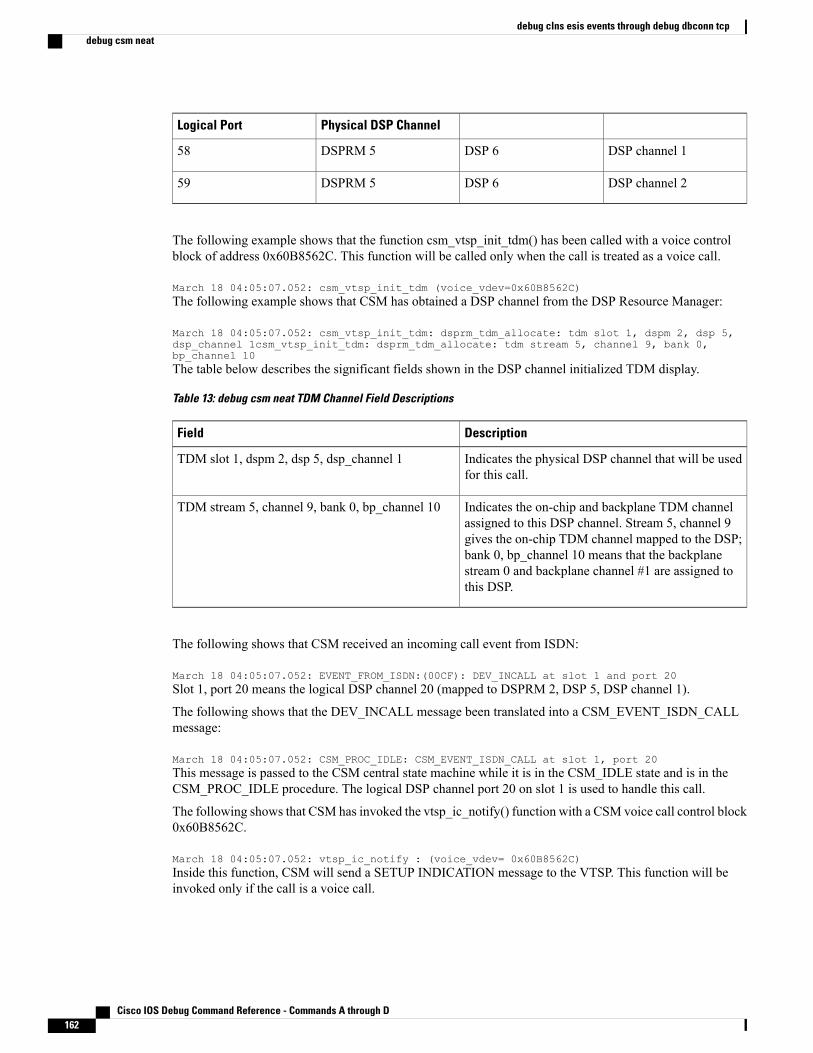
Physical DSP ChannelLogical Port
DSP channel 1DSP 6DSPRM 558
DSP channel 2DSP 6DSPRM 559
The following example shows that the function csm_vtsp_init_tdm() has been called with a voice controlblock of address 0x60B8562C. This function will be called only when the call is treated as a voice call.
March 18 04:05:07.052: csm_vtsp_init_tdm (voice_vdev=0x60B8562C)The following example shows that CSM has obtained a DSP channel from the DSP Resource Manager:
March 18 04:05:07.052: csm_vtsp_init_tdm: dsprm_tdm_allocate: tdm slot 1, dspm 2, dsp 5,dsp_channel 1csm_vtsp_init_tdm: dsprm_tdm_allocate: tdm stream 5, channel 9, bank 0,bp_channel 10The table below describes the significant fields shown in the DSP channel initialized TDM display.
Table 13: debug csm neat TDM Channel Field Descriptions
DescriptionField
Indicates the physical DSP channel that will be usedfor this call.
TDM slot 1, dspm 2, dsp 5, dsp_channel 1
Indicates the on-chip and backplane TDM channelassigned to this DSP channel. Stream 5, channel 9gives the on-chip TDM channel mapped to the DSP;bank 0, bp_channel 10 means that the backplanestream 0 and backplane channel #1 are assigned tothis DSP.
TDM stream 5, channel 9, bank 0, bp_channel 10
The following shows that CSM received an incoming call event from ISDN:
March 18 04:05:07.052: EVENT_FROM_ISDN:(00CF): DEV_INCALL at slot 1 and port 20Slot 1, port 20 means the logical DSP channel 20 (mapped to DSPRM 2, DSP 5, DSP channel 1).
The following shows that the DEV_INCALL message been translated into a CSM_EVENT_ISDN_CALLmessage:
March 18 04:05:07.052: CSM_PROC_IDLE: CSM_EVENT_ISDN_CALL at slot 1, port 20This message is passed to the CSM central state machine while it is in the CSM_IDLE state and is in theCSM_PROC_IDLE procedure. The logical DSP channel port 20 on slot 1 is used to handle this call.
The following shows that CSM has invoked the vtsp_ic_notify() function with a CSM voice call control block0x60B8562C.
March 18 04:05:07.052: vtsp_ic_notify : (voice_vdev= 0x60B8562C)Inside this function, CSM will send a SETUP INDICATION message to the VTSP. This function will beinvoked only if the call is a voice call.
Cisco IOS Debug Command Reference - Commands A through D162
debug clns esis events through debug dbconn tcpdebug csm neat
The following shows that CSM received a SETUP INDICATION RESPONSE message from the VTSP asan acknowledgment.
March 18 04:05:07.056: csm_vtsp_call_setup_resp (vdev_info=0x60B8562C, vtsp_cdb=0x60FCA114)
This means that the VTSP received the CALL SETUP INDICATION message previously sent and hasproceeded to process the call.
• vdev_info--Contains the address of the CSM voice data block.
• vtsp_cdb--Contains the address of the VTSP call control block.
The following shows that CSM received a CALL CONNECT message from the VTSP:
March 18 04:05:07.596: csm_vtsp_call_connect (vtsp_cdb=0x60FCA114, voice_vdev=0x60B8562C)This indicates that the VTSP received a CONNECT message for the call leg initiated to the Internet side.
• vtsp_cdb--Contains the address of the VTSP call control block.
• voice_vdev--Contains the address of the CSM voice data block.
The following shows that while CSM is in the CSM_IC2_RING state, it receives a SETUP INDICATIONRESPONSE from the VTSP. This message is translated into CSM_EVENT_MODEM_OFFHOOKand passedto the CSM central state machine.
March 18 04:05:07.596: CSM_PROC_IC2_RING: CSM_EVENT_MODEM_OFFHOOK at slot 1, port 20The following shows that CSM received a CONNECT message from ISDN for the call using the logical DSPchannel on slot 1 and port 20:
March 18 04:05:07.616: EVENT_FROM_ISDN:(00CF): DEV_CONNECTED at slot 1 and port 20The following shows that CSM translated the CONNECT event from ISDN into theCSM_EVENT_ISDN_CONNECTED message, which is then passed to the CSM central state machine:
March 18 04:05:07.616: CSM_PROC_IC4_WAIT_FOR_CARRIER: CSM_EVENT_ISDN_CONNECTED at slot 1,port 20The following shows that CSM received a CALL SETUP REQUEST from the VTSP:
May 16 12:22:27.580: csm_vtsp_call_setup_request (vtsp_cdb=0x60FCFA20, vtsp_sdb=0x60DFB608)
This represents a request to make an outgoing call to the PSTN.
• vtsp_cdb--Contains the address of the VTSP call control block.
• vtsp_sdb--Contains the address of the signalling data block for the signalling interface to be used to sendthe outgoing call.
The following shows that the physical DSP channel has been allocated for this outgoing call:
May 16 12:22:27.580: csm_vtsp_call_setup_request: tdm slot 1, dspm 5, dsp 4, dsp_channel 1The following shows the on-chip and backplane TDM channel assigned to this DSP channel:
May 16 12:22:27.580: csm_vtsp_call_setup_request: tdm stream 5, channel 25, bank 0, bp_channel27In this sample output, tdm stream 5, channel 25, bank 0, bp_channel 27 indicates the on-chip and backplaneTDM channel assigned to this DSP channel. Stream 5, channel 25 gives the on-chip TDM channel mapped
Cisco IOS Debug Command Reference - Commands A through D 163
debug clns esis events through debug dbconn tcpdebug csm neat

to the DSP; bank 0, bp_channel 27 means that the backplane stream 0 and backplane channel 1 are assignedto this DSP.
The following shows the calling number and the called number for this call.
May 16 12:22:27.580: csm_vtsp_call_setup_request: calling number: 10001, called number:30001The following shows that the CALL SETUP REQUEST from the VTSP has been translated into the 'CSM_EVENT_MODEM_OFFHOOK message and is passed to the CSM central state machine:
May 16 12:22:27.580: CSM_PROC_IDLE: CSM_EVENT_MODEM_OFFHOOK at slot 1, port 54The logical DSP channel number for the DSP (slot 1, port 54) is now displayed, which maps to the physicalDSP channel slot 1, dspm 5, dsp 4, dsp_channel 1.
The following shows that CSM collected all the digits for dialing out:
May 16 12:22:27.580: CSM_PROC_OC3_COLLECT_ALL_DIGIT: CSM_EVENT_GET_ALL_DIGITS at slot 1,port 54For PRI and for applications that do not require digit collection of outdialing digits (for example, voice calls),the intermediate digit collection states are omitted and the CSM state machine moves to this state directly,pretending that the digit collection has been done.
The following shows an information message:
March 16 12:22:27.580: CSM_PROC_OC3_COLLECT_ALL_DIGIT: called party num: (30001) at slot1, port 54The following shows that CSM attempts to find a free signalling D channel to direct the outgoing call:
March 16 12:22:27.580: csm_vtsp_check_dchan (voice_vdev=0x60B8562C)March 16 12:22:27.580: csm_vtsp_check_dchan (vtsp requested dchan=0x60D7ACB0,dchan_idb=0x60E8ACF0)March 16 12:22:27.580: csm_vtsp_check_dchan (voice_vdev=0x60B8562C)March 16 12:22:27.580: csm_vtsp_check_dchan (vtsp requested dchan=0x60D7ACB0,dchan_idb=0x60D7ACB0)In the case of voice calls, the free signaling D channel must match the voice interface specified inside thesignalling data block (vtsp_sdb) passed from the VTSP.
The following shows that CSM has received an event from ISDN:
March 16 12:22:27.624: EVENT_FROM_ISDN::dchan_idb=0x60D7ACB0, call_id=0xA121, ces=0x1bchan=0x1E, event=0x3, cause=0x0In this sample output:
• dchan_idb--Indicates the address of the hardware IDB for the D channel
• call_id--Indicates the call id assigned by ISDN
• bchan--Indicates the number of the B channel assigned for this call
• cause--Indicates the ISDN event cause
The following shows that CSM has received a CALL PROCEEDING message from ISDN.
March 16 12:22:27.624: EVENT_FROM_ISDN:(A121): DEV_CALL_PROC at slot 1 and port 54The following shows that the CALL PROCEEDING event received from ISDN has been interpreted as aCSM_EVENT_ISDN_BCHAN_ASSIGNED message:
March 16 12:22:27.624: CSM_PROC_OC4_DIALING: CSM_EVENT_ISDN_BCHAN_ASSIGNED at slot 1, port54
Cisco IOS Debug Command Reference - Commands A through D164
debug clns esis events through debug dbconn tcpdebug csm neat
ISDN has assigned a B channel for this outgoing call. This B channel must be on the same PRI span as thesignalling D channel allocated previously.
The following shows that the csm_vtsp_setup_for_oc function is called:
March 16 12:22:27.624: csm_vtsp_setup_for_oc (voice_vdev=0x60B8562C)This is invoked when an outgoing call initiated by the VTSP receives a response from the ISDN stack.
The following shows that ISDN has sent a CONNECT message to CSM indicating that the call leg to thePSTN side has been established:
March 16 12:22:28.084: EVENT_FROM_ISDN::dchan_idb=0x60D7ACB0, call_id=0xA121, ces=0x1bchan=0x1E, event=0x4, cause=0x0
March 16 12:22:28.084: EVENT_FROM_ISDN:(A121): DEV_CONNECTED at slot 1 and port 54The following shows that while CSM is in the OC5_WAIT_FOR_CARRIER state, it has received the'CONNECT'message from ISDN and has translated it into the CSM_EVENT_ISDN_CONNECTEDmessage,which is passed to the CSM central state machine:
March 16 12:22:28.084: CSM_PROC_OC5_WAIT_FOR_CARRIER: CSM_EVENT_ISDN_CONNECTED at slot 1,port 54The following shows that the function vtsp_confirm_oc() has been called:
March 16 12:22:28.084: vtsp_confirm_oc : (voice_vdev= 0x60B8562C)This is invoked after CSM received the CONNECT message from ISDN. CSM sends a confirmation of theCONNECT to the VTSP.
Cisco IOS Debug Command Reference - Commands A through D 165
debug clns esis events through debug dbconn tcpdebug csm neat

debug csm tgrmTo view Call Switching Module (CSM) trunk group resource manager information, use thedebugcsmtgrmcommand in privileged EXEC mode. To disable debugging output, use the no form of thiscommand.
debug csm tgrm
no debug csm tgrm
Syntax Description This command has no arguments or keywords.
Command Default Disabled
Command Modes Privileged EXEC
Command History ModificationRelease
This command was introduced.12.2(11)T
This commandwas integrated into Cisco IOS Release 12.2(33)SRA.12.2(33)SRA
Usage Guidelines Disable console logging and use buffered logging before using the debug csm tgrm command. Using thedebug csm tgrm command generates a large volume of debugs, which can affect router performance.
Examples The following is sample output from the debug csm tgrm command. The output shows that the call type isvoice, the direction is incoming, and the call is accepted by the CSM.
Router# debug csm tgrm
Router#00:02:25:CSM-TGRM:csm_rx_cas_event_from_neat(EVENT_DIAL_IN) - c(T1 7/1:1:3) call_type=VOICE,dir=INCOMINGRouter#00:02:30:CSM-TGRM:csm_proc_ic3_wait_for_res_resp() c(T1 7/1:1:3) VOICE <ACCEPTED !!>The table below describes the significant fields shown in the display.
Table 14: debug csm tgrm Field Descriptions
DescriptionField
Type of call: VOICE or MODEM.call_type
Direction of the call: INCOMING or OUTGOING.dir
Cisco IOS Debug Command Reference - Commands A through D166
debug clns esis events through debug dbconn tcpdebug csm tgrm

Cisco IOS Debug Command Reference - Commands A through D 167
debug clns esis events through debug dbconn tcpdebug csm tgrm

debug csm voiceTo turn on debugging for all Call Switching Module (CSM) Voice over IP (VoIP) calls, use thedebugcsmvoicecommand in privileged EXEC mode. To disable debugging output, use the no form of thiscommand.
debug csm voice [slot| dspm| dsp| dsp-channel]
no debug csm voice [slot| dspm| dsp| dsp-channel]
Syntax Description (Optional) Identifies the location of a particular digitalsignal processor (DSP) channel.
slot | dspm | dsp | dsp-channel
Command Modes Privileged EXEC
Usage Guidelines The debugcsmvoicecommand turns on debugging for all CSM VoIP calls. If this command has no keywordspecified, then debugging is enabled for all voice calls.
The debugcsmvoice command does not display any information if you try to debug isdn voice calls. Toview debugging information about isdn calls, use the debugcdapi command.
Note
The nodebugcmsvoice command turns off debugging information for all voice calls.
If the slot|dspm|dsp|dsp-channel argument is specified, then (if the specified DSP channel is engaged in aCSM call) CSM call-related debugging information will be turned on for this channel. The noform of thiscommand turns off debugging for that particular channel.
Examples The following examples show sample output from the debugcsmvoice command. The following shows thatCSM has received an event from ISDN.
Router# debug csm voiceOct 18 04:05:07.052: EVENT_FROM_ISDN::dchan_idb=0x60D7B6B8, call_id=0xCF, ces=0x1bchan=0x0, event=0x1, cause=0x0In this example, terms are explained as follows:
• dchan_idb--Indicates the address of the hardware interface description block (IDB) for the D channel
• call_id--Indicates the call ID assigned by ISDN
• bchan--Indicates the number of the B channel assigned for this call
• cause--Indicates the ISDN event cause
Cisco IOS Debug Command Reference - Commands A through D168
debug clns esis events through debug dbconn tcpdebug csm voice

The following shows that CSM has allocated the CSM voice control block for the DSP device on slot 1 port10 for this call.
Oct 18 04:05:07.052: VDEV_ALLOCATE: slot 1 and port 10 is allocated.This AS5300 access server might not be actually used to handle this call. CSM must first allocate the CSMvoice control block to initiate the state machine. After the voice control block has been allocated, CSM obtainsfrom the DSP Resource Manager the actual DSP channel that will be used for the call. At that point, CSMwill switch to the actual logical port number. The slot number refers to the physical slot on the AS5300 accessserver. The port number is the logical DSP number interpreted as listed in the table below.
Table 15: Logical DSP Numbers
Physical DSP ChannelLogical Port Number
DSPRM 1, DSP 1, DSP channel 1Port 0
DSPRM 1, DSP 1, DSP channel 2Port 1
DSPRM 1, DSP 2, DSP channel 1Port 2
DSPRM 1, DSP 2, DSP channel 2Port 3
DSPRM 1, DSP 3, DSP channel 1Port 4
DSPRM 1, DSP 3, DSP channel 2Port 5
DSPRM 1, DSP 4, DSP channel 1Port 6
DSPRM 1, DSP 4, DSP channel 2Port 7
DSPRM 1, DSP 5, DSP channel 1Port 8
DSPRM 1, DSP 5, DSP channel 2Port 9
DSPRM 1, DSP 6, DSP channel 1Port 10
DSPRM 1, DSP 6, DSP channel 2Port 11
DSPRM 2, DSP 1, DSP channel 1Port 12
DSPRM 2, DSP 1, DSP channel 2Port 13
DSPRM 2, DSP 2, DSP channel 1Port 14
DSPRM 2, DSP 2, DSP channel 2Port 15
DSPRM 2, DSP 3, DSP channel 1Port 16
DSPRM 2, DSP 3, DSP channel 2Port 17
DSPRM 2, DSP 4, DSP channel 1Port 18
Cisco IOS Debug Command Reference - Commands A through D 169
debug clns esis events through debug dbconn tcpdebug csm voice

Physical DSP ChannelLogical Port Number
DSPRM 2, DSP 4, DSP channel 2Port 19
DSPRM 2, DSP 5, DSP channel 1Port 20
DSPRM 2, DSP 5, DSP channel 2Port 21
DSPRM 2, DSP 6, DSP channel 1Port 22
DSPRM 2, DSP 6, DSP channel 2Port 23
DSPRM 5, DSP 1, DSP channel 1Port 48
DSPRM 5, DSP 1, DSP channel 2Port 49
DSPRM 5, DSP 2, DSP channel 1Port 50
DSPRM 5, DSP 2, DSP channel 2Port 51
DSPRM 5, DSP 3, DSP channel 1Port 52
DSPRM 5, DSP 3, DSP channel 2Port 53
DSPRM 5, DSP 4, DSP channel 1Port 54
DSPRM 5, DSP 4, DSP channel 2Port 55
DSPRM 5, DSP 5, DSP channel 1Port 56
DSPRM 5, DSP 5, DSP channel 2Port 57
DSPRM 5, DSP 6, DSP channel 1Port 58
DSPRM 5, DSP 6, DSP channel 2Port 59
The following shows that the function csm_vtsp_init_tdm() has been called with a voice control block ofaddress 0x60B8562C. This function will be called only when the call is treated as a voice call.
Oct 18 04:05:07.052: csm_vtsp_init_tdm (voice_vdev=0x60B8562C)The following shows that CSM has obtained a DSP channel from the DSP Resource Manager:
Oct 18 04:05:07.052: csm_vtsp_init_tdm: dsprm_tdm_allocate: tdm slot 1, dspm 2, dsp 5,dsp_channel 1csm_vtsp_init_tdm: dsprm_tdm_allocate: tdm stream 5, channel 9, bank 0,bp_channel 10The DSP channel has the following initialized TDM channel information:
• TDM slot 1, dspm 2, dsp 5, dsp_channel 1--Indicates the physical DSP channel that will be used for thiscall.
Cisco IOS Debug Command Reference - Commands A through D170
debug clns esis events through debug dbconn tcpdebug csm voice

• TDM stream 5, channel 9, bank 0, bp_channel 10--Indicates the on-chip and backplane TDM channelassigned to this DSP channel. Stream 5, channel 9 gives the on-chip TDM channel mapped to the DSP;bank 0, bp_channel 10 means that the backplane stream 0 and backplane channel #1 are assigned to thisDSP.
The following shows that CSM has received an incoming call event from ISDN:
Oct 18 04:05:07.052: EVENT_FROM_ISDN:(00CF): DEV_INCALL at slot 1 and port 20Slot 1, port 20 means the logical DSP channel 20 (mapped to DSPRM 2, DSP 5, DSP channel 1).
The following shows that the DEV_INCALLmessage has been translated into a CSM_EVENT_ISDN_CALLmessage:
Oct 18 04:05:07.052: CSM_PROC_IDLE: CSM_EVENT_ISDN_CALL at slot 1, port 20This message is passed to the CSM central state machine while it is in the CSM_IDLE state and is in theCSM_PROC_IDLE procedure. The logical DSP channel port 20 on slot 1 is used to handle this call.
The following shows that CSM has invoked the vtsp_ic_notify() function with a CSM voice call control block0x60B8562C.
Oct 18 04:05:07.052: vtsp_ic_notify : (voice_vdev= 0x60B8562C)Inside this function, CSM will send a SETUP INDICATION message to the VTSP. This function will beinvoked only if the call is a voice call.
The following shows that CSM has received a SETUP INDICATION RESPONSE message from the VTSPas an acknowledgment.
Oct 18 04:05:07.056: csm_vtsp_call_setup_resp (vdev_info=0x60B8562C, vtsp_cdb=0x60FCA114)This means that the VTSP has received the CALL SETUP INDICATION message previously sent and hasproceeded to process the call.
• vdev_info--Contains the address of the CSM voice data block.
• vtsp_cdb--Contains the address of the VTSP call control block.
The following shows that CSM has received a CALL CONNECT message from the VTSP:
Oct 18 04:05:07.596: csm_vtsp_call_connect (vtsp_cdb=0x60FCA114, voice_vdev=0x60B8562C)This indicates that the VTSP has received a CONNECT message for the call leg initiated to the Internet side.
• vtsp_cdb--Contains the address of the VTSP call control block.
• voice_vdev--Contains the address of the CSM voice data block.
The following shows that while CSM is in the CSM_IC2_RING state, it receives a SETUP INDICATIONRESPONSE from the VTSP. This message is translated into CSM_EVENT_MODEM_OFFHOOKand passedto the CSM central state machine.
Oct 18 04:05:07.596: CSM_PROC_IC2_RING: CSM_EVENT_MODEM_OFFHOOK at slot 1, port 20The following shows that CSM has received a CONNECT message from ISDN for the call using the logicalDSP channel on slot 1 and port 20:
Oct 18 04:05:07.616: EVENT_FROM_ISDN:(00CF): DEV_CONNECTED at slot 1 and port 20
Cisco IOS Debug Command Reference - Commands A through D 171
debug clns esis events through debug dbconn tcpdebug csm voice

The following shows that CSM has translated the CONNECT event from ISDN into theCSM_EVENT_ISDN_CONNECTED message, which is then passed to the CSM central state machine:
Oct 18 04:05:07.616: CSM_PROC_IC4_WAIT_FOR_CARRIER: CSM_EVENT_ISDN_CONNECTED at slot 1,port 20The following shows that CSM has received a CALL SETUP REQUEST from the VTSP:
May 16 12:22:27.580: csm_vtsp_call_setup_request (vtsp_cdb=0x60FCFA20, vtsp_sdb=0x60DFB608)
This represents a request to make an outgoing call to the PSTN.
• vtsp_cdb--Contains the address of the VTSP call control block.
• vtsp_sdb--Contains the address of the signalling data block for the signalling interface to be used to sendthe outgoing call.
The following shows that the physical DSP channel has been allocated for this outgoing call:
May 16 12:22:27.580: csm_vtsp_call_setup_request: tdm slot 1, dspm 5, dsp 4, dsp_channel 1The following shows the on-chip and backplane TDM channel assigned to this DSP channel:
May 16 12:22:27.580: csm_vtsp_call_setup_request: tdm stream 5, channel 25, bank 0, bp_channel27In this sample output, tdm stream 5, channel 25, bank 0, bp_channel 27 indicates the on-chip and backplaneTDM channel assigned to this DSP channel. Stream 5, channel 25 gives the on-chip TDM channel mappedto the DSP; bank 0, bp_channel 27 means that the backplane stream 0 and backplane channel 1 are assignedto this DSP.
The following shows the calling number and the called number for this call.
May 16 12:22:27.580: csm_vtsp_call_setup_request: calling number: 10001, called number:30001The following shows that the CALL SETUP REQUEST from the VTSP has been translated into the 'CSM_EVENT_MODEM_OFFHOOK message and is passed to the CSM central state machine:
May 16 12:22:27.580: CSM_PROC_IDLE: CSM_EVENT_MODEM_OFFHOOK at slot 1, port 54The logical DSP channel number for the DSP (slot 1, port 54) is now displayed, which maps to the physicalDSP channel slot 1, dspm 5, dsp 4, dsp_channel 1.
The following shows that CSM has collected all the digits for dialing out:
May 16 12:22:27.580: CSM_PROC_OC3_COLLECT_ALL_DIGIT: CSM_EVENT_GET_ALL_DIGITS at slot 1,port 54For PRI and for applications that do not require digit collection of outdialing digits (for example, voice calls),the intermediate digit collection states are omitted and the CSM state machine moves to this state directly,pretending that the digit collection has been done.
The following shows an information message:
May 16 12:22:27.580: CSM_PROC_OC3_COLLECT_ALL_DIGIT: called party num: (30001) at slot 1,port 54The following shows that CSM attempts to find a free signalling D channel to direct the outgoing call:
May 16 12:22:27.580: csm_vtsp_check_dchan (voice_vdev=0x60B8562C)May 16 12:22:27.580: csm_vtsp_check_dchan (vtsp requested dchan=0x60D7ACB0,dchan_idb=0x60E8ACF0)May 16 12:22:27.580: csm_vtsp_check_dchan (voice_vdev=0x60B8562C)May 16 12:22:27.580: csm_vtsp_check_dchan (vtsp requested dchan=0x60D7ACB0,dchan_idb=0x60D7ACB0)
Cisco IOS Debug Command Reference - Commands A through D172
debug clns esis events through debug dbconn tcpdebug csm voice

In the case of voice calls, the free signaling D channel must match the voice interface specified inside thesignalling data block (vtsp_sdb) passed from the VTSP.
The following shows that CSM has received an event from ISDN:
May 16 12:22:27.624: EVENT_FROM_ISDN::dchan_idb=0x60D7ACB0, call_id=0xA121, ces=0x1bchan=0x1E, event=0x3, cause=0x0In this sample output:
• dchan_idb--indicates the address of the hardware IDB for the D channel
• call_id--Indicates the call id assigned by ISDN
• bchan--Indicates the number of the B channel assigned for this call
• cause--Indicates the ISDN event cause
The following shows that CSM has received a CALL PROCEEDING message from ISDN.
May 16 12:22:27.624: EVENT_FROM_ISDN:(A121): DEV_CALL_PROC at slot 1 and port 54The following shows that the CALL PROCEEDING event received from ISDN has been interpreted as aCSM_EVENT_ISDN_BCHAN_ASSIGNED message:
*May 16 12:22:27.624: CSM_PROC_OC4_DIALING: CSM_EVENT_ISDN_BCHAN_ASSIGNED at slot 1, port54ISDN has assigned a B channel for this outgoing call. This B channel must be on the same PRI span as thesignalling D channel allocated previously.
The following shows that the csm_vtsp_setup_for_oc function is called:
May 16 12:22:27.624: csm_vtsp_setup_for_oc (voice_vdev=0x60B8562C)This is invoked when an outgoing call initiated by the VTSP receives a response from the ISDN stack.
The following shows that ISDN has sent a CONNECT message to CSM indicating that the call leg to thePSTN side has been established:
May 16 12:22:28.084: EVENT_FROM_ISDN::dchan_idb=0x60D7ACB0, call_id=0xA121, ces=0x1bchan=0x1E, event=0x4, cause=0x0
May 16 12:22:28.084: EVENT_FROM_ISDN:(A121): DEV_CONNECTED at slot 1 and port 54The following shows that while CSM is in the OC5_WAIT_FOR_CARRIER state, it has received the'CONNECT'message from ISDN and has translated it into the CSM_EVENT_ISDN_CONNECTEDmessage,which is passed to the CSM central state machine:
May 16 12:22:28.084: CSM_PROC_OC5_WAIT_FOR_CARRIER: CSM_EVENT_ISDN_CONNECTED at slot 1,port 54The following shows that the function vtsp_confirm_oc() has been called:
May 16 12:22:28.084: vtsp_confirm_oc : (voice_vdev= 0x60B8562C)This is invoked after CSM received the CONNECT message from ISDN. CSM sends a confirmation of theCONNECT to the VTSP.
Cisco IOS Debug Command Reference - Commands A through D 173
debug clns esis events through debug dbconn tcpdebug csm voice

debug ctl-clientTo collect debug information about the CTL client, use the debugctl-client command in privileged EXECconfiguration mode. To disable collection of debug information, use the no form of this command.
debug ctl-client
no debug ctl-client
Syntax Description This command has no arguments or keywords.
Command Default Collection of CTL client debug information is disabled.
Command Modes Privileged EXEC
Command History ModificationCisco IOS Release
This command was introduced.12.4(4)XC
This command was integrated into Cisco IOS Release 12.4(9)T.12.4(9)T
Usage Guidelines This command is used with Cisco Unified CME phone authentication.
Examples The following example shows debug messages for the CTL client:
Router# debug ctl-client
001954: .Jul 21 18:23:02.136: ctl_client_create_ctlfile:001955: .Jul 21 18:23:02.272: create_ctl_record: Function 0 Trustpoint cisco1001956: .Jul 21 18:23:02.276: create_ctl_record: record added for function 0001957: .Jul 21 18:23:02.276: create_ctl_record: Function 0 Trustpoint sast2001958: .Jul 21 18:23:02.280: create_ctl_record: record added for function 0001959: .Jul 21 18:23:02.280: create_ctl_record: Function 1 Trustpoint cisco1001960: .Jul 21 18:23:02.284: create_ctl_record: record added for function 1001961: .Jul 21 18:23:02.284: create_ctl_record: Function 3 Trustpoint cisco1001962: .Jul 21 18:23:02.288: create_ctl_record: record added for function 3001963: .Jul 21 18:23:02.288: create_ctl_record: Function 4 Trustpoint cisco1001964: .Jul 21 18:23:02.292: create_ctl_record: record added for function 4001965: .Jul 21 18:23:02.424: ctl_client_create_ctlfile: Signature length 128001966: .Jul 21 18:23:02.640: CTL File Created Successfully
Cisco IOS Debug Command Reference - Commands A through D174
debug clns esis events through debug dbconn tcpdebug ctl-client

debug ctunnelTo display debugging messages for the IP over a Connectionless Network Service (CLNS) Tunnel feature,use the debugctunnel command in privileged EXEC mode. To disable debugging messages, use the no formof this command.
debug ctunnel
no debug ctunnel
Syntax Description This command has no arguments or keywords.
Command Default No default behavior or values.
Command Modes Privileged EXEC
Command History ModificationRelease
This command was introduced.12.1(5)
This command was integrated into Cisco IOS Release 12.2(33)SRA.12.2(33)SRA
Examples As packets are sent over the virtual interface, the following type of output will appear on the console whenthe debugctunnel command is used:
Router# debug ctunnel
4d21h: CTunnel1: IPCLNP encapsulated 49.0001.1111.1111.1111.00->49.0001.2222.2222.2222.00(linktype=7, len=89)
Cisco IOS Debug Command Reference - Commands A through D 175
debug clns esis events through debug dbconn tcpdebug ctunnel

debug custom-queueTo enable custom queueing output, use the debugcustom-queue command in privileged EXEC mode. Todisable debugging output, use the no form of this command.
debug custom-queue
no debug custom-queue
Syntax Description This command has no arguments or keywords.
Command Modes Privileged EXEC
Examples The following is an example of enabling custom queueing output:
Router# debug custom-queueCustom output queueing debugging is onThe following is sample output from the debug custom-queue command:
00:27:38: CQ: Serial0 output (Pk size/Q: 232/1) Q # was 1 now 100:27:38: CQ: Serial0 output (Pk size/Q: 232/1) Q # was 1 now 100:27:38: CQ: Serial0 output (Pk size/Q: 232/1) Q # was 1 now 100:27:38: CQ: Serial0 output (Pk size/Q: 232/1) Q # was 1 now 200:27:38: CQ: Serial0 output (Pk size/Q: 232/1) Q # was 2 now 100:27:38: CQ: Serial0 output (Pk size/Q: 232/1) Q # was 1 now 100:27:38: CQ: Serial0 output (Pk size/Q: 232/1) Q # was 1 now 100:27:38: CQ: Serial0 output (Pk size/Q: 232/1) Q # was 1 now 100:27:38: CQ: Serial0 output (Pk size/Q: 232/1) Q # was 1 now 100:27:38: CQ: Serial0 output (Pk size/Q: 232/1) Q # was 1 now 100:27:38: CQ: Serial0 output (Pk size/Q: 232/1) Q # was 1 now 200:27:38: CQ: Serial0 output (Pk size/Q: 232/1) Q # was 2 now 100:27:38: CQ: Serial0 output (Pk size/Q: 232/1) Q # was 1 now 100:27:38: CQ: Serial0 output (Pk size/Q: 232/1) Q # was 1 now 100:27:38: CQ: Serial0 output (Pk size/Q: 232/1) Q # was 1 now 100:27:38: CQ: Serial0 output (Pk size/Q: 232/1) Q # was 1 now 100:27:38: CQ: Serial0 output (Pk size/Q: 232/1) Q # was 1 now 200:27:38: CQ: Serial0 output (Pk size/Q: 232/1) Q # was 2 now 100:27:38: CQ: Serial0 output (Pk size/Q: 232/1) Q # was 1 now 100:27:38: CQ: Serial0 output (Pk size/Q: 232/1) Q # was 1 now 100:27:38: CQ: Serial0 output (Pk size/Q: 232/1) Q # was 1 now 1
Related Commands DescriptionCommand
Enables priority queueing output.debug priority
Cisco IOS Debug Command Reference - Commands A through D176
debug clns esis events through debug dbconn tcpdebug custom-queue
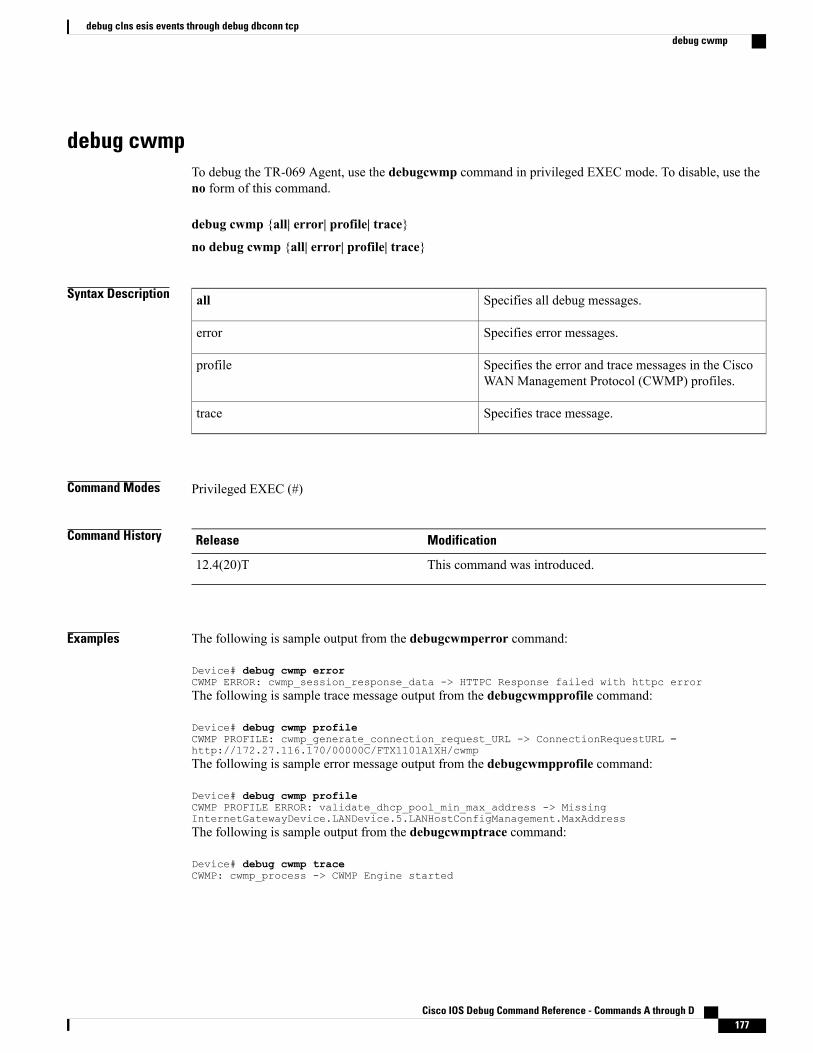
debug cwmpTo debug the TR-069 Agent, use the debugcwmp command in privileged EXEC mode. To disable, use theno form of this command.
debug cwmp {all| error| profile| trace}
no debug cwmp {all| error| profile| trace}
Syntax Description Specifies all debug messages.all
Specifies error messages.error
Specifies the error and trace messages in the CiscoWAN Management Protocol (CWMP) profiles.
profile
Specifies trace message.trace
Command Modes Privileged EXEC (#)
Command History ModificationRelease
This command was introduced.12.4(20)T
Examples The following is sample output from the debugcwmperror command:
Device# debug cwmp errorCWMP ERROR: cwmp_session_response_data -> HTTPC Response failed with httpc errorThe following is sample trace message output from the debugcwmpprofile command:
Device# debug cwmp profileCWMP PROFILE: cwmp_generate_connection_request_URL -> ConnectionRequestURL =http://172.27.116.170/00000C/FTX1101A1XH/cwmpThe following is sample error message output from the debugcwmpprofile command:
Device# debug cwmp profileCWMP PROFILE ERROR: validate_dhcp_pool_min_max_address -> MissingInternetGatewayDevice.LANDevice.5.LANHostConfigManagement.MaxAddressThe following is sample output from the debugcwmptrace command:
Device# debug cwmp traceCWMP: cwmp_process -> CWMP Engine started
Cisco IOS Debug Command Reference - Commands A through D 177
debug clns esis events through debug dbconn tcpdebug cwmp

debug cwsTo enable CloudWeb Security debugging, use the debug cws command in privileged EXECmode. To disableCloud Web Security debugging, use the no form of this command.
debug cws {access-list {access-list-number | extended-access-list-number | access-list-name}| control-plane|errors | events | function-trace | packet-path}
no debug cws {access-list {access-list-number | extended-access-list-number | access-list-name}| control-plane| errors | events | function-trace | packet-path}
Syntax Description Enables debugging of CloudWeb Security access control lists (ACLs).access-list
Access list number. The range is from 1 to 199.access-list-number
Extended access list number. The range is from 1300 to 2699.extended-access-list-number
Access list name.access-list-number
Enables debugging of Cloud Web Security control plane messages.control-plane
Enables debugging of Cloud Web Security errors.errors
Enables debugging of Cloud Web Security events.events
Enables debugging of Cloud Web Security function trace.function-trace
Enables debugging of Cloud Web Security packet path.packet-path
Command Modes Privileged EXEC (#)
Command History ModificationRelease
This command was introduced. This command replaces the debugcontent-scan command.
15.4(2)T
Usage Guidelines The content scanning process redirects client web traffic to the Cloud Web Security server.
You must configure ACLs by using the ip access-list extended command before you enable the debuggingof CloudWeb Security ACLs. The debug cws access-list command enables conditional debugging for CloudWeb Security. The conditional debugging does not work for existing sessions when you enable content scan;the ACL match occurs after the first packet is received.
Cisco IOS Debug Command Reference - Commands A through D178
debug clns esis events through debug dbconn tcpdebug cws
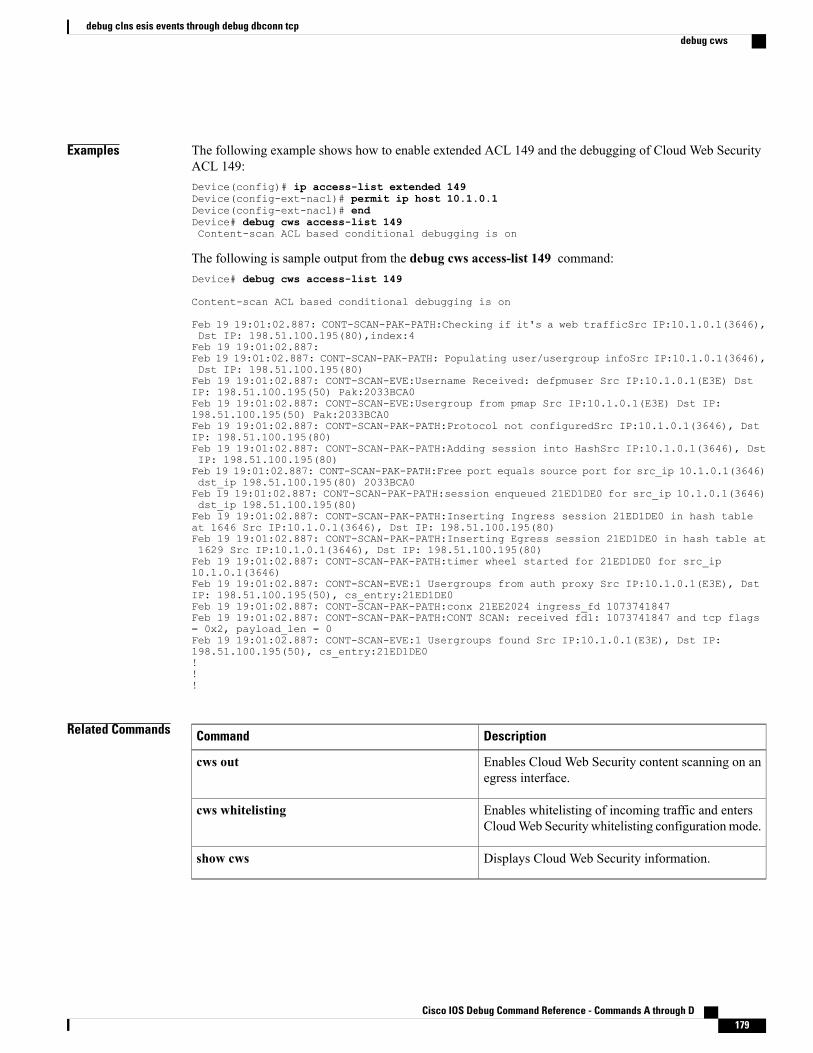
Examples The following example shows how to enable extended ACL 149 and the debugging of Cloud Web SecurityACL 149:Device(config)# ip access-list extended 149Device(config-ext-nacl)# permit ip host 10.1.0.1Device(config-ext-nacl)# endDevice# debug cws access-list 149Content-scan ACL based conditional debugging is on
The following is sample output from the debug cws access-list 149 command:Device# debug cws access-list 149
Content-scan ACL based conditional debugging is on
Feb 19 19:01:02.887: CONT-SCAN-PAK-PATH:Checking if it's a web trafficSrc IP:10.1.0.1(3646),Dst IP: 198.51.100.195(80),index:4Feb 19 19:01:02.887:Feb 19 19:01:02.887: CONT-SCAN-PAK-PATH: Populating user/usergroup infoSrc IP:10.1.0.1(3646),Dst IP: 198.51.100.195(80)Feb 19 19:01:02.887: CONT-SCAN-EVE:Username Received: defpmuser Src IP:10.1.0.1(E3E) DstIP: 198.51.100.195(50) Pak:2033BCA0Feb 19 19:01:02.887: CONT-SCAN-EVE:Usergroup from pmap Src IP:10.1.0.1(E3E) Dst IP:198.51.100.195(50) Pak:2033BCA0Feb 19 19:01:02.887: CONT-SCAN-PAK-PATH:Protocol not configuredSrc IP:10.1.0.1(3646), DstIP: 198.51.100.195(80)Feb 19 19:01:02.887: CONT-SCAN-PAK-PATH:Adding session into HashSrc IP:10.1.0.1(3646), DstIP: 198.51.100.195(80)Feb 19 19:01:02.887: CONT-SCAN-PAK-PATH:Free port equals source port for src_ip 10.1.0.1(3646)dst_ip 198.51.100.195(80) 2033BCA0Feb 19 19:01:02.887: CONT-SCAN-PAK-PATH:session enqueued 21ED1DE0 for src_ip 10.1.0.1(3646)dst_ip 198.51.100.195(80)Feb 19 19:01:02.887: CONT-SCAN-PAK-PATH:Inserting Ingress session 21ED1DE0 in hash tableat 1646 Src IP:10.1.0.1(3646), Dst IP: 198.51.100.195(80)Feb 19 19:01:02.887: CONT-SCAN-PAK-PATH:Inserting Egress session 21ED1DE0 in hash table at1629 Src IP:10.1.0.1(3646), Dst IP: 198.51.100.195(80)Feb 19 19:01:02.887: CONT-SCAN-PAK-PATH:timer wheel started for 21ED1DE0 for src_ip10.1.0.1(3646)Feb 19 19:01:02.887: CONT-SCAN-EVE:1 Usergroups from auth proxy Src IP:10.1.0.1(E3E), DstIP: 198.51.100.195(50), cs_entry:21ED1DE0Feb 19 19:01:02.887: CONT-SCAN-PAK-PATH:conx 21EE2024 ingress_fd 1073741847Feb 19 19:01:02.887: CONT-SCAN-PAK-PATH:CONT SCAN: received fd1: 1073741847 and tcp flags= 0x2, payload_len = 0Feb 19 19:01:02.887: CONT-SCAN-EVE:1 Usergroups found Src IP:10.1.0.1(E3E), Dst IP:198.51.100.195(50), cs_entry:21ED1DE0!!!
Related Commands DescriptionCommand
Enables Cloud Web Security content scanning on anegress interface.
cws out
Enables whitelisting of incoming traffic and entersCloudWeb Security whitelisting configurationmode.
cws whitelisting
Displays Cloud Web Security information.show cws
Cisco IOS Debug Command Reference - Commands A through D 179
debug clns esis events through debug dbconn tcpdebug cws
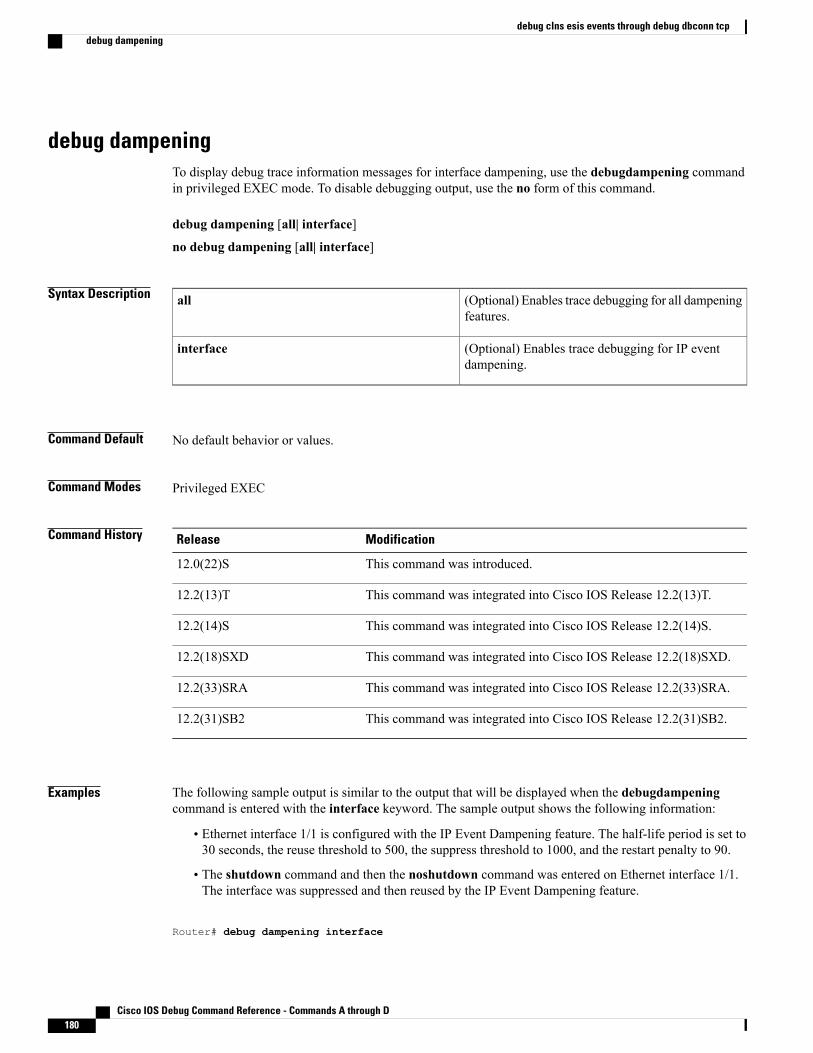
debug dampeningTo display debug trace information messages for interface dampening, use the debugdampening commandin privileged EXEC mode. To disable debugging output, use the no form of this command.
debug dampening [all| interface]
no debug dampening [all| interface]
Syntax Description (Optional) Enables trace debugging for all dampeningfeatures.
all
(Optional) Enables trace debugging for IP eventdampening.
interface
Command Default No default behavior or values.
Command Modes Privileged EXEC
Command History ModificationRelease
This command was introduced.12.0(22)S
This command was integrated into Cisco IOS Release 12.2(13)T.12.2(13)T
This command was integrated into Cisco IOS Release 12.2(14)S.12.2(14)S
This command was integrated into Cisco IOS Release 12.2(18)SXD.12.2(18)SXD
This command was integrated into Cisco IOS Release 12.2(33)SRA.12.2(33)SRA
This command was integrated into Cisco IOS Release 12.2(31)SB2.12.2(31)SB2
Examples The following sample output is similar to the output that will be displayed when the debugdampeningcommand is entered with the interface keyword. The sample output shows the following information:
• Ethernet interface 1/1 is configured with the IP Event Dampening feature. The half-life period is set to30 seconds, the reuse threshold to 500, the suppress threshold to 1000, and the restart penalty to 90.
• The shutdown command and then the noshutdown command was entered on Ethernet interface 1/1.The interface was suppressed and then reused by the IP Event Dampening feature.
Router# debug dampening interface
Cisco IOS Debug Command Reference - Commands A through D180
debug clns esis events through debug dbconn tcpdebug dampening

00:07:17:IF-EvD(Ethernet1/1):CLNS Routing reports state transition from UP to DOWN00:07:17:EvD(Ethernet1/1):charge penalty 1000, new accum. penalty 1000, flap count 100:07:17:EvD(Ethernet1/1):accum. penalty 1000, now suppressed with a reuse intervals of 3000:07:17:IF-EvD(Ethernet1/1):update CLNS Routing state to DOWN, interface is suppressed00:07:17:IF-EvD(Ethernet1/1):IP Routing reports state transition from DOWN to DOWN00:07:17:IF-EvD(Ethernet1/1):update IP Routing state to DOWN, interface is suppressed00:07:17:IF-EvD(Ethernet1/1):CLNS Routing reports state transition from DOWN to UP00:07:17:IF-EvD(Ethernet1/1):CLNS Routing reports state transition from UP to DOWN00:07:17:EvD(Ethernet1/1):accum. penalty decayed to 1000 after 0 second(s)00:07:17:EvD(Ethernet1/1):charge penalty 1000, new accum. penalty 2000, flap count 200:07:17:EvD(Ethernet1/1):accum. penalty 2000, now suppressed with a reuse intervals of 6000:07:17:IF-EvD(Ethernet1/1):CLNS Routing reports state transition from DOWN to UP00:07:17:IF-EvD(Ethernet1/1):CLNS Routing reports state transition from UP to DOWN00:07:17:EvD(Ethernet1/1):accum. penalty decayed to 2000 after 0 second(s)00:07:17:EvD(Ethernet1/1):charge penalty 1000, new accum. penalty 3000, flap count 300:07:17:EvD(Ethernet1/1):accum. penalty 3000, now suppressed with a reuse intervals of 7800:07:17:IF-EvD(Ethernet1/1):CLNS Routing reports state transition from DOWN to UP00:07:17:IF-EvD(Ethernet1/1):IP Routing reports state transition from UP to UP00:07:17:IF-EvD(Ethernet1/1):IP Routing reports state transition from UP to UP00:07:17:IF-EvD(Ethernet1/1):IP Routing reports state transition from UP to UP00:07:17:IF-EvD(Ethernet1/1):IP Routing reports state transition from UP to UP00:07:17:IF-EvD(Ethernet1/1):IP Routing reports state transition from UP to UP00:07:20:IF-EvD(Ethernet1/1):CLNS Routing reports state transition from UP to UP00:07:20:IF-EvD(Ethernet1/1):IP Routing reports state transition from UP to UP00:07:47:IF-EvD:unsuppress interfaces00:08:36:IF-EvD:unsuppress interfaces00:08:36:EvD(Ethernet1/1):accum. penalty decayed to 483 after 79 second(s)00:08:36:EvD(Ethernet1/1):accum. penalty 483, now unsuppressed00:08:36:IF-EvD(Ethernet1/1):update IP Routing state to UP, interface is not suppressed00:08:36:IF-EvD(Ethernet1/1):update CLNS Routing state to UP, interface is not suppressed00:08:36:IF-EvD(Ethernet1/1):CLNS Routing reports state transition from UP to UPThe table below describes the significant fields shown in the display.
Table 16: debug dampening Field Descriptions
DescriptionField
Displays the status of the specified interface from theperspective of the specified protocol. Interface statechanges are displayed. The interface is specifiedwithin parentheses. The protocol is specified at thebeginning of the message.
... Routing reports state transition fromUP to DOWN
Displays the penalty assigned to the flapping interfaceand amount of penalty that is added to theaccumulated penalty. The interface flap count is alsodisplayed.
charge penalty 1000, new accum. penalty 1000, flapcount 1
Displays the status of the interface, accumulatedpenalty, and configured reuse threshold.
accum. penalty 1000, now suppressed with a reuseintervals of 30
Displays the status of the specified interface. Interfacestate changes and suppression status are displayed.
update CLNS Routing state to DOWN, interface issuppressed
Displays the decay rate of the accumulated penalty.accum. penalty decayed to 1000 after 0 second(s)
Indicates that dampened interfaces have beenunsuppressed.
unsuppress interfaces
Cisco IOS Debug Command Reference - Commands A through D 181
debug clns esis events through debug dbconn tcpdebug dampening

debug data-storeTo display persistant storage device (PSD)-related debugging messages for the gateway GPRS support node(GGSN), use the debugdata-storecommand in privileged EXECmode. To disable debugging output, use theno form of this command.
debug data-store
no debug data-store
Syntax Description This command has no arguments or keywords.
Command Default No default behavior or values
Command Modes Privileged EXEC
Command History ModificationRelease
This command was introduced.12.3(14)YU
This command was integrated into Cisco IOS Release 12.4(2)XB.12.4(2)XB
This command was integrated into Cisco IOS Release 12.4(15)T.12.4(15)T
Usage Guidelines This command displays PSD-related debugging messages for the GGSN.
Because debugging output is assigned high priority in the CPU process, it can render the system unusable.For this reason, use debug commands only to troubleshoot specific problems or during troubleshootingsessions with Cisco technical support staff. Moreover, it is best to use debug commands during periodsof lower network flows and fewer users. Debugging during these periods reduces the effect these commandshave on other users on the system.
Caution
Examples The following example configures a debugging session to check PSD-related parameters:
Router# debug data-store
Cisco IOS Debug Command Reference - Commands A through D182
debug clns esis events through debug dbconn tcpdebug data-store

debug data-store detailTo display extended details for persistent storage device (PSD)-related debugging information, use thedebugdata-storedetailcommand in privileged EXEC mode. To disable debugging output, use the no formof this command.
debug data-store detail
no debug data-store detail
Syntax Description This command has no arguments or keywords.
Command Default No default behavior or values
Command Modes Privileged EXEC
Command History ModificationRelease
This command was introduced.12.3(14)YU
This command was integrated into Cisco IOS Release 12.4(2)XB.12.4(2)XB
This command was integrated into Cisco IOS Release 12.4(15)T.12.4(15)T
Usage Guidelines This command displays PSD-related debugging messages for the GGSN.
Because debugging output is assigned high priority in the CPU process, it can render the system unusable.For this reason, use debug commands only to troubleshoot specific problems or during troubleshootingsessions with Cisco technical support staff. Moreover, it is best to use debug commands during periodsof lower network flows and fewer users. Debugging during these periods reduces the effect these commandshave on other users on the system.
Caution
Examples The following example configures a detailed PSD-related debugging session:
Router# debug data-store details
Cisco IOS Debug Command Reference - Commands A through D 183
debug clns esis events through debug dbconn tcpdebug data-store detail

Related Commands DescriptionCommand
Configures the GGSN to automatically initiate aretrieval of G-CDRs from PSDs defined in a PSDserver group.
auto-retrieve
Clears PSD-related statistics.clear data-store statistics
Displays the status of the PSD client and PSDserver-related information.
show data-store
Displays statistics related to the PSD client.show data-store statistics
Cisco IOS Debug Command Reference - Commands A through D184
debug clns esis events through debug dbconn tcpdebug data-store detail

debug dbconn allTo turn on all debug flags for Database Connection, use the debugdbconnallcommand in privileged EXECmode. To disable debugging output, use the no form of this command.
debug dbconn all
no debug dbconn all
Syntax Description This command has no arguments or keywords.
Command Default Debugging is not enabled for Database Connection.
Command Modes Privileged EXEC
Usage Guidelines The debugdbconnall command displays debug output for Advanced Program-to-Program Communication(APPC), Database Connection configuration, Distributed Relational Database Architecture (DRDA), errormessages, event traces, and TCP. The Database Connection debug flags are appc, config, drda, event, andtcp.
Examples See the sample output provided for the debug dbconn appc , debug dbconn config , debug dbconn drda, debug dbconn event , and debug dbconn tcp commands.
Related Commands DescriptionCommand
Displays APPC-related trace or error messages.debug dbconn appc
Displays trace or error messages for DatabaseConnection configuration and control blocks.
debug dbconn config
Displays error messages and stream traces for DRDA.debug dbconn drda
Displays trace or error messages for CTRC eventsrelated to DB2 communications.
debug dbconn event
Displays error messages and traces for TCP.debug dbconn tcp
Cisco IOS Debug Command Reference - Commands A through D 185
debug clns esis events through debug dbconn tcpdebug dbconn all
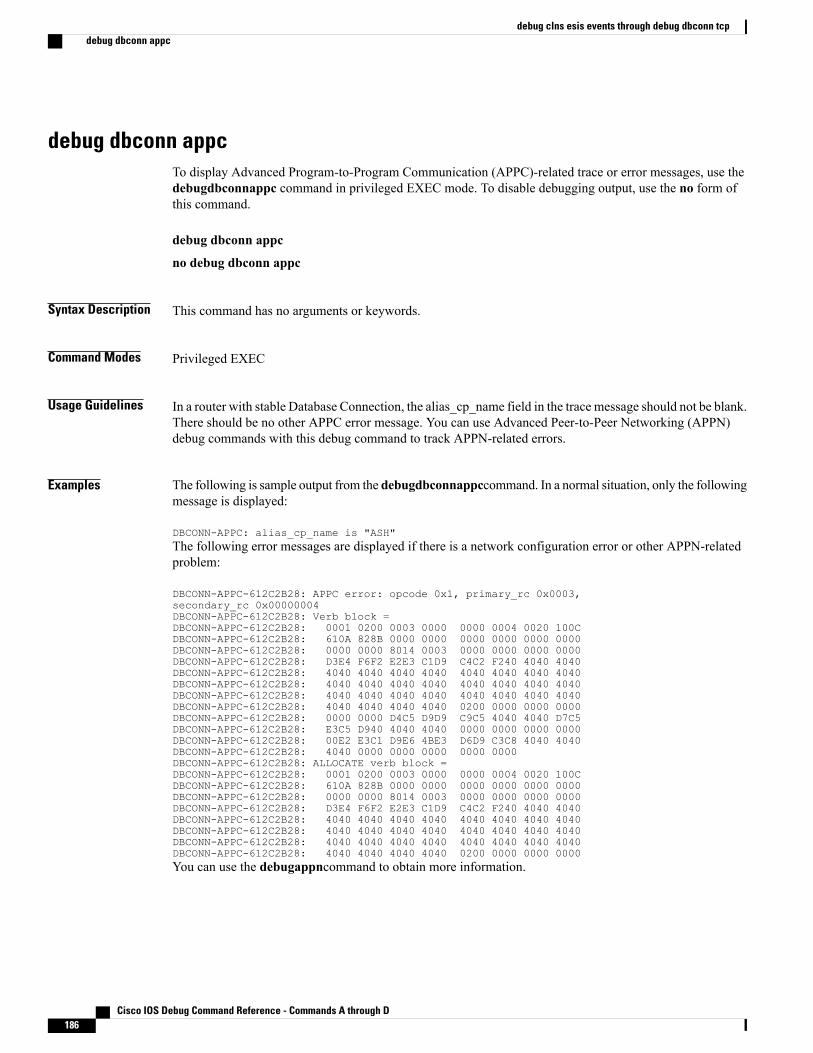
debug dbconn appcTo display Advanced Program-to-Program Communication (APPC)-related trace or error messages, use thedebugdbconnappc command in privileged EXEC mode. To disable debugging output, use the no form ofthis command.
debug dbconn appc
no debug dbconn appc
Syntax Description This command has no arguments or keywords.
Command Modes Privileged EXEC
Usage Guidelines In a router with stable Database Connection, the alias_cp_name field in the trace message should not be blank.There should be no other APPC error message. You can use Advanced Peer-to-Peer Networking (APPN)debug commands with this debug command to track APPN-related errors.
Examples The following is sample output from the debugdbconnappccommand. In a normal situation, only the followingmessage is displayed:
DBCONN-APPC: alias_cp_name is "ASH"The following error messages are displayed if there is a network configuration error or other APPN-relatedproblem:
DBCONN-APPC-612C2B28: APPC error: opcode 0x1, primary_rc 0x0003,secondary_rc 0x00000004DBCONN-APPC-612C2B28: Verb block =DBCONN-APPC-612C2B28: 0001 0200 0003 0000 0000 0004 0020 100CDBCONN-APPC-612C2B28: 610A 828B 0000 0000 0000 0000 0000 0000DBCONN-APPC-612C2B28: 0000 0000 8014 0003 0000 0000 0000 0000DBCONN-APPC-612C2B28: D3E4 F6F2 E2E3 C1D9 C4C2 F240 4040 4040DBCONN-APPC-612C2B28: 4040 4040 4040 4040 4040 4040 4040 4040DBCONN-APPC-612C2B28: 4040 4040 4040 4040 4040 4040 4040 4040DBCONN-APPC-612C2B28: 4040 4040 4040 4040 4040 4040 4040 4040DBCONN-APPC-612C2B28: 4040 4040 4040 4040 0200 0000 0000 0000DBCONN-APPC-612C2B28: 0000 0000 D4C5 D9D9 C9C5 4040 4040 D7C5DBCONN-APPC-612C2B28: E3C5 D940 4040 4040 0000 0000 0000 0000DBCONN-APPC-612C2B28: 00E2 E3C1 D9E6 4BE3 D6D9 C3C8 4040 4040DBCONN-APPC-612C2B28: 4040 0000 0000 0000 0000 0000DBCONN-APPC-612C2B28: ALLOCATE verb block =DBCONN-APPC-612C2B28: 0001 0200 0003 0000 0000 0004 0020 100CDBCONN-APPC-612C2B28: 610A 828B 0000 0000 0000 0000 0000 0000DBCONN-APPC-612C2B28: 0000 0000 8014 0003 0000 0000 0000 0000DBCONN-APPC-612C2B28: D3E4 F6F2 E2E3 C1D9 C4C2 F240 4040 4040DBCONN-APPC-612C2B28: 4040 4040 4040 4040 4040 4040 4040 4040DBCONN-APPC-612C2B28: 4040 4040 4040 4040 4040 4040 4040 4040DBCONN-APPC-612C2B28: 4040 4040 4040 4040 4040 4040 4040 4040DBCONN-APPC-612C2B28: 4040 4040 4040 4040 0200 0000 0000 0000You can use the debugappncommand to obtain more information.
Cisco IOS Debug Command Reference - Commands A through D186
debug clns esis events through debug dbconn tcpdebug dbconn appc

The following message is displayed if a database connection is manually cleared and an outstanding APPCverb is pending:
DBCONN-APPC-%612C2B28: Canceling pending APPC verb 0x1
Related Commands DescriptionCommand
Turns on all debug flags for Database Connection.debug dbconn all
Displays trace or error messages for DatabaseConnection configuration and control blocks.
debug dbconn config
Displays error messages and stream traces for DRDA.debug dbconn drda
Displays trace or error messages for DatabaseConnection events.
debug dbconn event
Displays error messages and traces for TCP.debug dbconn tcp
Cisco IOS Debug Command Reference - Commands A through D 187
debug clns esis events through debug dbconn tcpdebug dbconn appc

debug dbconn configTo display trace or error messages for Database Connection configuration and control blocks, use thedebugdbconnconfigcommand in privileged EXEC mode. To disable debugging output, use the no form ofthis command.
debug dbconn config
no debug dbconn config
Syntax Description This command has no arguments or keywords.
Command Modes Privileged EXEC
Usage Guidelines Most of the messages for Database Connection and control blocks do not report any errors. If a connectionis inactive and cannot be cleared, use this command with the debugdbconnappc,debugdbconntcp,anddebugappn commands to locate the problem. The alias_cp_name field must match the configured APPNcpname.
Examples The following is sample output from the debugdbconnconfigcommand:
Router# debug dbconn configDBCONN-CONFIG: alias_cp_name is "ASH "DBCONN-CONFIG: connection 612BDAAC matching server on 198.147.235.5:0 withrdbname=STELLADBCONN-CONFIG: APPN shutdown; clearing connection 1234abcdDBCONN-CONFIG: created server 612C2720DBCONN-CONFIG: server 612C2720 (listen 60F72E94) is activeDBCONN-CONFIG: server 612C2720 (listen 60F72E94) is activeDBCONN-CONFIG: new connection 612BDAACDBCONN-CONFIG: listen 60F72E94 accepts connection 612BDAACDBCONN-CONFIG: server 60F74614 takes connection 612BDAACDBCONN-CONFIG: listen 60F72E94 releases connection 612BDAACDBCONN-CONFIG: server 60F74614 releases connection 612BDAACDBCONN-CONFIG: deleting connection 612BDAACDBCONN-CONFIG: listen 60F72E94 abandons connection 612BDAACDBCONN-CONFIG: server 612C2720 abandons connection 612BDAACDBCONN-CONFIG: deleting server 612C2720DBCONN-CONFIG: daemon 60381738 takes zombie connection 612BDAACDBCONN-CONFIG: daemon 60381738 releases zombie connection 612BDAAC
Related Commands DescriptionCommand
Turns on all debug flags for Database Connection.debug dbconn all
Displays APPC-related trace or error messages.debug dbconn appc
Displays error messages and stream traces for DRDA.debug dbconn drda
Cisco IOS Debug Command Reference - Commands A through D188
debug clns esis events through debug dbconn tcpdebug dbconn config

DescriptionCommand
Displays trace or error messages for DatabaseConnection events.
debug dbconn event
Displays error messages and traces for TCP.debug dbconn tcp
Cisco IOS Debug Command Reference - Commands A through D 189
debug clns esis events through debug dbconn tcpdebug dbconn config
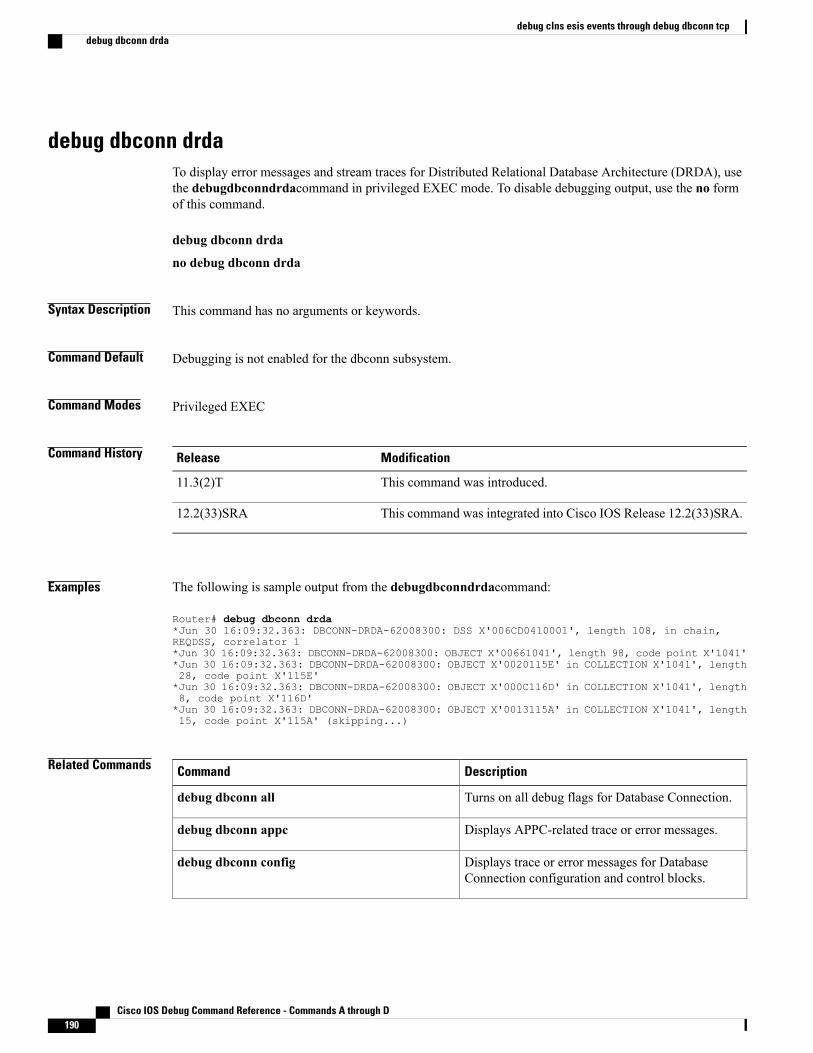
debug dbconn drdaTo display error messages and stream traces for Distributed Relational Database Architecture (DRDA), usethe debugdbconndrdacommand in privileged EXEC mode. To disable debugging output, use the no formof this command.
debug dbconn drda
no debug dbconn drda
Syntax Description This command has no arguments or keywords.
Command Default Debugging is not enabled for the dbconn subsystem.
Command Modes Privileged EXEC
Command History ModificationRelease
This command was introduced.11.3(2)T
This command was integrated into Cisco IOS Release 12.2(33)SRA.12.2(33)SRA
Examples The following is sample output from the debugdbconndrdacommand:
Router# debug dbconn drda*Jun 30 16:09:32.363: DBCONN-DRDA-62008300: DSS X'006CD0410001', length 108, in chain,REQDSS, correlator 1*Jun 30 16:09:32.363: DBCONN-DRDA-62008300: OBJECT X'00661041', length 98, code point X'1041'*Jun 30 16:09:32.363: DBCONN-DRDA-62008300: OBJECT X'0020115E' in COLLECTION X'1041', length28, code point X'115E'*Jun 30 16:09:32.363: DBCONN-DRDA-62008300: OBJECT X'000C116D' in COLLECTION X'1041', length8, code point X'116D'*Jun 30 16:09:32.363: DBCONN-DRDA-62008300: OBJECT X'0013115A' in COLLECTION X'1041', length15, code point X'115A' (skipping...)
Related Commands DescriptionCommand
Turns on all debug flags for Database Connection.debug dbconn all
Displays APPC-related trace or error messages.debug dbconn appc
Displays trace or error messages for DatabaseConnection configuration and control blocks.
debug dbconn config
Cisco IOS Debug Command Reference - Commands A through D190
debug clns esis events through debug dbconn tcpdebug dbconn drda

DescriptionCommand
Displays trace or error messages for CTRC eventsrelated to DB2 communications.
debug dbconn event
Displays error messages and traces for TCP.debug dbconn tcp
Cisco IOS Debug Command Reference - Commands A through D 191
debug clns esis events through debug dbconn tcpdebug dbconn drda

debug dbconn eventTo display trace or error messages for Cisco Transaction Connection (CTRC) events related to DATABASE2(DB2) communications, use the debugdbconneventcommand in privileged EXECmode. To disable debuggingoutput, use the no form of this command.
debug dbconn event
no debug dbconn event
Syntax Description This command has no arguments or keywords.
Command Default Debugging is not enabled for the dbconn subsystem.
Command Modes Privileged EXEC
Command History ModificationRelease
This command was introduced.11.3(2)T
This command was integrated into Cisco IOS Release 12.2(33)SRA.12.2(33)SRA
Examples The following examples display output from the debugdbconneventcommand in a variety of situations. Anormal trace for the debugdbconnevent displays as follows:
Router# debug dbconn eventDBCONN-EVENT: Dispatch to 60FD6C00, from 0, msg 60F754CC, msgid 6468 'dh',buffer 0.DBCONN-EVENT: [*] Post to 61134240(cn), from 60EC5470(tc), msg 611419E4,msgid 0x6372 'cr', buffer 612BF68C.DBCONN-EVENT: Flush events called for pto 61182742, pfrom 61239837.DBCONN-EVENT: Event discarded: to 61182742 (cn), from 61239837(ap), msg61339273, msgid 0x6372 'cr' buffer 0.DBCONN-EVENT: == Send to 1234abcd, from 22938acd, msg 72618394, msgid0x6372 'cr', buffer 0.If the following messages are displayed, contact Cisco technical support personnel:
DBCONN-TCPFSM-1234abcd: Cannot occur in state 2 on input 6363 ('cc')DBCONN-APPCFSM-1234abcd: Cannot occur in state 3 on input 6363 ('cc')
Related Commands DescriptionCommand
Turns on all debug flags for Database Connection.debug dbconn all
Displays APPC-related trace or error messages.debug dbconn appc
Cisco IOS Debug Command Reference - Commands A through D192
debug clns esis events through debug dbconn tcpdebug dbconn event

DescriptionCommand
Display trace or error messages for DatabaseConnection configuration and control blocks.
debug dbconn config
Displays error messages and stream traces for DRDA.debug dbconn drda
Displays error messages and traces for TCP.debug dbconn tcp
Displays the state of each debugging option.show debugging
Cisco IOS Debug Command Reference - Commands A through D 193
debug clns esis events through debug dbconn tcpdebug dbconn event

debug dbconn tcpTo display error messages and traces for TCP, use the debugdbconntcpcommand in privileged EXEC mode.To disable debugging output, use the no form of this command.
debug dbconn tcp
no debug dbconn tcp
Syntax Description This command has no arguments or keywords.
Command Default Debugging is not enabled for the dbconn subsystem.
Command Modes Privileged EXEC
Command History ModificationRelease
This command was introduced.11.3(2)T
This command was integrated into Cisco IOS Release 12.2(33)SRA.12.2(33)SRA
Examples The following is sample output from the debugdbconntcpcommand:
Router# debug dbconn tcpDBCONN-TCP-63528473: tcpdriver_passive_open returned NULLDBCONN-TCP-63528473: (no memory) tcp_reset(63829482) returns 4DBCONN-TCP: tcp_accept(74625348,&error) returns tcb 63829482, error 4DBCONN-TCP: (no memory) tcp_reset(63829482) returns 4DBCONN-TCP-63528473: (open) tcp_create returns 63829482, error = 4DBCONN-TCP-63528473: tcb_connect(63829482,1.2.3.4,2010) returns 4DBCONN-TCP-63528473: (open error) tcp_reset(63829482) returns 4DBCONN-TCP-63528473: tcp_create returns 63829482, error = 4DBCONN-TCP-63528473: tcb_bind(63829482,0.0.0.0,2001) returns 4DBCONN-TCP-63528473: tcp_listen(63829482,,) returns 4DBCONN-TCP-63528473: (errors) Calling tcp_close (63829482)
Related Commands DescriptionCommand
Turns on all debug flags for Database Connection.debug dbconn all
Displays APPC-related trace or error messages.debug dbconn appc
Displays trace or error messages for DatabaseConnection configuration and control blocks.
debug dbconn config
Displays error messages and stream traces for DRDA.debug dbconn drda
Cisco IOS Debug Command Reference - Commands A through D194
debug clns esis events through debug dbconn tcpdebug dbconn tcp

DescriptionCommand
Displays trace or error messages for CTRC eventsrelated to DB2 communications.
debug dbconn event
Displays the state of each debugging option.show debugging
Cisco IOS Debug Command Reference - Commands A through D 195
debug clns esis events through debug dbconn tcpdebug dbconn tcp

Cisco IOS Debug Command Reference - Commands A through D196
debug clns esis events through debug dbconn tcpdebug dbconn tcp