Embed Size (px)
Citation preview

Embedded Systems for Mechatronics 1, MF2042
Tutorial – Debugging in AVR32 Studio
version 2011‐10‐04
DebugginginAVR32Studio
Debugging is a very powerful tool if you want to have a deeper look into your program. You can look
at both variables and register values and check they are correct. In AVR32 Studio this can be done in
this way.
Step1In AVR32 studio, click on Debug. The perspective is changed into Debug mode. You can also change
the perspective view between “Debug” and “AVR32 C/C++” up in the right upper corner of the
screen.
Step2Now we will change into the Debugging perspective. The program automatically stops at main. Now
you can add breakpoints in your code by simply clicking on the left side. Here is the Example ADC
used and a breakpoint has been set at “adc_value_pot”.
Embedded Systems for Mechatronics 1, MF2042
Tutorial – Debugging in AVR32 Studio
version 2011‐10‐04
Step3Now you can choose to resume your program or stepping through it. This can be done by clicking on
“Resume” or “Step Into” or “Step Over”. If you chose “Resume” the program will run and just halt at
your breakpoints. If you chose “Step Into” and “Step Over” you can follow and see how the whole
program is working.
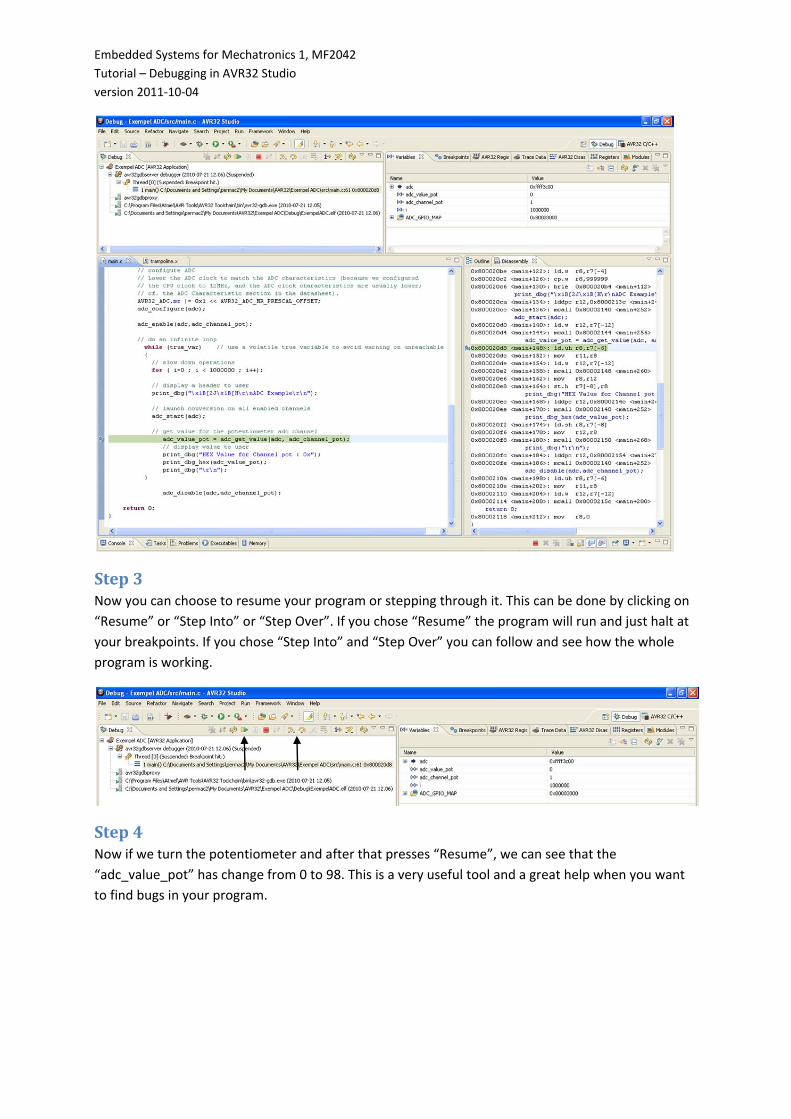
Step4Now if we turn the potentiometer and after that presses “Resume”, we can see that the
“adc_value_pot” has change from 0 to 98. This is a very useful tool and a great help when you want
to find bugs in your program.

Embedded Systems for Mechatronics 1, MF2042
Tutorial – Debugging in AVR32 Studio
version 2011‐10‐04

Embedded Systems for Mechatronics 1, MF2042
Tutorial – Debugging in AVR32 Studio
version 2011‐10‐04
TracingdataSometimes it can be very useful to trace data in your program. Here we are showing one example
where USART data to the HyperTerminal are being traced. The tutorial is originally designed for the
AVR ONE! Debugger and the EVK1101 board, but most of the steps are the same in this case. Some
text will be marked with blue and if you click on it you will see the changes made. Some text will be
marked with red and that is text that has been deleted. The tutorial will start on the next page.

AVR ONE! Quick-start Guide 6-1
32104B–AVR ONE!–02/10
Section 5
Create demo application
5.1 Start AVR32 Studio
Start AVR32 Studio. Start-up may take a while (because of all the Java libraries being loaded).
Figure 5-1. AVR32 Studio splash screen
Figure 5-2. AVR32 Studio workspace selection
Select a suitable workspace folder for your project files. If you want to use the same folder for your work-
space every time you start AVR32 Studio, you should tick the box before clicking OK.

Create demo application
AVR ONE! Quick-start Guide 6-2
32104B–AVR ONE!–02/10
Figure 5-3. AVR32 Studio Welcome view
Exit from the welcome screen to the workbench by clicking on the Close Page icon (Arrow).
5.2 Configure adapter and target
Before you can use the AVR ONE! and the EVK1101, you have to tell AVR32 Studio what type of equip-
ment is connected to your PC.
“Target” refers to the MCU on the EVK1101 evaluation board, and “Adapter” refers to the tool connecting
the target to the PC (in this case, the AVR ONE!).

Create demo application
AVR ONE! Quick-start Guide 6-3
32104B–AVR ONE!–02/10
5.2.1 Add and configure the adapter (AVR ONE!)
Figure 5-4. Scan Targets
Right-click in the AVR32 Target-view and select Scan Targets.
Figure 5-5. Available targets
Select the AVR ONE!
Figure 5-6. Selecting the properties view
Click on the Properties tab.
You are now looking at the Target properties. If you have several adapters connected at the same time,
this is the place where you can give them unique names. Just type the name you want to use in the
Name field.

Create demo application
AVR ONE! Quick-start Guide 6-4
32104B–AVR ONE!–02/10
5.2.2 Configure target board and MCU
Figure 5-7. Details configuration tab
Set Device to UC3B0256 or UC3B0256ES, depending on what MCU is installed on your EVK1101.
Figure 5-8. MCU Markings
To check which type of MCU is mounted on your EVK1101 evaluation board, you can read the part num-
ber printed on the MCU. The picture shows the part number printed on an -ES part (-UES suffix).
Set Board to EVK1101.
Set MCU Clock source to Crystal and adjust the JTAG Clock to a suitable value (Usually 33MHz or
less. Max speed depends on target board signal quality). Click Apply.
The target and adapter configuration process is now complete.

Create demo application
AVR ONE! Quick-start Guide 6-5
32104B–AVR ONE!–02/10
5.2.3 Target MCU Chip erase
If the EVK1101 evaluation board is brand new, or if it still contains the original demo application (Control
Panel Demo), the FLASH lock-bits need to be cleared. Right-click on the AVR ONE! In the AVR32 Tar-
get view and select Chip Erase.
WARNING! This process will erase the original demo application programmed at the factory. After this
operation the EVK1101 evaluation board will be completely empty. If you need to keep the original appli-
cation, you should not perform this operation.
If you would like to use your EVK1101 for this example, it is not difficult to restore the original “Control
Panel Demo application”. All you have to do is to build the “Control Panel Demo example” enclosed with
AVR32 Studio.
You should now perform the Chip Erase operation.
Figure 5-9. Chip erase operation
Right click on the target (AVR ONE!), and select Chip Erase.
Create demo application
AVR ONE! Quick-start Guide 6-6
32104B–AVR ONE!–02/10
5.3 Create a demonstration project
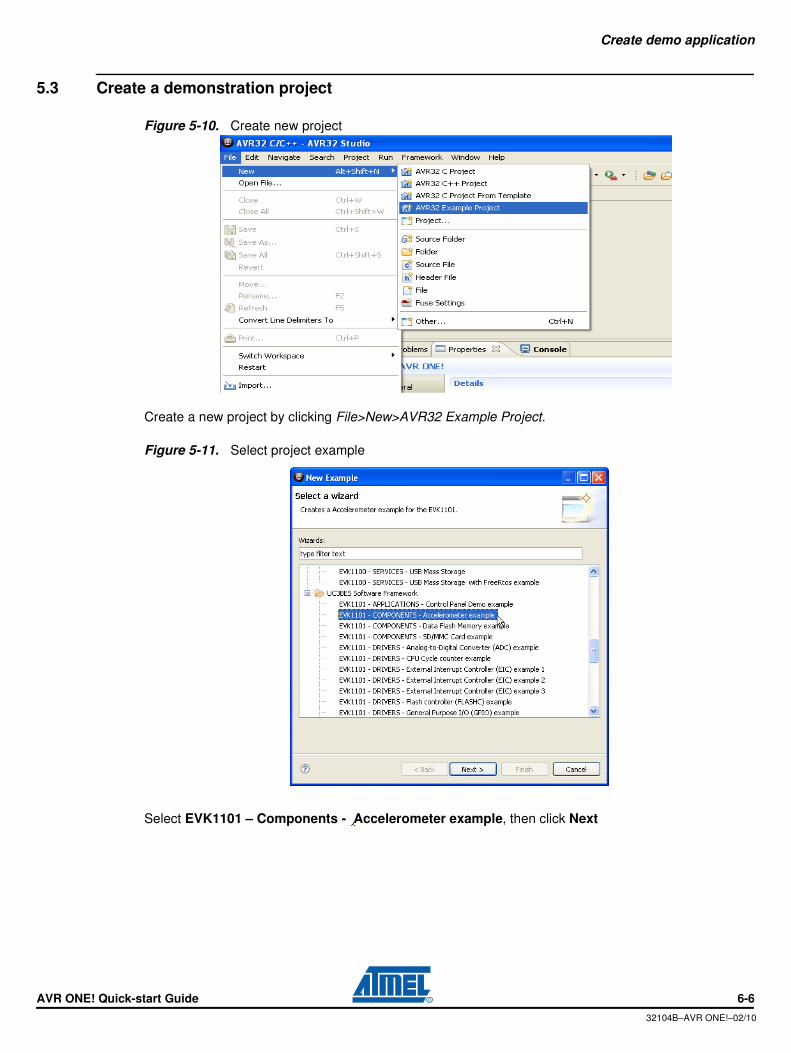
Figure 5-10. Create new project
Create a new project by clicking File>New>AVR32 Example Project.
Figure 5-11. Select project example
Select EVK1101 – Components - Accelerometer example, then click Next
Create demo application
AVR ONE! Quick-start Guide 6-7
32104B–AVR ONE!–02/10
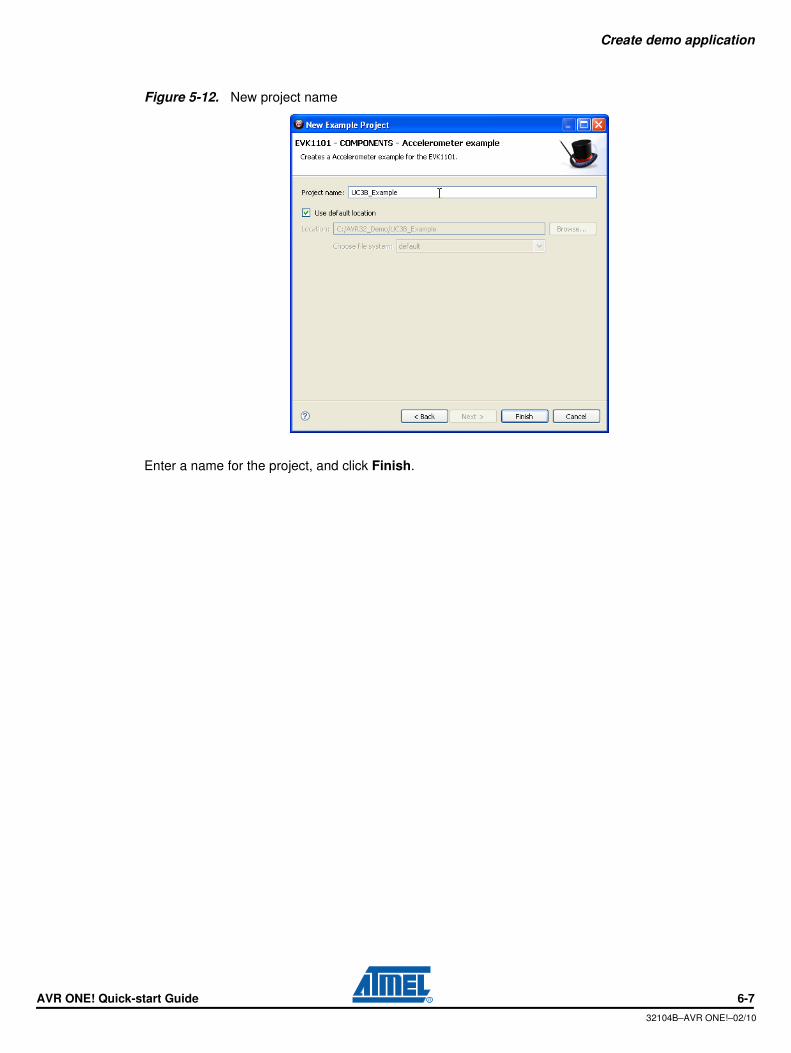
Figure 5-12. New project name
Enter a name for the project, and click Finish.

Create demo application
AVR ONE! Quick-start Guide 6-8
32104B–AVR ONE!–02/10
Figure 5-13. Build project
Right-click on the project in Project Explorer-view and select Build Project (or press CTRL+B).
Figure 5-14. Project build progress
Wait for the project build process to finish.

Create demo application
AVR ONE! Quick-start Guide 6-9
32104B–AVR ONE!–02/10
Figure 5-15. Console view
The console shows output from the compiler. Make sure that this ends with a “Build complete ...” mes-
sage (Except for the “Time consumed” message). If something is not working, you will see error
messages in this view.
5.4 Configure AVR32 Studio for a debug session using trace
Figure 5-16. Open Debug Dialog
When the build process is finished, right-click on the project in the Project Explorer view and select
Debug As>Debug Configurations.

Create demo application
AVR ONE! Quick-start Guide 6-10
32104B–AVR ONE!–02/10
5.4.1 Create a new debug launch configuration
In the Debug Configurations view, select AVR32 Application and right click and select New. A new
launch configuration will be created and default values will be filled into all applicable fields.
Select the Debugger tab and tick the Stop on startup at: main option.
Figure 5-17. Debugger tab

Create demo application
AVR ONE! Quick-start Guide 6-11
32104B–AVR ONE!–02/10
5.4.2 Configure the target trace module for program trace
Figure 5-18. Debug configurations, Main tab
In the Main tab, make sure that Target is set to AVR ONE!
Figure 5-19. Debug configurations, Debugger tab
Select the Debugger tab and check the checkbox at the option Stop on startup at: main.

Create demo application
AVR ONE! Quick-start Guide 6-12
32104B–AVR ONE!–02/10
Figure 5-20. Enable Trace
Select the Trace tab and check Enable Trace.
Figure 5-21. Preferred Trace method
Select the preferred trace method. In this case we want Nano Trace.
Deselect Break on application buffer access.
Create demo application
AVR ONE! Quick-start Guide 6-13
32104B–AVR ONE!–02/10
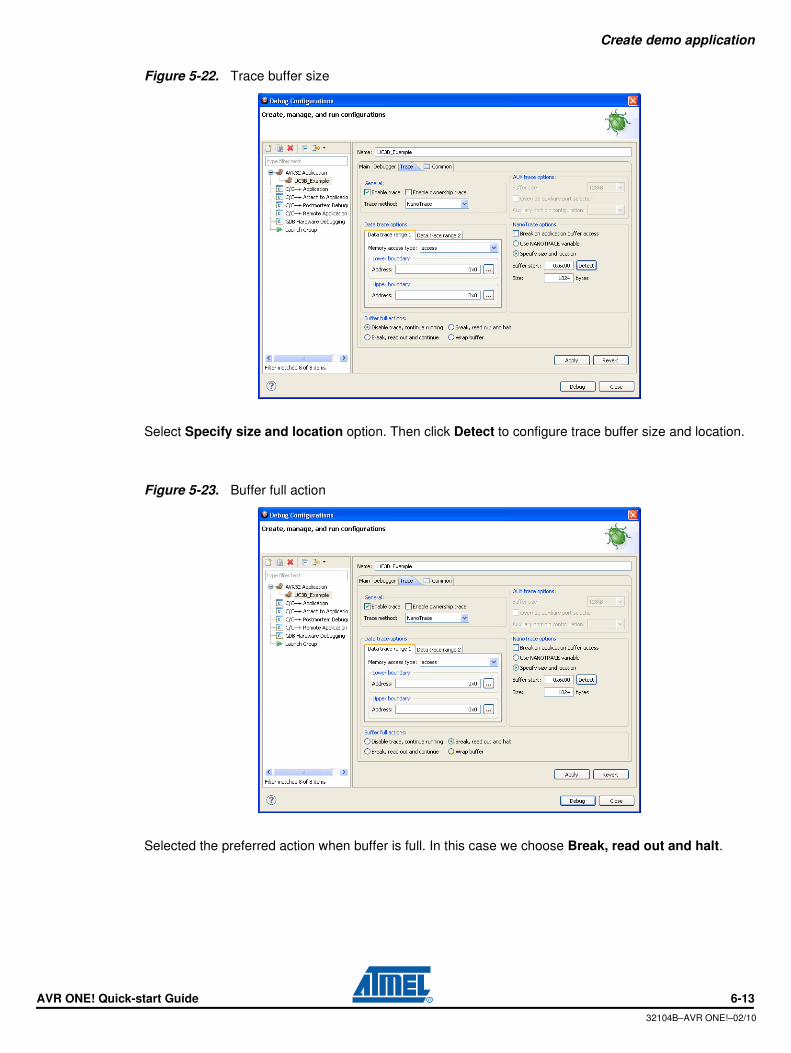
Figure 5-22. Trace buffer size
Select Specify size and location option. Then click Detect to configure trace buffer size and location.
Figure 5-23. Buffer full action
Selected the preferred action when buffer is full. In this case we choose Break, read out and halt.
Create demo application
AVR ONE! Quick-start Guide 6-14
32104B–AVR ONE!–02/10
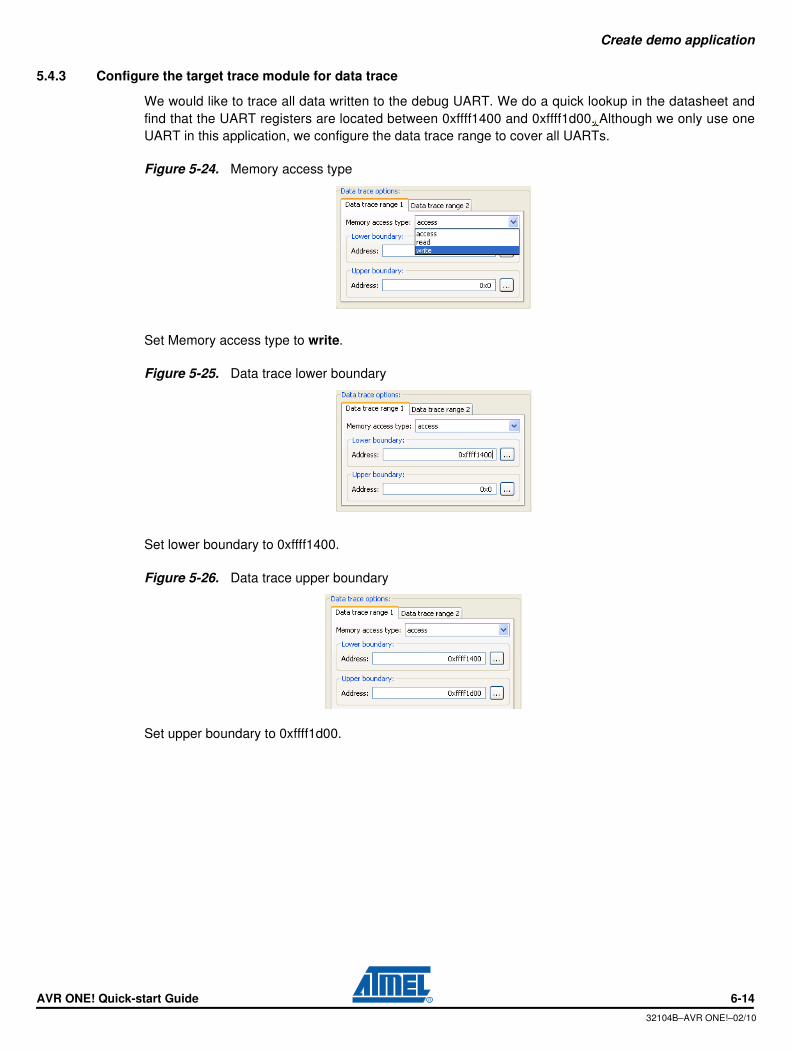
5.4.3 Configure the target trace module for data trace
We would like to trace all data written to the debug UART. We do a quick lookup in the datasheet and
find that the UART registers are located between 0xffff1400 and 0xffff1d00. Although we only use one
UART in this application, we configure the data trace range to cover all UARTs.
Figure 5-24. Memory access type
Set Memory access type to write.
Figure 5-25. Data trace lower boundary
Set lower boundary to 0xffff1400.
Figure 5-26. Data trace upper boundary
Set upper boundary to 0xffff1d00.
Create demo application
AVR ONE! Quick-start Guide 6-15
32104B–AVR ONE!–02/10
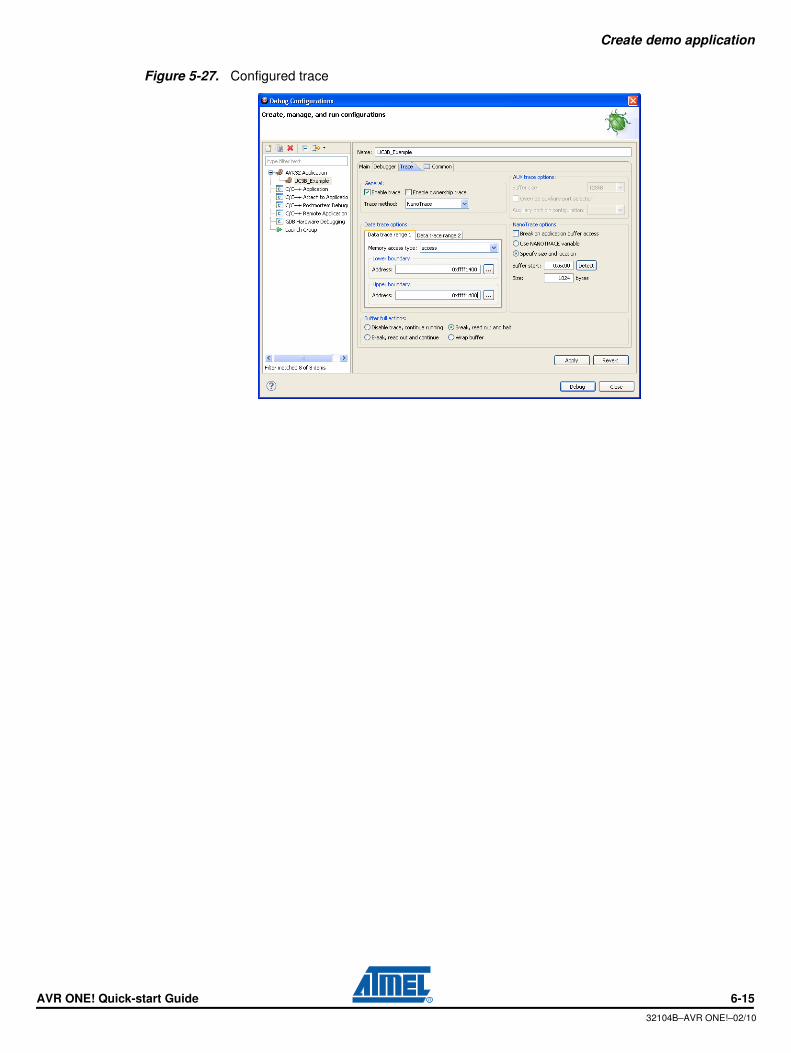
Figure 5-27. Configured trace

Create demo application
AVR ONE! Quick-start Guide 6-16
32104B–AVR ONE!–02/10
5.5 Start a debug session and configure the debugger for trace
Click the Debug button in the Debug Confugurations view. Now the program will be loaded into the
target, and run until main().
Figure 5-28. Switching perspective
When the debug session starts, AVR32 Studio 2.5 will change to the Debug perspective (desktop layout
designed for use during debug sessions). You should click Yes. To avoid being asked every time you
start a debug session, you should also click the Remember my decision box before answering Yes.
Wait until the target has stopped at the first instruction in the main() routine.
Figure 5-29. Program halted at main()

Create demo application
AVR ONE! Quick-start Guide 6-17
32104B–AVR ONE!–02/10
5.6 Add start and stop trace-points
Figure 5-30. Source code editor
Scroll up to line 156 in the file acc_example.c and right-click at the left edge of the editor. Select Add
Tracepoint... from the pop-up menu.

Create demo application
AVR ONE! Quick-start Guide 6-18
32104B–AVR ONE!–02/10
Figure 5-31. Tracepoint (Start)
Set Tracepoint Configuration values:
– Set Trigger Event to Program Counter
– Set Trace Operation to Start Trace
– Set Tracepoint type to both Program trace and Data trace
– Click OK
This will create a tracepoint that starts both program and data trace when the program counter hits this
code line.
Scroll down to line 160 in the file acc_example.c and right-click at the left edge of the editor. Select Add
Tracepoint... from the pop-up menu.

Create demo application
AVR ONE! Quick-start Guide 6-19
32104B–AVR ONE!–02/10
Figure 5-32. Tracepoint (Stop)
Set Tracepoint Configuration values:
– Set Trigger Event to Program Counter
– Set Trace Operation to Stop Trace
– Set Tracepoint type to both Program trace and Data trace
– Click OK
This will create a tracepoint that stops both program and data trace when the program counter hits this
code line.

Create demo application
AVR ONE! Quick-start Guide 6-20
32104B–AVR ONE!–02/10
5.7 Start the trace debug session
Figure 5-33. Resume debug session
Make sure that the main() process is still selected in the Debug view before pressing the Resume
button.
Start a serial port terminal to view the output from the debug UART. To make it simple, we just start
Hyperterminal. Click on Start>All Programs>Accessories>Communications>Hyperterminal.
Figure 5-34. New Hyperterminal
Enter a name for the session and click OK.

Create demo application
AVR ONE! Quick-start Guide 6-21
32104B–AVR ONE!–02/10
Figure 5-35. Hyperterminal port selection
Seletc the com-port that you connected the EVK1101 to (in this case we use Com1).
Figure 5-36. Hyperterminal port configuration
Set port parameters:
– Bits per second: 57600
– Data bits: 8
– Parity: None
– Stop bits: 1
– Flow control: None
Click OK.

Embedded Systems for Mechatronics 1, MF2042
Tutorial – Debugging in AVR32 Studio
version 2011‐10‐04
In AVR32 studio we can now press resume and look in the Trace Data tab up to the right.
If we scroll to a bit we will see that 0x48 has been send to the HyperTerminal. If we look in the ASCII
table we will see that this corresponds to the character “H” which is the first character in “Hello, this
is AT32UC3 saying hello! (press enter)”. In the HyperTerminal we can also see the characters printed.