Embed Size (px)
Citation preview
Decarbonization of
Indian Railways Assessing Balancing Costs and
Policy Risks
April 2017
A CPI Report
Charith Konda
Kuldeep Sharma
Gireesh Shrimali
Acknowledgements
The authors acknowledge the valuable contributions made by Sudhir Garg (Executive
Director, Electrical, Ministry of Railways), Sudhir Saxena (CEO, Railway Energy Management
Company Ltd.), Manu Srivastava (Principal Secretary & Commissioner, New and Renewable
Energy Department, Govt. of MP), Ajay Shukla (Executive Engineer, Office of the
Commissioner, New and Renewable Energy Department, Govt. of MP), R.K. Gupta (Director
– L&R, MP Electricity Regulatory Commission), and Christoph Wolff (MD, European Climate
Foundation).
The authors extend special thanks to the Department for International Development, UK for
supporting this study. The authors also thank Vivek Sen, Saurabh Trivedi, Vinit Atal, and Chavi
Meattle for participating in internal discussions, and Maggie Young, Angel Jacob, and Tim
Varga for internal review.
Descriptors
Sector Transportation
Region India
Keywords Decarbonization, railways, transportation, renewable energy,
infrastructure
Related CPI Reports Decarbonization of Indian Railways
Contact Gireesh Shrimali [email protected]
About CPI
Climate Policy Initiative works to improve the most important energy and land use policies
around the world, with a particular focus on finance. An independent organization
supported in part by a grant from the Open Society Foundations, CPI works in places that
provide the most potential for policy impact including Brazil, China, Europe, India,
Indonesia, and the United States.
Our work helps nations grow while addressing increasingly scarce resources and climate
risk. This is a complex challenge in which policy plays a crucial role.
Executive Summary
Complete decarbonization of the electricity demand of Indian Railways (IR) – transitioning
from the current, largely fossil-fuel based energy mix to clean energy like solar and wind
power – is likely to have multiple benefits. These include support in achieving India’s clean
energy targets, enhancing India’s energy security, and reducing IR’s operational costs.
In our previous study, Decarbonization of Indian Railways (CPI, 2016), we assessed the
economic viability of complete decarbonization of IR by 2030, and found that, for the
traction segment,1 decarbonization would be approximately 24% cheaper compared with
the business-as-usual pathway in terms of average annual cash outflows. We also found
that, in order to implement decarbonization, there is a need for additional analysis on load
balancing options for renewable energy. Because solar and wind power can be
intermittent and variable, they will require load balancing, which requires use of
technologies such as energy storage to ensure consistent supply of electricity that can
meet the demand.
Specifically, costs at a day-to-day management level may vary due to load balancing
issues. In order to examine this issue further, in this report, we have conducted a deeper
study on the pathway to decarbonization in one state, Madhya Pradesh, which is
important to IR as one of the top states for electricity consumption. We assessed the total
cost of 100% decarbonization of IR’s traction electricity demand in Madhya Pradesh (MP),
including the costs of generation and balancing, and compared that cost with the
business-as-usual pathway.
Our analysis indicates that the cost of 100% decarbonization would be 26-28% cheaper
than the business-as-usual pathway by 2030. These costs would reduce over time, from
being 27-38% expensive in 2016-17 to being marginally expensive (2-5%) in 2022. This is
largely due to an anticipated continuous decrease in renewable energy costs. The
business-as-usual pathway, which is the average power procurement cost of DISCOMs in
India and reflects the country’s energy mix (dominated by fossil fuel-based energy), will be
impacted negatively due to the expected continuous increase in fossil fuel costs.
We also found that balancing costs will likely account for 5-8% of the total decarbonization
costs in 2030, depending on the balancing technology chosen.2 These costs are bound to
gradually reduce from 5-12% in 2016-17 and 5-9% in 2022 as balancing technology costs
(specifically, of grid-scale batteries) are expected to reduce in the next 10-15 years due to
advancement in battery storage technology.3
1 The electricity consumption resulting from moving trains is categorized as traction electricity
demand, while the electricity consumption from railway stations and other buildings is categorized
as non-traction electricity demand.
2 We have chosen the balancing options of power banking with other DISCOMs or power traders, a
flexible gas-based power plant, and a grid-scale lithium ion battery storage based on our analysis in
CPI, 2016.
3 While balancing need (in terms of electricity units) is doubling between 2016-17 and 2030 due to
increasing demand, this is offset by the expected decrease in balancing technology costs,
Because of this, IR should aim to gradually ramp up the rate of decarbonization,
accelerating from 2022, and achieve 100% decarbonization by 2030. By 2030, the cost
savings of decarbonization compared to the business-as-usual pathway will become quite
apparent. The more promising balancing technologies, such as grid-scale battery storage,
are also expected to be commercially viable by 2030.
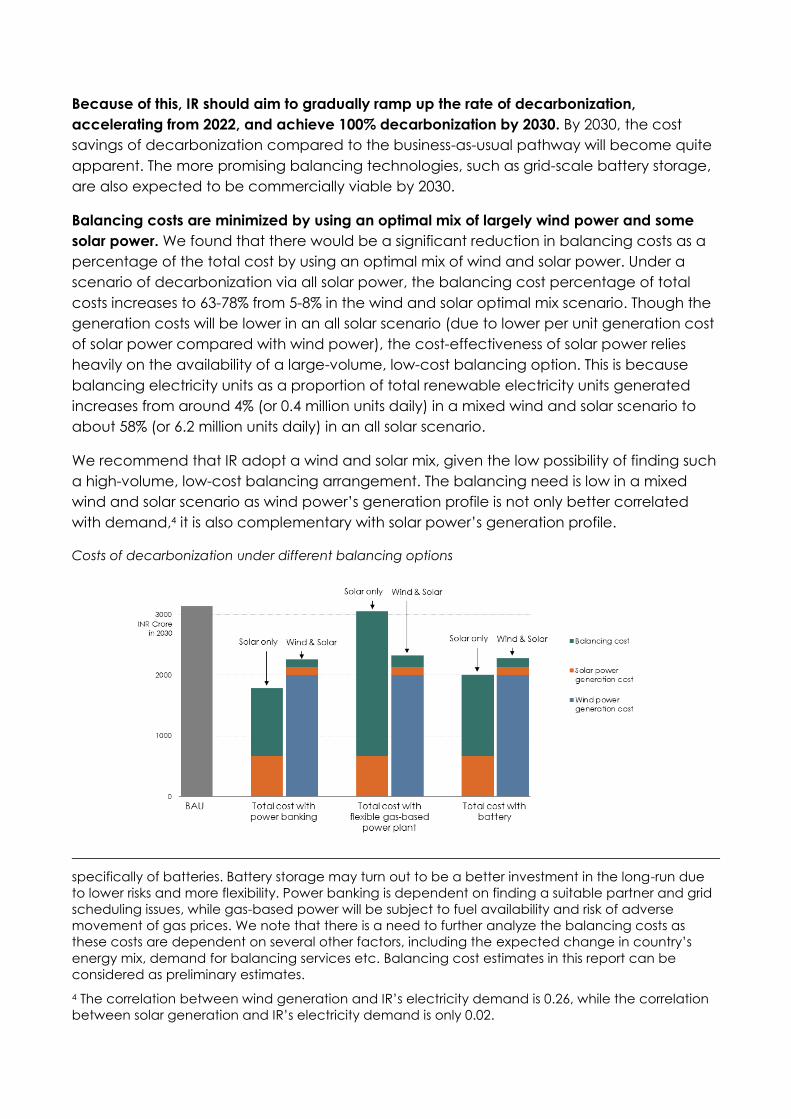
Balancing costs are minimized by using an optimal mix of largely wind power and some
solar power. We found that there would be a significant reduction in balancing costs as a
percentage of the total cost by using an optimal mix of wind and solar power. Under a
scenario of decarbonization via all solar power, the balancing cost percentage of total
costs increases to 63-78% from 5-8% in the wind and solar optimal mix scenario. Though the
generation costs will be lower in an all solar scenario (due to lower per unit generation cost
of solar power compared with wind power), the cost-effectiveness of solar power relies
heavily on the availability of a large-volume, low-cost balancing option. This is because
balancing electricity units as a proportion of total renewable electricity units generated
increases from around 4% (or 0.4 million units daily) in a mixed wind and solar scenario to
about 58% (or 6.2 million units daily) in an all solar scenario.
We recommend that IR adopt a wind and solar mix, given the low possibility of finding such
a high-volume, low-cost balancing arrangement. The balancing need is low in a mixed
wind and solar scenario as wind power’s generation profile is not only better correlated
with demand,4 it is also complementary with solar power’s generation profile.
Costs of decarbonization under different balancing options
specifically of batteries. Battery storage may turn out to be a better investment in the long-run due
to lower risks and more flexibility. Power banking is dependent on finding a suitable partner and grid
scheduling issues, while gas-based power will be subject to fuel availability and risk of adverse
movement of gas prices. We note that there is a need to further analyze the balancing costs as
these costs are dependent on several other factors, including the expected change in country’s
energy mix, demand for balancing services etc. Balancing cost estimates in this report can be
considered as preliminary estimates.
4 The correlation between wind generation and IR’s electricity demand is 0.26, while the correlation
between solar generation and IR’s electricity demand is only 0.02.
In terms of IR’s energy capacity requirement to meet its electricity demand, IR will require a
total installed solar and wind capacity of approximately six times its demand, given the
average capacity utilization factors (CUFs) of solar and wind, which are in the range of 18-
19%. Further, we found that IR will require the installed wind capacity to be approximately
eight times more than that of solar to keep the balancing need and costs low.
However, while planning for 100% decarbonization, IR should keep in mind the seasonality
of wind power in India. Wind is seasonal in India. It can lead to -19% to +32% variation in the
total capacity requirement during the worst case (October-December) and best case
(May-September) scenarios to meet IR’s electricity demand. While keeping the capacity
constant (at a base case), we found that the energy generated could vary from a shortfall
of 23% to a surplus of 25% compared to the energy generated from the annual average
CUF. This further indicates that IR might require a seasonal power banking arrangement in
addition to intra-day power banking to manage the seasonality of wind. Although, it must
be noted that the impact of seasonality can be accurately predicted only through a
probabilistic simulation model.
Finally, IR must recognize the policy and regulatory risks of decarbonization and plan to
mitigate them effectively. The top policy and regulatory risks that IR might face include a
lack of states’ recognition of IR’s deemed transmission and distribution licensee status and
the lack of a suitable power banking arrangement. Other potential risks are delay in
implementation of a framework that enables the inter-state sale of renewable energy and
delay in development of a national balancing market. Short-term measures, such as
directly connecting to an inter-state transmission network to gain more operational
freedom, and long-term measures, such as policy advocacy to drive the development of
national/regional balancing markets, could be used to mitigate these risks.
Table of Contents
1. Introduction ___________________________________________________________________ 7
2. Decarbonizing Indian Railways _________________________________________________ 8
2.1 Load balancing ___________________________________________________________ 8
2.2 Decarbonization costs _____________________________________________________ 8
2.2.1 Decarbonization costs based on average capacity utilization factors _____ 8
2.2.1 Balancing costs ________________________________________________________ 9
2.3 Wind and solar power capacity requirement _______________________________ 11
2.4 Seasonality of wind _______________________________________________________ 13
2.5 Reducing costs via an optimal mix of wind and solar energy ________________ 15
3. Policy and regulatory risks to decarbonization __________________________________ 17
4. Conclusion ___________________________________________________________________ 20
5. Appendix ____________________________________________________________________ 21
5.1 Per unit cost of decarbonization ___________________________________________ 21
5.2 Estimation of business-as-usual costs _______________________________________ 22
5.3 Estimation of optimal power generation capacity __________________________ 23
5.4 Estimation of balancing costs ______________________________________________ 28
5.5 Risk assessment ___________________________________________________________ 29
6. References ___________________________________________________________________ 32

1. Introduction
Indian Railways (IR) is the single largest electricity consumer in India. Decarbonizing Indian
Railways would not only help India achieve its clean energy targets but also increase
energy security by reducing fossil fuel imports. Further, decarbonization would be most likely
cost-effective in the long run, given the falling costs of renewable energy and increasing
costs of fossil fuel-based power (CPI, 2016).
In the first part of our study, Decarbonization of Indian Railways, (CPI, 2016) we examined
the costs of decarbonization at a macro level and on an annual basis in terms of cash
outflows under different decarbonization pathways. We found that decarbonization of IR
by 2030 would be cheaper than a business-as-usual pathway, but in order to implement
decarbonization, there is a need for low-cost and feasible balancing options5 for
renewable energy.
Specifically, we were also cognizant of the possibility that costs at a day-to-day
management level may vary due to load balancing issues since wind and solar power
generation is variable. In order to examine this issue further, in this report, we have
conducted a deeper study on the pathway to decarbonization in one state, Madhya
Pradesh, which is important to IR as one of the top states for electricity consumption. We
assessed the wind and solar power requirement for decarbonization by 2030, as well as the
balancing costs over a 24-hour period in a cost-optimized manner to achieve 100%
decarbonization of IR’s traction electricity demand in Madhya Pradesh.
We assessed these costs on a levelized cost basis assuming IR could sign a 25-year power
purchase contract with wind and solar power producers at three different time periods:
2016-17, 2022, and 2030. We also examined the potential policy and regulatory risks that
could impact the decarbonization plans of Indian Railways and discussed possible solutions
to mitigate these risks.
In Section 2, we have highlighted our approach towards tackling the problem of estimating
the decarbonization costs, the components of decarbonization costs, the required wind
and solar power generation capacities for achieving 100% decarbonization, and finally the
total costs of decarbonization (including the costs of balancing). In Section 3, we have
examined the policy and regulatory risks that could hinder the decarbonization plans of IR,
and have suggested potential solutions to mitigate the key risks identified. In Section 4, we
have listed our recommendations for IR and topics for future work.
We believe this short study will set the stage for a more elaborate assessment of the load
balancing requirement, which could be based on a probabilistic simulation model
considering time periods of 15 minutes blocks over 24 hours and 365 days. Additionally,
future work may require an assessment on the required capital expenditure for a complete
system design, including new transmission infrastructure and battery storage system.
5 A power system which has a high share of variable renewable energy, such as wind and solar
power, needs to be balanced – i.e. the variable power generation has to be matched with demand
at all times.
2. Decarbonizing Indian Railways
Decarbonization of Indian Railways (IR) would mean that IR meet its energy requirements
through non-fossil fuel-based clean energy sources. Decarbonization of operations could
be predominantly done through the use of clean and renewable energy sources, such as
wind, solar, hydro, nuclear, and biofuels. In CPI, 2016, we highlighted how wind and solar
energy are the most feasible and cost-effective large-scale clean power sources among
the options available.6
2.1 Load balancing
The primary challenge faced by IR while using high shares of variable renewable energy,
such as wind and solar power, is meeting their electricity demand at all times irrespective of
the variability in power generation. Additionally, if IR is aiming for 100% decarbonization, it
should not only be able to generate and consume adequate clean energy, but also
generate and store surplus power to meet shortfalls. This surplus power can be stored in
balancing options to draw equivalent quantities when there is a shortfall in generation—
such as a power banking arrangement with DISCOMs (India’s state-level public electricity
distribution companies) or other traders or in a battery. This way, IR could achieve 100%
decarbonization on a net energy basis.
In this report, we have considered the generation costs and balancing costs associated
with the balancing options of power banking with other DISCOMs or power traders, a
flexible gas-based power plant, and a grid-scale lithium ion battery storage. These were
selected from the commercial, technical, and regulatory feasibility analysis that we
undertook in CPI, 2016. We have compared the total costs of decarbonization (generation
plus balancing) with the business-as-usual cost to determine whether a complete
decarbonization pathway would be more cost-effective for IR.
2.2 Decarbonization costs
We have estimated the decarbonization costs at three different time points – 2016/17, 2022,
and 2030 – using wind and solar with three different balancing technologies – power
banking, a flexible gas-based power plant, and battery storage. For the purpose of analysis
in this paper, we have considered the decarbonization costs to be the cost of renewable
energy (i.e., levelized cost of wind and solar power) plus the balancing cost (per kWh cost
of balancing technology) required to meet 100% electricity demand of IR in a given year
(Appendix 5.1).
2.2.1 DECARBONIZATION COSTS BASED ON ANNUAL AVERAGE CAPACITY UTILIZATION FACTORS
6 In CPI, 2016, Decarbonization of Indian Railways, we determined that electrification of IR’s traction
operations is a prerequisite for decarbonizing its operations. By the end of 2016, 42% of the total track
network is electrified, which accounts for approximately 75% of the freight traffic and 50% of the
passenger traffic (PIB, 2016). Regardless of its decarbonization plans, Indian Railways has set itself a
target of electrifying more than 90% of its tracks in the next 5 years.
First, we estimated the decarbonization costs based on the annual average capacity
utilization factors (CUFs) of wind and solar power. Using a cost optimization model, we
found that:
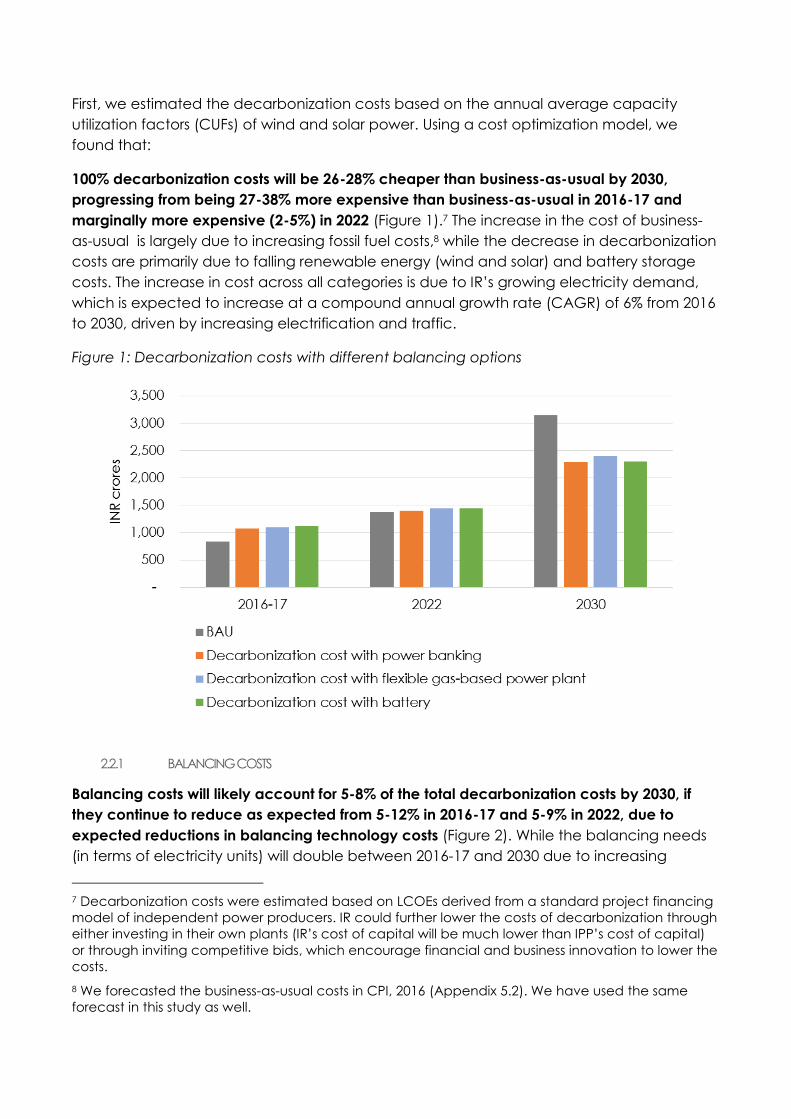
100% decarbonization costs will be 26-28% cheaper than business-as-usual by 2030,
progressing from being 27-38% more expensive than business-as-usual in 2016-17 and
marginally more expensive (2-5%) in 2022 (Figure 1).7 The increase in the cost of business-
as-usual is largely due to increasing fossil fuel costs,8 while the decrease in decarbonization
costs are primarily due to falling renewable energy (wind and solar) and battery storage
costs. The increase in cost across all categories is due to IR’s growing electricity demand,
which is expected to increase at a compound annual growth rate (CAGR) of 6% from 2016
to 2030, driven by increasing electrification and traffic.
Figure 1: Decarbonization costs with different balancing options
2.2.1 BALANCING COSTS
Balancing costs will likely account for 5-8% of the total decarbonization costs by 2030, if
they continue to reduce as expected from 5-12% in 2016-17 and 5-9% in 2022, due to
expected reductions in balancing technology costs (Figure 2). While the balancing needs
(in terms of electricity units) will double between 2016-17 and 2030 due to increasing
7 Decarbonization costs were estimated based on LCOEs derived from a standard project financing
model of independent power producers. IR could further lower the costs of decarbonization through
either investing in their own plants (IR’s cost of capital will be much lower than IPP’s cost of capital)
or through inviting competitive bids, which encourage financial and business innovation to lower the
costs.
8 We forecasted the business-as-usual costs in CPI, 2016 (Appendix 5.2). We have used the same
forecast in this study as well.

electricity demand, this will be offset by the expected decrease in balancing technology
costs, specifically of batteries.9 Overall, balancing costs will likely account for approximately
10% (or less) of the total decarbonization costs during 2016-2030, as the majority of the
balancing need would be addressed by the complementary generation profiles of
between the wind and solar power.
In terms of the cost-effectiveness of the different balancing options, a power banking
arrangement with another DISCOM or a power trader (energy to energy basis with
transmission and distribution charges and losses as sole expenses) would perhaps be the
cheapest balancing option across 2016 to 2030. Finding a party who has an opposite load
profile or energy needs to that of Indian Railways would be key in this scenario.
Also, battery storage may turn out to be a viable investment in the long-run due to
expected reduction in technology costs. Although at present grid-scale lithium-ion battery
storage costs are more than 100% higher than gas-based balancing costs on a kWh basis
(2016-17), battery storage costs are expected to fall sharply (10-12% annually)10, almost
erasing the difference in costs with gas-based power in 2022, and turning out to nearly 80%
cheaper than gas-based power by 2030 (Appendix 5.1). Further, battery storage has lower
operational risks and provides more flexibility while power banking is dependent on finding
a suitable partner and grid scheduling issues and gas-based power will be subject to fuel
availability and risk of adverse movement of gas prices.11
Because of this, IR should aim to gradually ramp up the rate of decarbonization, accelerate
from 2022, and achieve 100% decarbonization by 2030. By 2030, the cost savings of
decarbonization compared to the business-as-usual pathway will become quite apparent.
The more promising balancing technologies, such as grid-scale battery storage, are also
expected to be commercially viable by 2030. There is even a possibility that 100%
decarbonization will be cheaper than the business-as-usual pathway by 2022, if IR adopts a
competitive electricity procurement process.12
9 We have discussed the methodology for estimating the balancing costs in detail in Appendix 5.4.
10 BNEF, 2016 and GS, 2015
11 We note that further work is required to accurately estimate the battery costs. In this study, we
derived battery costs from secondary research. However, battery costs may vary widely by region,
by application, and by the type of battery used – even among the lithium ion batteries, the life of
the batteries may vary from 5 to 15 years. Regardless, several studies indicate a drastic reduction in
battery storage costs in the next 5-10 years (IHS, 2015; Reuters, 2016).
12 Our cost estimates were based on standard return expectations and cost of capital of
independent power producers (Appendix 5.1). However, the costs discovered through a
competitive bidding process may turn out to be much lower as bidders may reduce their return
expectations and deploy innovative financing mechanisms to win projects.
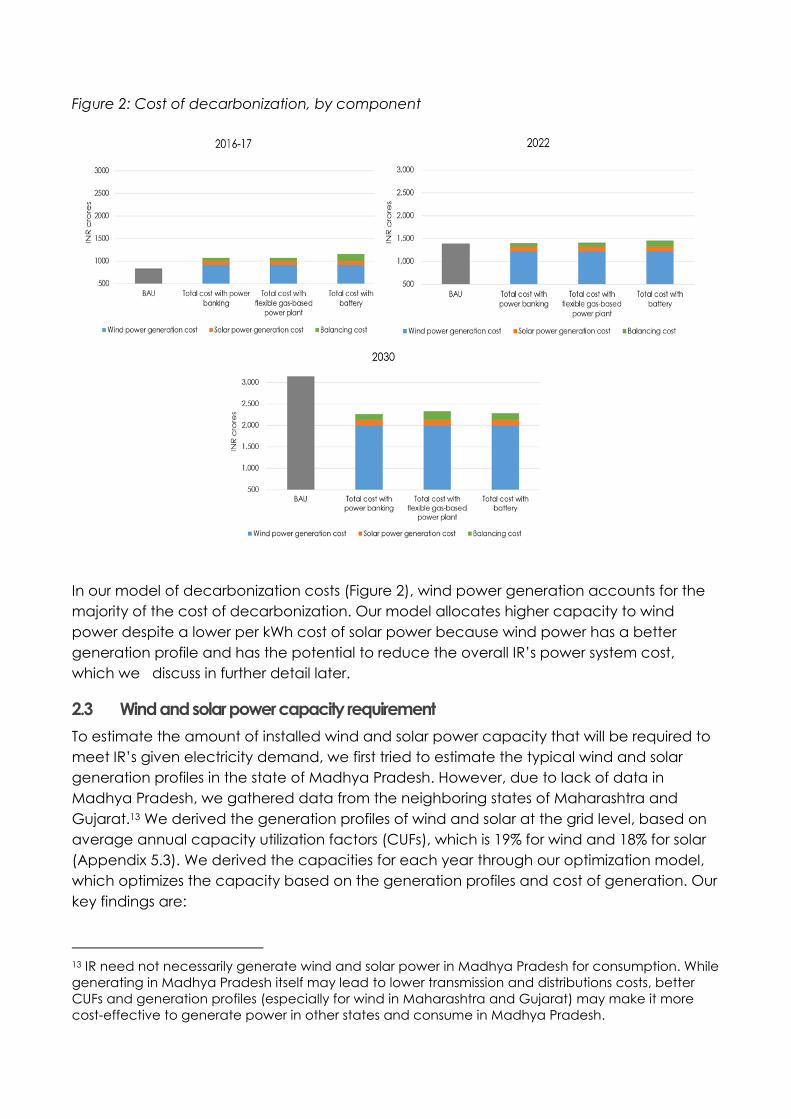
Figure 2: Cost of decarbonization, by component
In our model of decarbonization costs (Figure 2), wind power generation accounts for the
majority of the cost of decarbonization. Our model allocates higher capacity to wind
power despite a lower per kWh cost of solar power because wind power has a better
generation profile and has the potential to reduce the overall IR’s power system cost,
which we discuss in further detail later.
2.3 Wind and solar power capacity requirement
To estimate the amount of installed wind and solar power capacity that will be required to
meet IR’s given electricity demand, we first tried to estimate the typical wind and solar
generation profiles in the state of Madhya Pradesh. However, due to lack of data in
Madhya Pradesh, we gathered data from the neighboring states of Maharashtra and
Gujarat.13 We derived the generation profiles of wind and solar at the grid level, based on
average annual capacity utilization factors (CUFs), which is 19% for wind and 18% for solar
(Appendix 5.3). We derived the capacities for each year through our optimization model,
which optimizes the capacity based on the generation profiles and cost of generation. Our
key findings are:
13 IR need not necessarily generate wind and solar power in Madhya Pradesh for consumption. While
generating in Madhya Pradesh itself may lead to lower transmission and distributions costs, better
CUFs and generation profiles (especially for wind in Maharashtra and Gujarat) may make it more
cost-effective to generate power in other states and consume in Madhya Pradesh.

To decarbonize 100% of IR’s electricity demand, IR would need to install a renewable
energy capacity of approximately six times more than its demand (Table 1). In 2016-17, IR
would need an installed capacity (wind
and solar combined) of 1,282 MW.
Similarly, it would need a total installed
capacity of 1,818 MW in 2022 and 2,898
MW in 2030. This is primarily because of
the CUFs of solar and wind, which are
on average in the range of 18-19%.
Further, we found that IR will require the
installed wind capacity to be approximately eight times more than that of solar to keep the
balancing need and costs low. This is because wind has a better power generation profile,
as there is more availability on average over the 24-hour day, and it matches electricity
demand in a better way than solar power. Our analysis indicated a correlation of 0.26
between wind generation and IR’s demand, while solar generation had a correlation of
only 0.02.
To meet the objective of 100% decarbonization, the power system designed by our
optimization model generates surplus power when the resources (wind and sun) are
available, to feed the power into balancing options, such as power banking and battery
storage (Figure 3). In the case of a gas-based power plant, the surplus power can be sold
via power exchanges. Our model ensures that the surplus generation is greater than or
equal to the shortfall in generation to achieve 100% decarbonization on a net energy basis.
Figure 3: Wind and solar generation profile on an average day in Madhya Pradesh
Table 1: Expected electricity demand and
generation capacity required
2016-17 2022 2030
Wind capacity (MW) 1,137 1,613 2,571
Solar capacity (MW) 145 205 327
Total capacity (MW) 1,282 1,818 2,898
Electricity demand
(MWh)
200 284 452
2.4 Seasonality of wind
While planning for 100% decarbonization, it’s important that IR should keep in mind the
seasonality of wind power in India. The velocity of wind varies by the season, which affects
wind power generation. An observation of wind speeds in the top five wind potential states
in India (Andhra Pradesh, Karnataka, Tamil Nadu, Gujarat, and Maharashtra) indicated
that India has three wind seasons: Jan-Apr (low-wind season), May-Sept (high-wind
season), and Oct-Dec (very low-wind season) with significant variation in CUFs (Phadke A.,
et al., 2011).
Variation in CUFs could result in a different power generation capacity requirement than
what we have estimated using the annual average CUFs. To evaluate the impact of
seasonality, we tested the sensitivity of our results (Table 1) to the changing CUFs of wind as
per the seasons identified above. And for evaluating the seasonality associated with wind
power generation, we used the hourly wind generation data of Maharashtra and Gujarat
from 2015.14 We divided the year into three seasons (as identified above) and took an
hourly average of the power generation for these seasons.
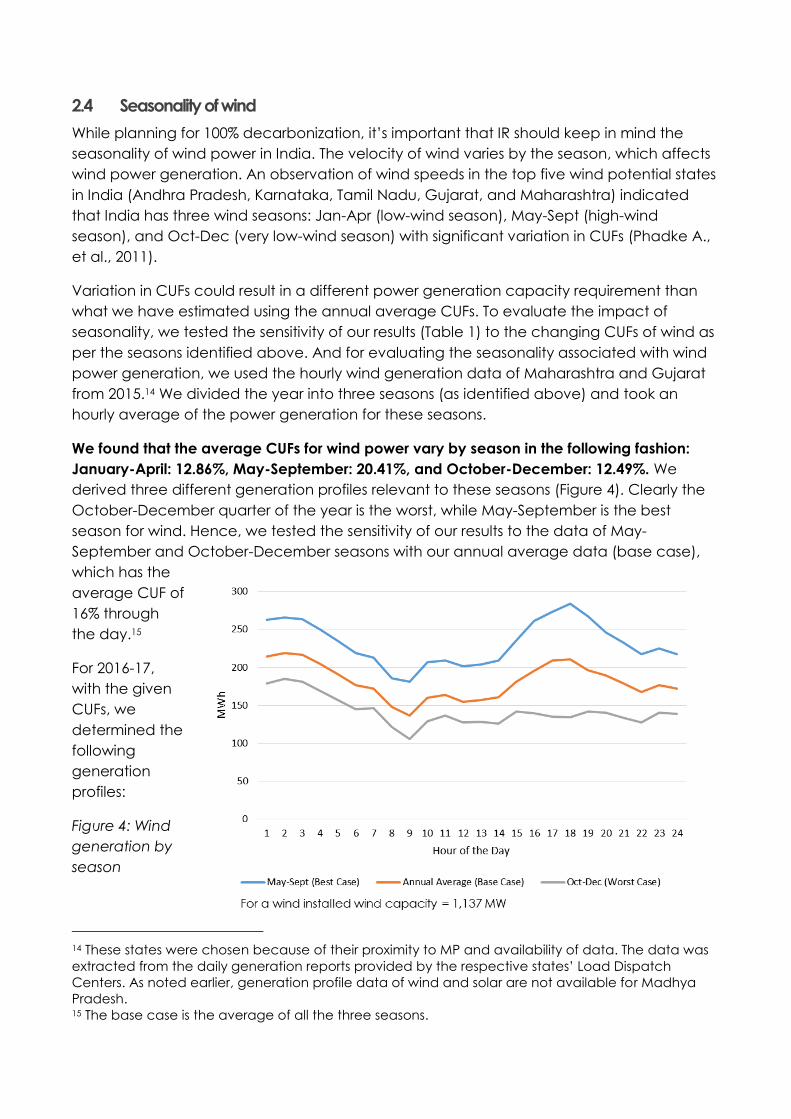
We found that the average CUFs for wind power vary by season in the following fashion:
January-April: 12.86%, May-September: 20.41%, and October-December: 12.49%. We
derived three different generation profiles relevant to these seasons (Figure 4). Clearly the
October-December quarter of the year is the worst, while May-September is the best
season for wind. Hence, we tested the sensitivity of our results to the data of May-
September and October-December seasons with our annual average data (base case),
which has the
average CUF of
16% through
the day.15
For 2016-17,
with the given
CUFs, we
determined the
following
generation
profiles:
Figure 4: Wind
generation by
season
14 These states were chosen because of their proximity to MP and availability of data. The data was
extracted from the daily generation reports provided by the respective states’ Load Dispatch
Centers. As noted earlier, generation profile data of wind and solar are not available for Madhya
Pradesh. 15 The base case is the average of all the three seasons.
With the above generation profiles, our optimization model yielded the below power
generation capacity requirement results (Table 2). We kept the solar generation profile
constant through the year for the purpose of this analysis.
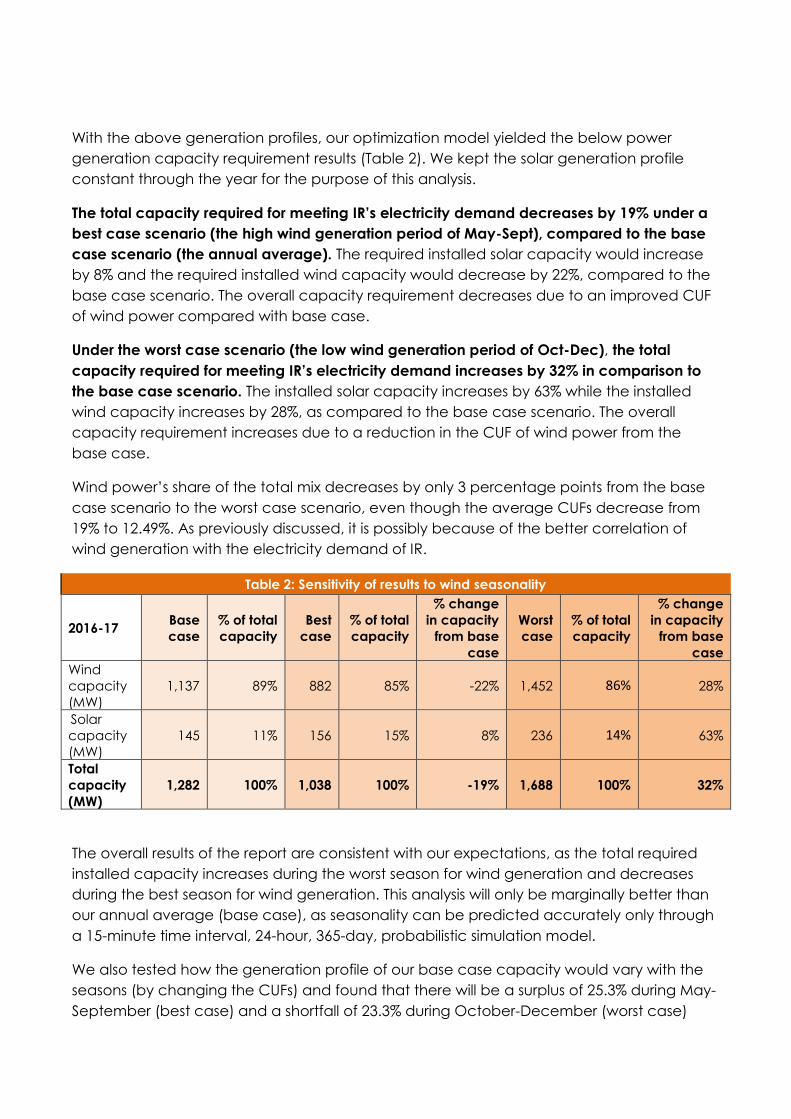
The total capacity required for meeting IR’s electricity demand decreases by 19% under a
best case scenario (the high wind generation period of May-Sept), compared to the base
case scenario (the annual average). The required installed solar capacity would increase
by 8% and the required installed wind capacity would decrease by 22%, compared to the
base case scenario. The overall capacity requirement decreases due to an improved CUF
of wind power compared with base case.
Under the worst case scenario (the low wind generation period of Oct-Dec), the total
capacity required for meeting IR’s electricity demand increases by 32% in comparison to
the base case scenario. The installed solar capacity increases by 63% while the installed
wind capacity increases by 28%, as compared to the base case scenario. The overall
capacity requirement increases due to a reduction in the CUF of wind power from the
base case.
Wind power’s share of the total mix decreases by only 3 percentage points from the base
case scenario to the worst case scenario, even though the average CUFs decrease from
19% to 12.49%. As previously discussed, it is possibly because of the better correlation of
wind generation with the electricity demand of IR.
Table 2: Sensitivity of results to wind seasonality
2016-17 Base
case
% of total
capacity
Best
case
% of total
capacity
% change
in capacity
from base
case
Worst
case
% of total
capacity
% change
in capacity
from base
case
Wind
capacity
(MW)
1,137 89% 882 85% -22% 1,452 86% 28%
Solar
capacity
(MW)
145 11% 156 15% 8% 236 14% 63%
Total
capacity
(MW)
1,282 100% 1,038 100% -19% 1,688 100% 32%
The overall results of the report are consistent with our expectations, as the total required
installed capacity increases during the worst season for wind generation and decreases
during the best season for wind generation. This analysis will only be marginally better than
our annual average (base case), as seasonality can be predicted accurately only through
a 15-minute time interval, 24-hour, 365-day, probabilistic simulation model.
We also tested how the generation profile of our base case capacity would vary with the
seasons (by changing the CUFs) and found that there will be a surplus of 25.3% during May-
September (best case) and a shortfall of 23.3% during October-December (worst case)
and overall surplus of 2% during the year compared to the generation derived from a
constant annual average CUF.
Hence, our base case capacity could serve as an optimal capacity. But given the
variations in generation, IR may have to opt for a seasonal power banking arrangement in
addition to an intra-day power banking arrangement. However, the actual requirement (in
terms of volume) of seasonal power banking and the costs associated with seasonality of
wind could only be estimated through a probabilistic simulation model and requires further
work.
2.5 Reducing costs via an optimal mix of wind and solar energy
As mentioned briefly earlier in the report, IR can keep balancing costs low by using an
optimal mix of largely wind power and some solar power, as opposed to using just solar
power.
We found that that the total cost of decarbonization if IR uses just solar power will be in the
range of INR 1,785-3,056 crores (Figure 5) compared to the total cost of decarbonization
under a mix of wind and solar power, at INR 2,260-2,324 crores (Figure 2) in 2030. The lower
end represents the decarbonization costs with a power banking option and the higher end
represents the costs with a flexible gas-based power plant as a balancing option.
While the generation costs are lower in the only solar scenario (at 22-37% of the total costs)
compared to the wind and solar mix scenario (at 92-95% of the total costs), balancing costs
account for a larger share (63-78%) of the total costs in the only solar scenario compared
to the balancing cost share of 5-8% in the wind and solar mix scenario.
Though the generation costs will be lower in an only solar scenario, due to lower per kWh
costs of generation of solar power compared to per kWh cost of generation of wind power,
balancing costs increase in the former due to higher balancing needs since solar power is
available only for ~8 hours in a day.16 Balancing electricity units as a proportion of total
renewable electricity units generated increases from around 4% in a mixed wind and solar
scenario to about 57% in an only solar scenario. Balancing costs are lower in the wind and
solar scenario due to complementary nature of wind and solar generation profiles.
The cost-effectiveness of an only solar scenario would rely heavily on the availability of a
large-volume, low-cost balancing option. We recommend that IR adopt a wind and solar
mix to keep decarbonization costs low, given the risks and low possibility of finding such a
high-volume, low-cost balancing arrangement for an all solar power scenario.
16 Surplus power has to be generated and stored in large quantities during the day, so it can be used
at night.

Figure 5: Comparison of decarbonization costs, by balancing technology
We also found that if IR opts for only solar instead of a combination of wind and solar to
meet the demand of 452 MWh in 2030, it will require a solar power generation capacity of
2,840 MW. At this capacity, the solar generation profile is as below:
Figure 6: Only solar generation profile
Though the total generation capacity required in the only solar scenario is in a similar range
to that of solar and wind scenario, the balancing need drastically increases in the only solar
scenario as noted above.

3. Policy and regulatory risks to decarbonization
One of the primary concerns of Indian Railways (IR) in adopting a high decarbonization
plan is the possibility of an increase in costs due to policy and regulatory risks. Though a few
of these risks may be common for both business-as-usual and decarbonization pathways,
some risks may exacerbate under a decarbonization pathway.
From discussions with relevant stakeholders,17 we identified major policy risks that will be
relevant to IR and also estimated the potential impact of these risks. We note that a
thorough policy landscape analysis (perhaps at a regional level) is essential to identify the
policy/regulatory risks and potential solutions in a more rigorous manner.
Through our consultations, we found the following top policy and regulatory risks:
1. A lack of recognition of IR’s deemed transmission & distribution licensee status by
states may constrain IR’s operational freedom. This is largely due to the reluctance
shown by DISCOMs toward losing their most valuable and credible consumer, IR. This
lack of recognition of IR’s T&D licensee status would limit IR’s freedom in
competitively procuring electricity and building its own transmission and distribution
lines.
2. Uncertainty over IR’s ability to find a power banking arrangement under the licensee
model either within or outside Madhya Pradesh (via open access) would remove a
low-cost balancing option and would most likely increase the costs of
decarbonization.
3. A delay in implementation of the framework that enables inter-state sale of
renewable energy and development of a national balancing market also poses a
risk, for several reasons. First, a delay in introducing a framework for inter-state sale of
renewable energy will limit IR’s ability to generate renewable energy in other states
(which have good resources) and transmit to its demand centers. This will possibly
increase the costs of generation. Second, if the development of a national
balancing market gets delayed, IR will have to develop its own balancing option,
such as battery storage or a flexible thermal power plant. This will also increase the
cost of decarbonization.
Table 3 below lists all of the risks we identified (Appendix 5.5).
17 We had discussions with IR officials and Madhya Pradesh state government officials, including the
Principal Secretary and Executive Engineer – New and Renewable Energy Department, and officials
of the Madhya Pradesh Electricity Regulatory Commission. We have defined and indicated the
individual scores of the risks in Table 5 in Appendix 5.4.
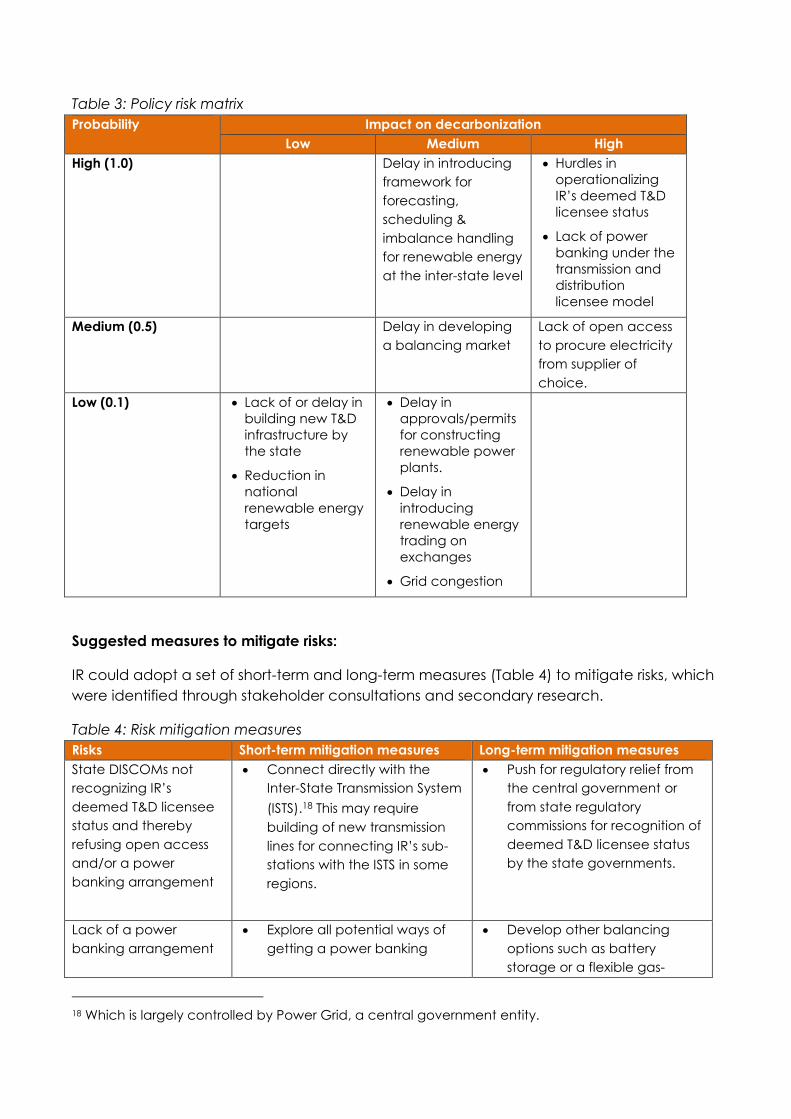
Table 3: Policy risk matrix
Probability Impact on decarbonization
Low Medium High
High (1.0) Delay in introducing
framework for
forecasting,
scheduling &
imbalance handling
for renewable energy
at the inter-state level
Hurdles in
operationalizing
IR’s deemed T&D
licensee status
Lack of power
banking under the
transmission and
distribution
licensee model
Medium (0.5) Delay in developing
a balancing market
Lack of open access
to procure electricity
from supplier of
choice.
Low (0.1) Lack of or delay in
building new T&D
infrastructure by
the state
Reduction in
national
renewable energy
targets
Delay in
approvals/permits
for constructing
renewable power
plants.
Delay in
introducing
renewable energy
trading on
exchanges
Grid congestion
Suggested measures to mitigate risks:
IR could adopt a set of short-term and long-term measures (Table 4) to mitigate risks, which
were identified through stakeholder consultations and secondary research.
Table 4: Risk mitigation measures
Risks Short-term mitigation measures Long-term mitigation measures
State DISCOMs not
recognizing IR’s
deemed T&D licensee
status and thereby
refusing open access
and/or a power
banking arrangement
Connect directly with the
Inter-State Transmission System
(ISTS).18 This may require
building of new transmission
lines for connecting IR’s sub-
stations with the ISTS in some
regions.
Push for regulatory relief from
the central government or
from state regulatory
commissions for recognition of
deemed T&D licensee status
by the state governments.
Lack of a power
banking arrangement
Explore all potential ways of
getting a power banking
Develop other balancing
options such as battery
storage or a flexible gas-
18 Which is largely controlled by Power Grid, a central government entity.
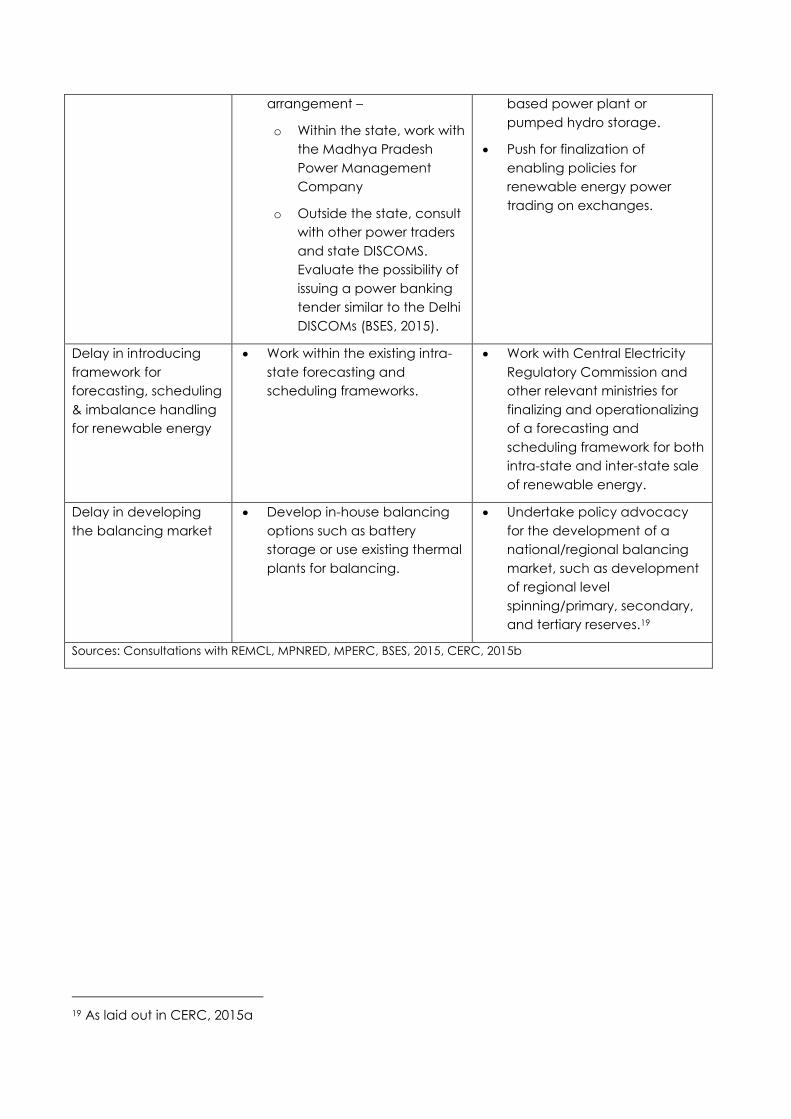
arrangement –
o Within the state, work with
the Madhya Pradesh
Power Management
Company
o Outside the state, consult
with other power traders
and state DISCOMS.
Evaluate the possibility of
issuing a power banking
tender similar to the Delhi
DISCOMs (BSES, 2015).
based power plant or
pumped hydro storage.
Push for finalization of
enabling policies for
renewable energy power
trading on exchanges.
Delay in introducing
framework for
forecasting, scheduling
& imbalance handling
for renewable energy
Work within the existing intra-
state forecasting and
scheduling frameworks.
Work with Central Electricity
Regulatory Commission and
other relevant ministries for
finalizing and operationalizing
of a forecasting and
scheduling framework for both
intra-state and inter-state sale
of renewable energy.
Delay in developing
the balancing market
Develop in-house balancing
options such as battery
storage or use existing thermal
plants for balancing.
Undertake policy advocacy
for the development of a
national/regional balancing
market, such as development
of regional level
spinning/primary, secondary,
and tertiary reserves.19
Sources: Consultations with REMCL, MPNRED, MPERC, BSES, 2015, CERC, 2015b
19 As laid out in CERC, 2015a
4. Conclusion
In this report, we have assessed the total cost of 100% decarbonization of IR’s electricity
demand in Madhya Pradesh, including the costs of generation and balancing, and
compared that cost with the business-as-usual pathway, in order to gain a deeper
understanding of the potential effect of balancing costs on the overall costs of
decarbonization.
We found that complete decarbonization of Indian Railways’ electricity demand will
possibly be more cost-effective than the business-as-usual pathway in the long-run even
after including balancing costs. Based on the analysis in this report, our recommendations
are as follows:
Indian Railways (IR) should aim for 100% decarbonization of electricity demand in
the traction segment in Madhya Pradesh by 2030, as a decarbonization pathway
will be 26-28% cheaper than the business-as-usual pathway.
IR should consider accelerating decarbonization after 2022 when the cost savings
will become quite apparent, and move towards achieving the 100%
decarbonization target by 2030.
Balancing costs can be minimized by using an optimal mix of largely wind power
and some solar power, as opposed to just solar power. This is because the
generation profiles of wind and solar are complementary and the wind generation
profile is better correlated with demand, resulting in lower overall balancing costs.
When planning for decarbonization, IR should keep in mind that wind is seasonal in
India, which can cause a variation of -19% to +32% in the installed wind capacity
that would be required to complete decarbonization by 2030. However, a robust
probabilistic simulation model may be required to accurately predict wind
seasonality and its impact on costs.
IR should make strong efforts to operationalize their deemed transmission and
distribution licensee status in order to gain more operational freedom, but should
expect some drawbacks in the form of lack of a power banking arrangement with
state DISCOMs (in the traditional fashion) and the ability to use the state grid.
IR should explore new balancing mechanisms under the licensee model, including
trade of renewable power and sourcing power banking arrangements
competitively.
5. Appendix
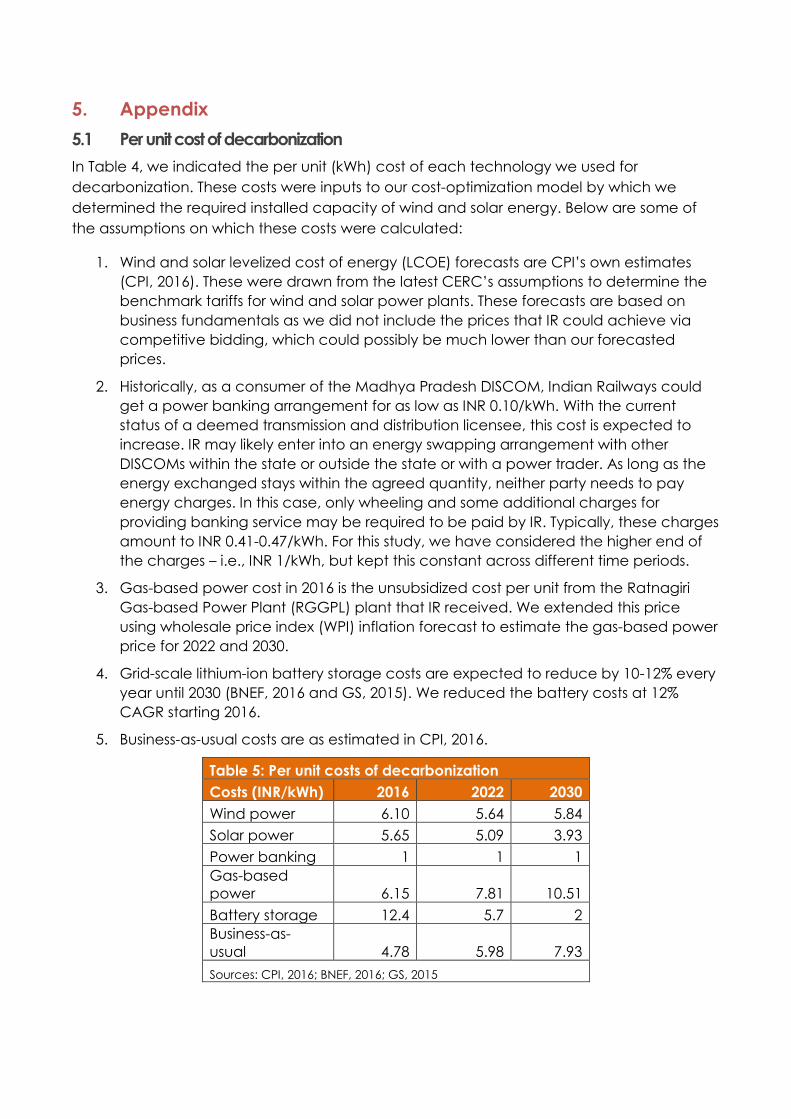
5.1 Per unit cost of decarbonization
In Table 4, we indicated the per unit (kWh) cost of each technology we used for
decarbonization. These costs were inputs to our cost-optimization model by which we
determined the required installed capacity of wind and solar energy. Below are some of
the assumptions on which these costs were calculated:
1. Wind and solar levelized cost of energy (LCOE) forecasts are CPI’s own estimates
(CPI, 2016). These were drawn from the latest CERC’s assumptions to determine the
benchmark tariffs for wind and solar power plants. These forecasts are based on
business fundamentals as we did not include the prices that IR could achieve via
competitive bidding, which could possibly be much lower than our forecasted
prices.
2. Historically, as a consumer of the Madhya Pradesh DISCOM, Indian Railways could
get a power banking arrangement for as low as INR 0.10/kWh. With the current
status of a deemed transmission and distribution licensee, this cost is expected to
increase. IR may likely enter into an energy swapping arrangement with other
DISCOMs within the state or outside the state or with a power trader. As long as the
energy exchanged stays within the agreed quantity, neither party needs to pay
energy charges. In this case, only wheeling and some additional charges for
providing banking service may be required to be paid by IR. Typically, these charges
amount to INR 0.41-0.47/kWh. For this study, we have considered the higher end of
the charges – i.e., INR 1/kWh, but kept this constant across different time periods.
3. Gas-based power cost in 2016 is the unsubsidized cost per unit from the Ratnagiri
Gas-based Power Plant (RGGPL) plant that IR received. We extended this price
using wholesale price index (WPI) inflation forecast to estimate the gas-based power
price for 2022 and 2030.
4. Grid-scale lithium-ion battery storage costs are expected to reduce by 10-12% every
year until 2030 (BNEF, 2016 and GS, 2015). We reduced the battery costs at 12%
CAGR starting 2016.
5. Business-as-usual costs are as estimated in CPI, 2016.
Table 5: Per unit costs of decarbonization
Costs (INR/kWh) 2016 2022 2030
Wind power 6.10 5.64 5.84
Solar power 5.65 5.09 3.93
Power banking 1 1 1
Gas-based
power 6.15 7.81 10.51
Battery storage 12.4 5.7 2
Business-as-
usual 4.78 5.98 7.93
Sources: CPI, 2016; BNEF, 2016; GS, 2015
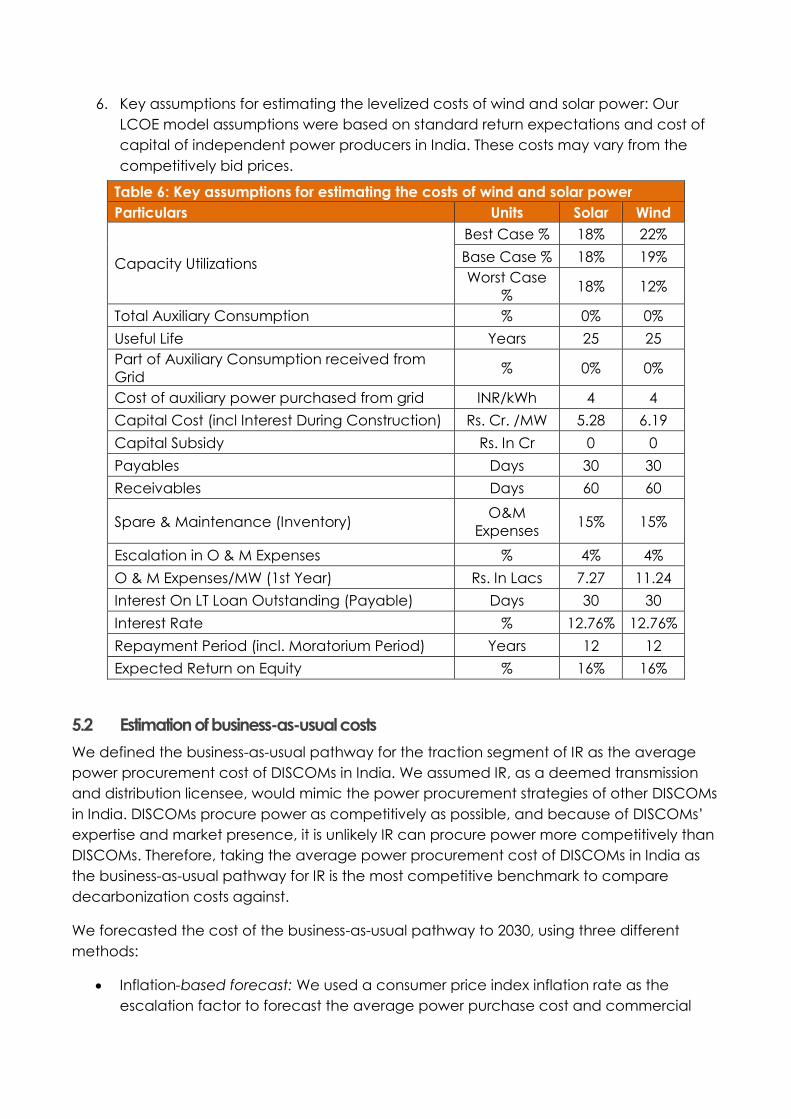
6. Key assumptions for estimating the levelized costs of wind and solar power: Our
LCOE model assumptions were based on standard return expectations and cost of
capital of independent power producers in India. These costs may vary from the
competitively bid prices.
Table 6: Key assumptions for estimating the costs of wind and solar power
Particulars Units Solar Wind
Capacity Utilizations
Best Case % 18% 22%
Base Case % 18% 19%
Worst Case
% 18% 12%
Total Auxiliary Consumption % 0% 0%
Useful Life Years 25 25
Part of Auxiliary Consumption received from
Grid % 0% 0%
Cost of auxiliary power purchased from grid INR/kWh 4 4
Capital Cost (incl Interest During Construction) Rs. Cr. /MW 5.28 6.19
Capital Subsidy Rs. In Cr 0 0
Payables Days 30 30
Receivables Days 60 60
Spare & Maintenance (Inventory) O&M
Expenses 15% 15%
Escalation in O & M Expenses % 4% 4%
O & M Expenses/MW (1st Year) Rs. In Lacs 7.27 11.24
Interest On LT Loan Outstanding (Payable) Days 30 30
Interest Rate % 12.76% 12.76%
Repayment Period (incl. Moratorium Period) Years 12 12
Expected Return on Equity % 16% 16%
5.2 Estimation of business-as-usual costs
We defined the business-as-usual pathway for the traction segment of IR as the average
power procurement cost of DISCOMs in India. We assumed IR, as a deemed transmission
and distribution licensee, would mimic the power procurement strategies of other DISCOMs
in India. DISCOMs procure power as competitively as possible, and because of DISCOMs’
expertise and market presence, it is unlikely IR can procure power more competitively than
DISCOMs. Therefore, taking the average power procurement cost of DISCOMs in India as
the business-as-usual pathway for IR is the most competitive benchmark to compare
decarbonization costs against.
We forecasted the cost of the business-as-usual pathway to 2030, using three different
methods:
Inflation-based forecast: We used a consumer price index inflation rate as the
escalation factor to forecast the average power purchase cost and commercial

tariffs. Here, we assumed that the average power purchase cost and the
commercial tariffs would grow at the rate of inflation in future.
Linear trend: We used the linear trend extrapolation approach to forecast the
average power purchase cost and commercial tariffs. Here, we assumed that
business-as-usual applicable will follow the linear fit to historical trend in the future.
Regression approach: We used two factor (domestic coal prices and inflation index)
and one factor (only inflation index) regression to forecast the business-as-usual
costs.
Among the three estimates, the one factor (inflation index) regression based estimate has
the least growth and is therefore the most competitive, so we have used that as our
benchmark against which to compare decarbonization costs.
We found that the cost of the business-as-usual pathway of traction will likely grow at an
annual rate of at least 3.8% from INR 4.03/kWh in 2013 to INR 7.93/ kWh by 2030.
5.3 Estimation of optimal power generation capacity
To estimate the wind and solar power generation capacity required to meet a given
demand, we needed to estimate the typical wind and solar generation profiles in the state
of Madhya Pradesh or for states closer to Madhya Pradesh. We have used the following
assumptions:
Generation profile: We have used hourly generation data of Maharashtra and Gujarat
(sourced from their respective load dispatch centers), as the hourly generation data for
Madhya Pradesh (MP) was not available. These states were chosen because of their
proximity to MP and availability of data. We note that there could be some differences in
the profiles between these states and MP. However, IR need not generate all the electricity
it needs in MP in that state itself. It could generate renewable power in states that have
good wind and solar resources and wheel the power to MP.
Electricity demand forecast: Indian Railways has asked us to assume a flat demand load
curve of 200 MWh for the present and assume that the demand will grow at a CAGR of 6%
moving forward based on the assumptions used in the Phase 1 (CPI, 2016) of the study. We
estimated the demand for 2022 and 2030 based on the given annual growth rate.
Cost optimization: Our optimization problem is to meet electricity demand of IR at all times
(during a 24-hour period) using solar and wind power and balancing options with the
condition that IR stays carbon neutral on net energy basis.
Our objective is to minimize the cost of running a 100% decarbonized energy system for
Indian Railways.
𝑀𝑖𝑛𝑖𝑚𝑖𝑧𝑒, 𝑇𝑜𝑡𝑎𝑙 𝑐𝑜𝑠𝑡 = ∑ {∑ 𝐶𝐺𝑗 ∗𝐽
𝑗=1𝑈𝐺𝑗𝑖 + ∑ 𝐶𝐵𝑘 ∗
𝐾
𝑘=1 𝑈𝐵𝑘𝑖}
24
𝑖=1
Where,
i = hours, 1 to 24
j = renewable energy sources, solar and wind
CGj = cost of generation from solar (s) and wind (w)
UGj = units generated from solar (s) and wind (w)
k = balancing options
CBk = cost of electricity per unit for balancing options
UBkj = units consumed from balancing options
𝑈𝐺𝑆𝑖 = (𝐶𝐴𝑃𝑆 ∗ 𝐶𝑈𝐹𝑆𝑖)/1000
𝑈𝐺𝑊𝑖 = (𝐶𝐴𝑃𝑊 ∗ 𝐶𝑈𝐹𝑊𝑖)/1000
Where,
CUFSi = Capacity utilization factor of solar
CUFWi = Capacity utilization factor of wind
CAPS = Installed capacity of solar
CAPW = Installed capacity of wind
CAPS ≥0; CAPW ≥0;
Our objective function is subjected to the following constraints:
Demand constraint: Electricity generation from renewable sources such as solar, wind
power, and the balancing options should meet demand at all times during the day. At
100% decarbonization level, the demand would be met through a combination of
generation from renewable sources and the balancing options. In case of decarbonization
level below 100%, the combination of generation from renewable sources and the
balancing options would meet a percentage of the total demand, the remaining demand
would be met through grid power. The total cost in case of decarbonization level below
100% would be derived from the energy consumed from combination of generation from
renewable sources, the balancing options and grid power (consumed for meeting the
remaining demand).
Eq ….
For every i, ∑ 𝑈𝐺𝑗𝑖 + ∑ 𝑈𝐵𝑘𝑖 + 𝑈𝐺𝑟𝑖 ≥𝐾𝑘=1 𝐽
𝑗=1 𝑈𝐷𝑖
Where,
j = renewable energy sources, Wind and Solar
i = hours, 1,2,3,4,5,……….,24
k = balancing options, 1,2,3
UGri = grid energy, for 100% decarbonisation scenario, UGri = 0
UDi = Electricity demand of Indian Railways; 𝑈𝐷𝑖 ≥ 0;
𝑈𝐺𝑗𝑖 = (𝐶𝐴𝑃𝑗 ∗ 𝐶𝑈𝐹𝑗𝑖)/1000; 𝑈𝐺𝑆𝑖 = (𝐶𝐴𝑃𝑆 ∗ 𝐶𝑈𝐹𝑆𝑖)/1000; 𝑈𝐺𝑊𝑖 = (𝐶𝐴𝑃𝑊 ∗ 𝐶𝑈𝐹𝑊𝑖)/1000
𝑈𝐺𝑗𝑖 ≥ 0; 𝑈𝐵𝑘𝑖 = Units consumed from the balancing options, balancing options
include battery storage, power banking and flexible gas based power plant
The demand constraints in the optimization problem would be as below:
(𝑈𝐺𝑆1 + 𝑈𝐺𝑊1 + 𝑈𝐵𝑆1 + 𝑈𝐵𝑃1 + 𝑈𝐵𝑂1) ≥ 𝑈𝐷1
(𝑈𝐺𝑆2 + 𝑈𝐺𝑊2 + 𝑈𝐵𝑆2 + 𝑈𝐵𝑃2 + 𝑈𝐵𝑂2) ≥ 𝑈𝐷2
(𝑈𝐺𝑆3 + 𝑈𝐺𝑊3 + 𝑈𝐵𝑆3 + 𝑈𝐵𝑃3 + 𝑈𝐵𝑂3) ≥ 𝑈𝐷3
……………………………………………
(𝑈𝐺𝑆24 + 𝑈𝐺𝑊24 + 𝑈𝐵𝑆24 + 𝑈𝐵𝑃24 + 𝑈𝐵𝑂24) ≥ 𝑈𝐷24
Decarbonization constraint:
For the percentage decarbonization level, the total generation from clean energy sources
i.e. solar and wind should be greater than the total non-clean energy sources such as
flexible gas-based balancing options. In the case of balancing with battery storage and
power banking options, we are generating excess clean energy from our wind and solar
sources so that we can charge the battery and the power banking to the level that is
adequate enough to meet the shortfall when there is no wind and solar power generation.
∑ ∑ 𝑈𝐺𝑗𝑖 ≥ 𝐽𝑗=1
24𝑖=1 % 𝐷𝑒𝑐𝑎𝑟𝑏𝑜𝑛𝑖𝑧𝑎𝑡𝑖𝑜𝑛 𝑙𝑒𝑣𝑒𝑙 ∗ (∑ 𝑈𝐷𝑖
24𝑖=1 )
In cases when the percentage decarbonization level is less than 100%, the remaining
demand would be met by the conventional energy drawn from the electricity grid. In our
problem, we are solving the problem for 100% decarbonization level hence, we have not
considered any grid component in our decarbonization constraint equations.
In cases when we are using gas as balancing option, we would need to put up excess solar
and wind power capacity to offset the carbon injected into the system by units consumed
from flexible gas-based power plant. The excess generation of clean energy can be sold
on the power exchanges or any other third party (if allowed).
Eq ….
In cases when gas is used for balancing the demand, the decarbonization equation would
be as below:
∑ ∑ 𝑈𝐺𝑗𝑖 ≥ 𝐽
𝑗=1
24
𝑖=1
% 𝐷𝑒𝑐𝑎𝑟𝑏𝑜𝑛𝑖𝑠𝑎𝑡𝑖𝑜𝑛 𝑙𝑒𝑣𝑒𝑙 ∗ (∑ 𝑈𝐷𝑖) + 24
𝑖=1∑ 𝑈𝐵𝑂𝑖
24
𝑖=1
Here,
UBOi = Units consumed for own flexible gas-based thermal power plant
In cases when power banking is used for balancing the demand, the incoming energy
from the grid would inject carbon into the system and hence, we would need to neutralize
this carbon added by the units consumed from the power banking arrangement. In this
case, the decarbonization equation would be as below:
∑ ∑ 𝑈𝐺𝑗𝑖 ≥ 𝐽
𝑗=1
24
𝑖=1
% 𝐷𝑒𝑐𝑎𝑟𝑏𝑜𝑛𝑖𝑠𝑎𝑡𝑖𝑜𝑛 𝑙𝑒𝑣𝑒𝑙 ∗ (∑ 𝑈𝐷𝑖) + 24
𝑖=1∑ 𝑈𝐵𝑃𝑖
24
𝑖=1
Here,
UBPi = Units consumed from the power banking arrangement
Balancing constraint:
Balancing options will have a limitation on their capacities. For example, a battery will have
a specific storage capacity, a power banking arrangement will have a limit on the
maximum amount of power that can be fed into the grid and drawn from the grid, and a
flexible thermal power plant will also have a limitation the maximum amount of power it
can generate.
For determining the capacity of balancing options - power banking and battery storage,
we have assumed a system where there is only one balancing option available. For
example – for battery storage, the total excess generation should be equal to total deficit.
The total deficit here is the difference between total demand and total generation from
renewable generation sources. Similarly, for a power banking arrangement, the total
excess generation should be equal to total deficit. In an ideal case, the capacity of
balancing should have been determined based on other external constraints such as
availability of investment and contractual arrangements.
Scenario 1: Balancing with Battery Storage
Here, we are considering that only one balancing option is available, that is battery
storage. For balancing the system with battery storage, we denote the units consumed
from battery storage and the capacity of battery storage as below:
∀ 𝑖 ∈ { 1,2,3,4,5, … … … . . ,24} , ∀ 𝑘 ∈ {1, 2, 3}, ∀ 𝑚 ∈ {1,2,3,4,5, … … … , 23}
− 𝐶𝐴𝑃𝐵𝑘 ≤ ∑ 𝑈𝐵𝑘𝑙 ≤ 𝐶𝐴𝑃𝐵𝑘 (𝑖 + 𝑚−1) 𝑀𝑂𝐷24𝑙= 𝑖 , ∑ 𝑈𝐵𝑘𝑙 = 0
(𝑖+23) 𝑀𝑂𝐷24𝑙= 𝑖
𝐶𝐴𝑃𝐵𝑘 = 𝑐𝑎𝑝𝑎𝑐𝑖𝑡𝑦 𝑜𝑓 𝑏𝑎𝑙𝑎𝑛𝑐𝑖𝑛𝑔 𝑜𝑝𝑡𝑖𝑜𝑛
The constraint equations for balancing the demand with battery storage are as below:
− 𝐶𝐴𝑃𝐵𝑆 ≤ ∑ 𝑈𝐵𝑆𝑙 ≤ 𝐶𝐴𝑃𝐵𝑆 (𝑖+ 𝑚−1) 𝑀𝑂𝐷24𝑙=𝑖 , ∑ 𝑈𝐵𝑆𝑙 = 0
(𝑖+23) 𝑀𝑂𝐷24𝑙= 𝑖
𝐶𝐴𝑃𝐵𝑆 = 𝑐𝑎𝑝𝑎𝑐𝑖𝑡𝑦 𝑡𝑜 𝑤ℎ𝑖𝑐ℎ 𝑏𝑎𝑡𝑡𝑒𝑟𝑦 𝑐𝑎𝑛 𝑏𝑒 𝑐ℎ𝑎𝑟𝑔𝑒𝑑 𝑎𝑛𝑑 𝑑𝑖𝑠𝑐ℎ𝑎𝑟𝑔𝑒𝑑
𝑈𝐵𝑆𝑖 = 𝑡ℎ𝑒 𝑢𝑛𝑖𝑡𝑠 𝑐𝑜𝑛𝑠𝑢𝑚𝑒𝑑 𝑓𝑟𝑜𝑚 𝑡ℎ𝑒 𝑏𝑎𝑡𝑡𝑒𝑟𝑦 𝑠𝑦𝑠𝑡𝑒𝑚 𝑓𝑜𝑟 𝑏𝑎𝑙𝑎𝑛𝑐𝑖𝑛𝑔 𝑡ℎ𝑒 𝑑𝑒𝑚𝑎𝑛𝑑

Now,
When there is a shortfall in generation from solar and wind power sources, the net load
(total load – total generation from RE) would be positive as represented below:
For every i , ∑ 𝑈𝐺𝑗𝑖 𝐽𝑗=1 < 𝑈𝐷𝑖
The battery would be discharged for meeting the total demand and balancing the system.
When there is excess generation from the solar and wind power sources, the net load
would be negative as represented below:
For every i, ∑ 𝑈𝐺𝑗𝑖 𝐽𝑗=1 > 𝑈𝐷𝑖
The battery would be charged and the total excess generation in the particular hour would
get stored into the battery system.
Scenario 2: Balancing with Power Banking
For balancing with power banking option, we would use the similar methodology as used
for balancing with battery storage in Scenario 1. The capacity of the power banking
arrangement would be constrained by an external constraint such as the contractual
arrangement on power banking between Indian Railways and other power distribution
companies.
The units required for balancing here would be consumed from power banking
arrangement.
The units consumed from the power banking option and the capacity of power banking
arrangement is described below:
∀ 𝑖 ∈ { 1,2,3,4,5, … … … . . ,24} , ∀ 𝑘 ∈ {1, 2, 3}, ∀ 𝑚 ∈ {1,2,3,4,5, … … … , 23}
− 𝐶𝐴𝑃𝐵𝑘 ≤ ∑ 𝑈𝐵𝑘𝑙 ≤ 𝐶𝐴𝑃𝐵𝑘 (𝑖 + 𝑚−1) 𝑀𝑂𝐷24𝑙= 𝑖 , ∑ 𝑈𝐵𝑘𝑙 = 0
(𝑖+23) 𝑀𝑂𝐷24𝑙= 𝑖
The constraint equations for balancing the demand with battery storage are as below:
− 𝐶𝐴𝑃𝐵𝑃 ≤ ∑ 𝑈𝐵𝑃𝑙 ≤ 𝐶𝐴𝑃𝐵𝑃(𝑖+ 𝑚−1) 𝑀𝑂𝐷24𝑙=𝑖 , ∑ 𝑈𝐵𝑃𝑙 = 0
(𝑖+23) 𝑀𝑂𝐷24𝑙= 𝑖
𝐶𝐴𝑃𝐵𝑃 = 𝑐𝑎𝑝𝑎𝑐𝑖𝑡𝑦 𝑜𝑓 𝑡ℎ𝑒 𝑝𝑜𝑤𝑒𝑟 𝑏𝑎𝑛𝑘𝑖𝑛𝑔 𝑠𝑦𝑠𝑡𝑒𝑚
𝑈𝐵𝑃𝑖 = 𝑡ℎ𝑒 𝑢𝑛𝑖𝑡𝑠 𝑐𝑜𝑛𝑠𝑢𝑚𝑒𝑑 𝑓𝑟𝑜𝑚 𝑡ℎ𝑒 𝑝𝑜𝑤𝑒𝑟 𝑏𝑎𝑛𝑘𝑖𝑛𝑔 𝑓𝑜𝑟 𝑏𝑎𝑙𝑎𝑛𝑐𝑖𝑛𝑔 𝑡ℎ𝑒 𝑑𝑒𝑚𝑎𝑛𝑑
Now,
When there is a shortfall in generation from solar and wind power sources, the net load
(total load – total generation from renewable energy) would be positive as represented
below:
𝐹𝑜𝑟 𝑒𝑣𝑒𝑟𝑦 𝑖, ∑ 𝑈𝐺𝑗𝑖 𝐽
𝑗=1< 𝑈𝐷𝑖

The optimization problem would first consume units from the cheaper balancing option.
The power banking is a cheaper option here.
When there is excess generation from the solar and wind power sources, the net load
would be negative as represented below:
𝐹𝑜𝑟 𝑒𝑣𝑒𝑟𝑦 𝑖, ∑ 𝑈𝐺𝑗𝑖 𝐽
𝑗=1> 𝑈𝐷𝑖
The energy would be stored into power banking arrangement and the total excess
generation in that particular hour would get stored into the power banking system.
Scenario 3: Balancing with flexible gas based generation:
For balancing with flexible gas-based power plant, balancing constraint for flexible gas
would be as follows:
For every i, 0 ≤ = 𝑈𝐵𝑂𝑖 ≤ 𝐶𝐴𝑃𝐵𝑂𝑖
Here,
𝐶𝐴𝑃𝐵𝑂𝑖 = 𝑚𝑎𝑥𝑖𝑚𝑢𝑚 𝑐𝑜𝑛𝑡𝑟𝑎𝑐𝑡𝑒𝑑 𝑐𝑎𝑝𝑎𝑐𝑖𝑡𝑦 𝑤𝑖𝑡ℎ 𝑓𝑙𝑒𝑥𝑖𝑏𝑙𝑒 𝑔𝑎𝑠 𝑏𝑎𝑠𝑒𝑑 𝑝𝑜𝑤𝑒𝑟 𝑝𝑙𝑎𝑛𝑡
𝐶𝐴𝑃𝐵𝑂𝑖 = 𝑇𝑜𝑡𝑎𝑙 𝑏𝑎𝑙𝑎𝑛𝑐𝑖𝑛𝑔 𝑛𝑒𝑒𝑑/𝑃𝐿𝐹𝐵𝑂
𝑃𝐿𝐹𝐵𝑂 = 𝑃𝑙𝑎𝑛𝑡 𝑙𝑜𝑎𝑑 𝑓𝑎𝑐𝑡𝑜𝑟 𝑜𝑓 𝑡ℎ𝑒 𝑓𝑙𝑒𝑥𝑖𝑏𝑙𝑒 𝑔𝑎𝑠 𝑏𝑎𝑠𝑒𝑑 𝑝𝑙𝑎𝑛𝑡
The capacity of the flexible gas based power plant would be derived using the plant load
factor of the gas-based thermal power plant.
Balancing with gas based plant would inject carbon into the system and hence displace
the carbon injected, we need to do excess generation so that the carbon injected into the
system is neutralized and the system remains decarbonized. This excess generation from
renewable sources can be exported to grid. In this case, the balancing with flexible gas
based plant would operate similar to the power banking arrangement.
5.4 Estimation of balancing costs
For estimating the balancing costs, we have used the following methodology:
Power Banking: The balancing costs in this case are the power banking charges plus the
cost incurred in generating the excess units that were stored in the power banking facility.
From our analysis of the load curve, we found that the excess generation is largely coming
from wind power generation and hence, we have used the wind power generation cost
for estimating the costs incurred in generating the excess units stored in power banking
arrangement. This cost has been subtracted from the cost of power generation from wind
to avoid the double counting of the costs.
Gas-based power plant: In the case of balancing with flexible gas based power plant, the
units required for balancing are coming from the gas based plant and hence, we have
used the LCOE of the gas based plant for estimating the balancing costs. We have
assumed that the excess units generated from the renewable energy sources for balancing
the carbon injected into the system, would be sold on the power exchanges. This income
from sale of power has been subtracted from the cost of wind power generation.
Battery: For estimating the balancing costs for battery case, we have used similar
methodology as used for balancing with power banking arrangement as discussed in the
first bullet point above.
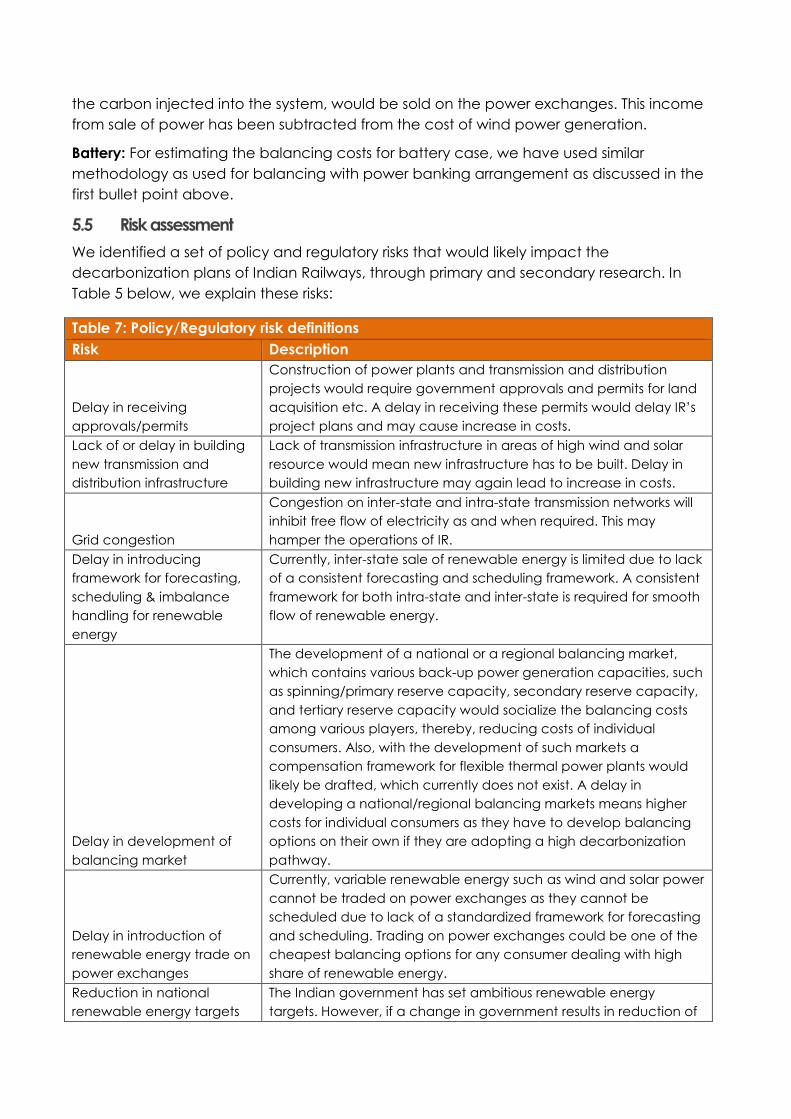
5.5 Risk assessment
We identified a set of policy and regulatory risks that would likely impact the
decarbonization plans of Indian Railways, through primary and secondary research. In
Table 5 below, we explain these risks:
Table 7: Policy/Regulatory risk definitions
Risk Description
Delay in receiving
approvals/permits
Construction of power plants and transmission and distribution
projects would require government approvals and permits for land
acquisition etc. A delay in receiving these permits would delay IR’s
project plans and may cause increase in costs.
Lack of or delay in building
new transmission and
distribution infrastructure
Lack of transmission infrastructure in areas of high wind and solar
resource would mean new infrastructure has to be built. Delay in
building new infrastructure may again lead to increase in costs.
Grid congestion
Congestion on inter-state and intra-state transmission networks will
inhibit free flow of electricity as and when required. This may
hamper the operations of IR.
Delay in introducing
framework for forecasting,
scheduling & imbalance
handling for renewable
energy
Currently, inter-state sale of renewable energy is limited due to lack
of a consistent forecasting and scheduling framework. A consistent
framework for both intra-state and inter-state is required for smooth
flow of renewable energy.
Delay in development of
balancing market
The development of a national or a regional balancing market,
which contains various back-up power generation capacities, such
as spinning/primary reserve capacity, secondary reserve capacity,
and tertiary reserve capacity would socialize the balancing costs
among various players, thereby, reducing costs of individual
consumers. Also, with the development of such markets a
compensation framework for flexible thermal power plants would
likely be drafted, which currently does not exist. A delay in
developing a national/regional balancing markets means higher
costs for individual consumers as they have to develop balancing
options on their own if they are adopting a high decarbonization
pathway.
Delay in introduction of
renewable energy trade on
power exchanges
Currently, variable renewable energy such as wind and solar power
cannot be traded on power exchanges as they cannot be
scheduled due to lack of a standardized framework for forecasting
and scheduling. Trading on power exchanges could be one of the
cheapest balancing options for any consumer dealing with high
share of renewable energy.
Reduction in national
renewable energy targets
The Indian government has set ambitious renewable energy
targets. However, if a change in government results in reduction of

renewable energy targets, then the market development could be
negatively impacted resulting in higher costs of decarbonization.
Hurdles in operationalizing
IR’s status of distribution
licensee
The status of Deemed Transmission and Distribution Licensee of
Indian Railways was clarified by the Central Electricity Regulatory
Commission in November 2015. However, several states are yet to
recognize this status due to their reluctance to let go of a valuable
consumer, such as IR. A Licensee status will give more freedom to IR
to procure power competitively rather than relying on state
DISCOMS for supply of power at tariffs determined by their
respective regulatory commissions. Further, freedom to choose
suppliers also gives the freedom to choose the energy mix for IR.
Lack of availability of power
banking
Banking of power refers to energy exchange between two
interested parties with complementary energy needs. Power
banking could provide a cost-effective balancing option.
Lack of availability of Open
Access
Open Access regulations allow eligible (large/bulk) consumers to
purchase electricity directly from power generating companies or
trading licensees of their choice and correspondingly provides the
freedom to generating companies to sell to any licensee or to any
eligible consumer. However, some states do not encourage Open
Access for the fear of losing their profitable consumers or for lack of
spare transmission capacity. Lack of Open Access in any particular
state will hinder IR’s electricity procurement plans from their supplier
of choice.
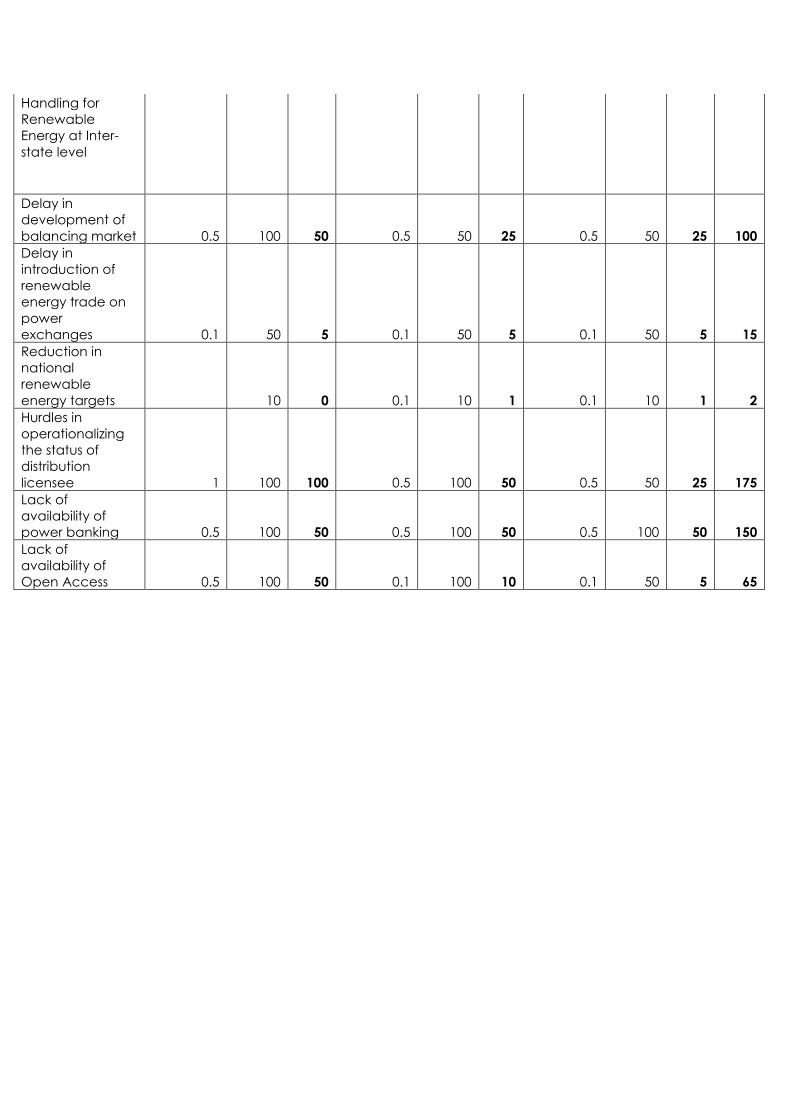
Based on our discussions and responses we received from the stakeholders, we rated the
probability of these risks occurring on the scale of: Negligible: 0.1; Likely: 0.5; Near certainty:
1.0. Likewise, we rated potential impact of these risks on the cost of decarbonization (if they
occur) on a scale of: Negligible: 10; Critical: 50; Catastrophic: 100. The results are presented
in Table below.
Table 8: Probability and expected impact risk scores
Policy risk
REMCL MPNED MPERC
Total
score
Probability Impact Total Probability Impact Total Probability Impact Total
Delay in receiving
approvals/permits 0.5 50 25 0.1 50 5 0.1 50 5 35
Lack of or delay
in building new
transmission and
distribution
infrastructure 0.5 10 5 0.1 50 5 0.1 10 1 11
Grid congestion 0.1 50 5 0.1 100 10 0.1 10 1 16
Delay in
introducing
Framework for
Forecasting,
Scheduling &
Imbalance 50 0 0.5 50 25 1 50 50 75
Handling for
Renewable
Energy at Inter-
state level
Delay in
development of
balancing market 0.5 100 50 0.5 50 25 0.5 50 25 100
Delay in
introduction of
renewable
energy trade on
power
exchanges 0.1 50 5 0.1 50 5 0.1 50 5 15
Reduction in
national
renewable
energy targets 10 0 0.1 10 1 0.1 10 1 2
Hurdles in
operationalizing
the status of
distribution
licensee 1 100 100 0.5 100 50 0.5 50 25 175
Lack of
availability of
power banking 0.5 100 50 0.5 100 50 0.5 100 50 150
Lack of
availability of
Open Access 0.5 100 50 0.1 100 10 0.1 50 5 65
6. References
BNEF, 2016; New Energy outlook 2016; https://www.bloomberg.com/news/articles/2016-06-
13/batteries-storing-power-seen-as-big-as-rooftop-solar-in-12-years
BSES, 2015; Bid document for banking of power by BRPL;
http://www.bsesdelhi.com/docs/pdf/Tender_for_Summer_power_import_under_banking_0
9.06.2015.pdf
CPI, 2016; Decarbonization of Indian Railways; https://climatepolicyinitiative.org/wp-
content/uploads/2016/07/Decarbonization-of-Indian-Railways_Consultation-Draft.pdf
CERC, 2015a; Report of the Committee on Spinning Reserve;
http://www.cercind.gov.in/2015/orders/Annexure-%20SpinningReseves.pdf
CERC, 2015b; Framework on Forecasting, Scheduling, and Imbalance Handling for Variable
Renewable Energy Sources; http://www.cercind.gov.in/2015/regulation/SOR7.pdf
GS, 2015; Equity Research - The Great Battery Race
PIB, 2016; International Conference on Decarbonization of Indian Railways- Mission
Electrification begins tomorrow; http://pib.nic.in/newsite/PrintRelease.aspx?relid=153196
IHS, 2015; Price Declines Expected to Broaden the Energy Storage Market;
http://news.ihsmarkit.com/press-release/technology/price-declines-expected-broaden-
energy-storage-market-ihs-says
Reuters, 2016; Battery energy storage costs seen falling 70 percent by 2030;
http://in.reuters.com/article/energy-storage-idINKCN0UY00V