Embed Size (px)
Citation preview
December 22, 2015
Initiating Coverage
ICICI Securities Ltd | Retail Equity Research
Gearing up for a ‘wonderful’ ride! Wonderla Holidays (WHL) is one of the leading amusement park operators in India. WHL currently operates two established parks: one in Kochi (since 2000) and the other in Bengaluru (since 2005). The company is setting up a new park in Hyderabad (by Apr-16). Further, a park in Chennai (by FY19) is under planning stage. These two new parks are expected to boost WHL’s footfall and revenues. Healthy cash flow from established parks (Kochi and Bengaluru) are expected to fund the capex of new parks (Hyderabad and Chennai), thereby helping the company maintain healthy growth metrics. WHL is expected to be one of the key beneficiaries of favourable demographics and rising discretionary spends. Considering this, we expect the company to report revenue and EBITDA CAGR of 26.2% and 25.9%, respectively, over FY15-18E. We initiate coverage on the stock with a BUY recommendation. Favourable macro environment to help reduce payback period… With a higher disposable income and increase in discretionary spend, WHL has been able to increase its blended realisation at 11% CAGR in FY10-15. Favourable demographics have enabled the company to maintain blended footfall of 7.7% CAGR (vs. 6% CAGR for amusement parks in Asia) in FY10-15. Further, with an in-house technical team and controlled cost structure, WHL has maintained average EBITDA margin of ~44% in FY10-15. Consequently, WHL has been able to reduce its payback period from nine years in Kochi to 7.5 years in Bengaluru. The payback period in Hyderabad is expected to further reduce to 7 years. Hyderabad, Chennai park to aid growth
The new Hyderabad park is expected to be operational by April 2016. The park will be funded through IPO proceeds and internal accruals. With a population of 1.2 crore in Hyderabad and per capita income of | 1,32,862 (one of the highest in south India), this park is expected to witness robust footfalls and healthy realisation over the coming years. Apart from this, the company is also planning to open a new park in Chennai by FY19, which is expected to further drive the company’s footfalls and revenues.
Best in class performance commands premium valuation WHL has consistently maintained an EBITDA margin of 44.0% (highest among Indian and global peers). Further, we believe that a healthy balance sheet (0.03x D/E vs. 1.46x for Adlabs), strong cash flow generation and revenue & EBITDA CAGR of 26.2% and 25.9%, respectively, in FY15-18E demands premium valuations. We have arrived at a DCF based target price of | 460 (representing 18% upside potential). Exhibit 1: Financial summary
(| Crore) FY 14 FY 15 FY 16E FY 17E FY 18ENet Sales 153.6 181.9 220.9 315.4 365.3 EBITDA 70.3 80.6 98.9 135.8 161.0 EBITDA Margin (%) 45.8 44.3 44.8 43.1 44.1 Interest 1.6 1.7 1.7 1.3 0.7 Depreciation 13.2 16.2 16.5 36.9 37.2 Net Profit 39.9 50.6 70.7 77.1 97.3 EPS (|) 9.5 9.2 12.5 13.6 17.2 RoCE (%) 33.9 20.2 24.4 23.1 24.8 RoE (%) 26.6 14.2 16.9 16.0 17.2
Source: Company, ICICIdirect.com Research
Wonderla Holidays (WONHOL)| 390
Rating Matrix
Rating : Buy
Target : | 460
Target Period : 12-18 months
Potential Upside : 18%
YoY Growth (%)
(YoY Growth) FY 15 FY 16E FY 17E FY 18E
Net Sales 18.4 21.4 42.8 15.8
EBITDA 14.5 22.8 37.3 18.6
Net Profit 26.9 39.6 9.1 26.3
EPS* (3.3) 36.1 9.1 26.3
*post IPO Valuation Summary
(x) FY 15 FY 16E FY 17E FY 18E
P/E 42.3 31.1 28.5 22.6
Target P/E 50.1 36.8 33.7 26.7
EV / EBITDA 24.9 21.8 15.4 12.4
P/BV 6.0 5.3 4.6 3.9
RoNW (%) 14.2 16.9 16.0 17.2
RoCE (%) 20.2 24.4 23.1 24.8
Stock Data
Particular Amount
Market Capitalisation | 2198 crore
Debt (FY 15) | 11 crore
Cash & cash equivalents (FY 15) | 203 crore
EV | 2006 crore
52 week H/L 404/242
Equity Capital | 56.5 crore
Face value 10.0
FII Holding (%) 9.1
DII Holding (%) 3.3
Comparative return matrix (%)
Return % 1M 3M 6M 12M
Adlabs entertainment 10.3 2.8 (25.4) NA
Wonderla holidays 0.4 39.2 49.4 33.1
Price movement
0
100
200
300
400
500
Dec-15May-15Sep-14
2,000
4,000
6,000
8,000
10,000
Price (R.H.S) Nifty (L.H.S)
Research Analysts
Rashesh Shah [email protected]
Devang Bhatt [email protected]
Page 2 ICICI Securities Ltd | Retail Equity Research
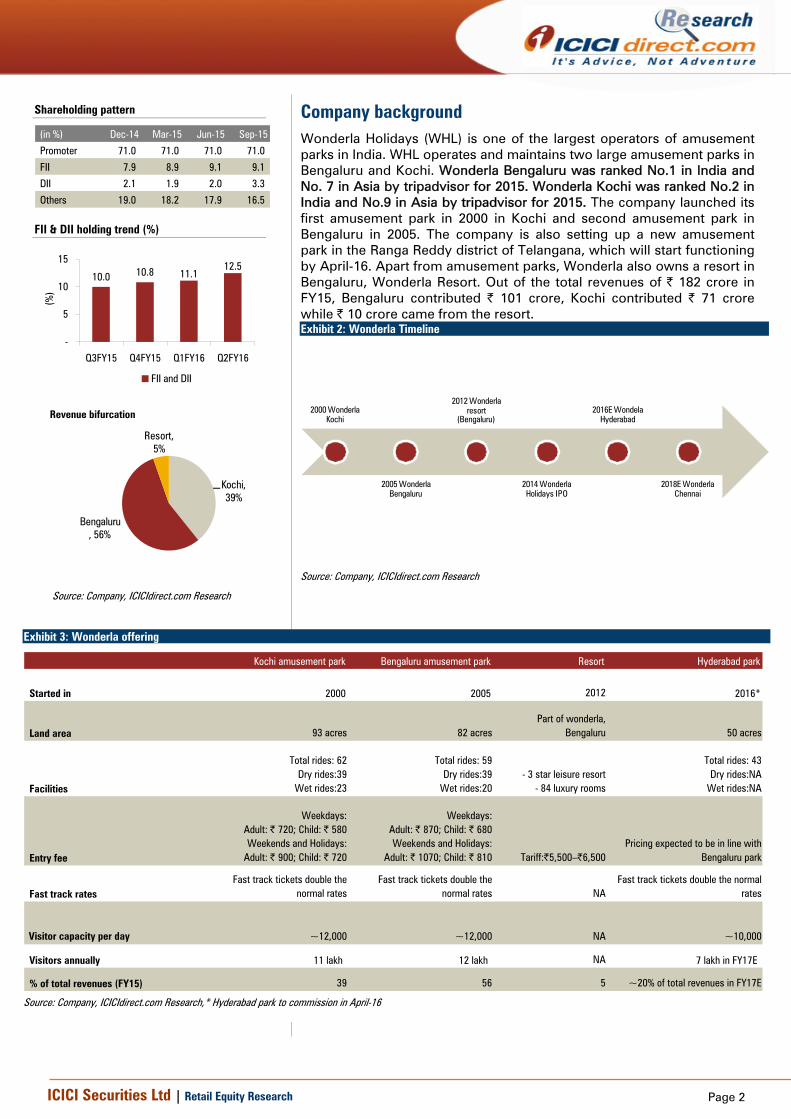
Company background Wonderla Holidays (WHL) is one of the largest operators of amusement parks in India. WHL operates and maintains two large amusement parks in Bengaluru and Kochi. Wonderla Bengaluru was ranked No.1 in India and No. 7 in Asia by tripadvisor for 2015. Wonderla Kochi was ranked No.2 in India and No.9 in Asia by tripadvisor for 2015. The company launched its first amusement park in 2000 in Kochi and second amusement park in Bengaluru in 2005. The company is also setting up a new amusement park in the Ranga Reddy district of Telangana, which will start functioning by April-16. Apart from amusement parks, Wonderla also owns a resort in Bengaluru, Wonderla Resort. Out of the total revenues of | 182 crore in FY15, Bengaluru contributed | 101 crore, Kochi contributed | 71 crore while | 10 crore came from the resort. Exhibit 2: Wonderla Timeline
2000 Wonderla Kochi
2005 Wonderla Bengaluru
2012 Wonderla resort
(Bengaluru)
2014 Wonderla Holidays IPO
2016E Wondela Hyderabad
2018E Wonderla Chennai
Source: Company, ICICIdirect.com Research
Exhibit 3: Wonderla offering
Kochi amusement park Bengaluru amusement park Resort Hyderabad park
Started in 2000 2005 2012 2016*
Land area 93 acres 82 acresPart of wonderla,
Bengaluru 50 acres
Facilities
Total rides: 62 Dry rides:39
Wet rides:23
Total rides: 59 Dry rides:39
Wet rides:20- 3 star leisure resort
- 84 luxury rooms
Total rides: 43 Dry rides:NA
Wet rides:NA
Entry fee
Weekdays: Adult: | 720; Child: | 580Weekends and Holidays:
Adult: | 900; Child: | 720
Weekdays: Adult: | 870; Child: | 680Weekends and Holidays:
Adult: | 1070; Child: | 810 Tariff:|5,500–|6,500Pricing expected to be in line with
Bengaluru park
Fast track rates Fast track tickets double the
normal rates Fast track tickets double the
normal rates NA Fast track tickets double the normal
rates
Visitor capacity per day ~12,000 ~12,000 NA ~10,000
Visitors annually 11 lakh 12 lakh NA 7 lakh in FY17E
% of total revenues (FY15) 39 56 5 ~20% of total revenues in FY17E
Source: Company, ICICIdirect.com Research,* Hyderabad park to commission in April-16
Revenue bifurcation
Kochi, 39%
Bengaluru, 56%
Resort, 5%
Source: Company, ICICIdirect.com Research
Shareholding pattern
(in %) Dec-14 Mar-15 Jun-15 Sep-15
Promoter 71.0 71.0 71.0 71.0
FII 7.9 8.9 9.1 9.1
DII 2.1 1.9 2.0 3.3
Others 19.0 18.2 17.9 16.5
FII & DII holding trend (%)
10.0 10.8 11.112.5
-
5
10
15
Q3FY15 Q4FY15 Q1FY16 Q2FY16
(%)
FII and DII
Page 3ICICI Securities Ltd | Retail Equity Research
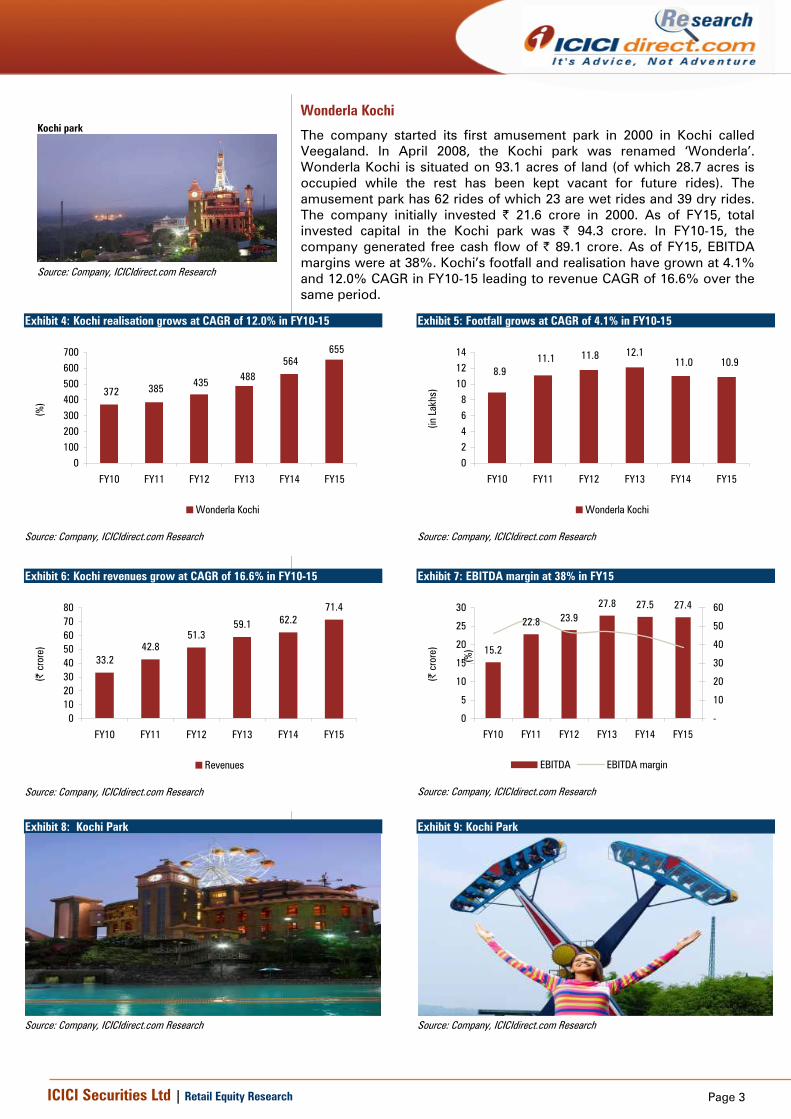
Wonderla Kochi
The company started its first amusement park in 2000 in Kochi called Veegaland. In April 2008, the Kochi park was renamed ‘Wonderla’. Wonderla Kochi is situated on 93.1 acres of land (of which 28.7 acres is occupied while the rest has been kept vacant for future rides). The amusement park has 62 rides of which 23 are wet rides and 39 dry rides. The company initially invested | 21.6 crore in 2000. As of FY15, total invested capital in the Kochi park was | 94.3 crore. In FY10-15, the company generated free cash flow of | 89.1 crore. As of FY15, EBITDA margins were at 38%. Kochi’s footfall and realisation have grown at 4.1% and 12.0% CAGR in FY10-15 leading to revenue CAGR of 16.6% over the same period.
Exhibit 4: Kochi realisation grows at CAGR of 12.0% in FY10-15
372 385 435 488564
655
0100200300400500600700
FY10 FY11 FY12 FY13 FY14 FY15
(%)
Wonderla Kochi
Source: Company, ICICIdirect.com Research
Exhibit 5: Footfall grows at CAGR of 4.1% in FY10-15
8.911.1 11.8 12.1
11.0 10.9
02468
101214
FY10 FY11 FY12 FY13 FY14 FY15
(in L
akhs
)
Wonderla Kochi
Source: Company, ICICIdirect.com Research
Exhibit 6: Kochi revenues grow at CAGR of 16.6% in FY10-15
33.242.8
51.359.1 62.2
71.4
01020304050607080
FY10 FY11 FY12 FY13 FY14 FY15
(| c
rore
)
Revenues
Source: Company, ICICIdirect.com Research
Exhibit 7: EBITDA margin at 38% in FY15
15.2
22.8 23.927.8 27.5 27.4
0
5
10
15
20
25
30
FY10 FY11 FY12 FY13 FY14 FY15
(| c
rore
)
-
10
20
30
40
50
60
(%)
EBITDA EBITDA margin
Source: Company, ICICIdirect.com Research
Exhibit 8: Kochi Park
Source: Company, ICICIdirect.com Research
Exhibit 9: Kochi Park
Source: Company, ICICIdirect.com Research
Kochi park
Source: Company, ICICIdirect.com Research
Page 4ICICI Securities Ltd | Retail Equity Research
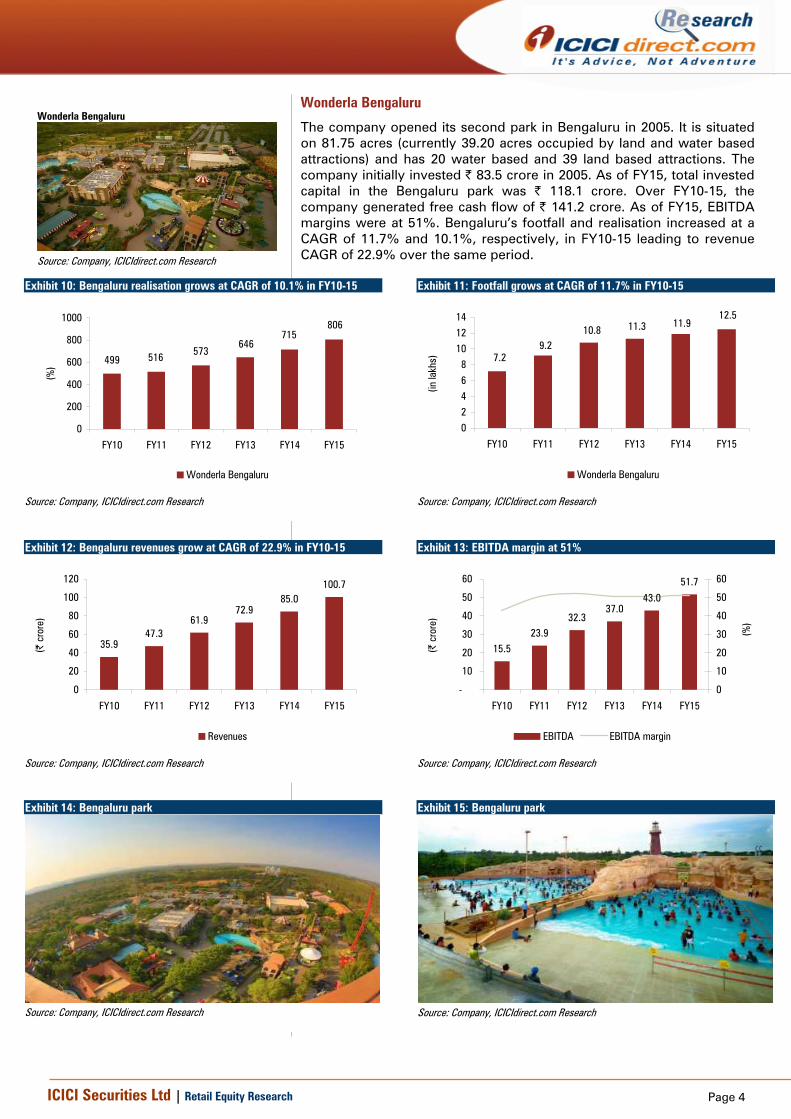
Wonderla Bengaluru
The company opened its second park in Bengaluru in 2005. It is situated on 81.75 acres (currently 39.20 acres occupied by land and water based attractions) and has 20 water based and 39 land based attractions. The company initially invested | 83.5 crore in 2005. As of FY15, total invested capital in the Bengaluru park was | 118.1 crore. Over FY10-15, the company generated free cash flow of | 141.2 crore. As of FY15, EBITDA margins were at 51%. Bengaluru’s footfall and realisation increased at a CAGR of 11.7% and 10.1%, respectively, in FY10-15 leading to revenue CAGR of 22.9% over the same period.
Exhibit 10: Bengaluru realisation grows at CAGR of 10.1% in FY10-15
806715
646573516499
0
200
400
600
800
1000
FY10 FY11 FY12 FY13 FY14 FY15
(%)
Wonderla Bengaluru
Source: Company, ICICIdirect.com Research
Exhibit 11: Footfall grows at CAGR of 11.7% in FY10-15
7.29.2
10.8 11.3 11.912.5
02468
101214
FY10 FY11 FY12 FY13 FY14 FY15(in
lakh
s)
Wonderla Bengaluru
Source: Company, ICICIdirect.com Research
Exhibit 12: Bengaluru revenues grow at CAGR of 22.9% in FY10-15
35.947.3
61.972.9
85.0100.7
0
20
40
60
80
100
120
FY10 FY11 FY12 FY13 FY14 FY15
(| c
rore
)
Revenues
Source: Company, ICICIdirect.com Research
Exhibit 13: EBITDA margin at 51%
15.523.9
32.337.0
43.0
51.7
-
10
20
30
40
50
60
FY10 FY11 FY12 FY13 FY14 FY15
(| c
rore
)
0
10
20
30
40
50
60
(%)
EBITDA EBITDA margin
Source: Company, ICICIdirect.com Research
Exhibit 14: Bengaluru park
Source: Company, ICICIdirect.com Research
Exhibit 15: Bengaluru park
Source: Company, ICICIdirect.com Research
Wonderla Bengaluru
Source: Company, ICICIdirect.com Research

Page 5ICICI Securities Ltd | Retail Equity Research
Wonderla Resort, Bengaluru
Apart from amusement parks, the company owns a three star resort in Bengaluru. The resort was launched in March 2012 and is situated near the Bengaluru amusement park. The resort has 84 rooms, multi-cuisine restaurant, a rest-o-bar, solar heated swimming pool, recreation area, gym, banquet halls, conference rooms and board room. It is spread over 8,900 sq ft with a capacity of 800 guests. The average occupancy ratio has increased from 29.3% in FY14 to 42.3% in FY15, while ARR has increased from | 7,275 in FY14 to | 7,705 in FY15. Revenues in FY15 were at | 10 crore while the EBITDA margin was at 20.3% in FY15.
Exhibit 16: Resort revenue trend
5.86.4
9.8
0.0
2.0
4.0
6.0
8.0
10.0
12.0
FY13 FY14 FY15
(| c
rore
)
Wonderla Resort revenues
Source: Company, ICICIdirect.com Research
Wonderla Hyderabad
Wonderla is in the process of setting up a third park in Hyderabad. The company has acquired 49.5 acres of land. WHL will invest ~| 250 crore to construct the Hyderabad park. The company will invest ~| 100 crore in land and the remaining on rides, machinery, furnishing, pre-operating expenses and consulting fees. The funding of the park will be done through IPO proceeds and internal accruals. The company has received all necessary approvals for setting up an amusement park. The park is expected to be operational by April 2016. WHL will use only 27 acres to set up the proposed amusement park comprising 43 rides (wet rides + dry rides).
Exhibit 17: Construction of waves restaurant
Source: Company, ICICIdirect.com Research
Exhibit 18: Construction of roller coaster
Source: Company, ICICIdirect.com Research
Wonderla Bengaluru resort
Source: Company, ICICIdirect.com Research
Wonderla Bengaluru resort Particulars FY13 FY14 FY15
Room days available 29,912 30,178 29,889
Occupancy ratio 33 29 42
Room days occupied 9,730 8,849 12,654
ARR 6,001 7,257 7,705 Source: Company, ICICIdirect.com Research
Hyderabad park
Source: Company, ICICIdirect.com Research
Page 6ICICI Securities Ltd | Retail Equity Research
Business model of theme parks
The business of theme parks generally requires heavy capital expenditure during construction while limited maintenance expenditure is needed during operation. Because of a high portion of fixed expense, theme parks often incur losses in the first few years of operation when traffic volume is yet to mature. After a theme park achieves breakeven, stable growth in traffic volumes contributes to faster margin improvement and strong earnings growth, helped by operating leverage. The duration of loss depends on investment on the park, its location, product positioning as well as local consumer perception. Footfalls in the amusement park are dependent on demographics, discretionary spending, rides & park attractions, location & accessibility, seasonality and holidays. In India, footfalls in amusement parks are affected by seasonality. Generally, Q1 and Q3 are the best quarters. Footfalls in Q1 are high due to summer vacations, in Q2 are they are low due to monsoons, in Q3 are they high due to festive season & school picnics while footfalls in Q4 are low due to the examination season.
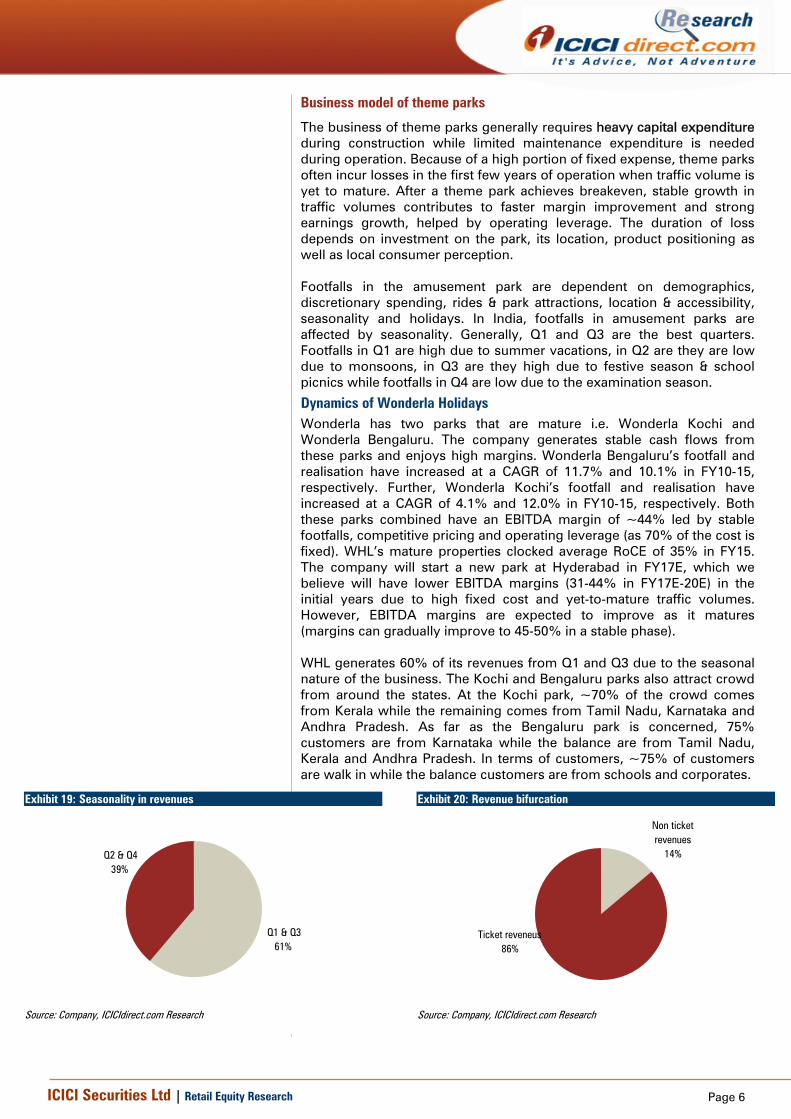
Dynamics of Wonderla Holidays Wonderla has two parks that are mature i.e. Wonderla Kochi and Wonderla Bengaluru. The company generates stable cash flows from these parks and enjoys high margins. Wonderla Bengaluru’s footfall and realisation have increased at a CAGR of 11.7% and 10.1% in FY10-15, respectively. Further, Wonderla Kochi’s footfall and realisation have increased at a CAGR of 4.1% and 12.0% in FY10-15, respectively. Both these parks combined have an EBITDA margin of ~44% led by stable footfalls, competitive pricing and operating leverage (as 70% of the cost is fixed). WHL’s mature properties clocked average RoCE of 35% in FY15. The company will start a new park at Hyderabad in FY17E, which we believe will have lower EBITDA margins (31-44% in FY17E-20E) in the initial years due to high fixed cost and yet-to-mature traffic volumes. However, EBITDA margins are expected to improve as it matures (margins can gradually improve to 45-50% in a stable phase). WHL generates 60% of its revenues from Q1 and Q3 due to the seasonal nature of the business. The Kochi and Bengaluru parks also attract crowd from around the states. At the Kochi park, ~70% of the crowd comes from Kerala while the remaining comes from Tamil Nadu, Karnataka and Andhra Pradesh. As far as the Bengaluru park is concerned, 75% customers are from Karnataka while the balance are from Tamil Nadu, Kerala and Andhra Pradesh. In terms of customers, ~75% of customers are walk in while the balance customers are from schools and corporates.
Exhibit 19: Seasonality in revenues
Q2 & Q439%
Q1 & Q361%
Source: Company, ICICIdirect.com Research
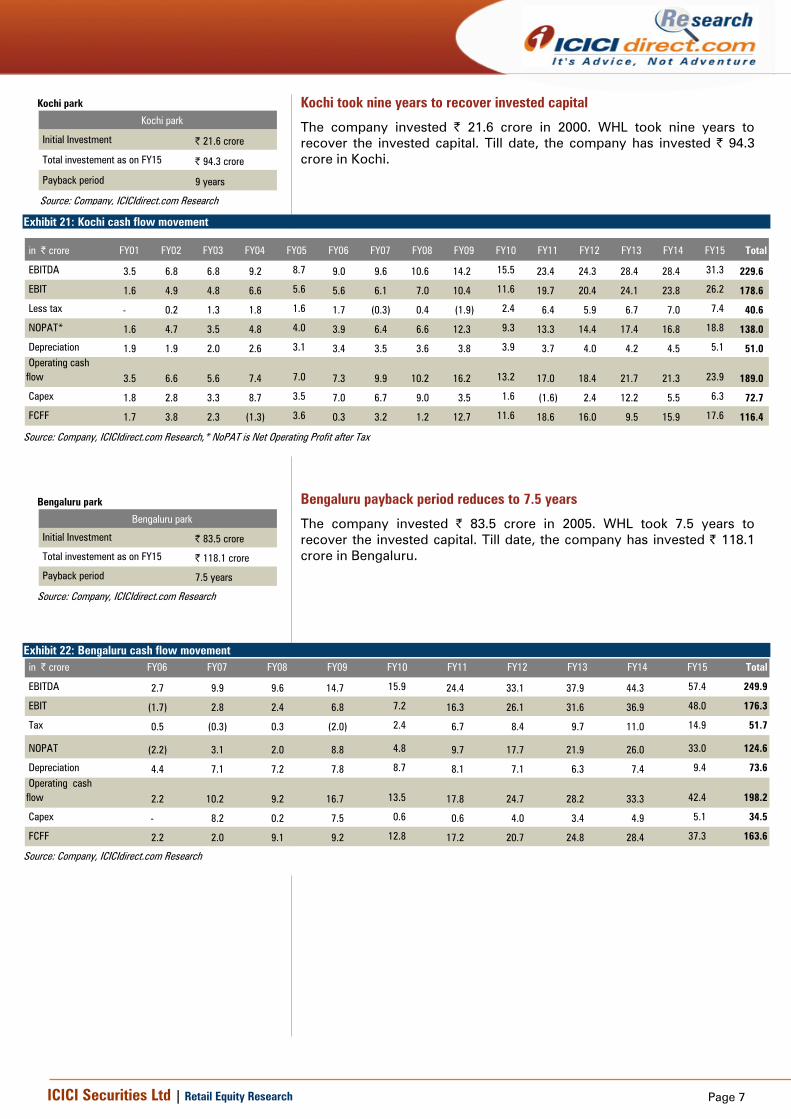
Exhibit 20: Revenue bifurcation
Non ticket revenues
14%
Ticket reveneus86%
Source: Company, ICICIdirect.com Research
Page 7ICICI Securities Ltd | Retail Equity Research
Kochi took nine years to recover invested capital
The company invested | 21.6 crore in 2000. WHL took nine years to recover the invested capital. Till date, the company has invested | 94.3 crore in Kochi.
Exhibit 21: Kochi cash flow movement
in | crore FY01 FY02 FY03 FY04 FY05 FY06 FY07 FY08 FY09 FY10 FY11 FY12 FY13 FY14 FY15 Total
EBITDA 3.5 6.8 6.8 9.2 8.7 9.0 9.6 10.6 14.2 15.5 23.4 24.3 28.4 28.4 31.3 229.6
EBIT 1.6 4.9 4.8 6.6 5.6 5.6 6.1 7.0 10.4 11.6 19.7 20.4 24.1 23.8 26.2 178.6
Less tax - 0.2 1.3 1.8 1.6 1.7 (0.3) 0.4 (1.9) 2.4 6.4 5.9 6.7 7.0 7.4 40.6
NOPAT* 1.6 4.7 3.5 4.8 4.0 3.9 6.4 6.6 12.3 9.3 13.3 14.4 17.4 16.8 18.8 138.0
Depreciation 1.9 1.9 2.0 2.6 3.1 3.4 3.5 3.6 3.8 3.9 3.7 4.0 4.2 4.5 5.1 51.0 Operating cash flow 3.5 6.6 5.6 7.4 7.0 7.3 9.9 10.2 16.2 13.2 17.0 18.4 21.7 21.3 23.9 189.0
Capex 1.8 2.8 3.3 8.7 3.5 7.0 6.7 9.0 3.5 1.6 (1.6) 2.4 12.2 5.5 6.3 72.7
FCFF 1.7 3.8 2.3 (1.3) 3.6 0.3 3.2 1.2 12.7 11.6 18.6 16.0 9.5 15.9 17.6 116.4
Source: Company, ICICIdirect.com Research,* NoPAT is Net Operating Profit after Tax
Bengaluru payback period reduces to 7.5 years
The company invested | 83.5 crore in 2005. WHL took 7.5 years to recover the invested capital. Till date, the company has invested | 118.1 crore in Bengaluru.
Exhibit 22: Bengaluru cash flow movement in | crore FY06 FY07 FY08 FY09 FY10 FY11 FY12 FY13 FY14 FY15 Total
EBITDA 2.7 9.9 9.6 14.7 15.9 24.4 33.1 37.9 44.3 57.4 249.9
EBIT (1.7) 2.8 2.4 6.8 7.2 16.3 26.1 31.6 36.9 48.0 176.3
Tax 0.5 (0.3) 0.3 (2.0) 2.4 6.7 8.4 9.7 11.0 14.9 51.7
NOPAT (2.2) 3.1 2.0 8.8 4.8 9.7 17.7 21.9 26.0 33.0 124.6
Depreciation 4.4 7.1 7.2 7.8 8.7 8.1 7.1 6.3 7.4 9.4 73.6 Operating cash flow 2.2 10.2 9.2 16.7 13.5 17.8 24.7 28.2 33.3 42.4 198.2
Capex - 8.2 0.2 7.5 0.6 0.6 4.0 3.4 4.9 5.1 34.5
FCFF 2.2 2.0 9.1 9.2 12.8 17.2 20.7 24.8 28.4 37.3 163.6
Source: Company, ICICIdirect.com Research
Kochi park
Initial Investment | 21.6 crore
Total investement as on FY15 | 94.3 crore
Payback period 9 years
Kochi park
Source: Company, ICICIdirect.com Research
Bengaluru park
Initial Investment | 83.5 crore
Total investement as on FY15 | 118.1 crore
Payback period 7.5 years
Bengaluru park
Source: Company, ICICIdirect.com Research
Page 8ICICI Securities Ltd | Retail Equity Research
Investment Rationale Indian amusement parks at nascent growth stage…
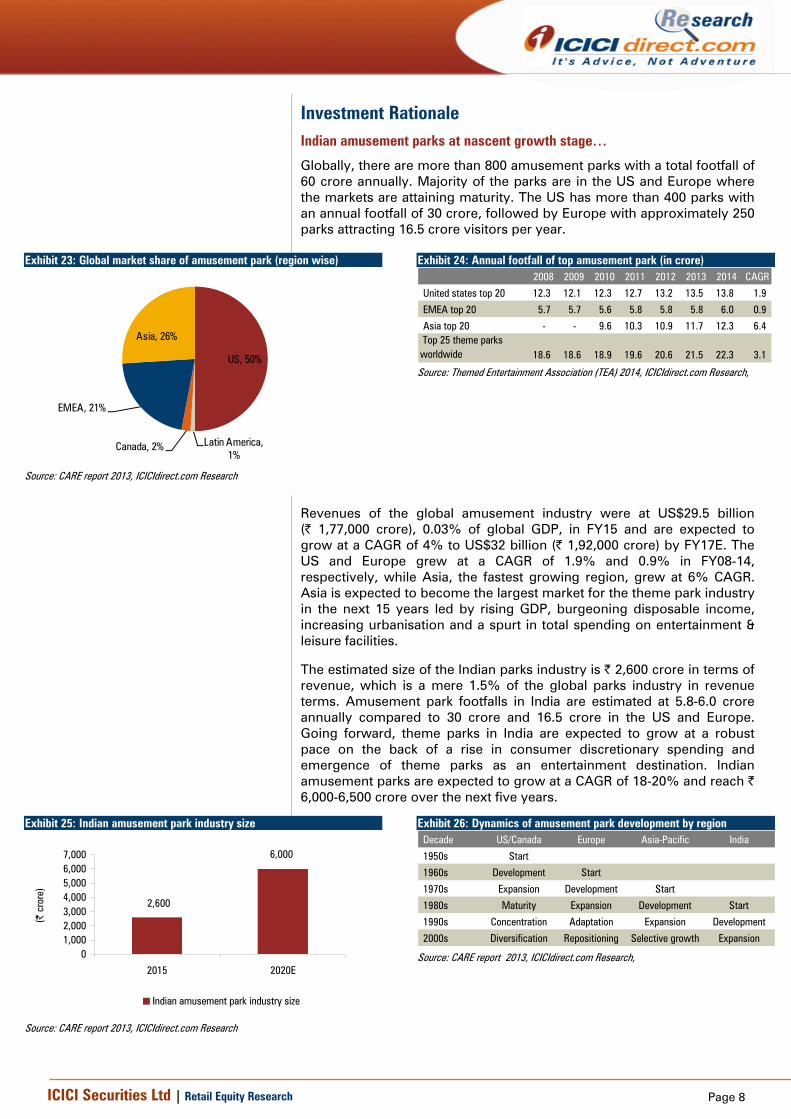
Globally, there are more than 800 amusement parks with a total footfall of 60 crore annually. Majority of the parks are in the US and Europe where the markets are attaining maturity. The US has more than 400 parks with an annual footfall of 30 crore, followed by Europe with approximately 250 parks attracting 16.5 crore visitors per year.
Exhibit 23: Global market share of amusement park (region wise)
US, 50%
Latin America, 1%
Canada, 2%
EMEA, 21%
Asia, 26%
Source: CARE report 2013, ICICIdirect.com Research
Exhibit 24: Annual footfall of top amusement park (in crore) 2008 2009 2010 2011 2012 2013 2014 CAGR
United states top 20 12.3 12.1 12.3 12.7 13.2 13.5 13.8 1.9
EMEA top 20 5.7 5.7 5.6 5.8 5.8 5.8 6.0 0.9
Asia top 20 - - 9.6 10.3 10.9 11.7 12.3 6.4 Top 25 theme parks worldwide 18.6 18.6 18.9 19.6 20.6 21.5 22.3 3.1
Source: Themed Entertainment Association (TEA) 2014, ICICIdirect.com Research,
Revenues of the global amusement industry were at US$29.5 billion (| 1,77,000 crore), 0.03% of global GDP, in FY15 and are expected to grow at a CAGR of 4% to US$32 billion (| 1,92,000 crore) by FY17E. The US and Europe grew at a CAGR of 1.9% and 0.9% in FY08-14, respectively, while Asia, the fastest growing region, grew at 6% CAGR. Asia is expected to become the largest market for the theme park industry in the next 15 years led by rising GDP, burgeoning disposable income, increasing urbanisation and a spurt in total spending on entertainment & leisure facilities.
The estimated size of the Indian parks industry is | 2,600 crore in terms of revenue, which is a mere 1.5% of the global parks industry in revenue terms. Amusement park footfalls in India are estimated at 5.8-6.0 crore annually compared to 30 crore and 16.5 crore in the US and Europe. Going forward, theme parks in India are expected to grow at a robust pace on the back of a rise in consumer discretionary spending and emergence of theme parks as an entertainment destination. Indian amusement parks are expected to grow at a CAGR of 18-20% and reach | 6,000-6,500 crore over the next five years.
Exhibit 25: Indian amusement park industry size
2,600
6,000
01,0002,0003,0004,0005,0006,0007,000
2015 2020E
(| c
rore
)
Indian amusement park industry size
Source: CARE report 2013, ICICIdirect.com Research
Exhibit 26: Dynamics of amusement park development by region Decade US/Canada Europe Asia-Pacific India
1950s Start
1960s Development Start
1970s Expansion Development Start
1980s Maturity Expansion Development Start
1990s Concentration Adaptation Expansion Development
2000s Diversification Repositioning Selective growth Expansion
Source: CARE report 2013, ICICIdirect.com Research,
Page 9ICICI Securities Ltd | Retail Equity Research
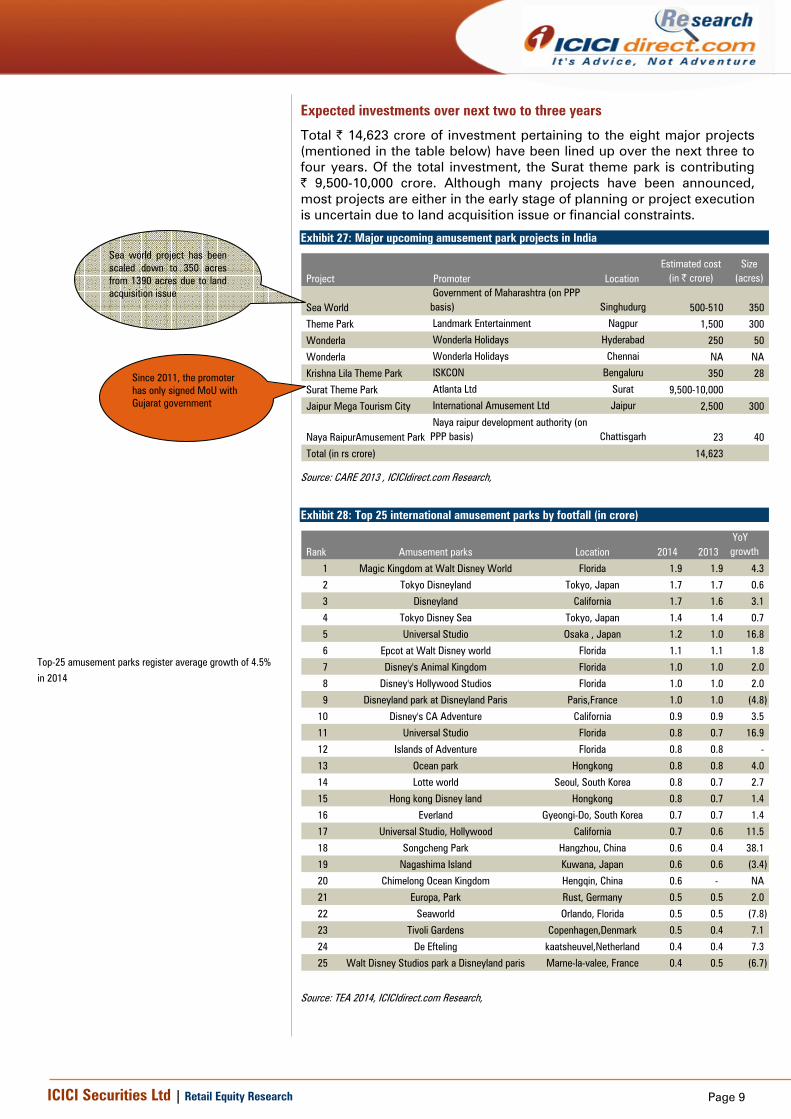
Expected investments over next two to three years
Total | 14,623 crore of investment pertaining to the eight major projects (mentioned in the table below) have been lined up over the next three to four years. Of the total investment, the Surat theme park is contributing | 9,500-10,000 crore. Although many projects have been announced, most projects are either in the early stage of planning or project execution is uncertain due to land acquisition issue or financial constraints.
Exhibit 27: Major upcoming amusement park projects in India
Project Promoter LocationEstimated cost
(in | crore)Size
(acres)
Sea WorldGovernment of Maharashtra (on PPP basis) Singhudurg 500-510 350
Theme Park Landmark Entertainment Nagpur 1,500 300
Wonderla Wonderla Holidays Hyderabad 250 50
Wonderla Wonderla Holidays Chennai NA NA
Krishna Lila Theme Park ISKCON Bengaluru 350 28
Surat Theme Park Atlanta Ltd Surat 9,500-10,000
Jaipur Mega Tourism City International Amusement Ltd Jaipur 2,500 300
Naya RaipurAmusement ParkNaya raipur development authority (on PPP basis) Chattisgarh 23 40
Total (in rs crore) 14,623
Source: CARE 2013 , ICICIdirect.com Research,
Exhibit 28: Top 25 international amusement parks by footfall (in crore)
Rank Amusement parks Location 2014 2013YoY growth
1 Magic Kingdom at Walt Disney World Florida 1.9 1.9 4.3
2 Tokyo Disneyland Tokyo, Japan 1.7 1.7 0.6
3 Disneyland California 1.7 1.6 3.1
4 Tokyo Disney Sea Tokyo, Japan 1.4 1.4 0.7
5 Universal Studio Osaka , Japan 1.2 1.0 16.8
6 Epcot at Walt Disney world Florida 1.1 1.1 1.8
7 Disney's Animal Kingdom Florida 1.0 1.0 2.0
8 Disney's Hollywood Studios Florida 1.0 1.0 2.0
9 Disneyland park at Disneyland Paris Paris,France 1.0 1.0 (4.8)
10 Disney's CA Adventure California 0.9 0.9 3.5
11 Universal Studio Florida 0.8 0.7 16.9
12 Islands of Adventure Florida 0.8 0.8 -
13 Ocean park Hongkong 0.8 0.8 4.0
14 Lotte world Seoul, South Korea 0.8 0.7 2.7
15 Hong kong Disney land Hongkong 0.8 0.7 1.4
16 Everland Gyeongi-Do, South Korea 0.7 0.7 1.4
17 Universal Studio, Hollywood California 0.7 0.6 11.5
18 Songcheng Park Hangzhou, China 0.6 0.4 38.1
19 Nagashima Island Kuwana, Japan 0.6 0.6 (3.4)
20 Chimelong Ocean Kingdom Hengqin, China 0.6 - NA
21 Europa, Park Rust, Germany 0.5 0.5 2.0
22 Seaworld Orlando, Florida 0.5 0.5 (7.8)
23 Tivoli Gardens Copenhagen,Denmark 0.5 0.4 7.1
24 De Efteling kaatsheuvel,Netherland 0.4 0.4 7.3
25 Walt Disney Studios park a Disneyland paris Marne-la-valee, France 0.4 0.5 (6.7)
Source: TEA 2014, ICICIdirect.com Research,
Top-25 amusement parks register average growth of 4.5%
in 2014
Sea world project has been scaled down to 350 acres from 1390 acres due to land acquisition issue
Since 2011, the promoter has only signed MoU with Gujarat government
Page 10ICICI Securities Ltd | Retail Equity Research
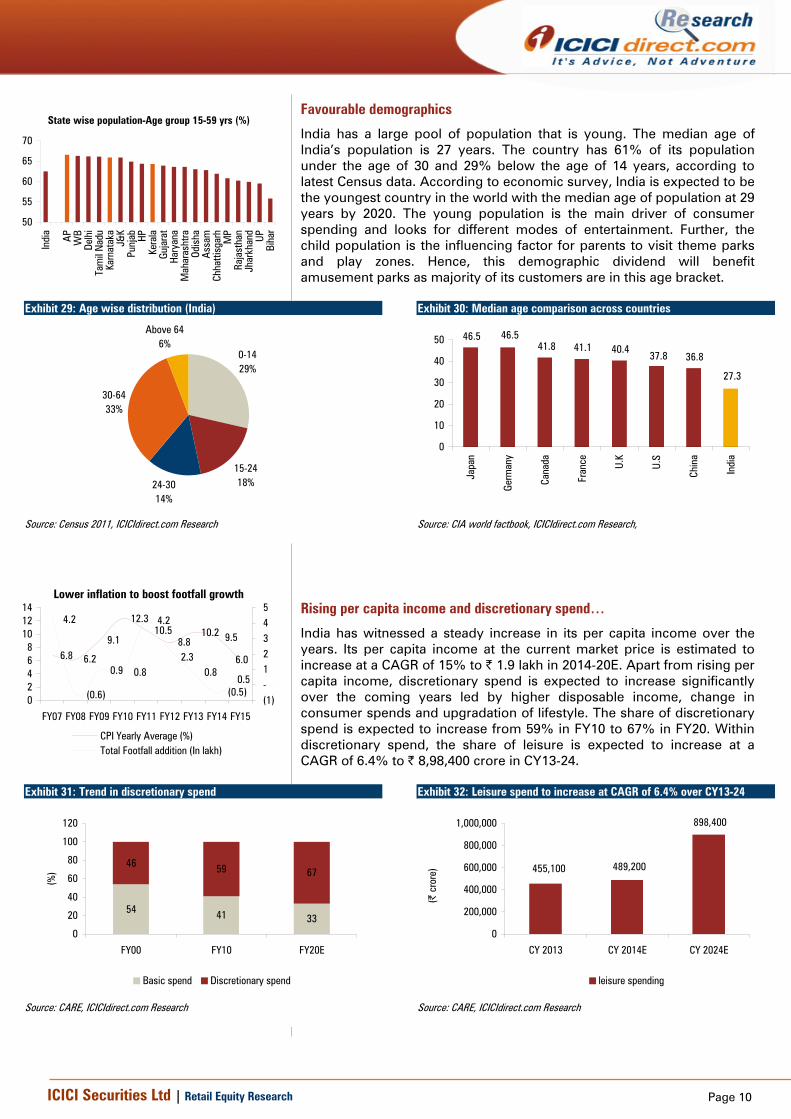
Favourable demographics
India has a large pool of population that is young. The median age of India’s population is 27 years. The country has 61% of its population under the age of 30 and 29% below the age of 14 years, according to latest Census data. According to economic survey, India is expected to be the youngest country in the world with the median age of population at 29 years by 2020. The young population is the main driver of consumer spending and looks for different modes of entertainment. Further, the child population is the influencing factor for parents to visit theme parks and play zones. Hence, this demographic dividend will benefit amusement parks as majority of its customers are in this age bracket.
Exhibit 29: Age wise distribution (India)
0-1429%
15-2418%24-30
14%
30-6433%
Above 646%
Source: Census 2011, ICICIdirect.com Research
Exhibit 30: Median age comparison across countries
46.5 46.541.8 41.1 40.4
37.8 36.8
27.3
0
10
20
30
40
50
Japa
n
Germ
any
Cana
da
Fran
ce U.K
U.S
Chin
a
Indi
a
Source: CIA world factbook, ICICIdirect.com Research,
Rising per capita income and discretionary spend…
India has witnessed a steady increase in its per capita income over the years. Its per capita income at the current market price is estimated to increase at a CAGR of 15% to | 1.9 lakh in 2014-20E. Apart from rising per capita income, discretionary spend is expected to increase significantly over the coming years led by higher disposable income, change in consumer spends and upgradation of lifestyle. The share of discretionary spend is expected to increase from 59% in FY10 to 67% in FY20. Within discretionary spend, the share of leisure is expected to increase at a CAGR of 6.4% to | 8,98,400 crore in CY13-24.
Exhibit 31: Trend in discretionary spend
54 41 33
46 59 67
0
20
40
60
80
100
120
FY00 FY10 FY20E
(%)
Basic spend Discretionary spend
Source: CARE, ICICIdirect.com Research
Exhibit 32: Leisure spend to increase at CAGR of 6.4% over CY13-24
455,100 489,200
898,400
0
200,000
400,000
600,000
800,000
1,000,000
CY 2013 CY 2014E CY 2024E
(| c
rore
)
leisure spending
Source: CARE, ICICIdirect.com Research
State wise population-Age group 15-59 yrs (%)
50
55
60
65
70
Indi
a
AP WB
Delh
iTa
mil
Nad
uKa
rnat
aka
J&K
Punj
ab HPKe
rala
Guja
rat
Hary
ana
Mah
aras
htra
Odis
haAs
sam
Chha
ttisg
arh
MP
Raja
stha
nJh
arkh
and
UPBi
har
Lower inflation to boost footfall growth
6.8 6.2
9.1
12.310.5
8.810.2 9.5
6.0
4.2
(0.6)
0.9 0.8
4.2
0.8
(0.5)0.5
2.3
02468
101214
FY07 FY08 FY09 FY10 FY11 FY12 FY13 FY14 FY15
(1)-12345
CPI Yearly Average (%)Total Footfall addition (In lakh)
Page 11ICICI Securities Ltd | Retail Equity Research
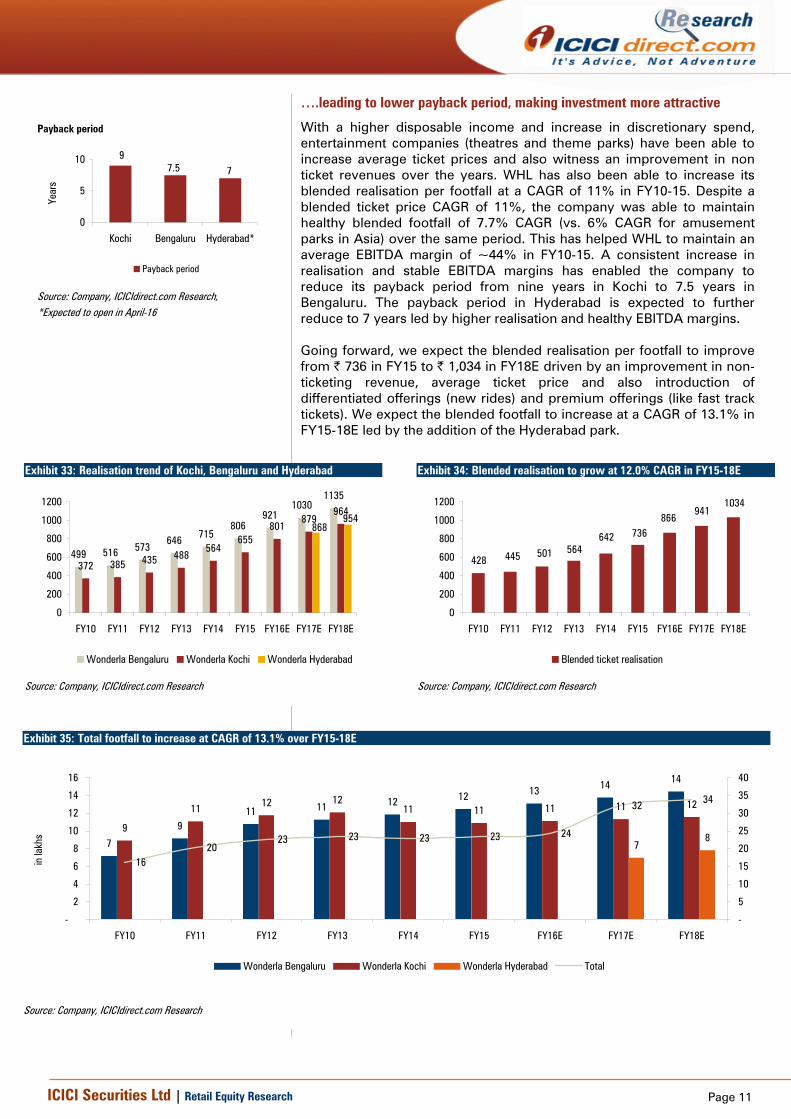
….leading to lower payback period, making investment more attractive
With a higher disposable income and increase in discretionary spend, entertainment companies (theatres and theme parks) have been able to increase average ticket prices and also witness an improvement in non ticket revenues over the years. WHL has also been able to increase its blended realisation per footfall at a CAGR of 11% in FY10-15. Despite a blended ticket price CAGR of 11%, the company was able to maintain healthy blended footfall of 7.7% CAGR (vs. 6% CAGR for amusement parks in Asia) over the same period. This has helped WHL to maintain an average EBITDA margin of ~44% in FY10-15. A consistent increase in realisation and stable EBITDA margins has enabled the company to reduce its payback period from nine years in Kochi to 7.5 years in Bengaluru. The payback period in Hyderabad is expected to further reduce to 7 years led by higher realisation and healthy EBITDA margins. Going forward, we expect the blended realisation per footfall to improve from | 736 in FY15 to | 1,034 in FY18E driven by an improvement in non-ticketing revenue, average ticket price and also introduction of differentiated offerings (new rides) and premium offerings (like fast track tickets). We expect the blended footfall to increase at a CAGR of 13.1% in FY15-18E led by the addition of the Hyderabad park.
Exhibit 33: Realisation trend of Kochi, Bengaluru and Hyderabad
499 516 573646 715
806921
10301135
372 385 435 488564
655801
879964
868954
0
200
400
600
800
1000
1200
FY10 FY11 FY12 FY13 FY14 FY15 FY16E FY17E FY18E
Wonderla Bengaluru Wonderla Kochi Wonderla Hyderabad
Source: Company, ICICIdirect.com Research
Exhibit 34: Blended realisation to grow at 12.0% CAGR in FY15-18E
428 445 501 564642 736
866941
1034
0
200
400
600
800
1000
1200
FY10 FY11 FY12 FY13 FY14 FY15 FY16E FY17E FY18E
Blended ticket realisation
Source: Company, ICICIdirect.com Research
Exhibit 35: Total footfall to increase at CAGR of 13.1% over FY15-18E
7
911 11 12 12 13 14 14
9
11 12 1211 11 11 11 12
78
1620
23 23 23 23 24
32 34
-
2
4
6
8
10
12
14
16
FY10 FY11 FY12 FY13 FY14 FY15 FY16E FY17E FY18E
in la
khs
-
5
10
15
20
25
30
35
40
Wonderla Bengaluru Wonderla Kochi Wonderla Hyderabad Total
Source: Company, ICICIdirect.com Research
Payback period
97.5 7
0
5
10
Kochi Bengaluru Hyderabad*
Year
s
Payback period
Source: Company, ICICIdirect.com Research, *Expected to open in April-16
Page 12ICICI Securities Ltd | Retail Equity Research
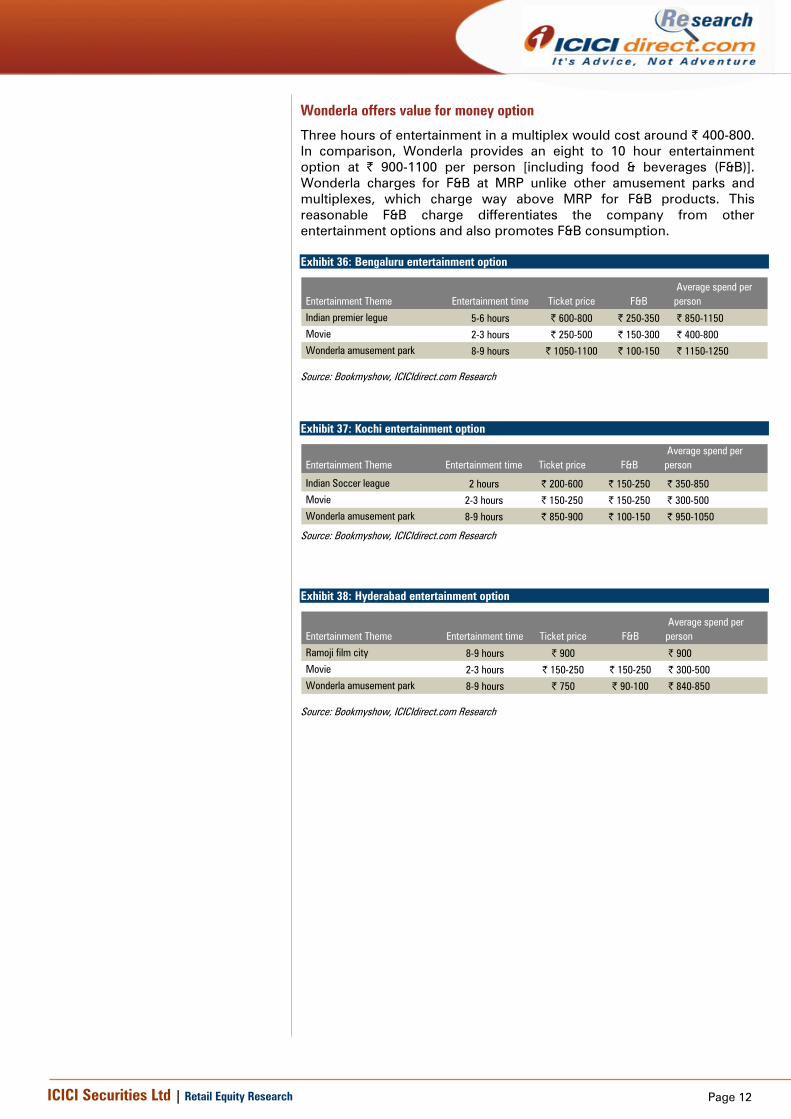
Wonderla offers value for money option
Three hours of entertainment in a multiplex would cost around | 400-800. In comparison, Wonderla provides an eight to 10 hour entertainment option at | 900-1100 per person [including food & beverages (F&B)]. Wonderla charges for F&B at MRP unlike other amusement parks and multiplexes, which charge way above MRP for F&B products. This reasonable F&B charge differentiates the company from other entertainment options and also promotes F&B consumption. Exhibit 36: Bengaluru entertainment option
Entertainment Theme Entertainment time Ticket price F&B Average spend per person
Indian premier legue 5-6 hours | 600-800 | 250-350 | 850-1150 Movie 2-3 hours | 250-500 | 150-300 | 400-800 Wonderla amusement park 8-9 hours | 1050-1100 | 100-150 | 1150-1250
Source: Bookmyshow, ICICIdirect.com Research
Exhibit 37: Kochi entertainment option
Entertainment Theme Entertainment time Ticket price F&BAverage spend per person
Indian Soccer league 2 hours | 200-600 | 150-250 | 350-850 Movie 2-3 hours | 150-250 | 150-250 | 300-500 Wonderla amusement park 8-9 hours | 850-900 | 100-150 | 950-1050
Source: Bookmyshow, ICICIdirect.com Research
Exhibit 38: Hyderabad entertainment option
Entertainment Theme Entertainment time Ticket price F&B Average spend per person
Ramoji film city 8-9 hours | 900 | 900 Movie 2-3 hours | 150-250 | 150-250 | 300-500 Wonderla amusement park 8-9 hours | 750 | 90-100 | 840-850
Source: Bookmyshow, ICICIdirect.com Research
Page 13ICICI Securities Ltd | Retail Equity Research
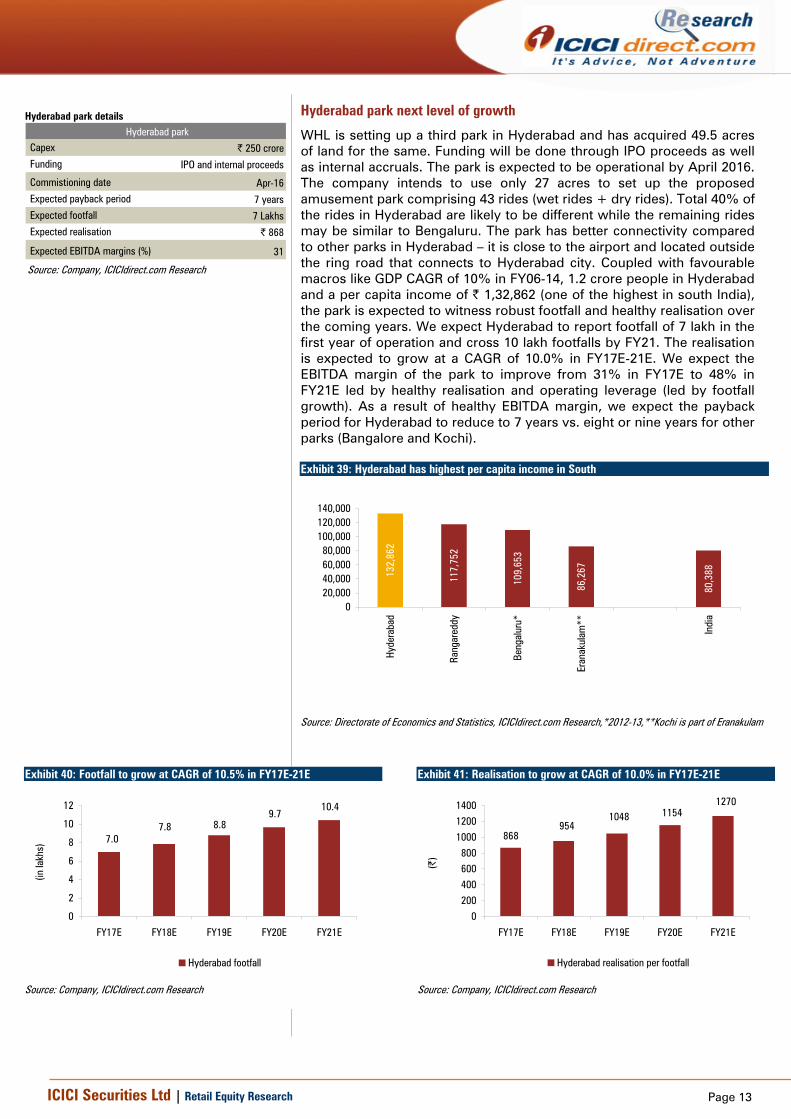
Hyderabad park next level of growth
WHL is setting up a third park in Hyderabad and has acquired 49.5 acres of land for the same. Funding will be done through IPO proceeds as well as internal accruals. The park is expected to be operational by April 2016. The company intends to use only 27 acres to set up the proposed amusement park comprising 43 rides (wet rides + dry rides). Total 40% of the rides in Hyderabad are likely to be different while the remaining rides may be similar to Bengaluru. The park has better connectivity compared to other parks in Hyderabad – it is close to the airport and located outside the ring road that connects to Hyderabad city. Coupled with favourable macros like GDP CAGR of 10% in FY06-14, 1.2 crore people in Hyderabad and a per capita income of | 1,32,862 (one of the highest in south India), the park is expected to witness robust footfall and healthy realisation over the coming years. We expect Hyderabad to report footfall of 7 lakh in the first year of operation and cross 10 lakh footfalls by FY21. The realisation is expected to grow at a CAGR of 10.0% in FY17E-21E. We expect the EBITDA margin of the park to improve from 31% in FY17E to 48% in FY21E led by healthy realisation and operating leverage (led by footfall growth). As a result of healthy EBITDA margin, we expect the payback period for Hyderabad to reduce to 7 years vs. eight or nine years for other parks (Bangalore and Kochi). Exhibit 39: Hyderabad has highest per capita income in South
132,
862
117,
752
109,
653
86,2
67
80,3
88
020,00040,00060,00080,000
100,000120,000140,000
Hyde
raba
d
Rang
ared
dy
Beng
alur
u*
Eran
akul
am**
Indi
a
Source: Directorate of Economics and Statistics, ICICIdirect.com Research,*2012-13,**Kochi is part of Eranakulam
Exhibit 40: Footfall to grow at CAGR of 10.5% in FY17E-21E
7.07.8 8.8
9.710.4
0
2
4
6
8
10
12
FY17E FY18E FY19E FY20E FY21E
(in la
khs)
Hyderabad footfall
Source: Company, ICICIdirect.com Research
Exhibit 41: Realisation to grow at CAGR of 10.0% in FY17E-21E
868954
1048 11541270
0200
400
600800
1000
12001400
FY17E FY18E FY19E FY20E FY21E
(|)
Hyderabad realisation per footfall
Source: Company, ICICIdirect.com Research
Hyderabad park details
Capex | 250 crore Funding IPO and internal proceeds
Commistioning date Apr-16 Expected payback period 7 years Expected footfall 7 Lakhs Expected realisation | 868
Expected EBITDA margins (%) 31
Hyderabad park
Source: Company, ICICIdirect.com Research
Page 14ICICI Securities Ltd | Retail Equity Research
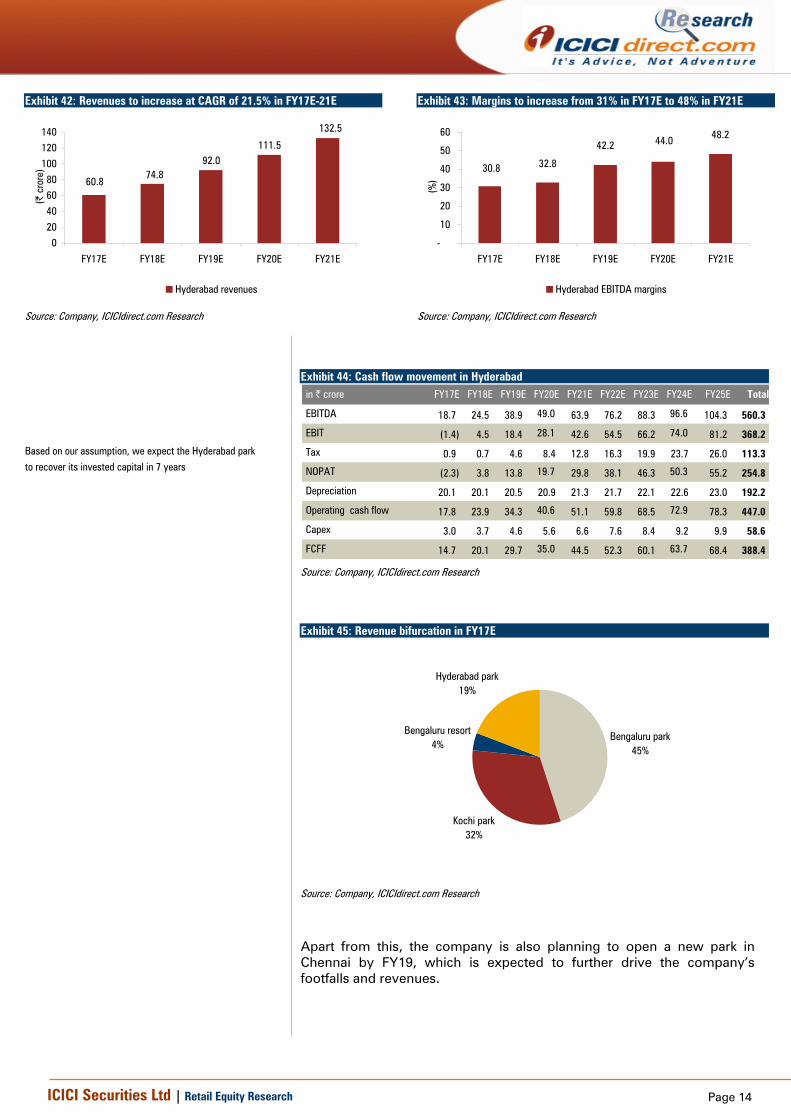
Exhibit 42: Revenues to increase at CAGR of 21.5% in FY17E-21E
60.874.8
92.0111.5
132.5
020
40
6080
100
120140
FY17E FY18E FY19E FY20E FY21E
(| c
rore
)
Hyderabad revenues
Source: Company, ICICIdirect.com Research
Exhibit 43: Margins to increase from 31% in FY17E to 48% in FY21E
30.8 32.8
42.2 44.0 48.2
-
10
20
30
40
50
60
FY17E FY18E FY19E FY20E FY21E
(%)
Hyderabad EBITDA margins
Source: Company, ICICIdirect.com Research
Exhibit 44: Cash flow movement in Hyderabad in | crore FY17E FY18E FY19E FY20E FY21E FY22E FY23E FY24E FY25E Total
EBITDA 18.7 24.5 38.9 49.0 63.9 76.2 88.3 96.6 104.3 560.3
EBIT (1.4) 4.5 18.4 28.1 42.6 54.5 66.2 74.0 81.2 368.2
Tax 0.9 0.7 4.6 8.4 12.8 16.3 19.9 23.7 26.0 113.3
NOPAT (2.3) 3.8 13.8 19.7 29.8 38.1 46.3 50.3 55.2 254.8
Depreciation 20.1 20.1 20.5 20.9 21.3 21.7 22.1 22.6 23.0 192.2
Operating cash flow 17.8 23.9 34.3 40.6 51.1 59.8 68.5 72.9 78.3 447.0
Capex 3.0 3.7 4.6 5.6 6.6 7.6 8.4 9.2 9.9 58.6
FCFF 14.7 20.1 29.7 35.0 44.5 52.3 60.1 63.7 68.4 388.4
Source: Company, ICICIdirect.com Research
Exhibit 45: Revenue bifurcation in FY17E
Bengaluru park45%
Kochi park32%
Bengaluru resort4%
Hyderabad park19%
Source: Company, ICICIdirect.com Research
Apart from this, the company is also planning to open a new park in Chennai by FY19, which is expected to further drive the company’s footfalls and revenues.
Based on our assumption, we expect the Hyderabad park
to recover its invested capital in 7 years

Page 15ICICI Securities Ltd | Retail Equity Research
Mature parks to support growth and expansion
Wonderla has two parks that are mature i.e. Wonderla Kochi and Wonderla Bengaluru. The company generates stable cash flow from these parks and has high margins. The average realisation of the Kochi park has increased from | 372 in FY10 to | 655 in FY15 (CAGR of 12.0% in FY10-15). The realisation of the Bengaluru park has grown at a CAGR of 10.1% in FY10-15. Despite an increase in realisation, Wonderla has been able to maintain a stable footfall over the same period. Both these parks have been able to clock RoCE of 35%. Both these parks have been able to maintain average EBITDA margin of ~44% (in FY10-15E) led by stable footfall, competitive pricing and operating leverage (as 70% of cost is fixed). Further, in FY12-15, these parks have registered an operating cash flow of | 200 core. Going forward, we expect the realisation of the Bengaluru and Kochi parks to increase at a CAGR of 12.1% and 13.8% in FY15-18E, respectively, led by better pricing power and improvement in discretionary spending. We expect realisation CAGR at Kochi park to be higher than the Bengaluru park led by a lower base leading to higher delta compared to the Bengaluru park, which started at a premium to Kochi. Further, the company aims to bolster footfalls at these parks by adding new rides every year (as witnessed in previous years). Footfalls in Bengaluru and Kochi are expected to grow at a CAGR of 5.0% and 2.0%, respectively, in FY15-18E. In light of these factors, we expect revenues at Bengaluru and Kochi to increase at a CAGR of 17.7% and 16.0%, respectively, in FY15-18E. Further, robust cash flow from these parks and lower capex spend are expected to enable Wonderla to not only support growth but also help the company to fund its Hyderabad capex and losses in the initial years.
Exhibit 46: Bengaluru revenues to grow at 17.7% CAGR
100.7120.8
142.0
164.1
0
50
100
150
200
FY15 FY16E FY17E FY18E
(in |
cro
re)
Wonderla Bengaluru revenues
Source: Company, ICICIdirect.com Research
Exhibit 47: Kochi revenues to grow at CAGR of 16.0% in FY15-18E
71.489.2
99.7111.6
0
20
40
60
80
100
120
FY15 FY16E FY17E FY18E
(in |
cro
re)
Wonderla Kochi revenues
Source: Company, ICICIdirect.com Research
Exhibit 48: Historical trend in rides addition
Total rides FY11 FY12 FY13 FY14 FY15
Land based rides
Kochi 29.0 31.0 31.0 34.0 39.0
Bengaluru 32.0 33.0 33.0 35.0 39.0
Water based rides
Kochi 22.0 22.0 22.0 22.0 23.0
Bengaluru 20.0 20.0 20.0 20.0 20.0
Source: Company, ICICIdirect.com Research
Page 16ICICI Securities Ltd | Retail Equity Research
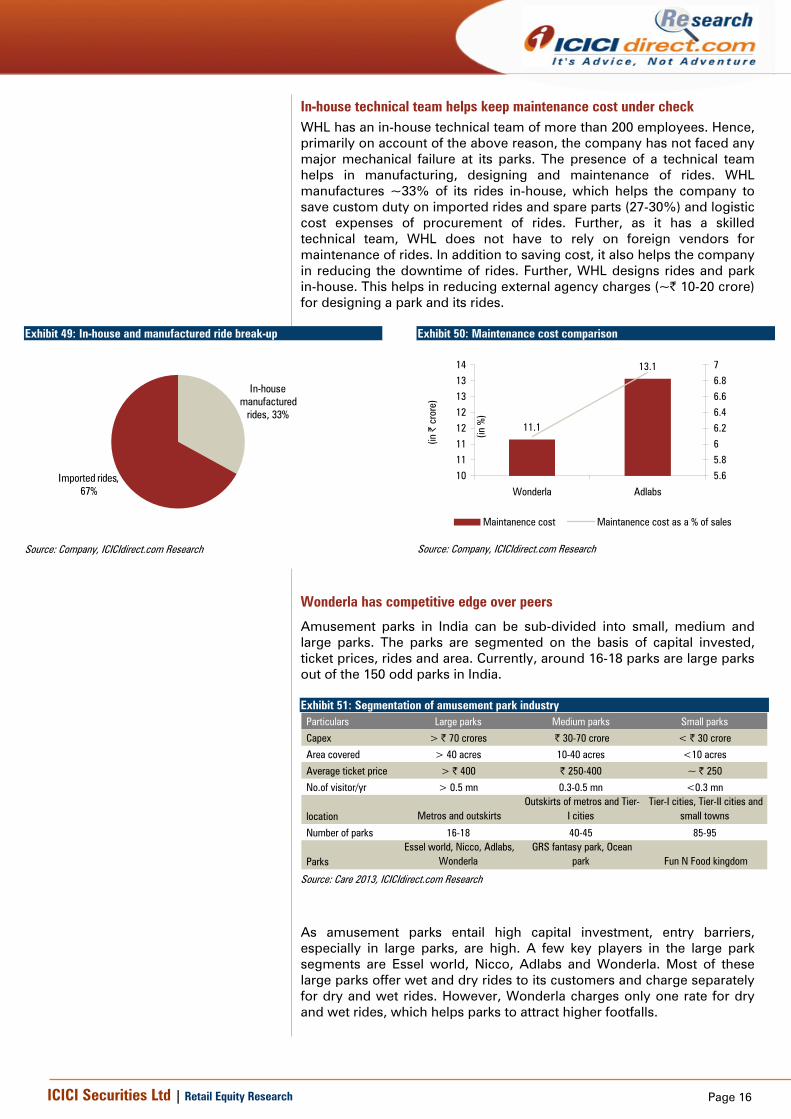
In-house technical team helps keep maintenance cost under check WHL has an in-house technical team of more than 200 employees. Hence, primarily on account of the above reason, the company has not faced any major mechanical failure at its parks. The presence of a technical team helps in manufacturing, designing and maintenance of rides. WHL manufactures ~33% of its rides in-house, which helps the company to save custom duty on imported rides and spare parts (27-30%) and logistic cost expenses of procurement of rides. Further, as it has a skilled technical team, WHL does not have to rely on foreign vendors for maintenance of rides. In addition to saving cost, it also helps the company in reducing the downtime of rides. Further, WHL designs rides and park in-house. This helps in reducing external agency charges (~| 10-20 crore) for designing a park and its rides.
Exhibit 49: In-house and manufactured ride break-up
In-house manufactured
rides, 33%
Imported rides, 67%
Source: Company, ICICIdirect.com Research
Exhibit 50: Maintenance cost comparison
11.1
13.1
1011111212131314
Wonderla Adlabs
(in |
cro
re)
5.65.866.26.46.66.87
(in %
)
Maintanence cost Maintanence cost as a % of sales
Source: Company, ICICIdirect.com Research
Wonderla has competitive edge over peers
Amusement parks in India can be sub-divided into small, medium and large parks. The parks are segmented on the basis of capital invested, ticket prices, rides and area. Currently, around 16-18 parks are large parks out of the 150 odd parks in India. Exhibit 51: Segmentation of amusement park industry
Particulars Large parks Medium parks Small parks
Capex > | 70 crores | 30-70 crore < | 30 crore
Area covered > 40 acres 10-40 acres <10 acres
Average ticket price > | 400 | 250-400 ~ | 250
No.of visitor/yr > 0.5 mn 0.3-0.5 mn <0.3 mn
location Metros and outskirts Outskirts of metros and Tier-
I cities Tier-I cities, Tier-II cities and
small towns
Number of parks 16-18 40-45 85-95
ParksEssel world, Nicco, Adlabs,
Wonderla GRS fantasy park, Ocean
park Fun N Food kingdom
Source: Care 2013, ICICIdirect.com Research
As amusement parks entail high capital investment, entry barriers, especially in large parks, are high. A few key players in the large park segments are Essel world, Nicco, Adlabs and Wonderla. Most of these large parks offer wet and dry rides to its customers and charge separately for dry and wet rides. However, Wonderla charges only one rate for dry and wet rides, which helps parks to attract higher footfalls.
Page 17ICICI Securities Ltd | Retail Equity Research
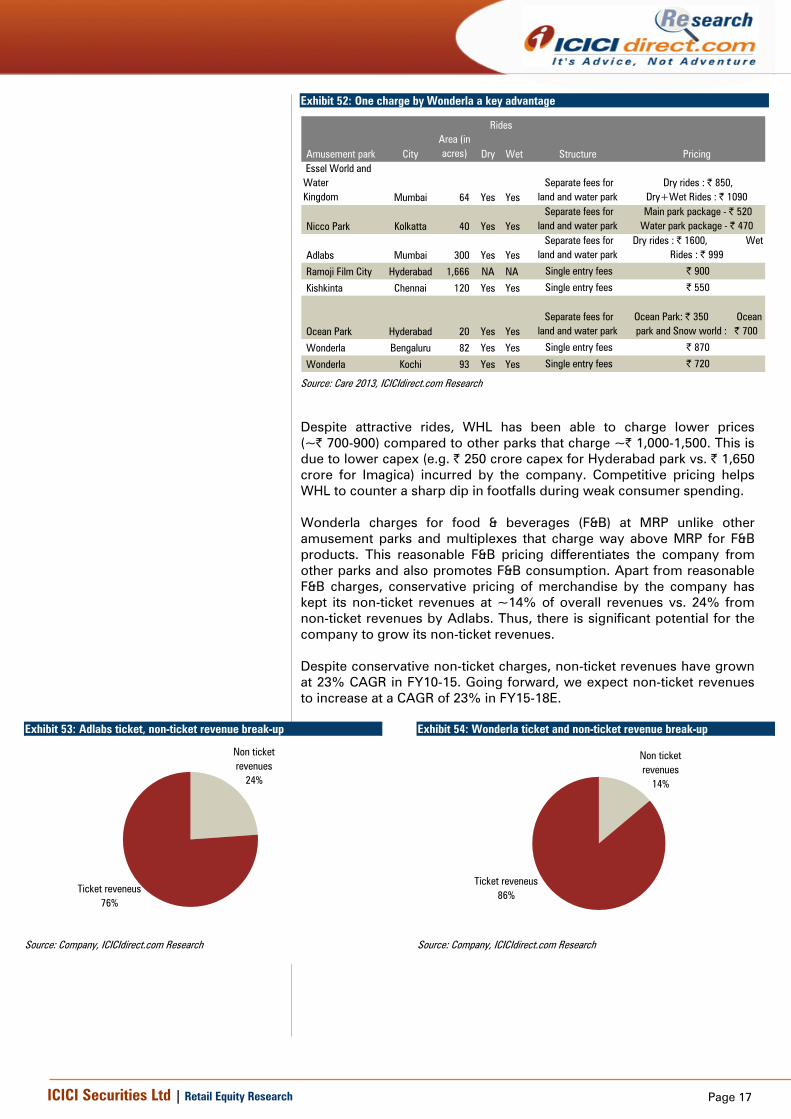
Exhibit 52: One charge by Wonderla a key advantage
Amusement park CityArea (in acres) Dry Wet Structure Pricing
Essel World and WaterKingdom Mumbai 64 Yes Yes
Separate fees forland and water park
Dry rides : | 850, Dry+Wet Rides : | 1090
Nicco Park Kolkatta 40 Yes YesSeparate fees for
land and water park Main park package - | 520Water park package - | 470
Adlabs Mumbai 300 Yes YesSeparate fees for
land and water park Dry rides : | 1600, Wet
Rides : | 999
Ramoji Film City Hyderabad 1,666 NA NA Single entry fees | 900
Kishkinta Chennai 120 Yes Yes Single entry fees | 550
Ocean Park Hyderabad 20 Yes Yes Separate fees for
land and water park Ocean Park: | 350 Ocean park and Snow world : | 700
Wonderla Bengaluru 82 Yes Yes Single entry fees | 870
Wonderla Kochi 93 Yes Yes Single entry fees | 720
Rides
Source: Care 2013, ICICIdirect.com Research
Despite attractive rides, WHL has been able to charge lower prices (~| 700-900) compared to other parks that charge ~| 1,000-1,500. This is due to lower capex (e.g. | 250 crore capex for Hyderabad park vs. | 1,650 crore for Imagica) incurred by the company. Competitive pricing helps WHL to counter a sharp dip in footfalls during weak consumer spending. Wonderla charges for food & beverages (F&B) at MRP unlike other amusement parks and multiplexes that charge way above MRP for F&B products. This reasonable F&B pricing differentiates the company from other parks and also promotes F&B consumption. Apart from reasonable F&B charges, conservative pricing of merchandise by the company has kept its non-ticket revenues at ~14% of overall revenues vs. 24% from non-ticket revenues by Adlabs. Thus, there is significant potential for the company to grow its non-ticket revenues. Despite conservative non-ticket charges, non-ticket revenues have grown at 23% CAGR in FY10-15. Going forward, we expect non-ticket revenues to increase at a CAGR of 23% in FY15-18E.
Exhibit 53: Adlabs ticket, non-ticket revenue break-up
Non ticket revenues
24%
Ticket reveneus76%
Source: Company, ICICIdirect.com Research
Exhibit 54: Wonderla ticket and non-ticket revenue break-up
Non ticket revenues
14%
Ticket reveneus86%
Source: Company, ICICIdirect.com Research
Page 18ICICI Securities Ltd | Retail Equity Research
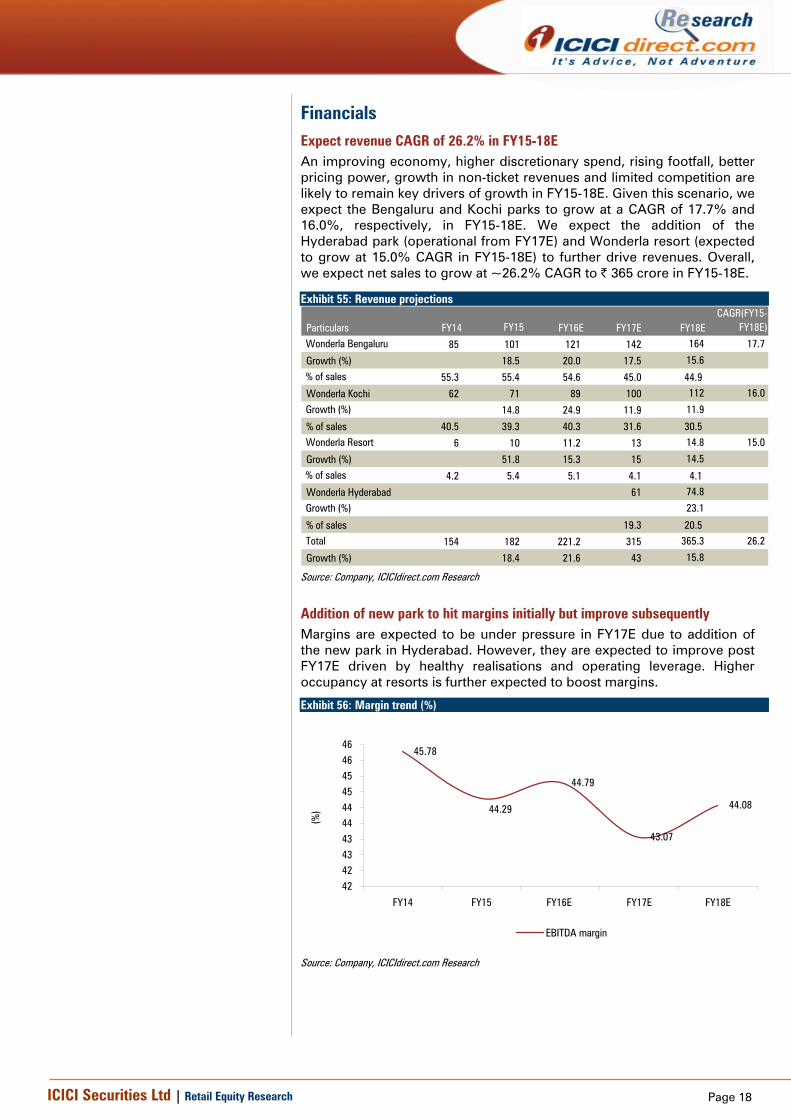
Financials Expect revenue CAGR of 26.2% in FY15-18E An improving economy, higher discretionary spend, rising footfall, better pricing power, growth in non-ticket revenues and limited competition are likely to remain key drivers of growth in FY15-18E. Given this scenario, we expect the Bengaluru and Kochi parks to grow at a CAGR of 17.7% and 16.0%, respectively, in FY15-18E. We expect the addition of the Hyderabad park (operational from FY17E) and Wonderla resort (expected to grow at 15.0% CAGR in FY15-18E) to further drive revenues. Overall, we expect net sales to grow at ~26.2% CAGR to | 365 crore in FY15-18E.
Exhibit 55: Revenue projections
Particulars FY14 FY15 FY16E FY17E FY18ECAGR(FY15-
FY18E)
Wonderla Bengaluru 85 101 121 142 164 17.7
Growth (%) 18.5 20.0 17.5 15.6
% of sales 55.3 55.4 54.6 45.0 44.9
Wonderla Kochi 62 71 89 100 112 16.0
Growth (%) 14.8 24.9 11.9 11.9
% of sales 40.5 39.3 40.3 31.6 30.5 Wonderla Resort 6 10 11.2 13 14.8 15.0
Growth (%) 51.8 15.3 15 14.5
% of sales 4.2 5.4 5.1 4.1 4.1
Wonderla Hyderabad 61 74.8
Growth (%) 23.1
% of sales 19.3 20.5 Total 154 182 221.2 315 365.3 26.2
Growth (%) 18.4 21.6 43 15.8
Source: Company, ICICIdirect.com Research
Addition of new park to hit margins initially but improve subsequently Margins are expected to be under pressure in FY17E due to addition of the new park in Hyderabad. However, they are expected to improve post FY17E driven by healthy realisations and operating leverage. Higher occupancy at resorts is further expected to boost margins.
Exhibit 56: Margin trend (%)
45.78
44.79
43.07
44.0844.29
42424343444445454646
FY14 FY15 FY16E FY17E FY18E
(%)
EBITDA margin
Source: Company, ICICIdirect.com Research

Page 19ICICI Securities Ltd | Retail Equity Research
Consistent profitability due to healthy demand outlook With a sharp rise in realisation and operating leverage benefits, we expect net profit to grow at a CAGR of 24.3% over FY15-18E.
Exhibit 57: Profitability growth trend
39.950.6
70.777.1
97.3
0
20
40
60
80
100
120
FY14 FY15 FY16E FY17E FY18E
| cr
ore
Net profit
Source: Company, ICICIdirect.com Research
Return ratios to remain healthy….
With an improvement in profitability aided by healthy margins, we expect the return ratios of the company to remain healthy. We expect RoCE and RoE to improve to 24.8% and 17.2% (from 20.2% and 14.2% in FY15), respectively, over the next three years.
Exhibit 58: Return ratios trend
33.9
24.826.6
17.2
20.224.4 23.1
14.216.9
16.0
0
5
10
15
20
25
30
35
40
FY14 FY15* FY16E FY17E FY18E
(%)
RoCE RoE
Source: Company, ICICIdirect.com Research,*Post IPO ratios

Page 20ICICI Securities Ltd | Retail Equity Research
Risks & Concerns Service tax levy to impact financials The central government has imposed a service tax on amusement parks in the 2015-16 Budget. However, amusement parks are already paying entertainment tax in their respective states and amusement park at present comes under the state purview with respect to taxes. Hence, the central government will have to make a constitutional amendment to impose service tax on amusement park. WHL has been paying entertainment tax of 2% in Kochi and 5% in Bengaluru. Thus, on the basis of the above premise, the company has challenged the imposition of service tax in the Kerala and Karnataka High Courts and obtained a stay from the respective courts. Based on the stay order, WHL has not paid service tax worth | 3.5 crore. The company has not paid service tax at the Kochi park for 50 days and for 60 days at the Bengaluru park. Although WHL has made adequate provisions in its P&L for the same, any adverse ruling by high courts will adversely impact the company’s future performance and financials.
Risk of accidents or mishaps at any amusement parks exposes WHL to possible financial liabilities, legal proceedings Ensuring the safety of visitors on rides is critical for the smooth operation of an amusement park. Wonderla has stringent checks in place for safety and hygiene standards. However, since a majority of the company’s current revenue is coming from the operation of two amusement parks, any accident/incident at either of them may result in the temporary closure of the park for some time, thereby affecting revenues of the company and generating adverse publicity.
Slowdown in consumer discretionary spending
The Indian economy is expected to improve led by policy changes and improved consumer spending. However, an economic slowdown may adversely impact discretionary spending. As the business is highly dependent on improving consumer spending, any slowdown will adversely affect the business, operational results, financial conditions as well as prospects.

Page 21ICICI Securities Ltd | Retail Equity Research
Valuations Wonderla is one of the largest amusement park players in south India and is present in Bengaluru and Kochi. With the addition of two new amusement parks in Hyderabad and Chennai, the company is set to become the biggest amusement park company with a presence across regions in south India. WHL enjoys high brand equity and has a competitive edge over its peers due to reasonable F&B pricing and lower capex investment. An experienced management team successfully running amusement parks for over 15 years also gives an edge to the company over its peers. A high entry barrier due to high capital investment and limited number of large amusement parks in India coupled with favourable demographics and rising discretionary spend augur well for WHL. We expect it to witness a sharp improvement in footfall and realisation led by addition of new parks and favourable demographics. Further, WHL has been able to generate higher cash flow driven by healthy margins at mature parks. As a result of high cash flow generation, the company has been able to keep its debt to equity lower and has also been able to expand through internal accruals. We expect WHL to report revenue and EBITDA CAGR of 26.2% and 25.9%, respectively, over the next three years (FY15-18E). Wonderla has been able to consistently maintain an EBITDA margin of 44.3%, which is the highest EBITDA margin compared to Indian and global peers. Going forward, we expect the company to maintain healthy margins in coming years. Further, a healthy balance sheet, strong cash flow generation and addition of new parks are expected to maintain the robust financials of WHL. We have valued the company based on DCF valuations to arrive at a target price of | 460 (assuming a WACC of 11% and terminal growth of 5%), providing an upside of 18%.
Exhibit 59: One year forward EV/EBITDA
0
500
1000
1500
2000
2500
3000
3500
May
-14
Jul-1
4
Sep-
14
Nov
-14
Jan-
15
Mar
-15
Jun-
15
Aug-
15
Oct-1
5
Dec-
15
EV 5x 10x 15x 20x
Source: Capital line, ICICIdirect.com Research
WACC Particulars Rate (in %)
Risk free rate 8
Market return 12 Risk premium 5
Beta 1 Cost of equity 11
Post tax cost of debt 7 WACC 11
Terminal growth rate 5
Source: ICICIdirect.com Research
DCF valuation Valuation | crore PV of free cash clow 708 PV of terminal cash flow 1,794 Less debt 11 Add cash & investment 105 Target market cap 2,597 No.of.shares (in crore) 6 Target price (|) 460
Source: ICICIdirect.com Research
Page 22ICICI Securities Ltd | Retail Equity Research
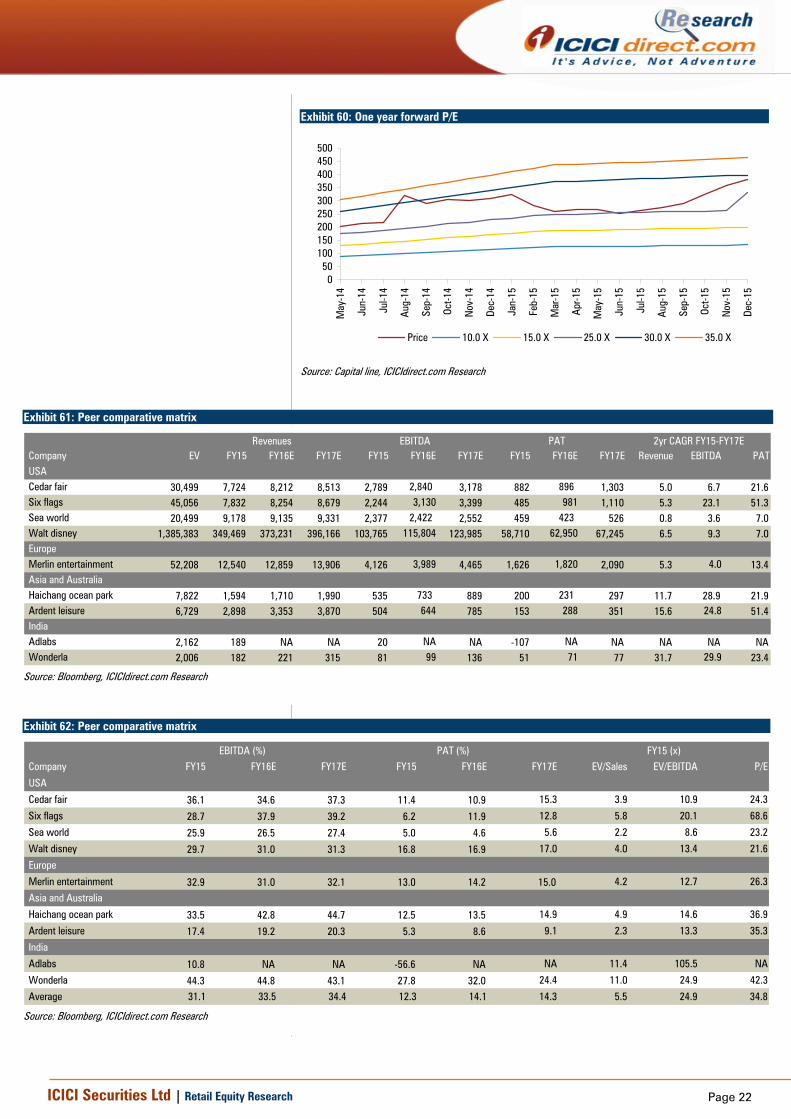
Exhibit 60: One year forward P/E
050
100150200250300350400450500
May
-14
Jun-
14
Jul-1
4
Aug-
14
Sep-
14
Oct-1
4
Nov
-14
Dec-
14
Jan-
15
Feb-
15
Mar
-15
Apr-1
5
May
-15
Jun-
15
Jul-1
5
Aug-
15
Sep-
15
Oct-1
5
Nov
-15
Dec-
15
Price 10.0 X 15.0 X 25.0 X 30.0 X 35.0 X
Source: Capital line, ICICIdirect.com Research
Exhibit 61: Peer comparative matrix
Company EV FY15 FY16E FY17E FY15 FY16E FY17E FY15 FY16E FY17E Revenue EBITDA PAT USA Cedar fair 30,499 7,724 8,212 8,513 2,789 2,840 3,178 882 896 1,303 5.0 6.7 21.6 Six flags 45,056 7,832 8,254 8,679 2,244 3,130 3,399 485 981 1,110 5.3 23.1 51.3 Sea world 20,499 9,178 9,135 9,331 2,377 2,422 2,552 459 423 526 0.8 3.6 7.0 Walt disney 1,385,383 349,469 373,231 396,166 103,765 115,804 123,985 58,710 62,950 67,245 6.5 9.3 7.0 Europe Merlin entertainment 52,208 12,540 12,859 13,906 4,126 3,989 4,465 1,626 1,820 2,090 5.3 4.0 13.4 Asia and Australia Haichang ocean park 7,822 1,594 1,710 1,990 535 733 889 200 231 297 11.7 28.9 21.9 Ardent leisure 6,729 2,898 3,353 3,870 504 644 785 153 288 351 15.6 24.8 51.4 India Adlabs 2,162 189 NA NA 20 NA NA -107 NA NA NA NA NA Wonderla 2,006 182 221 315 81 99 136 51 71 77 31.7 29.9 23.4
Revenues EBITDA PAT 2yr CAGR FY15-FY17E
Source: Bloomberg, ICICIdirect.com Research
Exhibit 62: Peer comparative matrix
Company FY15 FY16E FY17E FY15 FY16E FY17E EV/Sales EV/EBITDA P/E
USA
Cedar fair 36.1 34.6 37.3 11.4 10.9 15.3 3.9 10.9 24.3
Six flags 28.7 37.9 39.2 6.2 11.9 12.8 5.8 20.1 68.6
Sea world 25.9 26.5 27.4 5.0 4.6 5.6 2.2 8.6 23.2
Walt disney 29.7 31.0 31.3 16.8 16.9 17.0 4.0 13.4 21.6
Europe
Merlin entertainment 32.9 31.0 32.1 13.0 14.2 15.0 4.2 12.7 26.3
Asia and Australia
Haichang ocean park 33.5 42.8 44.7 12.5 13.5 14.9 4.9 14.6 36.9
Ardent leisure 17.4 19.2 20.3 5.3 8.6 9.1 2.3 13.3 35.3
India
Adlabs 10.8 NA NA -56.6 NA NA 11.4 105.5 NA
Wonderla 44.3 44.8 43.1 27.8 32.0 24.4 11.0 24.9 42.3
Average 31.1 33.5 34.4 12.3 14.1 14.3 5.5 24.9 34.8
PAT (%) FY15 (x)EBITDA (%)
Source: Bloomberg, ICICIdirect.com Research
Page 23ICICI Securities Ltd | Retail Equity Research
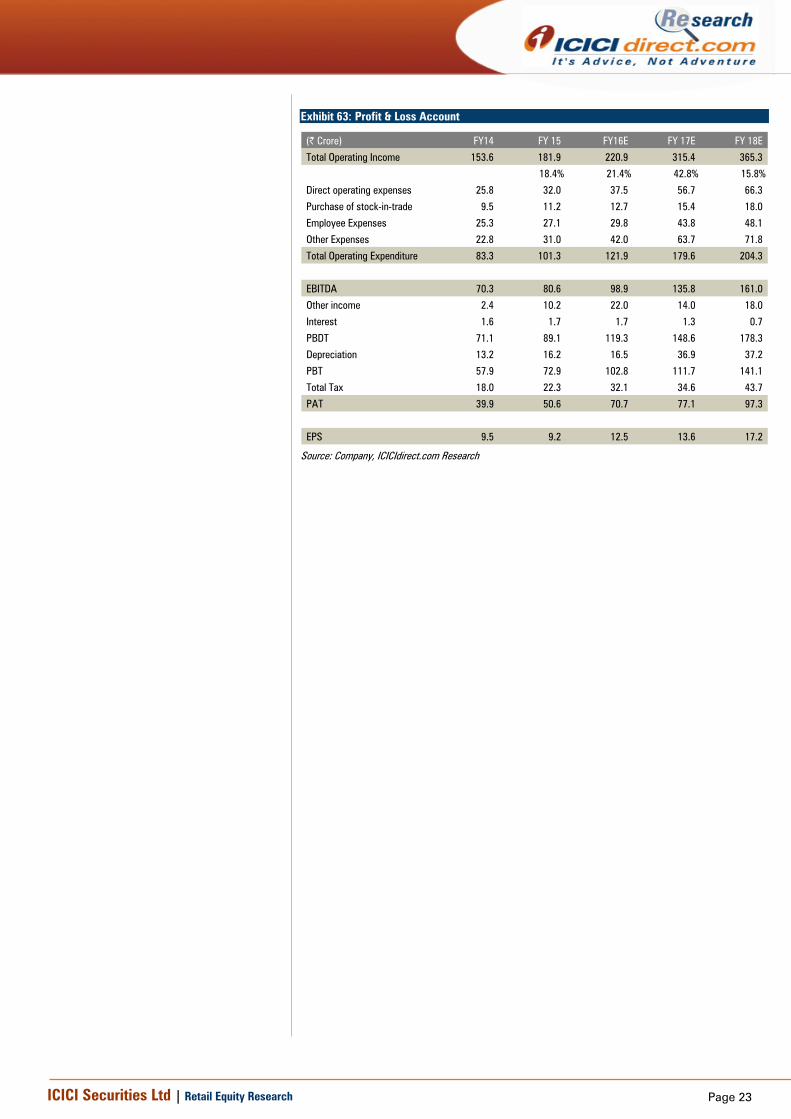
Exhibit 63: Profit & Loss Account
(| Crore) FY14 FY 15 FY16E FY 17E FY 18E
Total Operating Income 153.6 181.9 220.9 315.4 365.3
18.4% 21.4% 42.8% 15.8%
Direct operating expenses 25.8 32.0 37.5 56.7 66.3
Purchase of stock-in-trade 9.5 11.2 12.7 15.4 18.0
Employee Expenses 25.3 27.1 29.8 43.8 48.1
Other Expenses 22.8 31.0 42.0 63.7 71.8
Total Operating Expenditure 83.3 101.3 121.9 179.6 204.3
EBITDA 70.3 80.6 98.9 135.8 161.0
Other income 2.4 10.2 22.0 14.0 18.0
Interest 1.6 1.7 1.7 1.3 0.7
PBDT 71.1 89.1 119.3 148.6 178.3
Depreciation 13.2 16.2 16.5 36.9 37.2
PBT 57.9 72.9 102.8 111.7 141.1
Total Tax 18.0 22.3 32.1 34.6 43.7
PAT 39.9 50.6 70.7 77.1 97.3
EPS 9.5 9.2 12.5 13.6 17.2
Source: Company, ICICIdirect.com Research
Page 24ICICI Securities Ltd | Retail Equity Research
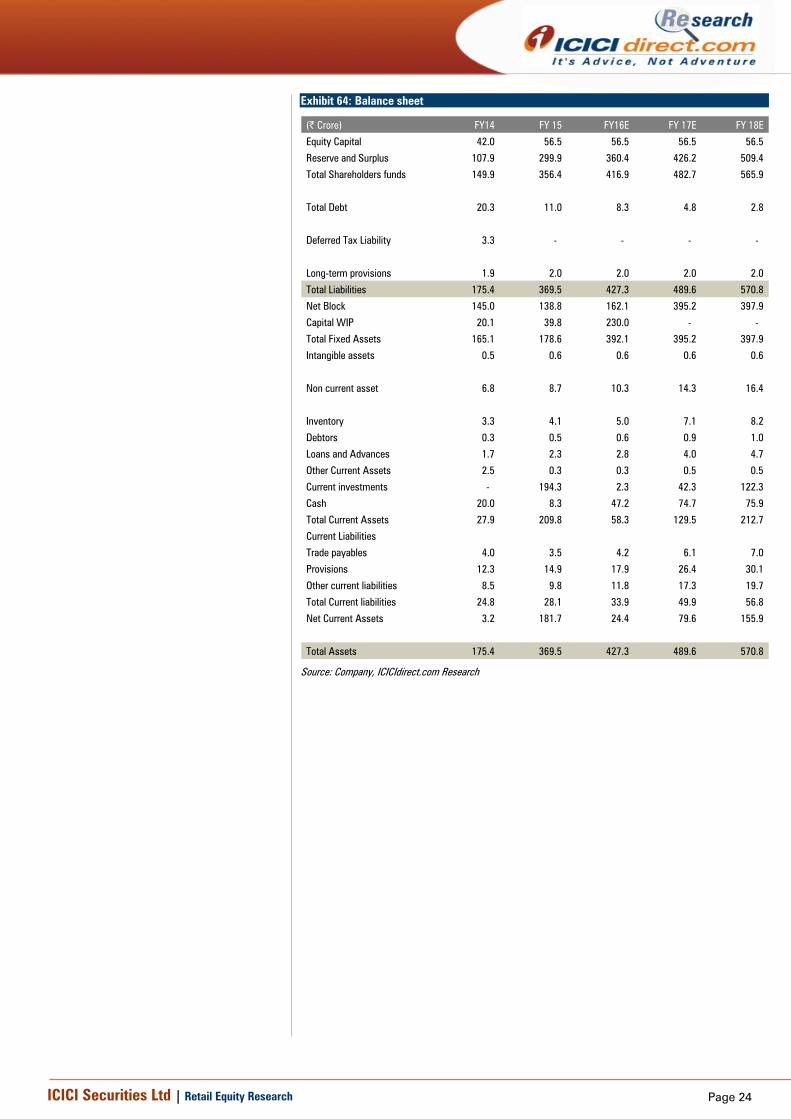
Exhibit 64: Balance sheet
(| Crore) FY14 FY 15 FY16E FY 17E FY 18E
Equity Capital 42.0 56.5 56.5 56.5 56.5
Reserve and Surplus 107.9 299.9 360.4 426.2 509.4
Total Shareholders funds 149.9 356.4 416.9 482.7 565.9
Total Debt 20.3 11.0 8.3 4.8 2.8
Deferred Tax Liability 3.3 - - - -
Long-term provisions 1.9 2.0 2.0 2.0 2.0
Total Liabilities 175.4 369.5 427.3 489.6 570.8
Net Block 145.0 138.8 162.1 395.2 397.9
Capital WIP 20.1 39.8 230.0 - -
Total Fixed Assets 165.1 178.6 392.1 395.2 397.9
Intangible assets 0.5 0.6 0.6 0.6 0.6
Non current asset 6.8 8.7 10.3 14.3 16.4
Inventory 3.3 4.1 5.0 7.1 8.2
Debtors 0.3 0.5 0.6 0.9 1.0
Loans and Advances 1.7 2.3 2.8 4.0 4.7
Other Current Assets 2.5 0.3 0.3 0.5 0.5
Current investments - 194.3 2.3 42.3 122.3
Cash 20.0 8.3 47.2 74.7 75.9
Total Current Assets 27.9 209.8 58.3 129.5 212.7
Current Liabilities
Trade payables 4.0 3.5 4.2 6.1 7.0
Provisions 12.3 14.9 17.9 26.4 30.1
Other current liabilities 8.5 9.8 11.8 17.3 19.7
Total Current liabilities 24.8 28.1 33.9 49.9 56.8
Net Current Assets 3.2 181.7 24.4 79.6 155.9
Total Assets 175.4 369.5 427.3 489.6 570.8
Source: Company, ICICIdirect.com Research

Page 25ICICI Securities Ltd | Retail Equity Research
Exhibit 65: Cash flow statement
(| Crore) FY14 FY 15 FY16E FY 17E FY 18E
Profit before tax 57.9 72.9 102.8 111.7 141.1
Depreciation 13.2 16.2 16.5 36.9 37.2
Interest 1.6 1.7 1.7 1.3 0.7
Other income (0.9) (7.5) (22.0) (14.0) (18.0)
Cash Flow before WC changes 71.8 83.7 98.9 135.8 161.0
Net Increase in Current Assets (3.0) (5.3) (3.1) (7.7) (4.1)
Net Increase in Current Liabilities 1.2 3.0 5.7 16.0 6.9
Taxes Paid (19.8) (25.2) (32.1) (34.6) (43.7)
Net CF from Operating activities 50.2 56.2 69.4 109.5 120.1
(Purchase)/Sale of Fixed Assets (27.0) (36.9) (230.0) (40.0) (40.0)
(Purchase)/Sale of Investments - (194.3) 192.0 (40.0) (80.0)
Other Income 1.1 7.7 22.0 14.0 18.0
Net CF from Investing activities (25.9) (223.5) (16.0) (66.0) (102.0)
Inc / (Dec) in Loan 2.9 (8.8) (2.7) (3.5) (2.0)
Interest (2.7) (2.1) (1.7) (1.3) (0.7)
Dividend paid incl of taxes (7.4) (9.9) (10.2) (11.3) (14.1)
Proceeds from IPO - 170.0 - - -
Net CF from Financing Activities (7.1) 149.3 (14.5) (16.1) (16.8)
Net Cash flow 17.2 (17.9) 38.9 27.5 1.2
Opening Cash/Cash Equivalent 2.9 20.0 8.3 47.2 74.7
Closing Cash/ Cash Equivalent 20.0 8.3 47.2 74.7 75.9
Source: Company, ICICIdirect.com Research
Page 26ICICI Securities Ltd | Retail Equity Research
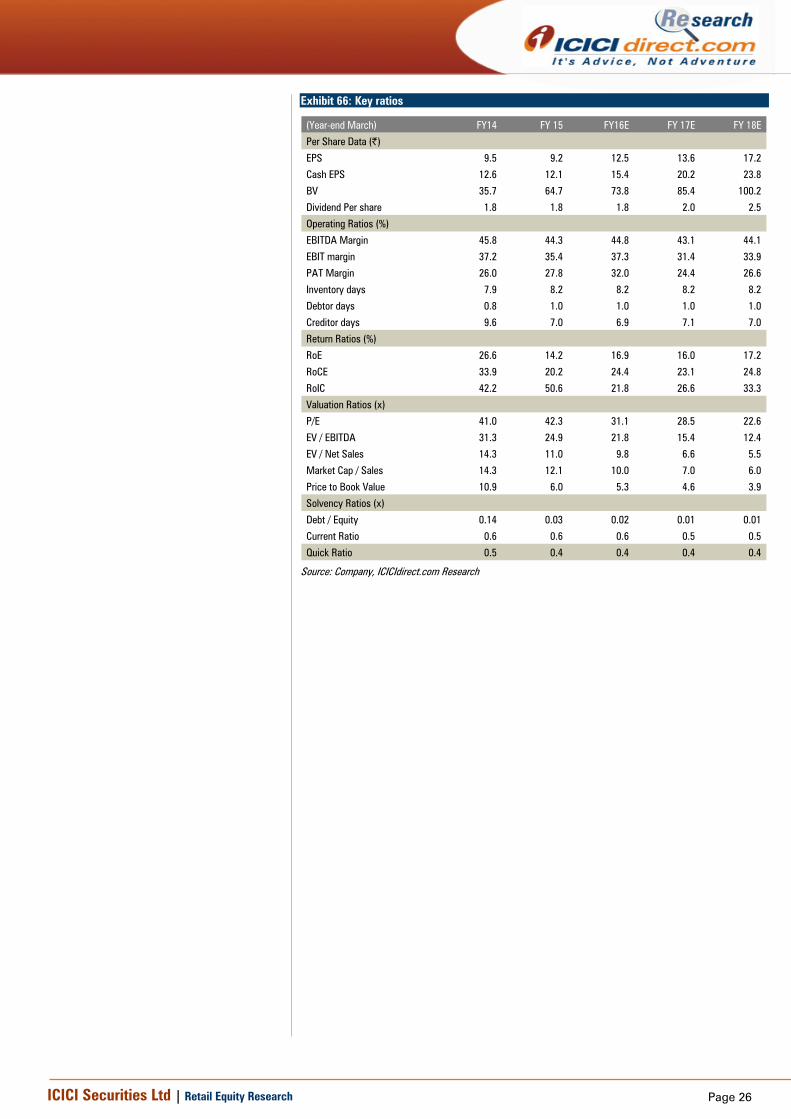
Exhibit 66: Key ratios
(Year-end March) FY14 FY 15 FY16E FY 17E FY 18E
Per Share Data (|)
EPS 9.5 9.2 12.5 13.6 17.2
Cash EPS 12.6 12.1 15.4 20.2 23.8
BV 35.7 64.7 73.8 85.4 100.2
Dividend Per share 1.8 1.8 1.8 2.0 2.5
Operating Ratios (%)
EBITDA Margin 45.8 44.3 44.8 43.1 44.1
EBIT margin 37.2 35.4 37.3 31.4 33.9
PAT Margin 26.0 27.8 32.0 24.4 26.6
Inventory days 7.9 8.2 8.2 8.2 8.2
Debtor days 0.8 1.0 1.0 1.0 1.0
Creditor days 9.6 7.0 6.9 7.1 7.0
Return Ratios (%)
RoE 26.6 14.2 16.9 16.0 17.2
RoCE 33.9 20.2 24.4 23.1 24.8
RoIC 42.2 50.6 21.8 26.6 33.3
Valuation Ratios (x)
P/E 41.0 42.3 31.1 28.5 22.6
EV / EBITDA 31.3 24.9 21.8 15.4 12.4
EV / Net Sales 14.3 11.0 9.8 6.6 5.5
Market Cap / Sales 14.3 12.1 10.0 7.0 6.0
Price to Book Value 10.9 6.0 5.3 4.6 3.9
Solvency Ratios (x)
Debt / Equity 0.14 0.03 0.02 0.01 0.01
Current Ratio 0.6 0.6 0.6 0.5 0.5
Quick Ratio 0.5 0.4 0.4 0.4 0.4
Source: Company, ICICIdirect.com Research

Page 27 ICICI Securities Ltd | Retail Equity Research
Exhibit 67: Management Profile
•15 yrs in the industry•Founded V-Guard Industries Ltd., a publicly listed company since
2008 and is currently its chairman•Post graduate degree in physics
Kochouseph Chittilappilly promoter and non executive director
•11+ yrs in the industry•Holds a masters degree in industrial engineering•Actively involved in day-to-day operations and•Management of Wonderla since 2003
Arun Kochouseph Chittilappily promoter and M.D
•37+ yrs of total work experience•Director in Muthoot finance ltd.
George Joseph chairman & non executive independent director
•Founder of Jyothy laboratories•Over 37 years of experience in sales, production and general
management
M.P. Ramachandran – Independent director
•Over 11 years of experience•Involved in the operations pertaining to food and beverages and
human resource departments of the Company since 2005Priya Sarah Cheeran Joseph
•25+ years of work experience•Prior exp at 3M India ltd, Hindustan unilever ltd•Holds a degree in engineering from BIT, Ranchi and is also an alumnus
of IIM-Bangalore
D.S. Sachdeva chief executive officer (ceo)
•17 yrs of experience• Chartered accountantNandakumar T. vp - finance
Source: Company, ICICIdirect.com Research
Page 28ICICI Securities Ltd | Retail Equity Research
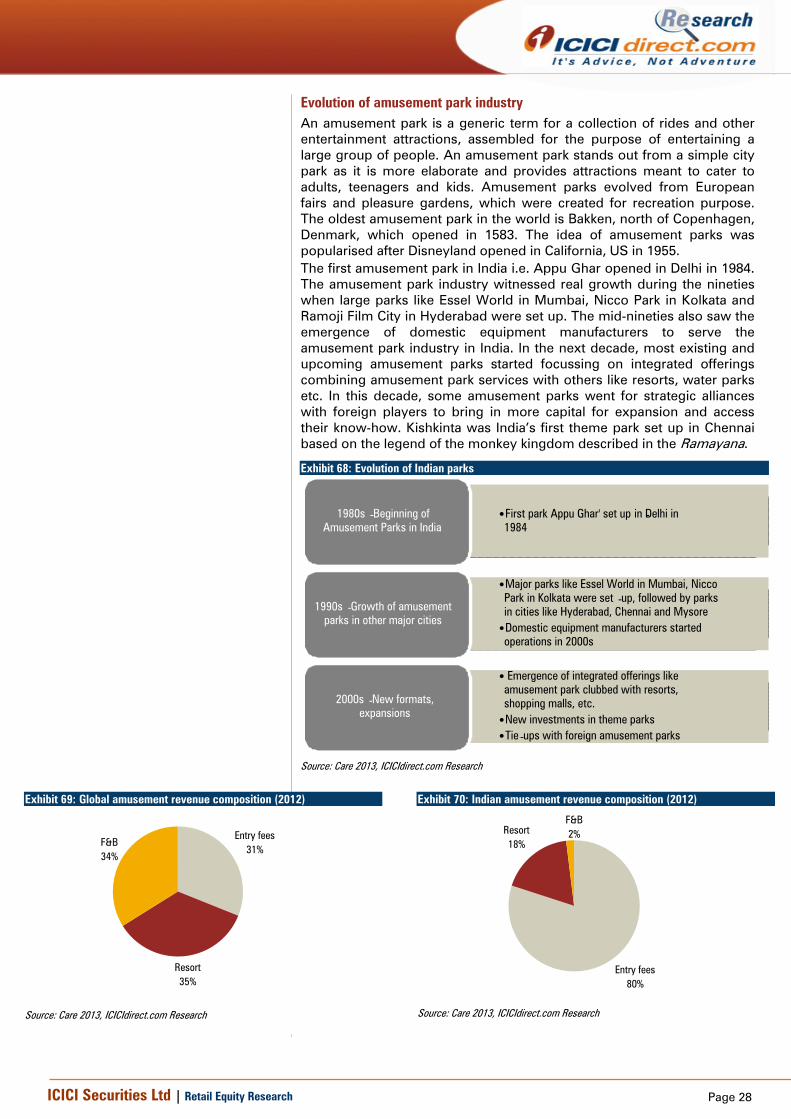
Evolution of amusement park industry An amusement park is a generic term for a collection of rides and other entertainment attractions, assembled for the purpose of entertaining a large group of people. An amusement park stands out from a simple city park as it is more elaborate and provides attractions meant to cater to adults, teenagers and kids. Amusement parks evolved from European fairs and pleasure gardens, which were created for recreation purpose. The oldest amusement park in the world is Bakken, north of Copenhagen, Denmark, which opened in 1583. The idea of amusement parks was popularised after Disneyland opened in California, US in 1955.
The first amusement park in India i.e. Appu Ghar opened in Delhi in 1984. The amusement park industry witnessed real growth during the nineties when large parks like Essel World in Mumbai, Nicco Park in Kolkata and Ramoji Film City in Hyderabad were set up. The mid-nineties also saw the emergence of domestic equipment manufacturers to serve the amusement park industry in India. In the next decade, most existing and upcoming amusement parks started focussing on integrated offerings combining amusement park services with others like resorts, water parks etc. In this decade, some amusement parks went for strategic alliances with foreign players to bring in more capital for expansion and access their know-how. Kishkinta was India’s first theme park set up in Chennai based on the legend of the monkey kingdom described in the Ramayana.
Exhibit 68: Evolution of Indian parks
Source: Care 2013, ICICIdirect.com Research
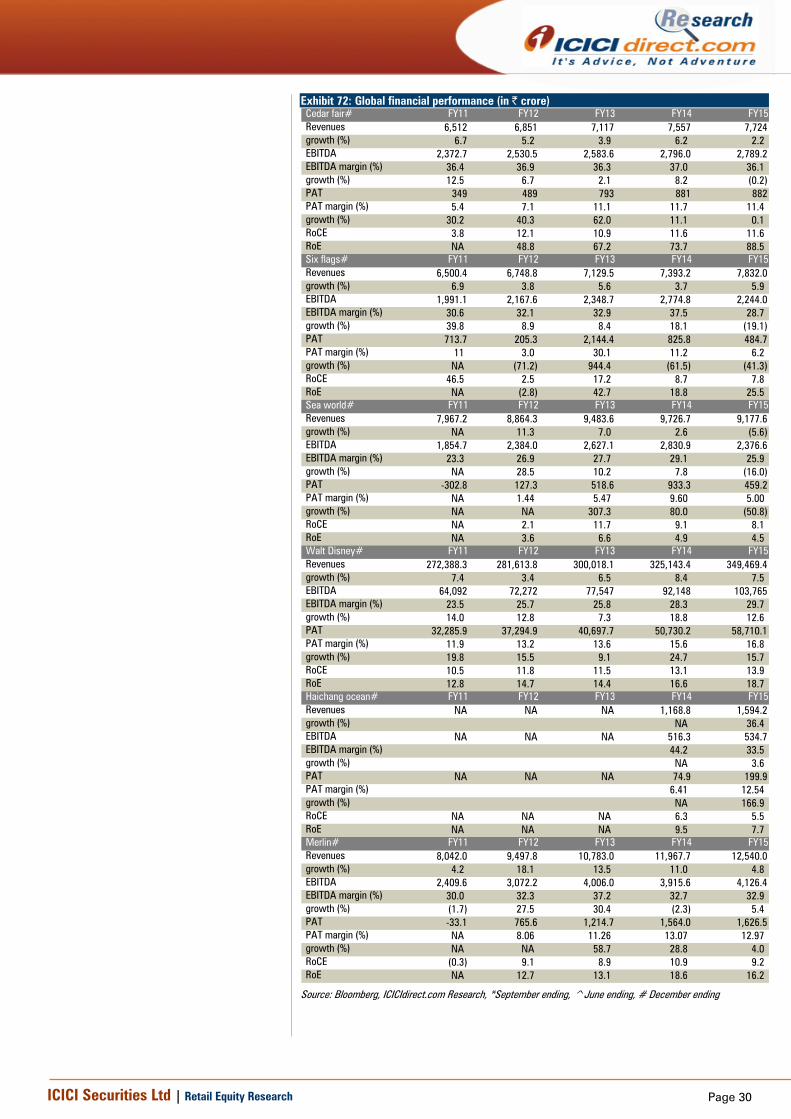
Exhibit 69: Global amusement revenue composition (2012)
Entry fees31%
Resort35%
F&B34%
Source: Care 2013, ICICIdirect.com Research
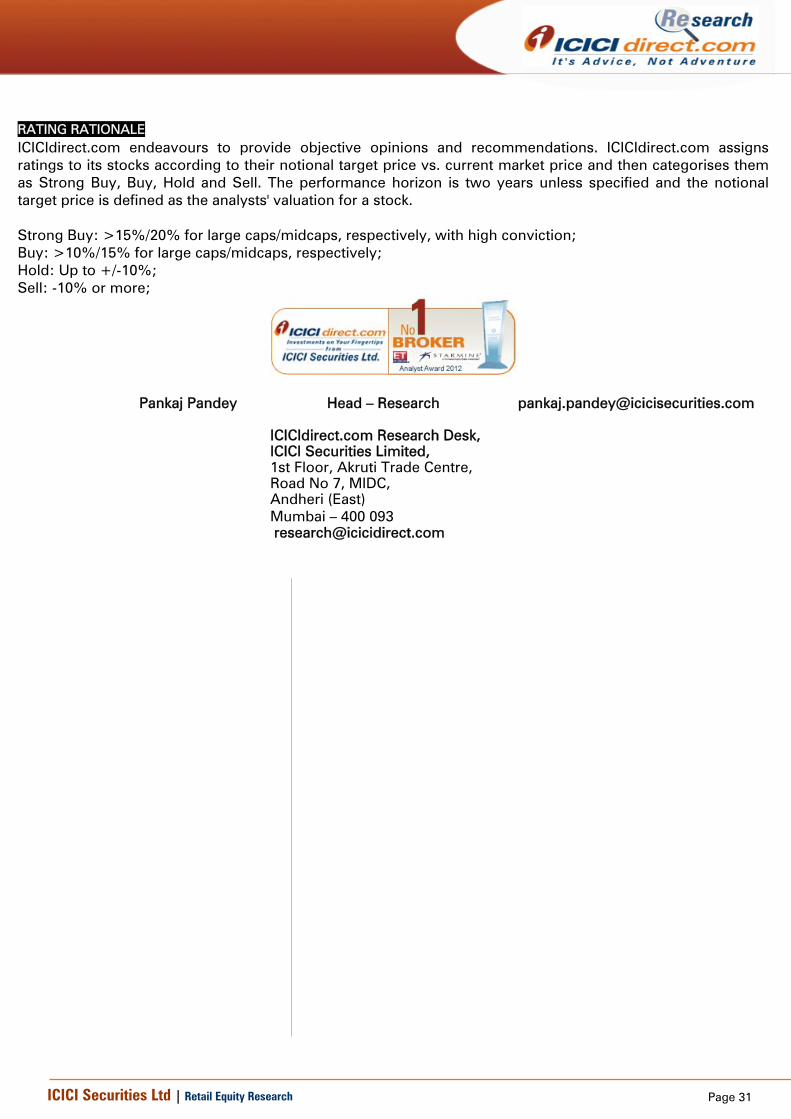
Exhibit 70: Indian amusement revenue composition (2012)
Entry fees80%
Resort18%
F&B2%
Source: Care 2013, ICICIdirect.com Research
•First park Appu Ghar' set up in Delhi in
- 1984
1980s -Beginning of Amusement Parks in India
•Major parks like Essel World in Mumbai, Nicco Park in Kolkata were set - up, followed by parks in cities like Hyderabad, Chennai and Mysore
•Domestic equipment manufacturers started operations in 2000s
1990s -Growth of amusement parks in other major cities
• Emergence of integrated offerings like amusement park clubbed with resorts, shopping malls, etc.
•New investments in theme parks•Tie -ups with foreign amusement parks
2000s -New formats, expansions

Page 29ICICI Securities Ltd | Retail Equity Research
Key authorities and regulatory structure The amusement & theme park industry in India, being a niche one, does not have any single governing authority. Broadly, the industry comes under the scope of the Tourism Ministry, which is regulated at the respective state levels. As amusement parks attract huge footfall and can boost overall tourism in surrounding areas, states across India are trying to capture the opportunity by promoting amusement parks in their respective states. Taxation: The industry falls under the purview of the various Entertainment Tax Act(s) enacted by the respective state governments under their commercial taxes departments. Since entertainment tax is levied at the state level, there is no uniformity in tax rates across states, which would otherwise have been applicable if it was levied at the central level. The tax rate across states ranges from as low as 5% to as high as even 50% in some states, irrespective of the capital expenditure incurred for setting up the park. In almost all states except Kerala, the rate is fixed on the gross ticket value (GTV), which means the tax is charged as a percentage of the per ticket per head price charged to the visitors. In case of Kerala, tax is levied as a lump sum amount depending on the capital investment in the park as also the size of the park. Entertainment tax in states like Punjab is as high as 40%. The tax rate levied by the Gujarat government is about 25% of GTV. The southern states have quite nominal tax rates: Karnataka (5% on GTV in case ticket price is above | 50), Tamil Nadu (10% on GTV), Andhra Pradesh (20% on GTV) and Kerala (lump sum amount depending on the size of the park and capital invested). Exhibit 71: Entertainment tax in southern India State Entertainment tax rate
Karnataka (Bengaluru) 5% on Gross Ticket Value (GTV) in case ticket price is above Rs. 50
Tamil Nadu 10% on GTV Andhra Pradesh 20% on GTV Kerala (kochi) lum sum on amount depending upon park size and capital invested
Source: Care 2013, ICICIdirect.com Research
Migration to Goods and Services Tax (GST): This model of dual GST will replace all the different indirect taxes (like central excise, VAT, etc) levied by the central government and state governments. Thus, various categories under ‘indirect taxes’ will come under the same roof, thereby easing the procurement of rides and other offerings by parks. The introduction of this policy will rationalise tax rates across the country and make it easier to attract FDI in this sector.
Page 30ICICI Securities Ltd | Retail Equity Research
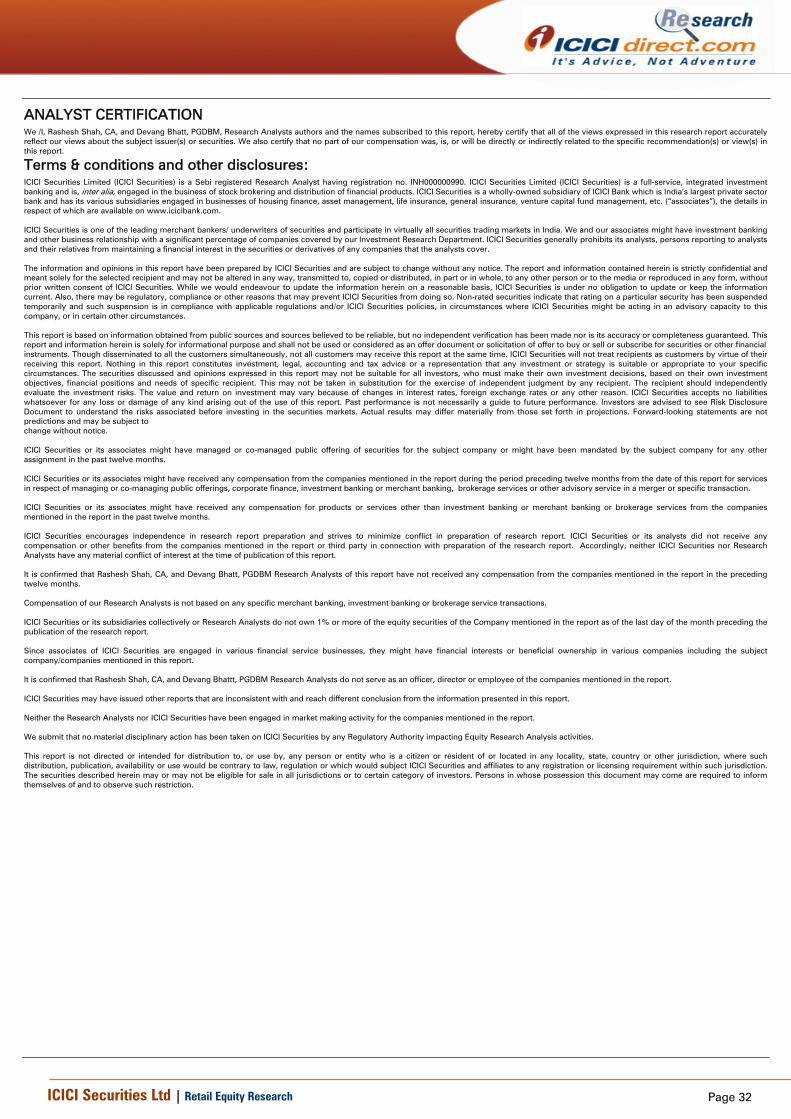
Exhibit 72: Global financial performance (in | crore) Cedar fair# FY11 FY12 FY13 FY14 FY15 Revenues 6,512 6,851 7,117 7,557 7,724 growth (%) 6.7 5.2 3.9 6.2 2.2 EBITDA 2,372.7 2,530.5 2,583.6 2,796.0 2,789.2 EBITDA margin (%) 36.4 36.9 36.3 37.0 36.1 growth (%) 12.5 6.7 2.1 8.2 (0.2) PAT 349 489 793 881 882 PAT margin (%) 5.4 7.1 11.1 11.7 11.4 growth (%) 30.2 40.3 62.0 11.1 0.1 RoCE 3.8 12.1 10.9 11.6 11.6 RoE NA 48.8 67.2 73.7 88.5 Six flags# FY11 FY12 FY13 FY14 FY15 Revenues 6,500.4 6,748.8 7,129.5 7,393.2 7,832.0 growth (%) 6.9 3.8 5.6 3.7 5.9 EBITDA 1,991.1 2,167.6 2,348.7 2,774.8 2,244.0 EBITDA margin (%) 30.6 32.1 32.9 37.5 28.7 growth (%) 39.8 8.9 8.4 18.1 (19.1) PAT 713.7 205.3 2,144.4 825.8 484.7 PAT margin (%) 11 3.0 30.1 11.2 6.2 growth (%) NA (71.2) 944.4 (61.5) (41.3) RoCE 46.5 2.5 17.2 8.7 7.8 RoE NA (2.8) 42.7 18.8 25.5 Sea world# FY11 FY12 FY13 FY14 FY15 Revenues 7,967.2 8,864.3 9,483.6 9,726.7 9,177.6 growth (%) NA 11.3 7.0 2.6 (5.6) EBITDA 1,854.7 2,384.0 2,627.1 2,830.9 2,376.6 EBITDA margin (%) 23.3 26.9 27.7 29.1 25.9 growth (%) NA 28.5 10.2 7.8 (16.0) PAT -302.8 127.3 518.6 933.3 459.2 PAT margin (%) NA 1.44 5.47 9.60 5.00 growth (%) NA NA 307.3 80.0 (50.8) RoCE NA 2.1 11.7 9.1 8.1 RoE NA 3.6 6.6 4.9 4.5 Walt Disney# FY11 FY12 FY13 FY14 FY15 Revenues 272,388.3 281,613.8 300,018.1 325,143.4 349,469.4 growth (%) 7.4 3.4 6.5 8.4 7.5 EBITDA 64,092 72,272 77,547 92,148 103,765 EBITDA margin (%) 23.5 25.7 25.8 28.3 29.7 growth (%) 14.0 12.8 7.3 18.8 12.6 PAT 32,285.9 37,294.9 40,697.7 50,730.2 58,710.1 PAT margin (%) 11.9 13.2 13.6 15.6 16.8 growth (%) 19.8 15.5 9.1 24.7 15.7 RoCE 10.5 11.8 11.5 13.1 13.9 RoE 12.8 14.7 14.4 16.6 18.7 Haichang ocean# FY11 FY12 FY13 FY14 FY15 Revenues NA NA NA 1,168.8 1,594.2 growth (%) NA 36.4 EBITDA NA NA NA 516.3 534.7 EBITDA margin (%) 44.2 33.5 growth (%) NA 3.6 PAT NA NA NA 74.9 199.9 PAT margin (%) 6.41 12.54 growth (%) NA 166.9 RoCE NA NA NA 6.3 5.5 RoE NA NA NA 9.5 7.7 Merlin# FY11 FY12 FY13 FY14 FY15 Revenues 8,042.0 9,497.8 10,783.0 11,967.7 12,540.0 growth (%) 4.2 18.1 13.5 11.0 4.8 EBITDA 2,409.6 3,072.2 4,006.0 3,915.6 4,126.4 EBITDA margin (%) 30.0 32.3 37.2 32.7 32.9 growth (%) (1.7) 27.5 30.4 (2.3) 5.4 PAT -33.1 765.6 1,214.7 1,564.0 1,626.5 PAT margin (%) NA 8.06 11.26 13.07 12.97 growth (%) NA NA 58.7 28.8 4.0 RoCE (0.3) 9.1 8.9 10.9 9.2 RoE NA 12.7 13.1 18.6 16.2
Source: Bloomberg, ICICIdirect.com Research, *September ending, ^June ending, # December ending
Page 31ICICI Securities Ltd | Retail Equity Research
RATING RATIONALE ICICIdirect.com endeavours to provide objective opinions and recommendations. ICICIdirect.com assigns ratings to its stocks according to their notional target price vs. current market price and then categorises them as Strong Buy, Buy, Hold and Sell. The performance horizon is two years unless specified and the notional target price is defined as the analysts' valuation for a stock. Strong Buy: >15%/20% for large caps/midcaps, respectively, with high conviction; Buy: >10%/15% for large caps/midcaps, respectively; Hold: Up to +/-10%; Sell: -10% or more;
Pankaj Pandey Head – Research [email protected]
ICICIdirect.com Research Desk, ICICI Securities Limited, 1st Floor, Akruti Trade Centre, Road No 7, MIDC, Andheri (East) Mumbai – 400 093
Page 32ICICI Securities Ltd | Retail Equity Research
ANALYST CERTIFICATION We /I, Rashesh Shah, CA, and Devang Bhatt, PGDBM, Research Analysts authors and the names subscribed to this report, hereby certify that all of the views expressed in this research report accurately reflect our views about the subject issuer(s) or securities. We also certify that no part of our compensation was, is, or will be directly or indirectly related to the specific recommendation(s) or view(s) in this report.
Terms & conditions and other disclosures: ICICI Securities Limited (ICICI Securities) is a Sebi registered Research Analyst having registration no. INH000000990. ICICI Securities Limited (ICICI Securities) is a full-service, integrated investment banking and is, inter alia, engaged in the business of stock brokering and distribution of financial products. ICICI Securities is a wholly-owned subsidiary of ICICI Bank which is India’s largest private sector bank and has its various subsidiaries engaged in businesses of housing finance, asset management, life insurance, general insurance, venture capital fund management, etc. (“associates”), the details in respect of which are available on www.icicibank.com. ICICI Securities is one of the leading merchant bankers/ underwriters of securities and participate in virtually all securities trading markets in India. We and our associates might have investment banking and other business relationship with a significant percentage of companies covered by our Investment Research Department. ICICI Securities generally prohibits its analysts, persons reporting to analysts and their relatives from maintaining a financial interest in the securities or derivatives of any companies that the analysts cover. The information and opinions in this report have been prepared by ICICI Securities and are subject to change without any notice. The report and information contained herein is strictly confidential and meant solely for the selected recipient and may not be altered in any way, transmitted to, copied or distributed, in part or in whole, to any other person or to the media or reproduced in any form, without prior written consent of ICICI Securities. While we would endeavour to update the information herein on a reasonable basis, ICICI Securities is under no obligation to update or keep the information current. Also, there may be regulatory, compliance or other reasons that may prevent ICICI Securities from doing so. Non-rated securities indicate that rating on a particular security has been suspended temporarily and such suspension is in compliance with applicable regulations and/or ICICI Securities policies, in circumstances where ICICI Securities might be acting in an advisory capacity to this company, or in certain other circumstances. This report is based on information obtained from public sources and sources believed to be reliable, but no independent verification has been made nor is its accuracy or completeness guaranteed. This report and information herein is solely for informational purpose and shall not be used or considered as an offer document or solicitation of offer to buy or sell or subscribe for securities or other financial instruments. Though disseminated to all the customers simultaneously, not all customers may receive this report at the same time. ICICI Securities will not treat recipients as customers by virtue of their receiving this report. Nothing in this report constitutes investment, legal, accounting and tax advice or a representation that any investment or strategy is suitable or appropriate to your specific circumstances. The securities discussed and opinions expressed in this report may not be suitable for all investors, who must make their own investment decisions, based on their own investment objectives, financial positions and needs of specific recipient. This may not be taken in substitution for the exercise of independent judgment by any recipient. The recipient should independently evaluate the investment risks. The value and return on investment may vary because of changes in interest rates, foreign exchange rates or any other reason. ICICI Securities accepts no liabilities whatsoever for any loss or damage of any kind arising out of the use of this report. Past performance is not necessarily a guide to future performance. Investors are advised to see Risk Disclosure Document to understand the risks associated before investing in the securities markets. Actual results may differ materially from those set forth in projections. Forward-looking statements are not predictions and may be subject to change without notice. ICICI Securities or its associates might have managed or co-managed public offering of securities for the subject company or might have been mandated by the subject company for any other assignment in the past twelve months. ICICI Securities or its associates might have received any compensation from the companies mentioned in the report during the period preceding twelve months from the date of this report for services in respect of managing or co-managing public offerings, corporate finance, investment banking or merchant banking, brokerage services or other advisory service in a merger or specific transaction. ICICI Securities or its associates might have received any compensation for products or services other than investment banking or merchant banking or brokerage services from the companies mentioned in the report in the past twelve months. ICICI Securities encourages independence in research report preparation and strives to minimize conflict in preparation of research report. ICICI Securities or its analysts did not receive any compensation or other benefits from the companies mentioned in the report or third party in connection with preparation of the research report. Accordingly, neither ICICI Securities nor Research Analysts have any material conflict of interest at the time of publication of this report. It is confirmed that Rashesh Shah, CA, and Devang Bhatt, PGDBM Research Analysts of this report have not received any compensation from the companies mentioned in the report in the preceding twelve months. Compensation of our Research Analysts is not based on any specific merchant banking, investment banking or brokerage service transactions. ICICI Securities or its subsidiaries collectively or Research Analysts do not own 1% or more of the equity securities of the Company mentioned in the report as of the last day of the month preceding the publication of the research report. Since associates of ICICI Securities are engaged in various financial service businesses, they might have financial interests or beneficial ownership in various companies including the subject company/companies mentioned in this report. It is confirmed that Rashesh Shah, CA, and Devang Bhattt, PGDBM Research Analysts do not serve as an officer, director or employee of the companies mentioned in the report. ICICI Securities may have issued other reports that are inconsistent with and reach different conclusion from the information presented in this report. Neither the Research Analysts nor ICICI Securities have been engaged in market making activity for the companies mentioned in the report. We submit that no material disciplinary action has been taken on ICICI Securities by any Regulatory Authority impacting Equity Research Analysis activities. This report is not directed or intended for distribution to, or use by, any person or entity who is a citizen or resident of or located in any locality, state, country or other jurisdiction, where such distribution, publication, availability or use would be contrary to law, regulation or which would subject ICICI Securities and affiliates to any registration or licensing requirement within such jurisdiction. The securities described herein may or may not be eligible for sale in all jurisdictions or to certain category of investors. Persons in whose possession this document may come are required to inform themselves of and to observe such restriction.