Embed Size (px)
Citation preview
1
Decision Making in a Dynamic Common Pool
Resource Experiment
A Major Qualifying Project Report
Submitted to the Faculty of
Worcester Polytechnic Institute
In Partial Fulfillment of the Requirements for the
Degree of Bachelor of Science
In
Economic Science
By
Zachary Chapman
Advised by
Professor Gbetonmasse Somasse
Co-advised by
Professor Alexander Smith
May 1st, 2017

2
Abstract
I present a dynamic common pool resource experiment where subjects have to make individual
withdrawals in 20 rounds of decision-making. The subjects have a group account to withdraw
from, that grows round by round depending on how much was left in the account in the previous
round. I determine if subjects allow the resource to last through all the rounds. Also I examine
what the differences are between the good and bad groups. I observed that some groups have the
ability to make the resource last and also the good and bad groups have significant differences in
their behaviors. I have found that there are differences in the frequency, persistence, and
intensity of the different kinds of behavior that they exhibit.

3
Executive Summary
Common Pool Resources (CPRs) have been studied for decades with many experiments
being run to better understand the behavior and management of CPRs. When CPRs were first
being studied there was a lot of theory developed by people such as Garret Hardin (1968) who
brought up the Tragedy of the Commons. The Tragedy of Commons is that people are self-
interested which makes them take as much of the resource as they can, which leads to the
resource being destroyed. Then people started to run experiments many of which have tried to
determine if subjects could make a resource last through rounds of decision making. They have
done this by having a group account that subjects withdraw from in each round, but most
experiments so far are static. This means that there is no growth rate in the account’s stock after
each round or, in other terms, there is no evolution of the stock over time. This does not emulate
a real life situation because a CPR such as a stock of fish reproduce over time and the stock
grows through time. In 2015, Erik Kimbrough and Alexander Vostroknutov came out with a
paper in which they ran a dynamic CPR experiment where they had a specific growth rate in
between rounds of decision making. This is more realistic, but there growth rate had a certain
threshold that if the account dropped below a certain level the resource would not grow for the
next round. This is not representative of real life because even if there is a small amount of the
resource left there should some growth for the next round.
The dynamic CPR game presented in this project uses a growth rate that was modelled
after logistic growth where there is only growth if the account has something left in it. In the lab
experiment, I ran 8 sessions with 2 groups in each session. This yielded a considerable amount of
data to examine:
1. How well do the subjects self-govern?
2. Do some groups do better than others?
3. What are the differences between the good groups and bad groups?
From the data we were able to determine that some subjects are able to self-govern well
and others could not. Once we realized this, we separated the groups into good and bad groups
based on their total profit at the end of the game to determine the differences between the good
and bad groups. To understand the differences between the groups we looked at the withdrawals
of the subjects and determined whether they are responsible, irresponsible, or constructive. I was
able to find out that there are significant differences between the responsible and irresponsible
withdrawals of the good and bad groups. If everyone in a group made the same withdrawal
decisions then with 32 LD in the account, 4 would be a responsible withdrawal because in the
next round the stock would be back up at 32 LD. An irresponsible withdrawal would be 5
because if everyone took out 5 the account would drop to 12 LD and only grow to 27 LD for the
next round. Now say there is 24 LD in the account and everyone withdrew 2 LD; that would be
constructive because that would leave 16 LD in the account which would then grow by 16 and
the next round will have 32 LD in the account. I then wanted to see whether the differences
between groups was due to three different reasons:
1. How often are the groups responsible, irresponsible, or constructive?

4
2. Are the groups persistent with their responsible, irresponsible, and constructive
withdrawals?
3. How intense are there irresponsible withdrawals?
To answer these questions I had to look at how often the good and bad groups used the
different types of behavior. Also I had to determine the proportion of irresponsible withdrawals
for good and bad groups to see how persistent they were with their behavior. Finally I looked at
how intense their behavior was. I explain how I determine the intensity in the results chapter. I
found that there is a significant difference between the frequency of responsible and
irresponsible withdrawals of good and bad groups. The good groups are more frequently
responsible than bad groups, and bad groups are more frequently irresponsible than good groups.
Also we found that the bad groups are more persistently irresponsible than good groups. In
addition, we found that the irresponsible withdrawals for the bad groups are more intense than
the irresponsible withdrawals of the bad groups. Based on my findings, I make a couple
recommendations:
1. Put a limit on the amount that people can take out from a CPR.
2. Educate people on the dangers of depleting CPRs.
These recommendations come from understanding that while some people are able to be
responsible and preserve the resource through the rounds, other people are too irresponsible and
kill the resource right away. This leads to me to believe there needs to be a limit on how much
people can take out so that everyone is responsible. I recommend educating people on CPRs so
that they understand the dangers of taking too much, since it will be very hard to enforce the
limits that are placed on CPRs.

5
Table of Contents
Abstract ......................................................................................................................................................... 2
Executive Summary ...................................................................................................................................... 3
1.0 Introduction ....................................................................................................................................... 9
2.0 Background- .......................................................................................................................................... 11
2.1 An Overview of CPRs ...................................................................................................................... 11
2.2 Potential Problems with CPRs .......................................................................................................... 12
2.3 Early Experiments Attempting to Solve CPR Problem .................................................................... 15
2.4 Dynamic CPR Experiments .............................................................................................................. 19
2.4.1 Experiments with Logistic Growth ............................................................................................ 19
2.4.2 Dynamic Experiments with Other Growth Patterns ................................................................... 19
2.5 More Experiments related to CPRs ................................................................................................... 22
2.6 Summary ........................................................................................................................................... 25
3.0 Methodology ......................................................................................................................................... 26
3.1 The Experiment ................................................................................................................................. 26
3.1.1 Participant Recruitment .............................................................................................................. 26
3.1.2 Lab Setting ................................................................................................................................. 26
3.1.3 Setup .......................................................................................................................................... 26
3.1.4 Procedure ................................................................................................................................... 27
3.2 Data ................................................................................................................................................... 29
3.2.1 Data Description ........................................................................................................................ 29
3.2.2 Social Optimum ......................................................................................................................... 30
3.2.3 Subgame Perfect Nash Equilibrium ........................................................................................... 30
3.3 Methods of Analysis ......................................................................................................................... 30
3.3.1 How Well Do Subjects Self-Govern? ........................................................................................ 30
3.3.2 Do Some Groups Do Better Than Others? ................................................................................. 31
3.3.3 What are the Differences between the Good and Bad Groups? ................................................. 32
3.4 Hypotheses ........................................................................................................................................ 33
4.0 Results- ................................................................................................................................................. 35
4.1 Behavior through Rounds ................................................................................................................. 35
4.2 Differences in Behavior between Good and Bad Groups ................................................................. 36
4.3 Summary ........................................................................................................................................... 39
5.0 Conclusion ............................................................................................................................................ 41

6
5.1 Summary ........................................................................................................................................... 41
5.2 Recommendations ............................................................................................................................. 41
5.3 Future Experiments ........................................................................................................................... 42
References ................................................................................................................................................... 43
Appendix A-Experiment Instructions ......................................................................................................... 45
Appendix B-Decision Screens .................................................................................................................... 47
Appendix B1- Decision Making Screen ................................................................................................. 47
Appendix B2: Feedback Screen .............................................................................................................. 47
Appendix B3: New Balance Screen ........................................................................................................ 48
Appendix B4: Demographic Information ............................................................................................... 48
7
Table of Figures
Figure 1: Account Growth between Rounds ............................................................................................... 28
Figure 2: Best, Worst and Average groups End of Round Stock by Period ............................................... 32
Figure 3: Persistence of IRW by Good Groups .......................................................................................... 37
Figure 4: Persistence of IRW by Bad Groups ............................................................................................. 38
Figure 5: Intensity of behavior in Good and Bad Groups ........................................................................... 39

8
Table of Tables
Table 1: Summary Statistics of Data........................................................................................................... 29
Table 2: Average Total Profit by Group ..................................................................................................... 31
Table 3: Regression of Responsible Withdrawals by Good and Bad Groups ............................................. 35
Table 4: Regression of Irresponsible Withdrawals by Good and Bad Groups ........................................... 35
Table 5: Regression of Constructive Withdrawals by Good and Bad Groups ............................................ 36
Table 6: Frequencies of behavior by Good and Bad Groups ...................................................................... 37
9
1.0 Introduction
Common Pool Resources are nonexcludable and rival in consumption which means that
anyone has access to the resource, but if someone takes some of the resource there is less of that
resource for someone else to take. A good example of a CPR is a pond with a stock of fish.
Anyone can come to the pond and take fish, but if someone tales some fish that fish is no longer
available for someone else to take. This is how the CPR dilemma was created. Since anyone can
come and take from the resource and there is nothing to stop them from taking as much as they
want, resources start to dwindle and eventually the resource will be completely depleted.
Many people have attempted to run experiments to come up with a solution to the problem.
Elinor Ostrom (1992) ran a static experiment where she concluded that individuals may be able
to arrive at joint strategies to manage these resources more efficiently. She believes that
individuals can do this if they have sufficient information to understand the allocation problem
they are facing, and individuals also need a place where they can go to discuss joint strategies
and perhaps implement monitoring and sanctioning. Since it was a static experiment, it does not
fully represent a real life CPR situation. Therefore her conclusions did not help create policy that
could fix the overuse of CPRs.
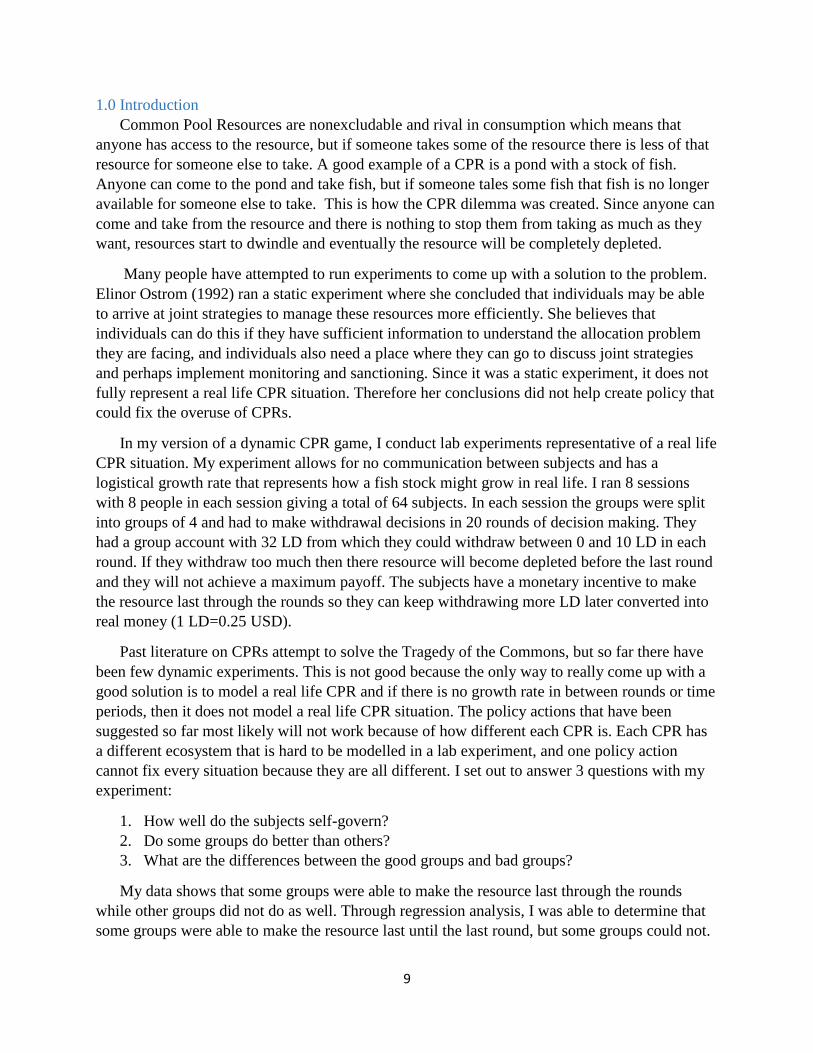
In my version of a dynamic CPR game, I conduct lab experiments representative of a real life
CPR situation. My experiment allows for no communication between subjects and has a
logistical growth rate that represents how a fish stock might grow in real life. I ran 8 sessions
with 8 people in each session giving a total of 64 subjects. In each session the groups were split
into groups of 4 and had to make withdrawal decisions in 20 rounds of decision making. They
had a group account with 32 LD from which they could withdraw between 0 and 10 LD in each
round. If they withdraw too much then there resource will become depleted before the last round
and they will not achieve a maximum payoff. The subjects have a monetary incentive to make
the resource last through the rounds so they can keep withdrawing more LD later converted into
real money (1 LD=0.25 USD).
Past literature on CPRs attempt to solve the Tragedy of the Commons, but so far there have
been few dynamic experiments. This is not good because the only way to really come up with a
good solution is to model a real life CPR and if there is no growth rate in between rounds or time
periods, then it does not model a real life CPR situation. The policy actions that have been
suggested so far most likely will not work because of how different each CPR is. Each CPR has
a different ecosystem that is hard to be modelled in a lab experiment, and one policy action
cannot fix every situation because they are all different. I set out to answer 3 questions with my
experiment:
1. How well do the subjects self-govern?
2. Do some groups do better than others?
3. What are the differences between the good groups and bad groups?
My data shows that some groups were able to make the resource last through the rounds
while other groups did not do as well. Through regression analysis, I was able to determine that
some groups were able to make the resource last until the last round, but some groups could not.
10
I was able to identify why those groups were not able to do as well through some statistical
techniques such as regression analysis. I found that the bad groups were less frequent with their
responsible withdrawals and much more frequent with their irresponsible withdrawals than the
good groups. Also I was able to find that the irresponsible withdrawals of the bad groups were
more intense than the good groups which lead to them killing the resource fairly early in the
game.
My results show that subjects are not able to self-govern themselves. Some subjects are very
frequent with their irresponsible withdrawals, others are persistently irresponsible, and a few
people tend to make extremely irresponsible withdrawals. This leads me to suggest that policy
action needs to be taken to limit the amount of a resource someone can take out one time and
also educate the general population on the importance of preserving CPRs. A possible future
project could involve adding a one-shot communication within the groups from my experiment.
This could allow for the subjects to come up with joint strategies to preserve the resource, but
also could educate the subjects and how to play the game.
11
2.0 Background-
The proper management of Common Pool Resources (CPRs) is something that many
economists have tried to figure out for a long time. CPRs are resources that are similar to public
goods, except that CPRs also face problems of overuse because they are rival in consumption. A
common example of a CPR is a fishery. There are many fishermen trying to catch fish. If a
fisherman catches a fish, then obviously another fisherman cannot catch that same fish. Each
fisherman is trying to catch as many fish as they can so they can receive more benefits, but while
every fisherman is trying to catch as many fish as they can, it takes fish away from the stock that
was in the fishery and therefore takes fish away from other fishermen. The CPR dilemma is how
to manage the resource to make sure that people do not overuse and deplete it. In the remainder
of this chapter, I will be investigating past research on CPRs. There has been a lot of research on
the subject and many different conclusions have come from the theoretical and experimental
research. I will start by looking at the theoretical work and explain the CPR Dilemma in more
detail, and then I will look at how the experiments have changed from when Economists first
started looking at CPRs up until the present day. This will allow me to understand where the
research is at this point and how I can add to it with my experiment. Also I want to take the
knowledge from past experiments and compare them to my experiment.
2.1 An Overview of CPRs
Paul Krugman (2006) defines four types of goods: private, public, common resources,
and artificially scarce goods. Private goods are excludable, meaning the suppliers of the good can
prevent people who do not pay for consuming it, and they are rival in consumption, meaning the
same unit of the good cannot be consumed by more than one person at the same time. Public
goods are nonexcludable and nonrival in consumption, common resources are nonexcludable and
rival in consumption, and artificially scarce goods are excludable but nonrival in consumption.
Therefore common resources are open to everyone, but if someone takes some of the resource,
then no one else can take what that person had already taken. This leads to the concept of
externalities.
Externalities are both positive and negative where the positive externalities are the
external benefits and negative externalities are the external costs to society. The negative
externalities of CPRs are the negative effects that come from someone withdrawing from the
resource. For example, if a fishermen catches a certain number of fish there is a negative
externality on other fishermen because there are less fish to catch. There are a few ways to make
CPR users internalize the costs they impose on others. First there could be a tax on the resource
or some sort of regulation that limits how much of a resource can be withdrawn per person.
Secondly, a system of tradable licenses for the right to use the common resource can be created.
Lastly, the common resource could be made excludable and assign property rights to some
individuals. Therefore the dilemma involved with CPRs is how to limit the effects of negative
externalities on society and what action should be taken to limit the use of a resource to keep it
from being depleted.
Garrett Hardin (1968) summarizes the Tragedy of the Commons by arguing that Adam
Smith’s “invisible hand” contributed to a dominant tendency to assume that decisions reached
12
individually will, in fact, be the best decisions for society. Therefore Hardin argues that when
thinking about common resources, people believe that what is good for them will be good for
society so they will keep taking from the resource until their benefit from an additional unit of
the resource is less than the cost. When in fact people are really trying to benefit themselves over
society. Hardin then brings up an example where a herdsman asks himself “What is the utility to
me of adding one more animal to my herd?” (Hardin, 1968, page 1244). When the herdsmen
asks that question he sees that by adding another he reaps the benefits of all the proceeds from
the sale of the additional animal and his negative component is only a fraction of what he would
receive. So adding another animal would be good for him and he would just continuously add
more animals until they have nowhere to graze anymore and they die off. So basically, each man
is locked into a system that compels him to increase his herd without limit in a world that is
limited. This example is a very good way to describe the Tragedy of the commons in a real life
situation.
Hardin also suggests that morality plays a key part in peoples decisions meaning that
people with good morals would understand that they cannot withdraw too much of the resource
so that others can also withdraw from the resource and it will not become depleted. This morality
principle is important when I analyze my data because I will need to differentiate between
participants that are moral and will withdraw the correct amount to keep the resource from being
depleted and participants that are not moral and withdraw whatever amount they want regardless
of their groupmates. Hardin’s biggest argument is that with the population growth we will have
to concede to the tragedy of the commons. This means that with more people there has to be
more regulation on the commons to provide for everyone. Since Hardin’s paper, more educators
have attempted to solve the problem involved with CPRs.
2.2 Potential Problems with CPRs
There are a couple of early papers that attempt solving the problem of CPRs through
theory rather than experimentation. Scott Gordon (1954) mainly focuses on the fishing industry
for his research into common pool resources. He uses many theories from different people, but
before his time there were not many economic views of the subject. All of the papers regarding
the fishing industries problem of overfishing took a biological view toward the problem. Since
they took the biological view, they looked more into the environmental factors that lead to the
depletion of fish including their predators and food sources which is not what Gordon wants to
research. He instead researches how users of a resource change their actions due to policy
changes. To do this, he did research into when Europe introduced limits on catching fish. When
this happened people began to notice an increase in growth of the fish population. Therefore it is
possible that the outside effect of fishermen could be having a bigger effect on the fish
population than people had originally thought. Gordon argues that these limitations are a good
thing and can help with overfishing, but there are also problems with these limitations because it
made people more competitive and people would start spending more money on fishing gear that
would allow them to get to the fish before their competitors. Also when people start spending
more money on their gear then they need to catch more fish to compensate for the larger cost.

13
Gordon also argues that with some policy changes the fish population did not increase
because of the limitations, but did so coincidentally. He then discusses by W. F. Thompson
(1954), which shows that with an agreement between Canada and the US, the Pacific halibut
fishery introduced a fixed-catch limit which ended up showing a significant rise in the fish
population. When in actuality a careful study of the statistics indicates that the estimated
recovery of halibut stocks could not have been due principally to the control measures, for the
average catch was, in fact, greater during the years of fish population growth. This paper is the
first to suggest that government intervention in CPRs is not necessarily needed to keep them
from being depleted because past government intervention was not the reason for the increased
resource stock. This means that there is another factor that is influencing user’s actions, and that
factor should be the basis for future research.
Adding on to Gordon’s theory, Roy Gardner et al. (1990) went further into depth to find
out individual incentives in CPRs and find that certain factor that Gordon noticed was there.
They set out to see how various types of institutional arrangements and individual incentives
used in relation to CPRs will lead to improved collective action problems. They end up using
past research which presumes that when individuals use common resources jointly, each
individual is driven by logic to take more of the resource than is optimal for all users. They
classify this condition as a CPR dilemma. Then the authors lay out 4 assumptions that are
required for a CPR dilemma. These four assumptions are:
1. if one person withdraws a resource unit, that unit is now not available to everyone else
2. there are multiple people withdrawing units of the same resource
3. the strategies that the individuals come up with depending on the physical system,
technology, rules, market conditions, and attributes of the individual will lead to a
suboptimal outcome from the individual’s perspective
4. there is at least one strategy that is more efficient than all other decisions where the
benefits exceed total cost
The first assumption is more commonly known as rivalry in consumption. This is an obvious
assumption, but very important in our experiment because it factors into the decision making
process of how much each group member chooses to withdraw each round. When the subjects in
the experiment understand this assumption it makes them more likely to withdraw smaller
amounts than they want each round to allow other group members to withdraw amounts small
enough to make the resource last. So basically as long as the withdrawal rate does not exceed the
natural replacement rate, the resource will not be exhausted. The second assumption also factors
into the individuals’ decision making process similar to assumption 1. Assumption three is
basically, their decision to withdraw less to allow others to withdraw and to allow the resource to
be sustainable is less than optimal for the individuals themselves. This does not mean that it is
less optimal for the group of people using the resource, just the individuals themselves. Without
assumption four there is no reason for people to try and come up with a strategy that helps
everyone which leads to people only focusing on their own benefits and creates the problem of
the commons.
14
Gardner et al. (1990) argue that theorists are split up into two groups when it comes to
solving CPR problems. The first group believes that government action needs to take place to
regulate CPRs, and the second group believes that private property rights need to be imposed
which leads to the division of the commons into small chunks of private property and by doing
this individuals are incentivized to produce optimal outcomes. This means that past theorists
believe that one solution can be used for all CPR situations, but Gardner et al. believe that
thinking of all CPR situations as CPR dilemmas causes several errors. First is that by thinking of
CPR situations as CPR dilemmas there is a presumption that whenever multiple individuals take
units from the resource suboptimal outcomes will occur, which is not always the case.
Sometimes the quantity demanded is not high enough for individuals to pursue strategies that are
suboptimal. Meaning that the resource does not have a high enough demand for people to
withdraw too much of the resource because they will not receive any more benefits from an
additional unit of the resource.
Another error that comes from thinking of CPR situations as CPR dilemmas is that in
addition to CPR situations being CPR dilemmas there are also some situations where there is a
non-problematic CPR or a resolved CPR. An example of a non-problematic CPR is where the
CPR users have come up with a strategy by themselves that will lead to the resource not being
depleted. With that in mind, when reforms are made the non-problematic CPRs and resolved
CPRs are included in the sweep of policy recommendations. So these policy changes could
unravel an already Resolved CPR situation as the solution imposed from the outside does not
account for the prior solution evolved by the individuals themselves.
There are also sub problems within each individual CPR situation. One of which is that
not all situations are structured like the Prisoner’s dilemma, where two rational individuals might
not cooperate, even if it appears that it is in their best interest to do so. Some are structured like
an Assurance game where no one person’s contribution is sufficient to gain a collective benefit,
but both person’s contribution will produce joint benefit. Meaning that both layers would prefer
to contribute to the provision of a collective benefit if and only if the other player also
contributes. I think this is very important to take into account in our experiment because it could
be possible that if one person in the group withdraws a large amount that is not beneficial to
everyone, then the other group members will then change their decisions and start withdrawing
more based on the fact that not everyone is contributing to the common good.
James Walker et al. (1990) then turn to look at how each CPR situation is different for the
consumer. They believe that problems that individuals face when dealing with CPR situations
can be put into two groups: appropriation and provision problems. With appropriation problems,
the production relationship between yield and level of inputs is assumed to be given and the
problem to be solved is how to allocate the yield in an economic and equitable way. To solve this
problem they believe that focusing on the allocation of the yield of a resource in terms of the
quantity of resource units to be appropriated or the dual problem of determining the efficient
level and mix of input resources necessary for obtaining that yield, the timing and location of
appropriation, and the appropriation technologies adopted is the way to go. When thinking about
appropriation problems I think it is important to look at technological externalities. These occur
15
when the presence of some users or their technologies increase production costs for other users.
This is very important in CPR situations because when production costs increase for certain
individuals they start withdrawing more of the resource to make up for those costs creating a
problem. Another important aspect of appropriation problems is rent dissipation. Rent is
basically the benefit that the individual receives from the resource. So the problem with rent
dissipation is that the rent gets smaller whenever the marginal returns are not equal to the
marginal costs. This means that the strategic behavior of the individual makes it so they will
invest inputs as long as the average return exceeds the marginal cost.
Provision problems, on the other hand, are related to creating a resource, maintaining or
improving the production capabilities of the resource, or avoiding the destruction of resource
systems themselves. So basically they focus on the behavioral incentives for individuals to
contribute resources for the provision or maintenance of a CPR, supply side provision or alter
appropriation activities within an existing system in such a manner as to change the withdrawal
patterns from the CPR so as to maximize multiple period returns or even possibly avoid the
extinction of a biological resource, demand side provision. This is a very important part of CPR
situations because the main problem policy makers are trying to fix is making sure the resource
lasts. The authors believe that even though individuals face combinations of appropriation and
provision problems, it is better to analyze them as two separate problems to gain a clear
understanding about what is involved in reducing the severity of each problem. So, basically
Walker et al. believe that all CPR situations are different and there cannot be one solution to all
the problems.
2.3 Early Experiments Attempting to Solve CPR Problem
Walker et al. (1990) investigated the strength of the theoretical models that have been out
forth by other authors which predict that users of common pool resources will appropriate units
at a rate at which the marginal returns are greater than marginal costs. They put forth the idea
that given that individuals appropriate resource units in a setting where marginal changes in that
appropriation have external effects on the costs of the appropriation and increases in the level of
appropriation by individual users lowers the marginal physical product to investment by all
users, the external nature of this effect and the lack of well- defined property leads to individuals
ignore the marginal effects and focus on average returns from investment. Meaning that the
individuals are focusing on the wrong thing which leads to a dissipation of the rent or benefit
they would receive. This all means that they are trying to see why people end up withdrawing too
much of the resource.
The experiment consisted of groups of people that are given a certain amount of tokens at the
beginning of the game. They are then allowed to invest their tokens into one of two markets. The
first market was an investment opportunity where each token yielded a fixed rate of output and in
which each unit of output yielded a fixed rate of return. The second market is a market which
yielded a rate of output per token dependent upon the total number of tokens invested by the
entire group. The subjects were then informed that they would receive a level of output from
market 2 that was equal to the percentage of total group tokens they invested and that each unit
of output from market 2 yielded a fixed rate of return. So basically market 2 is the CPR where

16
the total output is what everyone puts into the market rather than in market 1 where there is a
fixed rate of output per token. So basically if someone invests too much to market 2 then there
will be a negative externality on everyone else because as a group they will end up investing
over the socially optimum level.
The important part of this experiment is that the subjects have experience with a similar
decision game which increases the likelihood of them understanding the problem and the
repercussions of alternative levels of individual and group investment decisions. This is
important when looking at this experiment because it does not simulate what would happen in
real life. When common people are faced with a decision regarding CPRs they do not have this
understanding of what their decisions will do to others therefore they will do what they think is
best for them. The authors then use three predictions that will help in describing the results of the
experiment. First is that entry is limited to eight players with a fixed level of input of tokens.
Second, the marginal opportunity cost of investing in the CPR is constant because the return per
token from market 1 is constant. Lastly, the value of output units produced from investments in
market 2 is constant. With these predictions the authors are using an environment that is closely
related to a limited-access CPR in their experiment.
They ran this experiment with some groups having a 10 token endowment for each
subject and some groups of having a 25 token endowment per subject. They saw a glaring
disparity between the rents accrued for the different endowments. They found that the average
level of rents accrued in the 10 token design equaled 37.2% whereas in the 25 token design the
average level was 3.16% (Walker et al. 1990). They also found a pattern in when people reduce
their investment in market 2. They noticed a pulsing pattern where rent is reduced, at which time
the investors tend to reduce their investments in market 2 which lead to an increase in the rent.
Even with this pattern there was not symmetry across the experiments in the amplitude of the
timing of the rent peaks. This means that there was not one specific time where all the groups
changed their investments when they saw the rent decreasing. It is important to note that they
also did not see any clear signs that the experiments were stabilizing as the rounds went on. This
is important because this means that it is tough for people to find the right level of investment by
themselves, therefore their needs to be a policy to help people make the right decisions. Also the
data shows that when the capital available for appropriation increases, the severity of the
problem increases.
Then in a paper without Elinor Ostrom, Walker and Gardner (1992) combat the problem
of the destruction of a CPR. They believe that there is a range of safe yield in each CPR and
there is a natural regeneration process present that implies a certain range of exploitation in
which the probability of destruction is zero. Also, if that specific safe yield is surpassed, the
resource faces probabilistic destruction. This means that people have a dilemma between
whether they want to jeopardize the life of the resource or earn benefits from the resource. The
authors created five experiments with the design 1 that the safe zone is a single point and 7
experiments with design 2, the safe zone being an interval. Design 2 led to higher efficiency and
the resource lasted longer. This is kind of misleading because in only two of the experiments
with design 2 did groups follow an investment pattern generally in the vicinity of the good
17
subgame-perfect equilibrium and in the remaining five experiments with design 2 groups
followed an investment pattern dispersed around the bad subgame-perfect equilibrium.
Walker and Gardner conclude that this data does not bode well for CPR survival in
environments where no institutions exist to foster cooperative behavior. Even though there is a
focal point Nash equilibrium which yields near-optimal rent, the subjects tend to not be able to
stabilize at the equilibrium point. Also, even though the renewable resource in the experiment is
well defined, in real life the one period payoffs fluctuate wildly. For example, in a fishery the
fish reproduce at different times and at different levels so it is very tough to simulate those
fluctuations. This fact leads Walker and Gardner to conclude that it is going to be tough to come
up with the best policy to improve low efficiencies because it will take time to learn natural
settings and by that time the resource might already be destroyed. They also conclude that the
behavior in their laboratory CPR environment adds additional evidence to field data regarding
the need for well-formulated and –tested institutional changes designed to balance appropriation
with natural regeneration.
Elinor Ostrom then joins back up with Walker, and Gardner to further extend their work
with the probabilistic destruction of a resource to find out the best way to govern CPRs (Ostrom
et al, 1992). After Walker and Gardner’s experiments in their last paper, (Walker and Gardner,
1992), they believed that the resource would surely become extinct if an institution was not put
in place governing a certain CPR. They took this a step further with the help of Ostrom, and
came up with a couple of different experiments to test whether people could come up with their
own agreements that would allow everyone to benefit from the resource or if they need an
institution to come up with rules and enforce them.
They also added another aspect into their experiments in terms of communication
between group members. In these experiments they had some experiments have a one-time
communication between members in which they are allowed to come up with a strategy that will
help everyone, and some experiments with repeating communication after each round. I believe
that adding this variable of communication was what lead them to change their views of what the
best policy is for CPRs. In addition to the communication, they also added an element of
punishment where participants can fine other group members. This is a monetary fine that can be
levied, but the person who levies the fine incurs a fee as well. This leads to interesting results
when this punishment mechanism is introduced. They first believed that there needed to be
institutions in place to govern CPRs, but after these experiments they realize that given the
chance to communicate with each other the people and punish others using the CPR, people have
the ability to devise a strategy that will help everyone and the resource itself.
The experiments lead Ostrom et al. to come up with two major implications. The first is
that policymakers responsible for the governance and management of small-scale, CPRs should
not presume that the individuals involved are caught in an inexorable tragedy from which there is
no escape. Individuals may be able to arrive at joint strategies to manage these resources more
efficiently. The authors believe that individuals can do this if they have sufficient information to
understand the allocation problem they are facing, and individuals also need a place where they
can go to discuss joint strategies and perhaps implement monitoring and sanctioning. The second
18
implication was that in finitely repeated social dilemma experiments, a wide variety of
treatments that do not change the theoretically predicted subgame consistent equilibrium
outcomes do change subjects' behavior. This means that the changes they made in each
experiment, whether it be how much communication the group had or the endowment they
started with, changes the individuals behavior.
I agree with their conclusions because in their data, the difference between the net yield
when the subjects could communicate and when they could not was especially large. They said
that in the low endowment CPR environment, average net yield increased from 35% (when no
communication was allowed) to 99% (when communication was allowed on a repeated basis).
Also, in the high-endowment CPR environment, average net yield increased from 21% (when no
communication was allowed) to 55% (when communication was allowed only once) to 73%
(when communication was allowed on a repeated basis). This is a glaring statistic, and is very
important when talking about policy action toward CPR environments. This data shows that
people have the ability to come up with a viable solution to their problem with communication
instead of having someone else tell them what they can and cannot do. I think there is a way to
incorporate behavioral economics into this, because you could say that people are more willing
to go along with rules that they came up with themselves rather than rules that were imposed on
them by someone else. This tendency is often referred to as the “democracy premium” (Dal Bo
et al. 2010). So allowing the communication between subjects, the authors of this paper are
allowing the subjects to make their own rules which they are more likely to follow because they
came up with the rules by themselves rather than some unknown institution.
Also they have conclusions involving what happens when the punishment mechanism is
introduced. With an imposed sanctioning institution and no communication they found subjects
are willing to pay a fee to place a fine on another subject far more than was predicted, and in the
high-endowment environment, average net yield increases from 21% with no sanctioning to 37%
with sanctioning. When the costs of fees and fines are subtracted from average net yield,
however, net yield drops to 9%. This shows that subjects overuse the sanctioning mechanism,
and sanctioning without communication reduces net yield. Then when they examined only the
high-endowment environment, they found that with an imposed sanctioning mechanism and a
single opportunity to communicate, subjects achieve an average net yield of 85%, and when the
costs of fees and fines are subtracted, average net yield is still 67. These represent substantial
gains over the baseline, where the net yield averaged 21%. Also with the right to choose a
sanctioning mechanism and a single opportunity to communicate, subjects who adopt a
sanctioning mechanism achieve an average net yield of 93%. When the costs of fees and fines
are subtracted, average net yield is still 90%. In addition, the defection rate from agreements is
only 4%. Also, subjects who do not adopt a sanctioning mechanism achieve an average net yield
of only 56%. In addition, the defection rate from agreements is 42%. This reinforces the idea that
when people are allowed to choose the institution that has control over how much people can
withdraw from a resource, they are more likely to follow the rules.

19
2.4 Dynamic CPR Experiments
The dynamic experiments involved with CPRs can be separated into two sections. The
first section includes papers that did experiments with a logistic growth pattern. The second
section includes papers with experiments that have different growth functions that lead to some
interesting conclusions.
2.4.1 Experiments with Logistic Growth
The first paper that modeled dynamic growth was written by Andrew Muller and Finlay
Whillans (2008). They were also the first to introduce a logistic growth rate after each round.
They ran 4 laboratory experiments: a static model with no communication, a static model with
communication, a dynamic model with no communication, and a dynamic model with
communication. This allowed them to model what happens in real life because in real life there is
the possibility of communication and it is a dynamic environment. The results from the static
environment were very comparable to earlier studies. In the absence of communication,
appropriation effort converged rapidly to the Nash prediction and cycled around it. Introducing
non-binding communication clearly reduced average effort and increased efficiency, with clear
differences in the ability of groups to achieve coordination. Behavior in the dynamic
environment was, on first impression, very different from that in the static environment. In
almost all cases subjects responded to changing stock levels by varying their fishing effort over a
much wider range. Introducing non-binding communication allowed subjects to hold back on
current effort to build up stocks, and most groups exploited this opportunity.
The effort to start using a dynamic environment with logistic growth patterns in
experiments did not end with Muller and Whillans (2008). Another paper with a dynamic
environment and a logistical growth rate is the one done by Charles Noussair et al. (2015). In
their experiment, instead of using a laboratory setting, they use a field setting where there are
actual fishermen fishing from a pond. In each session, sixteen fishermen were assigned to groups
of four, with fixed membership. Fishing took place in four periods of 1 hour each. Subjects could
catch as many fish as they liked, as long as total catch did not exceed the stock available to their
group. Regeneration was mimicked by throwing in extra fish at the end of each period depending
on the number of fish remaining (Noussair et al. 2014). They ended up concluding that there was
no evidence of cooperation. Their results were consistent with standard economic theory that
assumes selfish preferences and non-cooperative behavior. The difference between their results
and results from past laboratory experiments show that contextualization is important when
testing a renewable resource model. To achieve good social outcomes in the field setting they
used, voluntary cooperation is not enough, and specific institutions that promote cooperation,
such as punishment technologies or voting processes, may be required.
2.4.2 Dynamic Experiments with Other Growth Patterns
Anabela Botelho et al. (2013) integrated the two main features involved in CPR
dilemmas, evolution over time and management under uncertainty. While each of these two
features has been analyzed separately in the experimental literature, no attempt has been made to
integrate them into a single experimental setup. In this paper, they seek to examine whether the
conclusions derived from models of dynamic games with no environmental uncertainty are still

20
valid when uncertainty is introduced, and whether the conclusions from static models of
environmental uncertainty in the basic CPR game transfer to time-dependent settings. This
experiment is different from other dynamic experiments because there is not a growth rate that
affects the stock after each round, but there is a different stock every time between two different
uncertainty levels.
Through this experiment they seek to answer two questions that cannot be answered
without integrating both of the features discussed above. These questions are, what are the
strategies that appropriators adopt when both environmental uncertainties and temporal
considerations are present, and are the strategies that they adopt sensitive to different levels of
environmental uncertainty? In their experiment design there were two different uncertainty
levels. With high uncertainty the participants were told that each round will begin with a
resource size between 150 and 850 and they can withdraw up to 850 tokens. If the tokens taken
by the group in total was more than the resource size then no one will get a payoff and the game
will be over. This leads to people choosing small amounts of tokens so they do not go over the
resource size and can continue the game. With low uncertainty the resource size is anywhere
from 270 to 730 and participants can withdraw the same as in high uncertainty. This group has
the ability to take more tokens than the high uncertainty group because they have a smaller range
of values from the resource size and have a better idea of what the size will be for each round.
They end up concluding that the CPR users quickly use up the resource and end the
game. This means that with uncertainty over the size of the resource CPR users are not able to
come with decision strategies that leads to the resource becoming sustainable. This experiment is
similar to our experiment because we focus on decision making over time, but I think our
experiment relates more to real life because in their experiment they have a random resource size
for each period instead of having a starting resource size that grows after each round depending
on what is left after each round. The only uncertainty aspect in our experiment is that each
participant does not know who is in their group whereas in their experiment there is uncertainty
with the resource size. I think to enhance their experiment, the first round of the game should
have an uncertain resource size, but then after that round if the resource is not extinguished it
should grow with a certain growth rate each round. I think this simulates a more realistic CPR
dilemma and could offer new conclusions to add to their paper.
Caroline Schill et al. (2015) run a laboratory experiment to answer the question: How
does the risk of an undesirable ecosystem regime shift influence user group exploitation
strategies and collective action? Their experiment is very similar to ours, they took a bunch of
students and put them in groups of four and they had a stock of 50, but the participants could
take up to 50 out at one time. Also they had a similar regeneration pattern as us, but once the
stock level gets below 20, the regeneration drops off which makes it almost impossible to come
back from. This means that if a participant takes too much and the stock gets below 20, the
regeneration rate drops off and the group will exhaust the resource in the next round or two.
They also did not disclose the number of rounds to the participants so now they do not know
when the experiment will be over and will not be inclined to exhaust the resource at the end of
all the rounds. Also the participants were allowed to communicate orally to their group mates to
21
disclose their individual harvesting rates, where we do not disclose who is in what group so they
cannot communicate.
They end up concluding that that whether or not people face such a latent shift with
certainty or different risk levels does not make them more or less likely to exploit the resource
beyond its critical potential threshold. Even though this was their conclusion I wonder if the
results would have been different without communication. I believe that if there was no
communication then people would be more likely to exploit the resource because they do not
have the social pressure of limiting their exploitation.
In 2015, Erik Kimbrough and Alexander Vostroknutov furthered the work done by Schill
et al. (2015). In this paper, they also use a dynamic environment and a similar growth rate in
between rounds of the laboratory experiment. Kimbrough and Vostroknutov’s growth rate is
liner with a certain threshold. Whenever subjects take tokens from the group account, its size
diminishes by the sum of the tokens taken. Before the next period, the group account replenishes:
if there are X tokens remaining, then next period the group account will contain X+ β(360-X)
tokens (β is the treatment-dependent growth rate). However, if the number of tokens remaining
falls below 30, then the group account would not replenish. This is similar to other growth rates
in the past, but it models a real life CPR environment better than past growth rates.
In their paper they bring up a really good point about CPR users and how they are broken
up into two groups, rule-breakers and rule-followers. Where groups of rule-breakers may deplete
a resource that would otherwise be preserved and groups of rule-followers may preserve a
resource that would otherwise be depleted. They also hint at the importance of assortative
matching and the exclusion of rule-breakers to the successful management of CPRs. This is very
important when I end up analyzing the data from our experiment because I need to be able to
distinguish between groups that follow the rules and preserve the resource until the end of the
game, and groups that break the rules and deplete the resource prior to the last round.
Their experiment is pretty similar to ours, but they uses a couple different resource
growth rates which leads to some important conclusions. Also, unlike our experiment they run a
rule following game where they test if people will follow the rules even though it will cost them
more money. They simulate a character walking across the screen with 5 red lights, if the player
waits at the red light instead of just walking through then they incur a fee. This will show if
people will follow the rule of the red light or try to maximize their money by not incurring the
fees involved with waiting at the red light. After this test, they used the results to sort participants
into groups for the CPR experiment. This allows them to see whether the presence of rule-
followers can lead to the preservation of a low resource growth rate CPR.
They end up siding with Gardner et al. (1990) in the conclusion that there is a very strong
relationship between ecological and social factors in preserving CPRs. They also concluded that
when the resource growth rate is high, the presence of rule-followers is still needed to preserve
the resource, but not everyone in the group had to follow the rules. Then when the resource
growth rate was low, only groups composed completely of strong rule-followers could preserve
the resource. This is very important when studying all the CPRs in the world because each CPR
22
situation has a variety of people benefitting from the resource and it is hard to distinguish
between rule-followers and rule-breakers.
Lluis Bru et al (2003) run an experiment to determine what type of policy actions need to
be made to preserve common pool resources. The authors do this by first running an experiment
where participants are grouped together with a partner. Each partner is making sequential
decisions on whether to withdraw a large share of the stock (H) or a smaller share of the stock
(L). Partner one first chooses to take either H or L, then partner two is informed about partner
one’s decision and the stock grows by a constant growth rate. Then partner two decides whether
to take out H or L. This decision making goes on for 6 rounds, which gives each partner the
chance to withdraw 3 times. The equilibrium for this experiment is LLLLHH. Therefore both
partners want to start by taking out the lower amount (L) in the first two rounds of their decision
making, and then they should end their decision making by choosing the larger amount (H). The
authors also run a few different treatments where the H value gets even higher than in the other
treatments which makes it more tempting for the participants to choose H over L. In their results
they found that the most used strategy was LLLLHH, but they did find that in the treatments
where H was higher than usual, participants tend to give in to temptation and withdraw H more
often. At the end of the experiment, the authors decided to make policy suggestions based on
their results.
They believed that in the context of natural resource management, their results suggest
that the closer the capacity (H-value) is to the quota (L-value), the higher is the tendency not to
surpass the quota. This is important because policy makers can both impose quotas and target
capacity. Therefore, the authors suggested that policy changes need to be made directed toward
reducing capacity because when capacity is too large relative to the quota, the fleet tends not to
comply with the quota. This experiment is different than ours in a couple different ways. First of
all, they are using groups of 2 rather than 4 and each partner is making sequential decisions
rather than all 4 group members making decisions in every round. Also the participants in this
study got to choose between two decisions either a large share of the stock or a small share of the
stock rather than choosing any number between 1 and 10 in our experiment. Their growth rate
was also different than ours because of the way they have the participants withdraw. To figure
out how much will be in the account for the next round they either use the equation
((1−H)∗100)or((1−L)∗100) and then they triple what comes out of that. This is also different than
any other growth rates used because it is a constant growth rate rather than a dynamic one.
2.5 More Experiments related to CPRs
Marco Janssen (2010) attempts to expand upon Ostrom et al (1992) and Hardin (1968) by
adding more variables to make his experiment more lifelike. He believes that experimental
research has not addressed the problem of fit because of two limitations of current designs. The
first is that the common resource representation used in experiments is often static, deterministic,
and non-spatial. Even though he believes that, he understands that past experiments were
instrumental for showing the possibility of self-governance for common-pool resources but are
limited from an ecological perspective. The second limitation is that participants in experiments
are typically only able to make a decision about how much to harvest from a common resource.
That is why in Janssen’s experiments participants can make decisions where, when, how, and
how much to harvest in a real-time experimental environment.
23
Basically the experiment is that participants start off with two individual rounds where they can
collect tokens on a grid, then the third round is collective in groups of four, where the grid is
bigger and all participants can collect as tokens again. In this first group round there is no
communication, then in the next round communication is introduced through text messages
between groupmates. Here is another instance of where the communication factor is not used
correctly. The communication variable should be used to make people stay in line and do not
take too much of the resource through social pressures, but if the communication is over the
phone, then people do not really have that social pressure because they are not confronted by
someone face to face. There was also a punishment aspect to his experiments where someone
could punish someone by spending a token to make someone lese give up two tokens as
punishment. Not many people used the punishment method, and I think it is because people did
not want to spend their own tokens to punish someone because that would take away from how
much they benefit themselves. In the end Janssen concludes that when participants have the
option to craft institutional arrangements on when, where, and how to appropriate a resource,
they do so, and those arrangements fit the ecological dynamics of the resource.
Janssen et al. (2010) go over the same experiment as the one in Janssen (2010). They
conclude that communication significantly increases the group’s performance, but the
performance is not sustained when punishment is used and communication is no longer possible.
These findings stress how important communication is when dealing with CPRs. Also they bring
up how back in 1968, Hardin concluded that overharvesting of a CPR was inevitable unless an
external authority imposes rules on the users. They bring this up because they try to prove that
communication between the users of a CPR can lead to a smart strategy that will not eliminate
the resource.
Janssen (2013) sets up experiments to figure out how the information that resource users
have influences their decisions. In this paper he adds on to what he previously did in his previous
paper, Janssen (2010). Once he understood that communication between group members was
important to the sustainability of a resource, he decided to take a look at how the information
they have affects how well they communicate. He found that participants harvested more single
tokens when they could not be seen by others which means that when information is limited and
people cannot be monitored they tend to stray from their informal agreements they made with the
group. Therefore he concludes that information is a key component to explain the level of
cooperation between group members.
Janssen et al. (2013) allow participants to elect a regulation from a limited set of possible
institutional arrangements to see if the elected rules will lead to better performance and how
compliant the participants are. There is a major difference between the experiments they run in
this paper and the experiments that Janssen has run in the past. They introduce a real world
experiment including members of villages in Columbia and Thailand as participants in the
experiment. This is very important in encapsulating the entire dilemma that comes with CPRs
because it has all the variables that come with a real world situation. From these experiments
they noticed that participants tended to break the rules that they put into place which he thinks
can be explained by the distrust of externally proposed regulations. The most amount of rule
24
breaking came from the villages and they believe that is because of the amount of trust the
community members had in each other to not conform to the rules. So if one person believes
everyone else will not follow the rules, that person will not follow the rules as well. This leads
them to conclude that it is important to take the social context of the community of resource
users. This is shows the importance of how regulations are implemented and how their
effectiveness is the result of interactions between social norms and rule enforcement.
Fischer et al (2004) argue that since almost all naturally occurring CPRs are
intergenerational common pools, it seems obvious that intergenerational dynamics constitute an
important aspect of CPR exploitation and deserve more attention. In this paper they seek to
address the question of whether the intergenerational perspective of the CPR appropriators can
contribute to the sustainability of the resource use. They first use a basic common pool resource
model in which there are groups of 3 and each person chooses a level of effort to be exerted in
exploiting the common pool resource. The socially optimum equilibrium in the author’s model is
9, therefore to reach the social optimum each player should choose an effort level of 3. Then they
have an intergenerational common pool resource model where the level of effort from one
generation effects the amount that the next generation can exert. If the players in a generation
aim at providing the next generation with exactly the same income opportunities as they have
themselves, it is necessary that they make exploitation effort choices that just compensate the
natural growth of the resource. Such growth compensating behavior is focal, because the
provision of equal opportunities is often viewed as a basic fairness norm. Also, if the resource
grows slower than necessary to compensate the equilibrium exploitation, growth compensation
requires that players choose exploitation efforts below the equilibrium level. But, if the resource
grows faster than the equilibrium exploitation can offset, growth compensation requires that
players choose exploitation efforts above equilibrium level.
The authors found that people had trouble predicting what level of exertion the other
players would do in the same generation. This could mean that subjects actually intend to
maximize their own monetary payoffs, but fail to do so, due to wrong expectations concerning
the choices made by the other players. What the authors found was that subjects in all three
treatments intend to sacrifice some of their payoff for the well-being of others. The authors also
found clear and strong evidence that the presence of an intergenerational link affected subjects’
expectations concerning the behavior of their peers. Although, while expecting their peers to face
up to the intergenerational responsibility, subjects did not reduce their own exploitation levels in
the presence of an intergenerational link. Since considerable restraint in resource extraction was
expected, yet only moderate restraint was practiced, the resource stock diminished in a social
climate of unjustified optimism. This means that there is a coordination problem between group
members which could happen in our experiment because our subjects have to make decisions
without knowing the decisions of their group members. Some good did come out of this study
though because the authors learned that subjects genuinely care about each other which lead
them to a lower extraction level than the equilibrium, and the subjects recognized the
intergenerational responsibility. This means that people understand that we need to make sure
that we do not exhaust common pool resources so that future generations can use them as well.
What they found in this experiment is different than what we could find out from our experiment
because at the end of 20 rounds, anything left in the account is lost. This means that the subjects
in our experiment want to exhaust the resource in the last round to maximize their payoff
because there is no future generation in our environment.
25
2.6 Summary
The main question that theorists are trying to answer through these experiments is
whether people can come up with their own strategies to keep a CPR from becoming extinct
without government intervention. When looking at all of this research it is easy to see the current
state of literature regarding CPRs. So far it is important to note that most theorists believe that it
is not possible to allow CPR users to come up with their own strategies to keep the resource from
depleting. Theorists also realized that communication between CPR users can help users come
up with good strategies, but in real life CPR environments CPR users have trouble
communicating because they can withdraw from the resource at different times so they do not
have any communication. My experiment can help add on to the knowledge that past
experiments have brought to CPRs. Our growth rate is different than all of the past experiments I
have looked at because our graph of the growth function clearly shows the experimental subjects
how much they should take out each round in order to keep the resource form being depleted.
This should allow subjects to come up with their own strategies that will benefit everyone in the
group without communication. This allows me to correctly model a real life CPR environment
and figure out if people are actually able to come up with their own strategy that will lead to a
sustainable CPR situation without an institution in place to monitor it.
26
3.0 Methodology
In this section, I explain the design of my experiment and provides a basic analysis of the
game. The design includes how I recruited participants, the lab setting of our experiment, and the
procedure that the participants follow. The basic analysis includes an explanation of the growth
model, the social optimum, and the subgame perfect Nash equilibrium. Based on the analysis of
the game, I propose eight hypotheses of how the participants will play the game.
3.1 The Experiment
3.1.1 Participant Recruitment
All participants were undergraduate students recruited from introductory economics
classes at WPI during the spring of 2017. Students were informed about the experiments during
their lectures. If interested, students could join the mailing list to receive information about
upcoming experiments. Once a date was set for an experiment, an email would be sent out to the
mailing list with the experiment’s time and place. This email would be sent out 2 days in
advance of the session so that students would have enough time to register. In the email there
were also simple instructions on how to register for the experiment.
Registrations were supported by the Regi 25 web application, which is maintained by the
Computing and Communications Center of Worcester Polytechnic Institute. Regi 25 offer
registrations for events from various departments around campus. To register, students would
click on a link included in the email. After logging in using their WPI user name and password,
the Regi 25 page would come up and students could register for the session offered. To learn
more about Regi 25, please refer to its website: http://www.wpi.edu/webapps/regi/.
Each session included 8 participants. However, during registration, one or two extra
students were usually invited in case of no-shows. If everyone that registered showed up, the
extra couple of students would not be able to participate, but they were given a $10.00 show up
fee and received extra credit for their introductory economics course. Those students that could
not participate also had the option to register for future sessions.
3.1.2 Lab Setting
All sessions took place in the Department of Social Science and Policy Studies’
Experimental Economics Lab located Salisbury Labs. During the experiment, subjects were
seated at private computer workstations, and all interaction occurred over the computer network.
The experiment was programmed and conducted with the experiment software z-Tree
(Fischbacher, 2007). All procedures for the experiment were programmed into the software
beforehand so that there would be minimal interaction between the experimenters and the
subjects. During the experiment, subjects simply followed the instructions on their computer
screens and entered their decisions using keyboards and mice. The experimenters were available
for help if subjects had any questions during the experiment.
3.1.3 Setup
To setup for this experiment, I had to make 16 copies of the Informed Consent Forms, 8
Instructions, and 3 Receipt forms. I then put two copies of the Informed Consent Forms at each
computer workstation so that each participant could sign one and give it back, and keep the other
27
one. I then made sure that all the computers were turned on and functioning correctly so that
there were no problems when the participants arrived.
Once all the participants were in place, I read the Informed Consent Forms aloud and
answered any questions. Then, I asked the participants to sign the forms and I went around and
collected them. I passed out the instructions for the experiment and explained how the game
works to the participants. Once I finished I answered any questions they had and then started the
experiment.
3.1.4 Procedure
The participants were randomly and anonymously matched with 3 other participants over
the computer network. I used groups of 4 in this experiment because 4 is the most common
group size in past literature.
Each member of the group had access to the common group account from which they
could withdraw money in each of 20 rounds of decision-making. Using 20 rounds I was able to
lessen the impact of irresponsible behavior once more. This way people would be willing to take
less in a certain round to correct irresponsible behavior and still have plenty of rounds left to
make up for taking less early. Another reason for using 20 rounds was to have a large sample of
decision making and with more rounds people could have more time to figure the game out.
Each person in the group made their own individual decision on how much to withdraw
from the shared account. At the beginning of round 1, the account had 32 lab dollars (LD) in it.
The game started with 32 LD in it because this allowed each person to make a moderate
withdrawal (4-5 LD) and for the stock to be in the range of optimal growth.
Each of the four participants in a group made a withdrawal between 0 and 10 LD in each
round. (See Appendix B1 for the decision screen). Participants had no control over how much
their groupmates withdrew. We only let the participants withdraw anywhere from 0 to 10
because it allows them to make large withdrawals, and also does not let the large withdrawals get
out of hand. If we allowed participants to withdraw more than 10 then some people that are not
taking the experiment seriously could potentially kill the experiment.
The account then became 32 LD less the sum of the withdrawals of each group member.
The participants would then be informed of the total amount withdrawn from the account and the
new account balance. The account would then grow before the start of the next round. The
account would grow depending on how much was left in the account from the previous round.
The participants were informed on how the account will grow by Figure 1, included in the
instructions passed out before the experiment started. After the account grew, the participants
would make withdrawals just as they did in round 1.
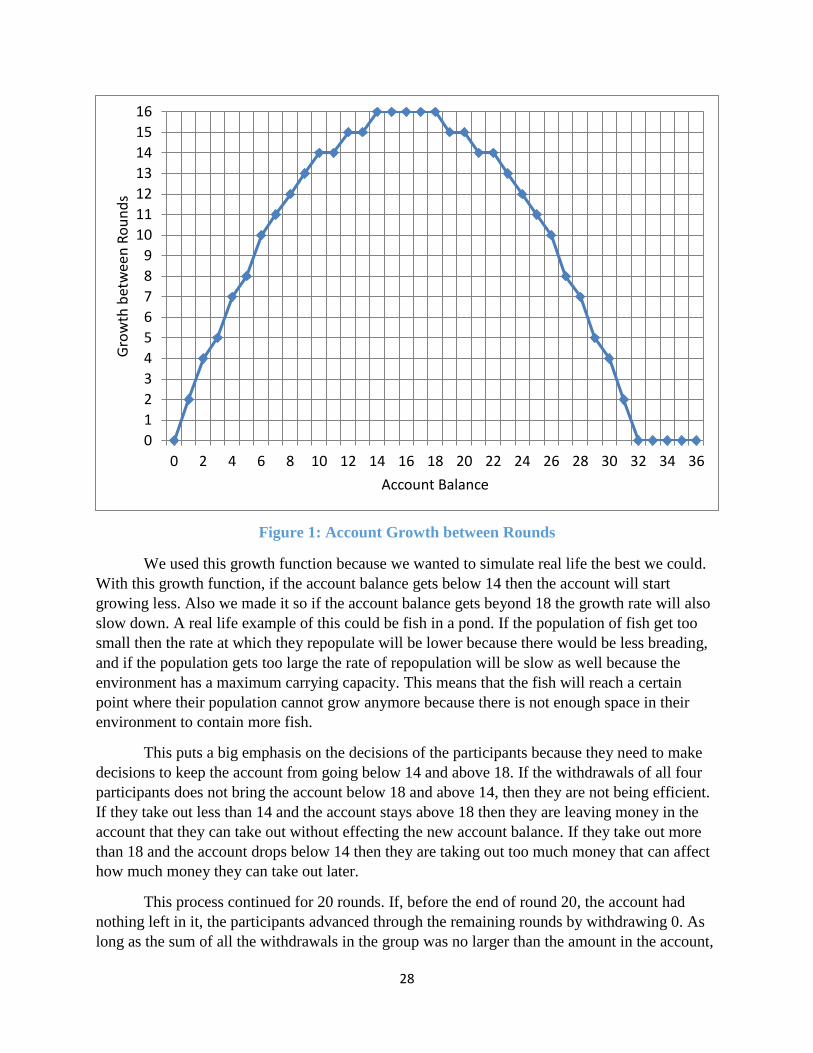
28
Figure 1: Account Growth between Rounds
We used this growth function because we wanted to simulate real life the best we could.
With this growth function, if the account balance gets below 14 then the account will start
growing less. Also we made it so if the account balance gets beyond 18 the growth rate will also
slow down. A real life example of this could be fish in a pond. If the population of fish get too
small then the rate at which they repopulate will be lower because there would be less breading,
and if the population gets too large the rate of repopulation will be slow as well because the
environment has a maximum carrying capacity. This means that the fish will reach a certain
point where their population cannot grow anymore because there is not enough space in their
environment to contain more fish.
This puts a big emphasis on the decisions of the participants because they need to make
decisions to keep the account from going below 14 and above 18. If the withdrawals of all four
participants does not bring the account below 18 and above 14, then they are not being efficient.
If they take out less than 14 and the account stays above 18 then they are leaving money in the
account that they can take out without effecting the new account balance. If they take out more
than 18 and the account drops below 14 then they are taking out too much money that can affect
how much money they can take out later.
This process continued for 20 rounds. If, before the end of round 20, the account had
nothing left in it, the participants advanced through the remaining rounds by withdrawing 0. As
long as the sum of all the withdrawals in the group was no larger than the amount in the account,
0
1
2
3
4
5
6
7
8
9
10
11
12
13
14
15
16
0 2 4 6 8 10 12 14 16 18 20 22 24 26 28 30 32 34 36
Gro
wth
bet
wee
n R
ou
nd
s
Account Balance

29
everyone would receive their withdrawals. If the withdrawals exceeded the amount in the
account, then the account was divided as follows:
i. Anyone who chose a withdrawal of a quarter or less of the amount in the account got his/her
withdrawal. Such withdrawals were deducted from the amount in the account and those people
were considered “paid.”
ii. If and when the remaining number of people is 3, any of those 3 people who chose
withdrawals of a third or less of the amount remaining in the account got his/her withdrawal.
Such withdrawals were deducted from the amount remaining in the account and those
individuals were considered “paid.”
iii. If and when the remaining number of people is 2, either of those 2 people who chose
withdrawals of a half or less of the amount now remaining in the account got his/her withdrawal.
Such withdrawals were deducted from the amount now remaining in the account and those
people were considered “paid.”
iv. For any people remaining, the amount now remaining in the account was divided evenly.
After each round the participants were given feedback on how much they received from their
withdrawal and how much was left in the account. (See Appendix B2 for a screenshot of the
feedback). Then they received more feedback about how much the account grew. (See Appendix
B3 for a screenshot). Once all the rounds were done, we asked the participants to provide some
demographic and contact information. (See Appendix B4 for a screenshot). Then the amount that
each participant withdrew over the 20 rounds would be converted into real money at a rate of 1
LD to 0.25 USD. Finally, they were paid in a private manner and the experiment was over.
3.2 Data
3.2.1 Data Description
Table 1: Summary Statistics of Data
Variable Obs Mean Std. Dev. Min Max
Profit 1,280 3.1 2.05 0 10
TotalProfit 1,280 34.86 22.09 0 110.5
newstock 1,280 10.65 7.32 0 32
growth 1,280 10.84 5.73 0 16
stock 1,280 21.48 10.69 0 36
endstock 1,280 9.09 5.78 -3.55E-15 22
withdraw 1,280 3.16 2.1 0 10
SumW 1,280 12.66 6.49 0 29
received 1,280 3.1 2.05 0 10
SumR 1,280 12.39 6.55 0 28
money 1,280 8.71 5.52 0 27.625
stock_pc 1,280 5.37 2.67 0 9
endstock_pc 1,280 2.27 1.45 -8.88E-16 5.5
growth_pc 1,280 2.71 1.43 0 4
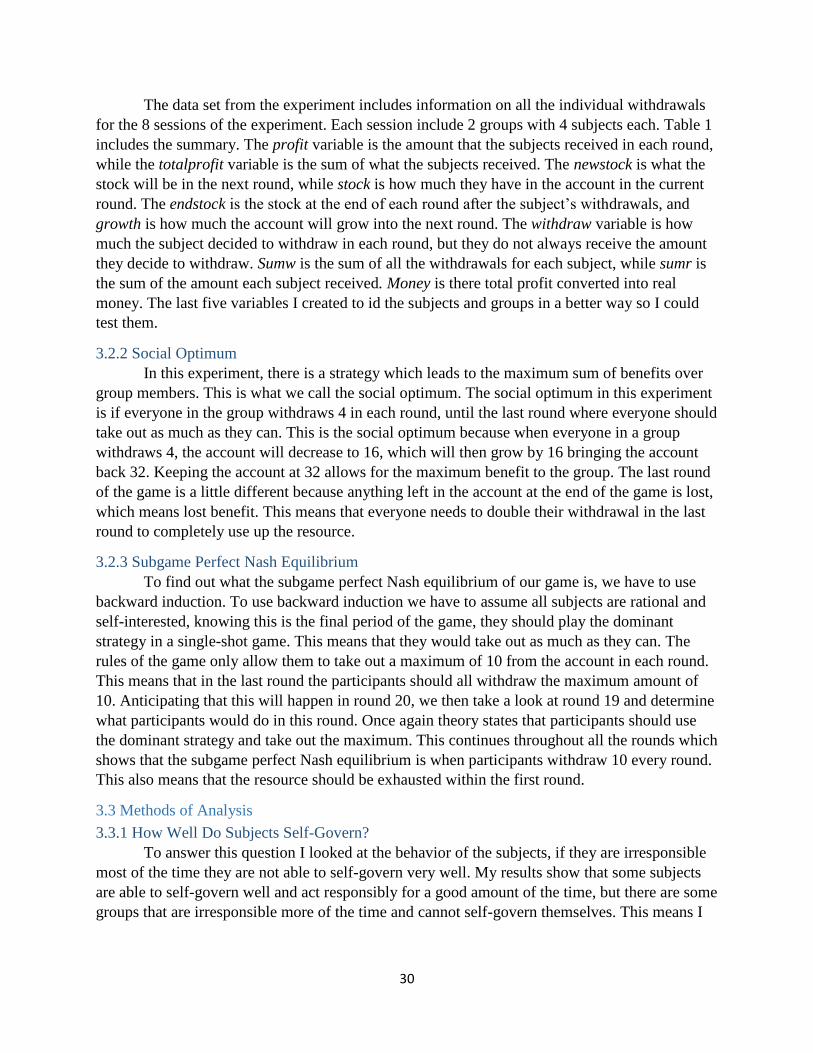
30
The data set from the experiment includes information on all the individual withdrawals
for the 8 sessions of the experiment. Each session include 2 groups with 4 subjects each. Table 1
includes the summary. The profit variable is the amount that the subjects received in each round,
while the totalprofit variable is the sum of what the subjects received. The newstock is what the
stock will be in the next round, while stock is how much they have in the account in the current
round. The endstock is the stock at the end of each round after the subject’s withdrawals, and
growth is how much the account will grow into the next round. The withdraw variable is how
much the subject decided to withdraw in each round, but they do not always receive the amount
they decide to withdraw. Sumw is the sum of all the withdrawals for each subject, while sumr is
the sum of the amount each subject received. Money is there total profit converted into real
money. The last five variables I created to id the subjects and groups in a better way so I could
test them.
3.2.2 Social Optimum
In this experiment, there is a strategy which leads to the maximum sum of benefits over
group members. This is what we call the social optimum. The social optimum in this experiment
is if everyone in the group withdraws 4 in each round, until the last round where everyone should
take out as much as they can. This is the social optimum because when everyone in a group
withdraws 4, the account will decrease to 16, which will then grow by 16 bringing the account
back 32. Keeping the account at 32 allows for the maximum benefit to the group. The last round
of the game is a little different because anything left in the account at the end of the game is lost,
which means lost benefit. This means that everyone needs to double their withdrawal in the last
round to completely use up the resource.
3.2.3 Subgame Perfect Nash Equilibrium
To find out what the subgame perfect Nash equilibrium of our game is, we have to use
backward induction. To use backward induction we have to assume all subjects are rational and
self-interested, knowing this is the final period of the game, they should play the dominant
strategy in a single-shot game. This means that they would take out as much as they can. The
rules of the game only allow them to take out a maximum of 10 from the account in each round.
This means that in the last round the participants should all withdraw the maximum amount of
10. Anticipating that this will happen in round 20, we then take a look at round 19 and determine
what participants would do in this round. Once again theory states that participants should use
the dominant strategy and take out the maximum. This continues throughout all the rounds which
shows that the subgame perfect Nash equilibrium is when participants withdraw 10 every round.
This also means that the resource should be exhausted within the first round.
3.3 Methods of Analysis
3.3.1 How Well Do Subjects Self-Govern?
To answer this question I looked at the behavior of the subjects, if they are irresponsible
most of the time they are not able to self-govern very well. My results show that some subjects
are able to self-govern well and act responsibly for a good amount of the time, but there are some
groups that are irresponsible more of the time and cannot self-govern themselves. This means I

31
will be using the summary statistics of the behaviors for all the groups to see if the groups are
more irresponsible or responsible.
3.3.2 Do Some Groups Do Better Than Others?
To answer this question, I first looked at the average profits of each group, allowing me
to separate the groups into high-performing or “good” groups and low-performing or “bad”
groups. This is shown in Table 2.
Table 2: Average Total Profit by Group
I also graphically analyzed the difference between the best group and worst group by graphing
their endstock by period. This is shown in Figure 2.
groupid 11 groupid 51
Variable Obs Mean Std. Dev. Min Max Variable Obs Mean Std. Dev. Min Max
TotalProfit 4 52 23.30951 24 81 TotalProfit 4 77 15.12173 65 99
groupid 12 groupid 52
Variable Obs Mean Std. Dev. Min Max Variable Obs Mean Std. Dev. Min Max
TotalProfit 4 71.25 9.569918 59 82 TotalProfit 4 80.25 7.804913 71 90
groupid 21 groupid 61
Variable Obs Mean Std. Dev. Min Max Variable Obs Mean Std. Dev. Min Max
TotalProfit 4 40.25 9.429563 29.5 51.5 TotalProfit 4 36 4.690416 31 40
groupid 22 groupid 62
Variable Obs Mean Std. Dev. Min Max Variable Obs Mean Std. Dev. Min Max
TotalProfit 4 78.25 22.07751 60.5 110.5 TotalProfit 4 11 5.944185 4 18
groupid 31 groupid 71
Variable Obs Mean Std. Dev. Min Max Variable Obs Mean Std. Dev. Min Max
TotalProfit 4 70.25 11.44188 59 86 TotalProfit 4 82.5 6.936217 73 87.66667
groupid 32 groupid 72
Variable Obs Mean Std. Dev. Min Max Variable Obs Mean Std. Dev. Min Max
TotalProfit 4 53.5 17.21434 38 78 TotalProfit 4 79 12.98717 66 97
groupid 41 groupid 81
Variable Obs Mean Std. Dev. Min Max Variable Obs Mean Std. Dev. Min Max
TotalProfit 4 45.25 17.65172 20 60 TotalProfit 4 72.25 11.70114 61 87
groupid 42 groupid 82
Variable Obs Mean Std. Dev. Min Max Variable Obs Mean Std. Dev. Min Max
TotalProfit 4 71.25 9.322911 59 79 TotalProfit 4 71.5 15.29161 50 85.5
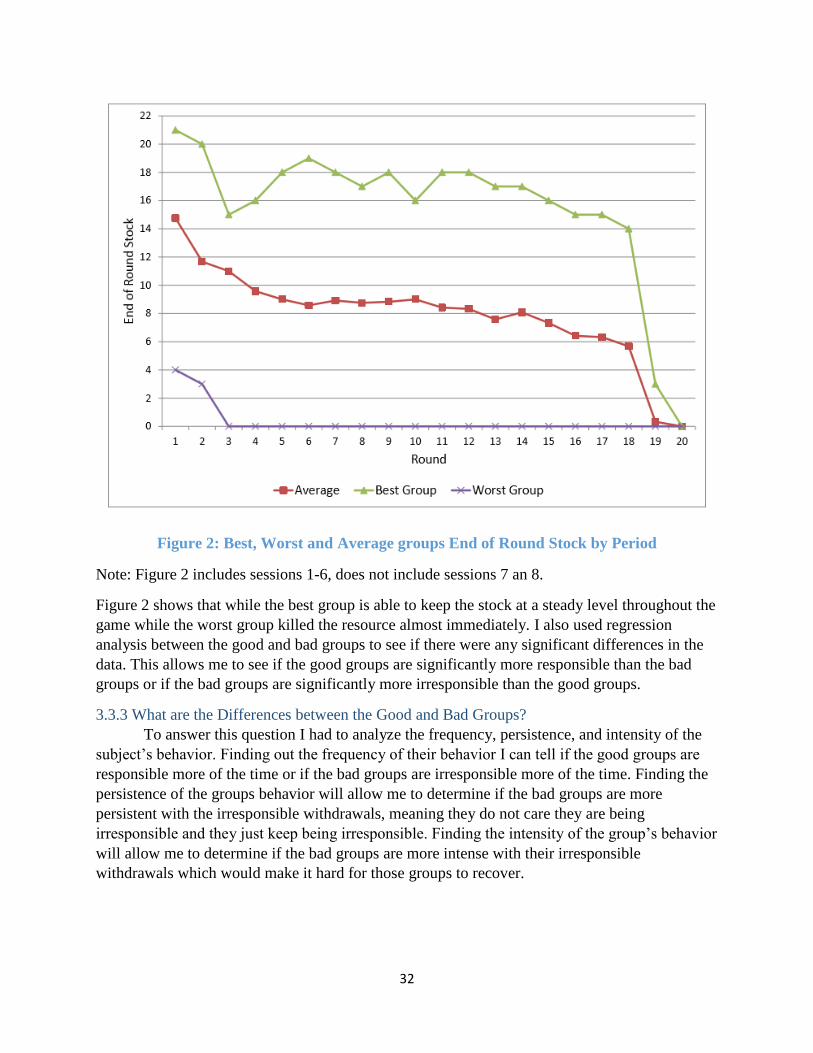
32
Figure 2: Best, Worst and Average groups End of Round Stock by Period
Note: Figure 2 includes sessions 1-6, does not include sessions 7 an 8.
Figure 2 shows that while the best group is able to keep the stock at a steady level throughout the
game while the worst group killed the resource almost immediately. I also used regression
analysis between the good and bad groups to see if there were any significant differences in the
data. This allows me to see if the good groups are significantly more responsible than the bad
groups or if the bad groups are significantly more irresponsible than the good groups.
3.3.3 What are the Differences between the Good and Bad Groups?
To answer this question I had to analyze the frequency, persistence, and intensity of the
subject’s behavior. Finding out the frequency of their behavior I can tell if the good groups are
responsible more of the time or if the bad groups are irresponsible more of the time. Finding the
persistence of the groups behavior will allow me to determine if the bad groups are more
persistent with the irresponsible withdrawals, meaning they do not care they are being
irresponsible and they just keep being irresponsible. Finding the intensity of the group’s behavior
will allow me to determine if the bad groups are more intense with their irresponsible
withdrawals which would make it hard for those groups to recover.

33
3.4 Hypotheses
If we assume that everyone is self-interested, then everyone will try to receive the highest
payoff by withdrawing as much as they can and hope that everyone else does not withdraw as
much as they can as well. If everyone does this then the resource will be exhausted immediately.
Although from past experiments we see that participants have been able to not exhaust
the resource in the first round. This means that the participants are thinking intuitively and
lowering their first few withdrawals to make the resource last longer. All withdrawals can be
categorized into three groups: responsible, irresponsible, and constructive withdrawals.
Where g is growth, s is the stock and x is the withdrawal.
A withdrawal is responsible if 4x = g(s −4x); or s −4x > 14,
A withdrawal is irresponsible if 4x > g(s −4x); and s −4x < 14.
A withdrawal is constructive if 4x < g(s −4x).
To better understand what this would look like is through a couple examples.
Ex1: If the account has 32 LD and a subject withdraws 5 LD, it is an irresponsible withdrawal
because if everyone takes out 5 LD then 20 LD is withdrawn and the account would drop to 12
LD. Then it would only grow by 15 LD and the new account balance would be 27 LD.A
responsible withdrawal in this instance would be 4 LD. Account would drop to 16 LD then grow
back by 16 LD.
Ex2: If the account has 24 LD and a subject withdrew 2 LD, it is a constructive withdrawal
because if everyone takes out 2 LD then the account would drop by 8 LD leaving 16 LD in the
account. The next round the account would grow by 16 LD and the account would be up to 32
LD for the next round
From this we can construct our first hypothesis as:
H1: Players will make responsible and constructive withdrawals in the beginning rounds to
learn how their groupmates are making decisions.
As the participants move forward through the rounds, they will have a better
understanding of the game and how their groupmates are making decisions. This is deceiving
because all participants are trying to do the same thing, which means when they think they can
ramp up their withdrawals, everyone will do the same. This allows us to construct our second
hypothesis:
H2: Players will start making irresponsible withdrawals after the first few rounds to increase
their benefit.
Since they receive feedback after every round, they will know how much is left in the
account after their withdrawals. If they do not exhaust the resource with their irresponsible
withdrawals they will be able to recover from these withdrawals by changing their behavior.
From this we can construct our third hypothesis:
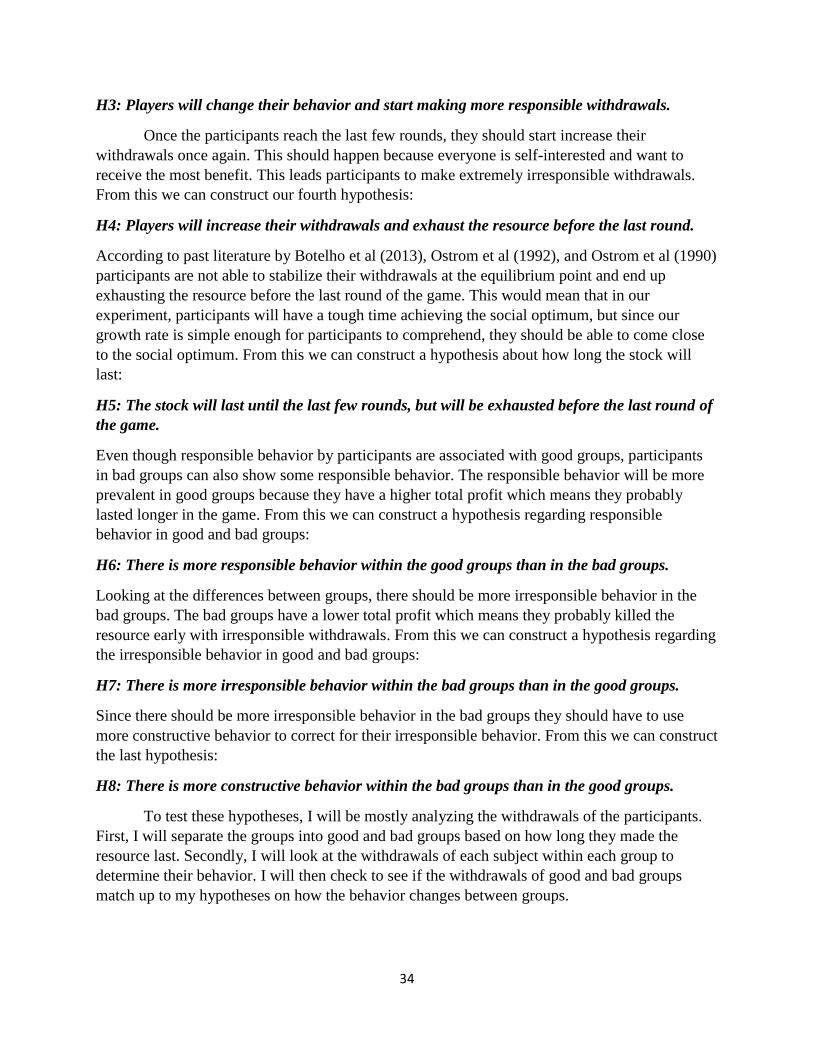
34
H3: Players will change their behavior and start making more responsible withdrawals.
Once the participants reach the last few rounds, they should start increase their
withdrawals once again. This should happen because everyone is self-interested and want to
receive the most benefit. This leads participants to make extremely irresponsible withdrawals.
From this we can construct our fourth hypothesis:
H4: Players will increase their withdrawals and exhaust the resource before the last round.
According to past literature by Botelho et al (2013), Ostrom et al (1992), and Ostrom et al (1990)
participants are not able to stabilize their withdrawals at the equilibrium point and end up
exhausting the resource before the last round of the game. This would mean that in our
experiment, participants will have a tough time achieving the social optimum, but since our
growth rate is simple enough for participants to comprehend, they should be able to come close
to the social optimum. From this we can construct a hypothesis about how long the stock will
last:
H5: The stock will last until the last few rounds, but will be exhausted before the last round of
the game.
Even though responsible behavior by participants are associated with good groups, participants
in bad groups can also show some responsible behavior. The responsible behavior will be more
prevalent in good groups because they have a higher total profit which means they probably
lasted longer in the game. From this we can construct a hypothesis regarding responsible
behavior in good and bad groups:
H6: There is more responsible behavior within the good groups than in the bad groups.
Looking at the differences between groups, there should be more irresponsible behavior in the
bad groups. The bad groups have a lower total profit which means they probably killed the
resource early with irresponsible withdrawals. From this we can construct a hypothesis regarding
the irresponsible behavior in good and bad groups:
H7: There is more irresponsible behavior within the bad groups than in the good groups.
Since there should be more irresponsible behavior in the bad groups they should have to use
more constructive behavior to correct for their irresponsible behavior. From this we can construct
the last hypothesis:
H8: There is more constructive behavior within the bad groups than in the good groups.
To test these hypotheses, I will be mostly analyzing the withdrawals of the participants.
First, I will separate the groups into good and bad groups based on how long they made the
resource last. Secondly, I will look at the withdrawals of each subject within each group to
determine their behavior. I will then check to see if the withdrawals of good and bad groups
match up to my hypotheses on how the behavior changes between groups.
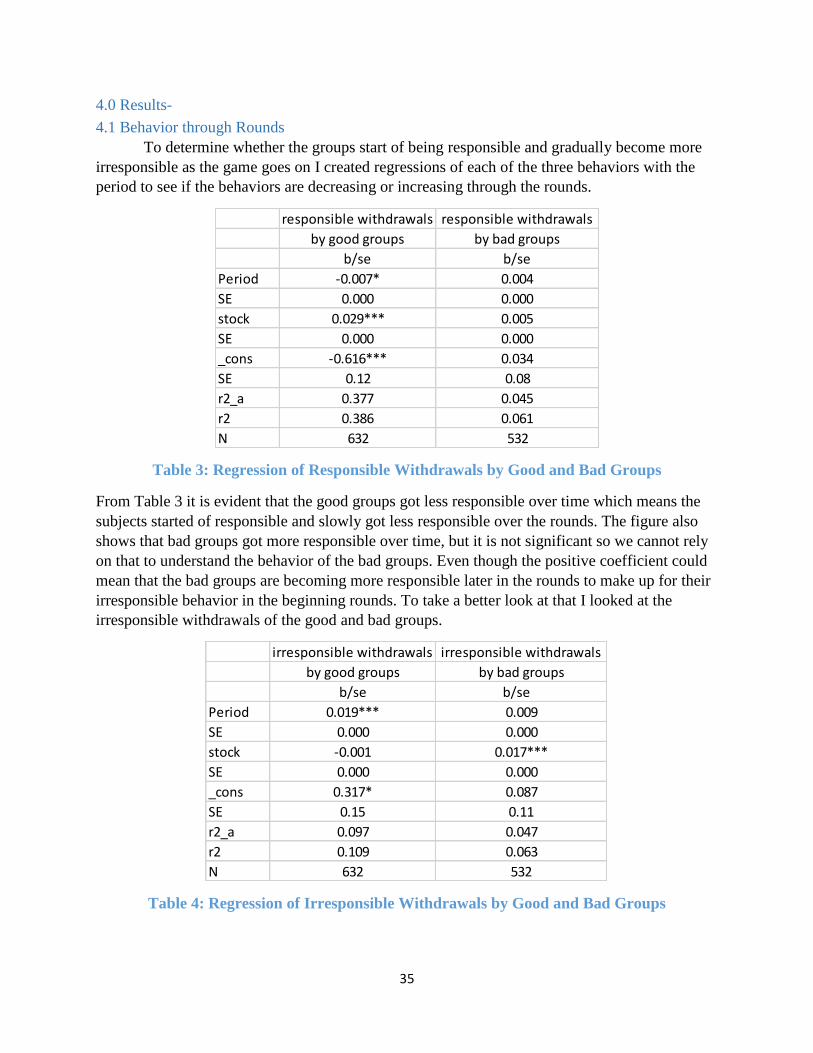
35
4.0 Results-
4.1 Behavior through Rounds
To determine whether the groups start of being responsible and gradually become more
irresponsible as the game goes on I created regressions of each of the three behaviors with the
period to see if the behaviors are decreasing or increasing through the rounds.
Table 3: Regression of Responsible Withdrawals by Good and Bad Groups
From Table 3 it is evident that the good groups got less responsible over time which means the
subjects started of responsible and slowly got less responsible over the rounds. The figure also
shows that bad groups got more responsible over time, but it is not significant so we cannot rely
on that to understand the behavior of the bad groups. Even though the positive coefficient could
mean that the bad groups are becoming more responsible later in the rounds to make up for their
irresponsible behavior in the beginning rounds. To take a better look at that I looked at the
irresponsible withdrawals of the good and bad groups.
Table 4: Regression of Irresponsible Withdrawals by Good and Bad Groups
responsible withdrawals responsible withdrawals
by good groups by bad groups
b/se b/se
Period -0.007* 0.004
SE 0.000 0.000
stock 0.029*** 0.005
SE 0.000 0.000
_cons -0.616*** 0.034
SE 0.12 0.08
r2_a 0.377 0.045
r2 0.386 0.061
N 632 532
irresponsible withdrawals irresponsible withdrawals
by good groups by bad groups
b/se b/se
Period 0.019*** 0.009
SE 0.000 0.000
stock -0.001 0.017***
SE 0.000 0.000
_cons 0.317* 0.087
SE 0.15 0.11
r2_a 0.097 0.047
r2 0.109 0.063
N 632 532

36
From Table 4 it is evident that the good groups are significantly getting more irresponsible as
the rounds go on which falls in line with what I found from Table 2. The important information
from this regression is that the bad groups are not significantly getting more irresponsible as the
round goes on, but as the stock goes up the bad groups are significantly more irresponsible. This
means that when the stock was the highest, which it is in the first round, the bad groups are more
irresponsible. This indicates that the bad groups are more irresponsible early in the game than the
good groups which leads the bad groups to killing the resource early. To determine whether the
bad groups were irresponsible early in the game I decided to look at the constructive withdrawals
to see if the bad groups got less constructive as the round goes on meaning they had to be
constructive early to make up for their early irresponsible withdrawals.
Table 5: Regression of Constructive Withdrawals by Good and Bad Groups
In Table 5 it is evident that both good and bad groups get significantly less constructive as the
rounds goes on, but the one that really matters is the bad groups. This is because I have already
established that the good groups are responsible to start and get more irresponsible as the rounds
go on. Since the bad groups are getting significantly less constructive as the round increases, but
do not get significantly more responsible or irresponsible than it is evident that they were
irresponsible to start the game which lead to them having to become constructive early in the
game to make up for it. Then they might have been able to get less constructive once their stock
grew larger. To take a deeper look into the differences between the groups I looked at the
frequency, persistence and intensity of the group’s responsible, irresponsible, and constructive
behavior.
4.2 Differences in Behavior between Good and Bad Groups
To test the frequency of the behavior we took the summary statistics of the behaviors
before round 20 and if the new stock is greater than 0 because everyone should be irresponsible
in the last round and if the new stock is 0 then everyone’s withdrawals would be responsible
skewing the data. I was able to create a table with the frequencies of the behaviors for good and
bad groups.
constructive withdrawals constructive withdrawals
by good groups by bad groups
b/se b/se
Period -0.012*** -0.012**
SE 0.000 0.000
stock -0.028*** -0.022***
SE 0.000 0.000
_cons 1.299*** 0.879***
SE 0.14 0.11
r2_a 0.121 0.068
r2 0.133 0.084
N 632 532
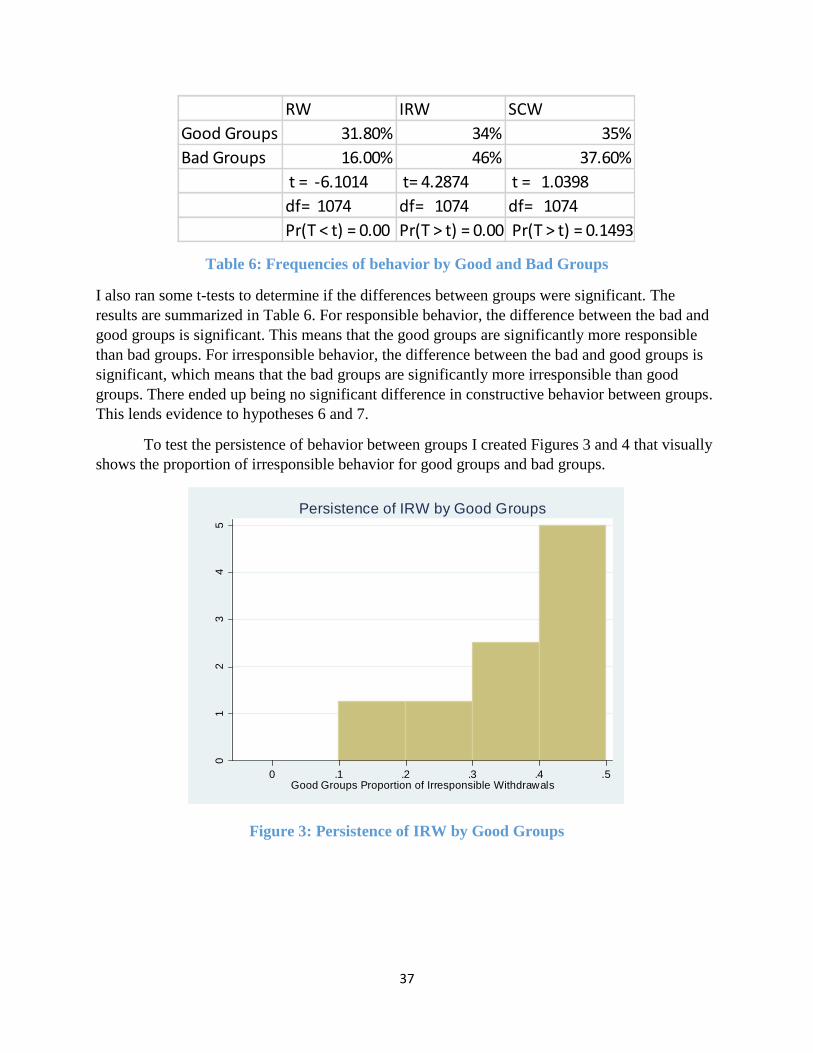
37
Table 6: Frequencies of behavior by Good and Bad Groups
I also ran some t-tests to determine if the differences between groups were significant. The
results are summarized in Table 6. For responsible behavior, the difference between the bad and
good groups is significant. This means that the good groups are significantly more responsible
than bad groups. For irresponsible behavior, the difference between the bad and good groups is
significant, which means that the bad groups are significantly more irresponsible than good
groups. There ended up being no significant difference in constructive behavior between groups.
This lends evidence to hypotheses 6 and 7.
To test the persistence of behavior between groups I created Figures 3 and 4 that visually
shows the proportion of irresponsible behavior for good groups and bad groups.
Figure 3: Persistence of IRW by Good Groups
RW IRW SCW
Good Groups 31.80% 34% 35%
Bad Groups 16.00% 46% 37.60%
t = -6.1014 t= 4.2874 t = 1.0398
df= 1074 df= 1074 df= 1074
Pr(T < t) = 0.00 Pr(T > t) = 0.00 Pr(T > t) = 0.14930
12
34
5
De
nsity
0 .1 .2 .3 .4 .5Good Groups Proportion of Irresponsible Withdrawals
Persistence of IRW by Good Groups
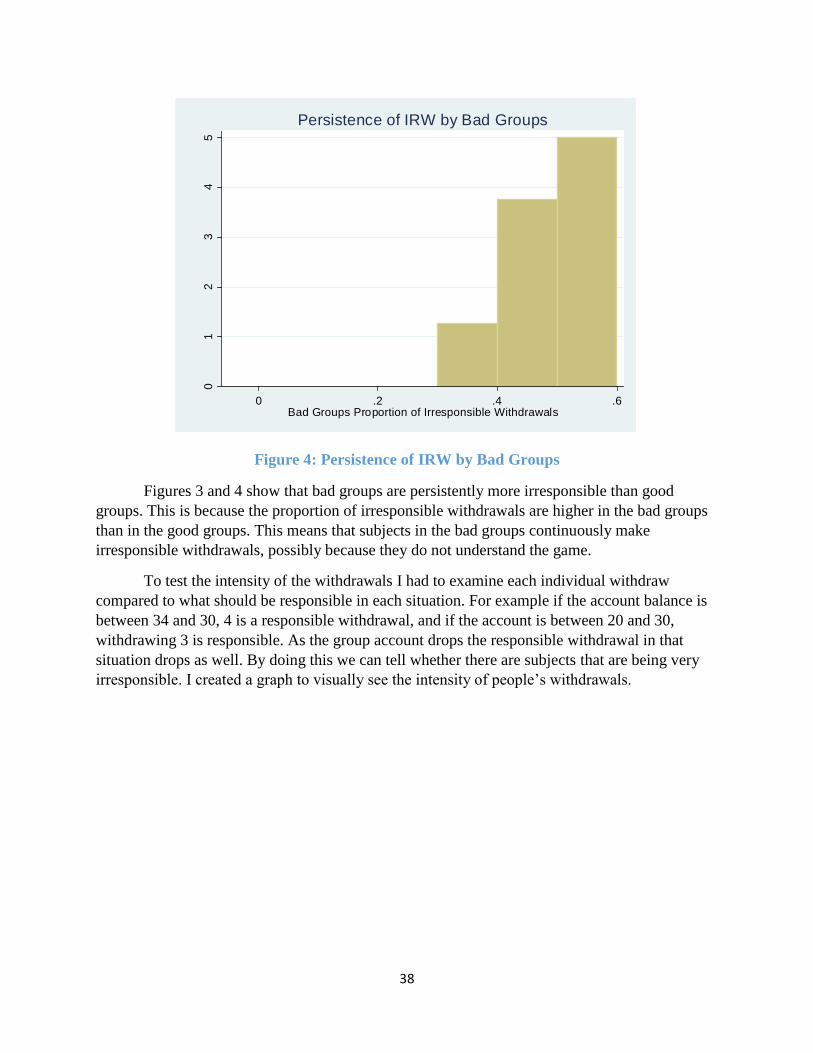
38
Figure 4: Persistence of IRW by Bad Groups
Figures 3 and 4 show that bad groups are persistently more irresponsible than good
groups. This is because the proportion of irresponsible withdrawals are higher in the bad groups
than in the good groups. This means that subjects in the bad groups continuously make
irresponsible withdrawals, possibly because they do not understand the game.
To test the intensity of the withdrawals I had to examine each individual withdraw
compared to what should be responsible in each situation. For example if the account balance is
between 34 and 30, 4 is a responsible withdrawal, and if the account is between 20 and 30,
withdrawing 3 is responsible. As the group account drops the responsible withdrawal in that
situation drops as well. By doing this we can tell whether there are subjects that are being very
irresponsible. I created a graph to visually see the intensity of people’s withdrawals.
01
23
45
De
nsity
0 .2 .4 .6Bad Groups Proportion of Irresponsible Withdrawals
Persistence of IRW by Bad Groups
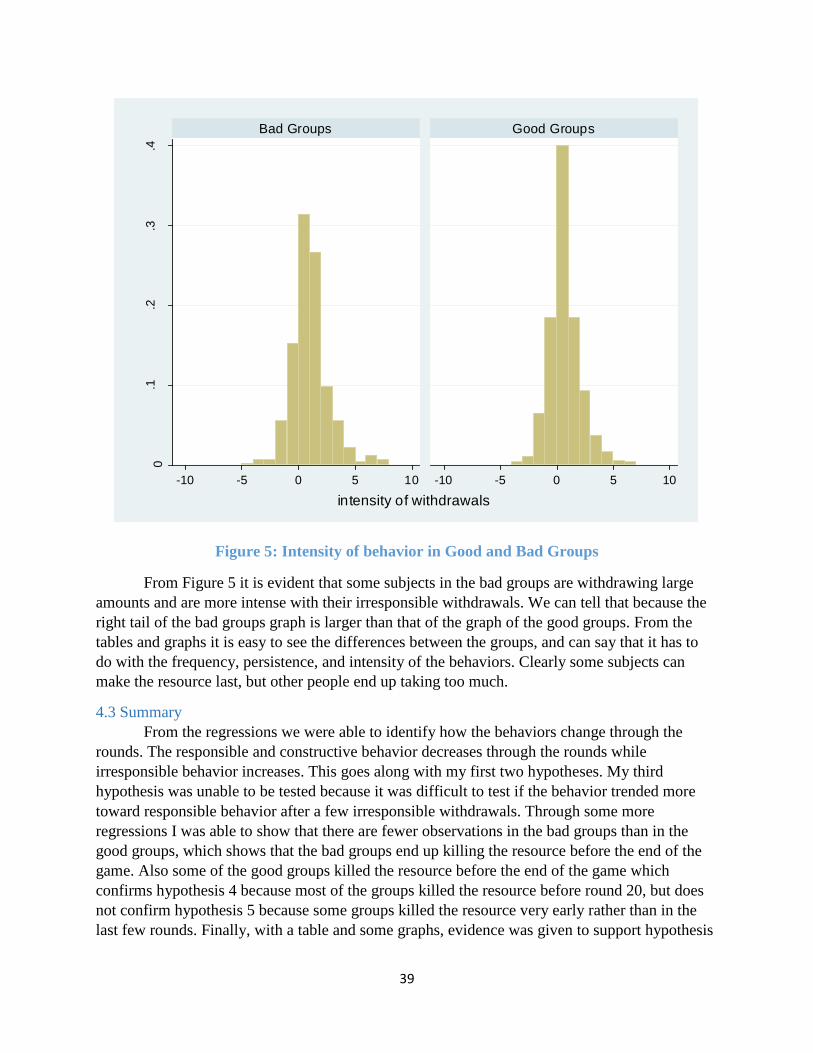
39
Figure 5: Intensity of behavior in Good and Bad Groups
From Figure 5 it is evident that some subjects in the bad groups are withdrawing large
amounts and are more intense with their irresponsible withdrawals. We can tell that because the
right tail of the bad groups graph is larger than that of the graph of the good groups. From the
tables and graphs it is easy to see the differences between the groups, and can say that it has to
do with the frequency, persistence, and intensity of the behaviors. Clearly some subjects can
make the resource last, but other people end up taking too much.
4.3 Summary
From the regressions we were able to identify how the behaviors change through the
rounds. The responsible and constructive behavior decreases through the rounds while
irresponsible behavior increases. This goes along with my first two hypotheses. My third
hypothesis was unable to be tested because it was difficult to test if the behavior trended more
toward responsible behavior after a few irresponsible withdrawals. Through some more
regressions I was able to show that there are fewer observations in the bad groups than in the
good groups, which shows that the bad groups end up killing the resource before the end of the
game. Also some of the good groups killed the resource before the end of the game which
confirms hypothesis 4 because most of the groups killed the resource before round 20, but does
not confirm hypothesis 5 because some groups killed the resource very early rather than in the
last few rounds. Finally, with a table and some graphs, evidence was given to support hypothesis
0.1
.2.3
.4
-10 -5 0 5 10 -10 -5 0 5 10
Bad Groups Good Groups
Den
sity
intensity of withdrawals

40
6 and 7. There were significant differences between good and bad groups with the frequency of
their responsible and irresponsible withdrawals, as well as visual evidence that there are
differences in the persistence and intensity of irresponsible behavior between groups. There was
no evidence that supports our 8th hypothesis because there was not a significant difference
between good and bad groups for constructive behavior.
41
5.0 Conclusion
5.1 Summary
My dynamic CPR game is different from those in the literature because it models a real
life situation. The subjects are incentivized to take out as much as they can to increase their
benefit by as much as they can, but if they take to much they could end up depleting the
resource. Also there is no communication in our experiment because in real life, subjects taking a
resource will not be communicating because they do not know each other and most likely would
not even see each other. Also my growth rate is modelled after a real life CPR because as the
stock drops below 14 then the growth rate starts to slow down, also if the stock is at 32 it cannot
grow anymore because of the maximum capacity of the environment. This is the same in real life
because they cannot just continue to repopulate because it will get crowded in whatever
environment the CPR is present.
A major finding from my experiment was that some people are able to self-govern while
others are not. This means that some subjects were able to control themselves and allow the
resource to last through all the rounds while others killed the resource before the end of the
game. Also, to understand the differences between the good and bad groups, I tested whether
there were differences in the frequency, persistence, and intensity of the subject’s behavior. I was
able to show that there were significant differences between the frequency of the responsible and
irresponsible behavior of the good and bad groups. Also, there was visual evidence that bad
groups were more persistent in their irresponsible behavior which probably lead them to kill the
resource. Finally, I was able to show that the intensity of the irresponsible withdrawals was
higher in the bad groups than in the good groups, meaning that the bad groups made very
irresponsible withdrawals while good groups made smaller irresponsible withdrawals.
5.2 Recommendations
From my findings I propose a couple policy recommendations:
1. Put a limit on the amount that people can take out from a CPR.
By putting a limit on how much of a resource someone can take at one time, we are limiting the
amount of the resource that can be taken out. In our experiment, even though we put a limit on
how much the subjects could withdraw, the limit was too high and subjects were still killing the
resource. I believe that the limit that should be enforced should only allow people to take out a
responsible amount. Therefore we need to know how much of a CPR is left before we can set the
limits. The problem with this policy action is that it is very tough to accomplish and enforce the
limits. If there is no institution put in place to enforce the limits then people will still take out as
much as they want. That brings me to my second policy recommendation:
2. Educate people on the dangers of CPR overuse.
This allows for no enforcement of the limits because if people were more informed on the
dangers of overusing a resource they would be more responsible. Of course you will still have a
few people that ignore everything and worry about themselves only, but they are the minority. I
believe that if people were fully educated on why they should not take out as much as they can
and should stick to the limits out in place, then they would follow the rules.
42
5.3 Future Experiments
Possible future experiments could be another dynamic CPR game that allows for a single
communication between groups in the beginning of the game. This will allow us to test if
educating the subjects on the dangers of overuse could help. It does this because if the subjects
have a chance to communicate early in the game then the people that are confused and do not
really understand the game will get a proper explanation of what they should do in order to
preserve the resource. This could be known as the education effect, and we could see if there are
any differences between the results in that experiment and the results of my experiment.
43
References
Botelho, Anabela, Ariel Dinar, LÃgia M. Costa Pinto, and Amnon Rapoport. "Time and
Uncertainty in Resource Dilemmas: Equilibrium Solutions and Experimental Results."
Experimental Economics 17.4 (2014): 649-72.
Bru, Lluis, Susana Cabrera, Monica Capra, and Rosario Gomez. "A Common Pool Resource
Game with Sequential Decisions and Experimental Evidence." Experimental Economics 6
(2003): 91-114
Fischer, Maria-Elisabeth, Bernd Irlenbusch, and Abdolkarim Sadrieh. "An Intergenerational
Common Pool Resource Experiment." Journal of Environmental Economics and Management
48.2 (2004): 811-36.
Gardner, Roy, James Walker, and Elinor Ostrom. "Workshop in Political Theory and Policy
Analysis." Experimental Economics 18.1 (1990): 1-3.
Gordon, H. Scott. "The Economic Theory of a Common-Property Resource: The Fishery."
Classic Papers in Natural Resource Economics (1954): 178-203.
Hardin, Garrett. "Tragedy of the Commons." SpringerReference (1968): 1243-248.
Janssen, Marco A. "The Role of Information in Governing the Commons: Experimental
Results." Ecology and Society 18.4 (2013): n. pag.
Janssen, Marco A. "Introducing Ecological Dynamics into Common-Pool Resource
Experiments." Ecology and Society 15.2 (2010): n. pag.
Janssen, Marco A., François Bousquet, Juan-Camilo Cardenas, Daniel Castillo, and Kobchai
Worrapimphong. "Breaking the elected rules in a field experiment on forestry resources."
Ecological Economics 90 (2013): 132-39.
Janssen, M. A., R. Holahan, A. Lee, and E. Ostrom. "Lab Experiments for the Study of Social-
Ecological Systems." Science 328.5978 (2010): 613-17.
Kimbrough, Erik O., and Alexander Vostroknutov. "The Social and Ecological Determinants of
Common Pool Resource Sustainability." Journal Of Environmental Economics Management 72
(2015): 38-53.
Krugman, Paul R., and Robin Wells. "Chapters 16 and 17." Microeconomics. New York: Worth,
2013. 465-505.
Muller, Andrew, and Finlay Whillans. "A Common Pool Resource Experiment with a Dynamic
Stock Externality." (2008): 1-34. Print.
Noussair, Charles N., Daan Van Soest, and Jan Stoop. "Cooperation in a Dynamic Fishing
Game: A Framed Field Experiment." American Economic Review 105.5 (2015): 408-13.
Ostrom, Elinor, James Walker, and Roy Gardner. "Covenants with and without a Sword: Self-
Governance Is Possible." American Political Science Review 86.02 (1992): 404-17.
44
Schill, Caroline, Therese Lindahl, and Anne-Sophie Crépin. "Collective action and the risk of
ecosystem regime shifts: insights from a laboratory experiment." Ecology and Society 20.1
(2015): n. pag.
Walker, James M., and Roy Gardner. "Probabilistic Destruction of Common-pool Resources:
Experimental Evidence." The Economic Journal 102.414 (1992): 1149.
Walker, J. M., Gardner, R., & Ostrom, E. “Rent dissipation in a limited-access common-pool
resource: Experimental evidence.” Journal of Environmental Economics and Management,
19(3), (1990). 203-211.
45
Appendix A-Experiment Instructions
Instructions
This is an experiment in decision-making. Decisions result in monetary payoffs paid in cash at the
end of the experiment. The payments are compensation for the time and effort put into making
decisions. The experiment lasts about 45 minutes.
Please do not talk to others during the experiment. If you have a question, raise your hand, and an
experimenter will help you.
You are going to play “The Withdrawal Game.” Here is how it works:
1. You will be randomly and anonymously matched with 3 other players over the computer
network.
2. You and the 3 other players will all have access to an account from which each of you can
withdraw money in each of 20 rounds of decision-making.
3. Your withdrawals are important because at the end of the 20 rounds, your payoff from the
game will be the sum of the amounts that you receive from your 20 withdrawals.
4. At the beginning of round 1, the account will have 32 lab dollars (LD; later converted to
real money at a rate of 1 LD = 0.25 USD) in it. You and the 3 other players will individually
choose how much you each withdraw from the account. You only have control over how
much you withdraw. You have no control over how much the other people withdraw. You
each simultaneously choose a whole number between 0 and 10 (inclusive).
5. The account balance will then become 32 LD less the sum of your withdrawal and the
withdrawals of the 3 other people. You will be informed of the total amount withdrawn
from the account and the new account balance.
6. The account balance will grow before the start of round 2. The amount by which the
balance will grow depends on the amount in the account. Growth amounts are given by
Figure 1 (see page 3). If the account has nothing in it, it will not grow. If it has 8 LD in it,
it will grow by 12 LD. If it has 16 LD in it, it will grow by 16 LD, etc…
7. After the account grows by the specified amount (which depends on how much you and
the other 3 people left in it), you will begin round 2, in which you and the other 3 people
will make withdrawal decisions just as you did in round 1. The account will then grow
again, as specified by Figure 1.
8. The process continues for 20 rounds.
9. At the end of the 20 rounds, any money left in the account is lost (kept by the
experimenters).
10. If, before the end of round 20, the account has nothing left in it, advance through the
remaining rounds by withdrawing 0 LD in every round.
11. As long as the sum of your withdrawal and the withdrawals of the other 3 people is no
larger than the amount in the account, you will all receive your withdrawals.
12. If, in a specific round, the sum of your withdrawal and the withdrawals of the other 3 people
is larger than the amount in the account, the amount in the account will be divided as
follows:
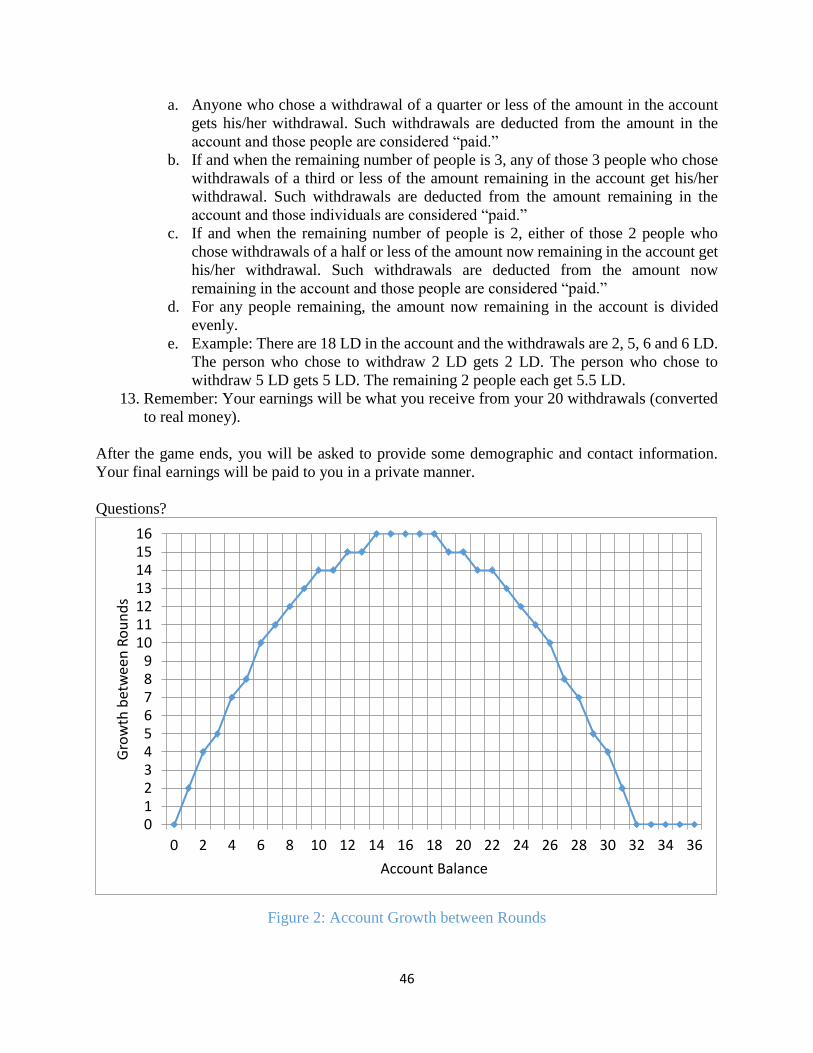
46
a. Anyone who chose a withdrawal of a quarter or less of the amount in the account
gets his/her withdrawal. Such withdrawals are deducted from the amount in the
account and those people are considered “paid.”
b. If and when the remaining number of people is 3, any of those 3 people who chose
withdrawals of a third or less of the amount remaining in the account get his/her
withdrawal. Such withdrawals are deducted from the amount remaining in the
account and those individuals are considered “paid.”
c. If and when the remaining number of people is 2, either of those 2 people who
chose withdrawals of a half or less of the amount now remaining in the account get
his/her withdrawal. Such withdrawals are deducted from the amount now
remaining in the account and those people are considered “paid.”
d. For any people remaining, the amount now remaining in the account is divided
evenly.
e. Example: There are 18 LD in the account and the withdrawals are 2, 5, 6 and 6 LD.
The person who chose to withdraw 2 LD gets 2 LD. The person who chose to
withdraw 5 LD gets 5 LD. The remaining 2 people each get 5.5 LD.
13. Remember: Your earnings will be what you receive from your 20 withdrawals (converted
to real money).
After the game ends, you will be asked to provide some demographic and contact information.
Your final earnings will be paid to you in a private manner.
Questions?
Figure 2: Account Growth between Rounds
0123456789
10111213141516
0 2 4 6 8 10 12 14 16 18 20 22 24 26 28 30 32 34 36
Gro
wth
bet
wee
n R
ou
nd
s
Account Balance
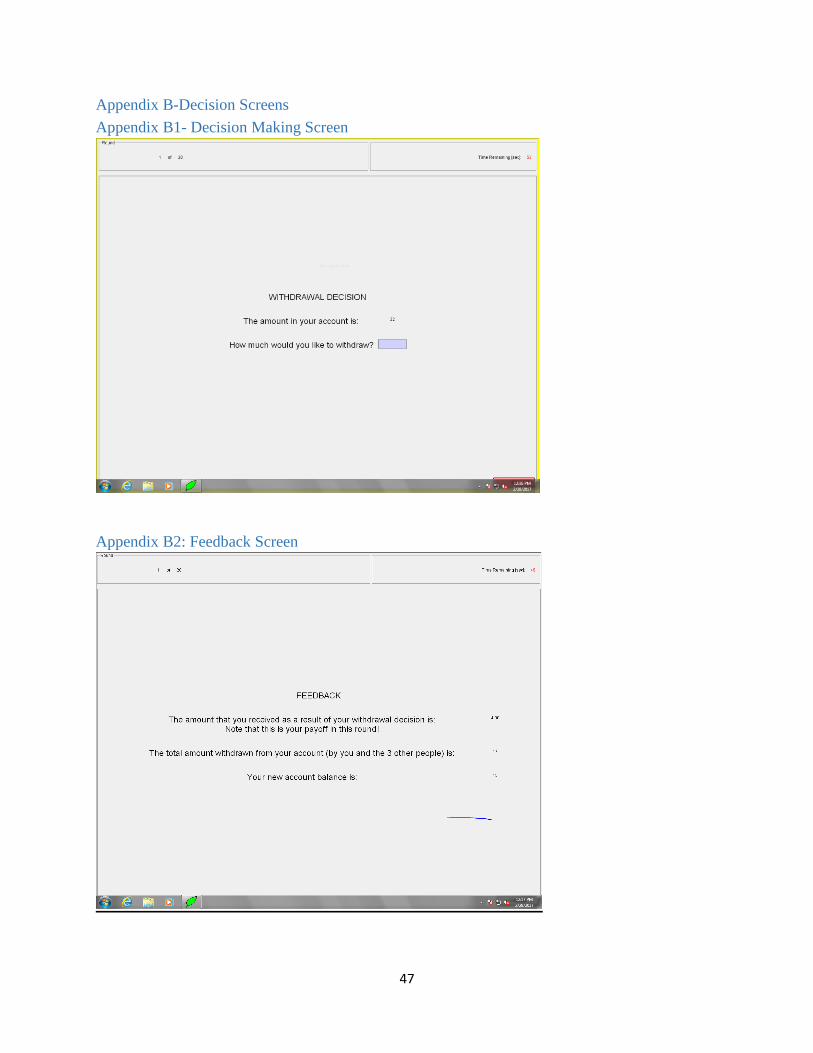
47
Appendix B-Decision Screens
Appendix B1- Decision Making Screen
Appendix B2: Feedback Screen
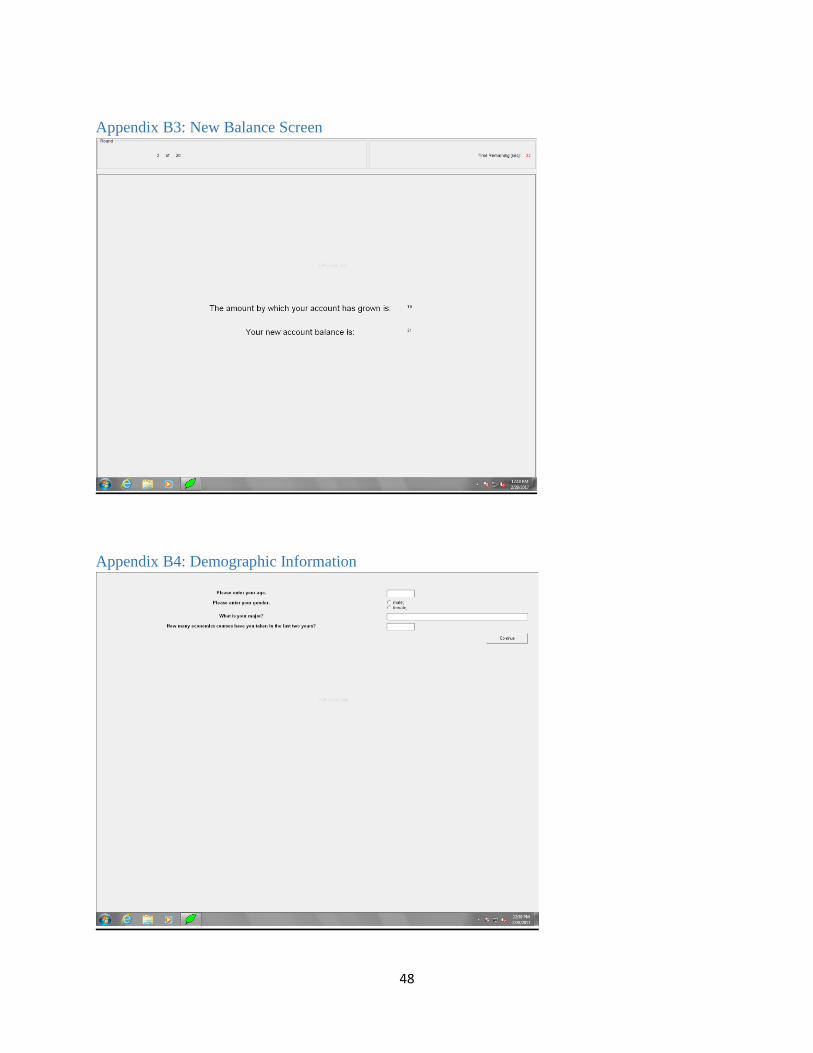
48
Appendix B3: New Balance Screen
Appendix B4: Demographic Information