Embed Size (px)
Citation preview
SMALL CHANGES WITH BIG IMPACT:
EXPERIMENTAL EVIDENCE OF A SCIENTIFIC APPROACH TO THE
DECISION-MAKING OF ENTREPRENEURIAL FIRMS
Arnaldo Camuffo Department of Management & Technology, Bocconi University & ICRIOS, Milan
Alfonso Gambardella Department of Management & Technology, Bocconi University & ICRIOS, Milan, and CEPR, London
Chiara Spina Department of Management & Technology, Bocconi University, Milan
September 2019
Abstract
Identifying the most promising business ideas is key to the introduction of novel firms, but predicting their success can be difficult. We argue that if entrepreneurs adopt a scientific approach by formulating problems clearly, developing theories about the implications of their actions, and testing these theories, they make better decisions. Our theory predicts that the scientific approach corrects the problem of overestimation and underestimation of the returns from business ideas. This has implications for important entrepreneurial choices, such as discontinuing a business idea and pivoting, as well as for performance. Using a field experiment with 251 nascent entrepreneurs attending a pre-acceleration program, we examine the effect of a scientific approach to decision-making. In the field experiment, we teach the treated group to formulate the problem scientifically and to develop and test theories about their actions, while the control group follows a standard training approach. We collect 18 data points on the decision-making and performance of all entrepreneurs for 14 months. Results show that treated entrepreneurs are more likely to close their start-up. We also find that scientific entrepreneurs are more likely to pivot a small number of times, suggesting that the scientific approach makes them more precise in pivoting to more valuable ideas. Finally, we find that the scientific approach increases revenue, suggesting that a more accurate assessment of ideas helps entrepreneurs to make better decisions and eventually leads to better performance. This study shows that the scientific approach is a critical link between decision-making and performance of nascent entrepreneurs.
Keywords: scientific approach, entrepreneurship, field experiment.
1
1. Introduction
The biggest initial challenge entrepreneurs face is to identify a feasible and profitable business idea to
turn into a new venture. The process of idea identification tends to be ‘incoherently chaotic and focused
on the future’ (Eisenhardt and Brown, 1998, p.35) and happens through iterations based on the feedback
entrepreneurs obtain from peers (Chatterji et al., 2019), early customers (Parker, 2006), experts in the
field and sponsors (Cohen et al., 2018), or even family and friends (Bennett and Chatterji, 2017). This
process of idea identification is crucial because initial choices on the direction in which the idea should
develop will determine if it can become a fully-fledged start-up (Aldrich and Martinez, 2015) and in
the long run can greatly constrain or enable the performance of these firms (Dimov, 2007).
History is full of cases where entrepreneurs significantly changed the business idea they
initially identified, as they realized that their original intuition was unlikely to work. Twitter, for
instance, was conceived as Odeo, a platform that simplified the search for and subscription to podcasts.
As iTunes started to gain popularity in the podcast space, Odeo turned into Twitter, a micro-blogging
platform. This iteration represented a radical change in strategy (a ‘pivot’), which allowed the owners
to avoid a costly mistake. Similar radical changes also marked the early days of successful tech
companies such as Instagram, Lyft, PayPal, Pinterest, Slack and YouTube. All these pivots required
entrepreneurs to understand what elements of their business ideas were likely to work and in which
direction they should turn.
Extant studies on this topic converge on the iterative nature of the process entrepreneurs go
through as they evaluate and develop their business ideas (Baron and Ensley, 2006), but do not clarify
how this process of strategic change and pivoting should be conducted. Emerging streams in
entrepreneurship such as effectuation (Sarasvathy, 2001) and bricolage (Baker and Nelson, 2005)
propose that entrepreneurs should rely on non-predictive techniques given the high uncertainty
surrounding the creation of a new venture. Proponents of these approaches argue that entrepreneurs
should ‘make do’ with what they have at hand and improvise to win over stakeholders that will co-
create new products and markets with the entrepreneur (Wiltbank et al., 2006). Effectual and bricolage
approaches are attempts to acknowledge the bounded rationality of the entrepreneur and embrace the
uncertainty of the environment by setting aside predictions and focusing on controlling the environment.
2
Other scholars suggest, instead, that structured and disciplined processes of idea evaluation and
development can mitigate fallible judgement (Hogarth and Karelaia, 2012) and reduce the cognitive
biases that affect entrepreneurial decision-making (Murray and Tripsas, 2004; Camuffo et al., 2019;
Cohen et al., 2018; Kahneman et al., 2019).
Drawing on the latter stream of research, we propose that entrepreneurs can better understand
whether their business idea is valuable when they formulate problems clearly, develop theories about
the implications of their actions, and test these theories rigorously. In conducting these actions, labelled
‘a scientific approach to decision-making’, entrepreneurs also become better equipped to gather and
interpret valuable signals from customers and other stakeholders that contribute to pivots of the initial
business idea (Furr, 2009; Gans et al., 2016; Camuffo et al., 2019). Our theory also discusses the
implications of this approach for entrepreneurial action by contrasting two ‘stylized ideal types’ of
entrepreneurs (‘confused’ or ‘unimaginative’) and using such a distinction as a conceptual device to
illustrate the different ways in which the scientific approach might affect how entrepreneurs assess and
change their business ideas.
In this study, we provide evidence of the impact of a scientific approach to entrepreneurial
decision-making by conducting a field experiment with 251 nascent entrepreneurs attending a pre-
acceleration program. In our study, we randomly assign entrepreneurs to either a treatment (being taught
how to use a scientific approach when developing a business idea) or a control group (being taught how
to develop a business idea). We then collect detailed data about their performance and decision-making
over 14 months to investigate how a scientific approach impacts the development of these business
ideas. We find that treated entrepreneurs are more likely to close their business than entrepreneurs in
the control group, and that they exhibit patterns of pivoting consistent with the idea that they are more
precise in changing business direction. We also find that they make higher revenue than entrepreneurs
in the control group. Taken together, our results are consistent with the idea that the scientific approach
corrects the problem of overestimation and underestimation of the returns from business ideas.
We begin in Section 2 by clarifying what a scientific approach to entrepreneurial decision-
making means. Section 3 provides initial evidence of how a scientific approach affects entrepreneurs’
decisions, using graphs to capture different patterns in the behavior of the treatment and control groups.
3
The goal of this section is to offer an intuitive representation of the effect of the adoption of a scientific
approach on entrepreneurial decisions and behavior. Moreover, we answer the recent call of many
scholars to ‘show the data’ in order to display where regression results come from and mitigate the
emphasis on regression estimates and p-values in the interpretation of results (Halsey et al., 2015; Bettis
et al., 2016; Goldfarb and King, 2016; Starr and Goldfarb, 2018; Greve, 2018; Levine, 2018). Section
4 articulates the paper’s theory and formulates three research propositions. Our theory – further
elaborated in the Appendix, which includes a model that explains more formally the logic of our analysis
– offers a plausible explanation for the patterns we observe in our data. The research design, data and
methods are illustrated in Section 5. Section 6 uses a variety of regression analyses and other robustness
checks to provide additional evidence of how the adoption of a scientific approach affects
entrepreneurial decisions in ways consistent with our propositions. Section 7 highlights some
limitations, implications and potential development directions of this research.
2. A scientific approach to decision-making
A key feature of nascent entrepreneurship is that returns from business ideas are extremely skewed and
their quality is hard to assess. Acquiring knowledge about the potential outcomes of a business idea can
reduce this fundamental uncertainty (Delmar and Shane, 2003; Dencker et al., 2009), because it
generates information about the ultimate value of a business idea. We propose that a scientific approach
to decision-making can reveal more precise information and lead to better estimates of the value of a
business idea.
Extant literature suggests there are two fundamental types of decision-making in early-stage
entrepreneurship. The first type is akin to trial and error (Dencker et al., 2009), and it normally involves
experimenting sequentially with various methods until entrepreneurs achieve some results. This search
strategy is normally ‘blind’ or only guided by prior assumptions and beliefs, and consequently
entrepreneurs often run the risk of engaging in confirmatory search (Shepherd et al., 2012). An
alternative approach to decision-making that entrepreneurs can take is a more systematic and structured
one, which has been called purposeful (Murray and Tripsas, 2004), or scientific (Camuffo et al, 2019).
We define this scientific approach as a discipline, a set of behavioral routines – similar to those used by
4
scientists – that the entrepreneurs follow to discover the value of their ideas and develop them. This
discipline can be taught and learned, and comprises four major components:
1. The articulation of a ‘theory’ (Zenger, 2016), which typically leads to the definition of a
business model as grounded on correctly framing the customer problem the founding team wishes to
solve. Scientist entrepreneurs treat customer problems as research questions and formulate theories
about them that are novel, simple, falsifiable and generalizable (Felin and Zenger, 2009 and 2017).
2. The explicit formulation of hypotheses that are composed from the ‘theory’ and enable the
entrepreneurs to bring it to reality. Hypotheses are educated guesses about the customers, their
problems, etc. They are testable and falsifiable inasmuch as they clearly define the contingencies in
which they are not false (or are definitely false) and can produce good, actionable evidence and
validated learning (Eisenmann et al., 2011).
3. The empirical testing of the hypotheses, through rigorous data collection and analysis and,
possibly, through experiments (Murray and Tripsas, 2004; Kerr, Nanda, & Rhodes-Kropf, 2014). These
tests need to be rigorous, and evidence- or data-driven. They use valid and reliable metrics. They allow
us to identify causal relationships (experimental or quasi-experimental designs) (Davenport, 2009).
4. The open, critical and independent analysis and interpretation of the outcomes of the tests. The
honest and thorough evaluation of the evidence gathered testing hypotheses requires both individual
and collective judgement (Pfeffer and Sutton, 2006), as well as critical appraisal of evidence. Openness
to questioning, discussion and criticism is a crucial part of entrepreneurial decision-making, as it is in
science (Rousseau, 2006).
Bennet and Chatterji (2017) and Camuffo et al. (2019) provide evidence that the majority of
entrepreneurs do not ‘naturally’ behave in a scientific manner. We expect that entrepreneurs who
‘discipline’ their decisions according to this approach will make better predictions of the value of their
business idea, and will act accordingly, as detailed in the next section.
3. Our findings at a glance: a preliminary representation of the treatment effects
Before we present our theory, we show our raw data. The goal is twofold. On the one hand, we want to
display basic patterns in the data. On the other hand, we use these patterns to build our theory, which
we illustrate in the next section. In this section, we define our variables and data broadly for the purpose
5
of this preliminary discussion. Section 5 provides more details about our data, the variables we use, and
the design of the experiment.
Figure 1 summarizes whether the 251 start-ups that attended our pre-acceleration program
abandoned the business (exit), or changed some important elements of it (pivot) such as the core value
proposition of the business or the target customers, during the 14 months (66 weeks) in which we
followed them. The figure distinguishes between the 126 start-ups in the treatment group, which we
exposed to training that included the adoption of a scientific approach to decision-making, and the 125
start-ups in the control group, which we exposed to similar training of equal time and intensity, but
without the focus on the scientific approach. Quite a few start-ups that exited during our time frame
pivoted before they exited. Figure 1 then includes the pivots of the start-ups that exit later on. However,
the histograms remain qualitatively similar if we exclude the start-ups that exit.
***** Figure 1 About Here *****
The first column in Figure 1 represents the number of start-ups that exited during our time
frame. As the figure shows, more start-ups in the treatment group exited than in the control group (59
vs 46). This finding, which confirms what Camuffo et al. (2019) found in a smaller-scale randomized
control trial, is counterintuitive because we would expect that the scientific approach would increase
the success of a business. The following columns show the number of start-ups, in the treatment and
control group, that pivoted from 0 up to 5 times during the analyzed period. Fewer start-ups in the
treatment group pivoted 0 times (59 vs 68 – column 2). This means that treated start-ups tend to stick
to their initial idea less than their counterparts. This is consistent with the fact that not only do treated
start-ups exit more, but they also pivot one time more frequently than controls (43 vs 29 – column 3).
Interestingly, while the number of start-ups in the treatment and control group that pivoted two times is
the same (17), fewer start-ups in the treatment group pivoted three or more times (7 vs 11). These
patterns suggest that the scientific approach helps entrepreneurs see new opportunities they can pivot
to; however, once they see a new business opportunity, they tend to stick to it, as if they are more precise
in seeing good opportunities to which they can pivot.
Figure 2 (left graph) shows the effect of the scientific treatment on performance, using revenue
as a proxy. This graph reports the cumulative shares of start-ups that in each week start generating

6
revenue. The figure shows that start-ups in the control group are more likely to start generating revenue
earlier. This is intriguing as it suggests that the start-ups treated with the scientific approach do not start
making revenue earlier, and it indicates that a scientific approach does not speed up the process of
commercialization of the products that start-ups offer. Figure 2 (right graph) reports, instead, on the
average cumulative revenue in each week of the start-ups in the treatment group compared to that for
the control group. This average includes start-ups that generate zero revenue. Treated start-ups
systematically generate a higher average cumulative revenue. This is a result with important
implications, suggesting that a scientific approach leads to a more successful (though not quicker)
commercialization of the products start-ups offer. These graphs suggest that start-ups in the treatment
group move more cautiously and take more time to generate revenue than control start-ups. However,
based on this initial revenue data, they seem to be able to focus on more profitable ideas.
***** Figure 2 About Here *****
33 start-ups in our sample make revenue during the time frame of our experiment. This is
unsurprising given that these entrepreneurs enter the pre-acceleration program with just a business idea,
and we observe their performance for 14 months. Of these start-ups, 17 are in the treatment group and
16 in the control group. This provides further evidence that the effect of the treatment is not to raise the
odds of a start-up successfully making more revenue. In fact, it squares with the result about exit in that
the treatment seems to mostly have an effect on the tails of the analyzed sample distribution – more
exit, higher average revenue conditional on making revenue. To summarize, the preliminary evidence
illustrated in this section highlights three patterns of behavior in treated entrepreneurs: 1) they are more
likely to exit (abandon their business idea) than entrepreneurs in the control group; 2) they do not pivot
more than the control group, but they are more likely to pivot once or twice, and less likely to pivot
zero or many times; 3) they generate revenue later than the control group, but they generate higher
revenue on average.
4. Theory
4.1. Building blocks
We focus on entrepreneurs who, at least to some extent, base their decisions on predictions. In
particular, they evaluate the attractiveness and potential returns of their business idea by predicting a
7
performance variable. It is not easy to nail down how entrepreneurs think, particularly when they
consider starting a new business and have to make early decisions such as product-market fit, the
business model, or more generally the identity of their firms. Some scholars or practitioners argue that
they ‘just do it’ or follow patterns such as effectuation (Sarasvasthy, 2001), pattern recognition (Baron
and Ensley, 2006), bricolage (Baker and Nelson, 2005) or other routines or heuristics. However, in
general, entrepreneurs combine thinking and doing (Ott et al., 2017) that involves some form of
prediction, even if coarse and unrefined. Moreover, they are more likely to make predictions when the
decision is important. Even the entrepreneurs in our trial, who operate in relatively simple businesses
(such as retail and e-Commerce), tend to use predictions to make important decisions – albeit possibly
in fuzzy ways, and in combination with other elements.
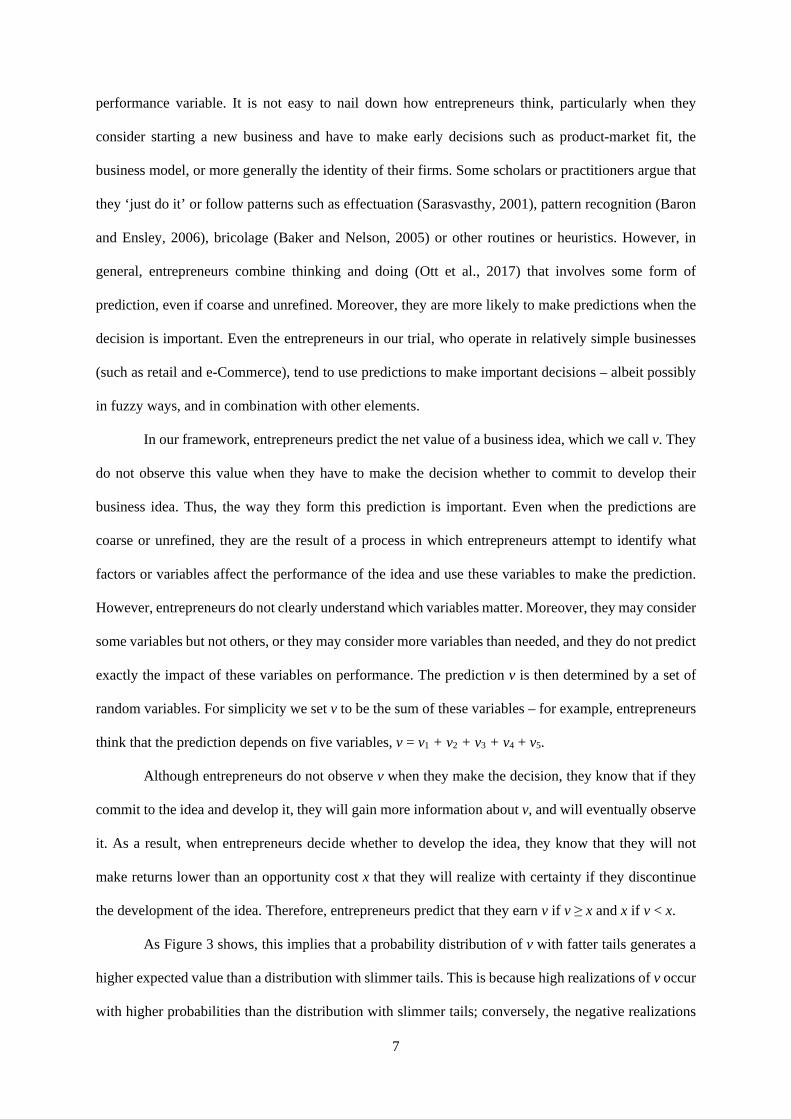
In our framework, entrepreneurs predict the net value of a business idea, which we call v. They
do not observe this value when they have to make the decision whether to commit to develop their
business idea. Thus, the way they form this prediction is important. Even when the predictions are
coarse or unrefined, they are the result of a process in which entrepreneurs attempt to identify what
factors or variables affect the performance of the idea and use these variables to make the prediction.
However, entrepreneurs do not clearly understand which variables matter. Moreover, they may consider
some variables but not others, or they may consider more variables than needed, and they do not predict
exactly the impact of these variables on performance. The prediction v is then determined by a set of
random variables. For simplicity we set v to be the sum of these variables – for example, entrepreneurs
think that the prediction depends on five variables, v = v1 + v2 + v3 + v4 + v5.
Although entrepreneurs do not observe v when they make the decision, they know that if they
commit to the idea and develop it, they will gain more information about v, and will eventually observe
it. As a result, when entrepreneurs decide whether to develop the idea, they know that they will not
make returns lower than an opportunity cost x that they will realize with certainty if they discontinue
the development of the idea. Therefore, entrepreneurs predict that they earn v if v ≥ x and x if v < x.
As Figure 3 shows, this implies that a probability distribution of v with fatter tails generates a
higher expected value than a distribution with slimmer tails. This is because high realizations of v occur
with higher probabilities than the distribution with slimmer tails; conversely, the negative realizations
8
that make the fatter distribution less appealing do not occur because entrepreneurs realize x instead of
the low realizations of v to the right of x. The variability of v is then crucial, and this paper argues that
the scientific approach affects this variability. However, in order to understand the effect of the scientific
approach on the breadth of the distribution of v, we first focus on the sources of this variability.
***** Figure 3 About Here *****
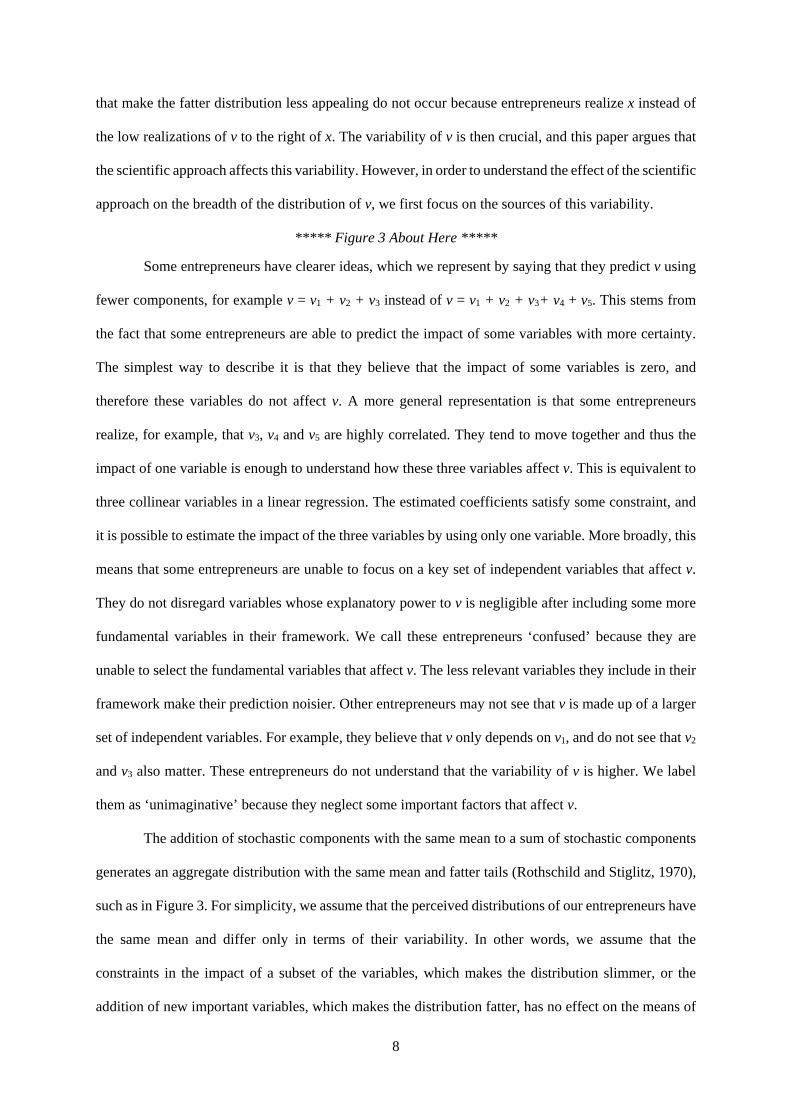
Some entrepreneurs have clearer ideas, which we represent by saying that they predict v using
fewer components, for example v = v1 + v2 + v3 instead of v = v1 + v2 + v3+ v4 + v5. This stems from
the fact that some entrepreneurs are able to predict the impact of some variables with more certainty.
The simplest way to describe it is that they believe that the impact of some variables is zero, and
therefore these variables do not affect v. A more general representation is that some entrepreneurs
realize, for example, that v3, v4 and v5 are highly correlated. They tend to move together and thus the
impact of one variable is enough to understand how these three variables affect v. This is equivalent to
three collinear variables in a linear regression. The estimated coefficients satisfy some constraint, and
it is possible to estimate the impact of the three variables by using only one variable. More broadly, this
means that some entrepreneurs are unable to focus on a key set of independent variables that affect v.
They do not disregard variables whose explanatory power to v is negligible after including some more
fundamental variables in their framework. We call these entrepreneurs ‘confused’ because they are
unable to select the fundamental variables that affect v. The less relevant variables they include in their
framework make their prediction noisier. Other entrepreneurs may not see that v is made up of a larger
set of independent variables. For example, they believe that v only depends on v1, and do not see that v2
and v3 also matter. These entrepreneurs do not understand that the variability of v is higher. We label
them as ‘unimaginative’ because they neglect some important factors that affect v.
The addition of stochastic components with the same mean to a sum of stochastic components
generates an aggregate distribution with the same mean and fatter tails (Rothschild and Stiglitz, 1970),
such as in Figure 3. For simplicity, we assume that the perceived distributions of our entrepreneurs have
the same mean and differ only in terms of their variability. In other words, we assume that the
constraints in the impact of a subset of the variables, which makes the distribution slimmer, or the
addition of new important variables, which makes the distribution fatter, has no effect on the means of
9
the distributions. This is reasonable because the effects produced by an increase or a reduction in the
number of components could be positive or negative and may cancel out on average. Moreover, this
assumption is not a crucial one and we will clarify its implications in our discussion whenever it is
relevant to do so. Therefore, confused entrepreneurs, who are unable to select few relevant variables
that determine v, perceive distributions in which extreme realizations at both ends occur with higher
probability. Conversely, unimaginative entrepreneurs, who are unable to see that some other variables
affect v, perceive distributions with slimmer tails.
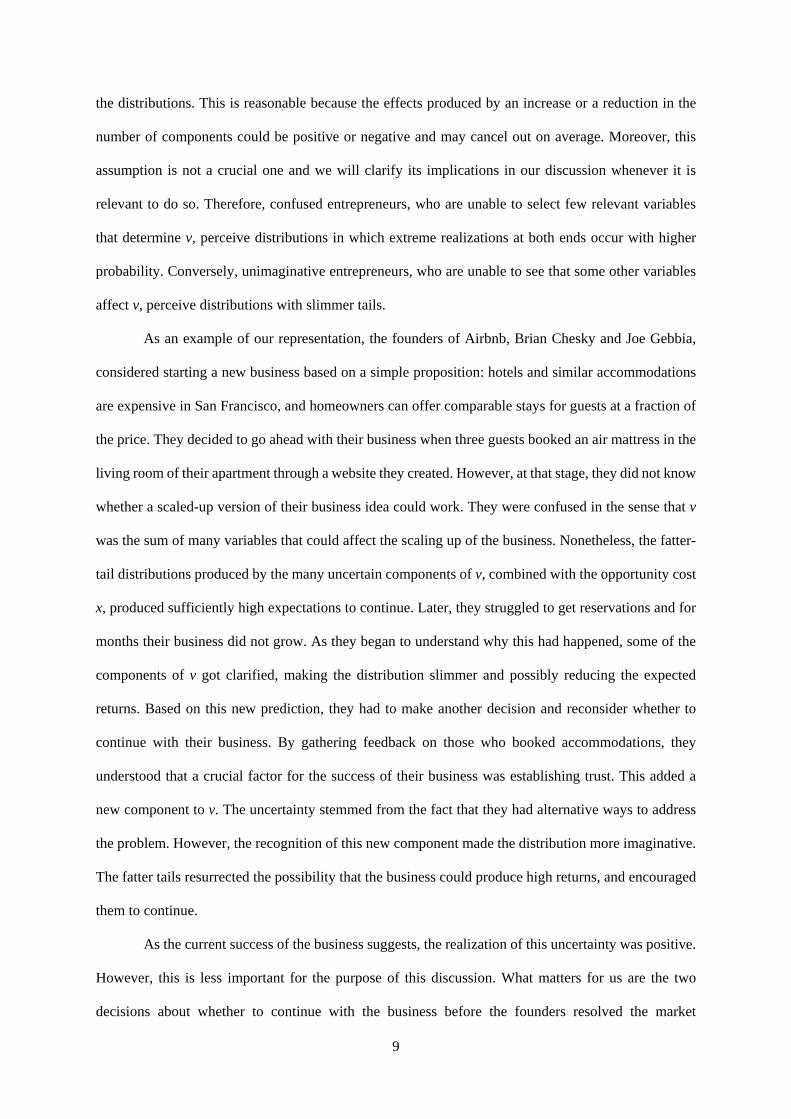
As an example of our representation, the founders of Airbnb, Brian Chesky and Joe Gebbia,
considered starting a new business based on a simple proposition: hotels and similar accommodations
are expensive in San Francisco, and homeowners can offer comparable stays for guests at a fraction of
the price. They decided to go ahead with their business when three guests booked an air mattress in the
living room of their apartment through a website they created. However, at that stage, they did not know
whether a scaled-up version of their business idea could work. They were confused in the sense that v
was the sum of many variables that could affect the scaling up of the business. Nonetheless, the fatter-
tail distributions produced by the many uncertain components of v, combined with the opportunity cost
x, produced sufficiently high expectations to continue. Later, they struggled to get reservations and for
months their business did not grow. As they began to understand why this had happened, some of the
components of v got clarified, making the distribution slimmer and possibly reducing the expected
returns. Based on this new prediction, they had to make another decision and reconsider whether to
continue with their business. By gathering feedback on those who booked accommodations, they
understood that a crucial factor for the success of their business was establishing trust. This added a
new component to v. The uncertainty stemmed from the fact that they had alternative ways to address
the problem. However, the recognition of this new component made the distribution more imaginative.
The fatter tails resurrected the possibility that the business could produce high returns, and encouraged
them to continue.
As the current success of the business suggests, the realization of this uncertainty was positive.
However, this is less important for the purpose of this discussion. What matters for us are the two
decisions about whether to continue with the business before the founders resolved the market
10
uncertainty associated with it. In the first decision, the confused distribution prompted them to continue.
In the second decision, the additional component ‘trust’ had a similar effect. By making the distribution
more imaginative, it prompted Airbnb founders to continue in spite of the negative signal they had
received in the first few months of operation.
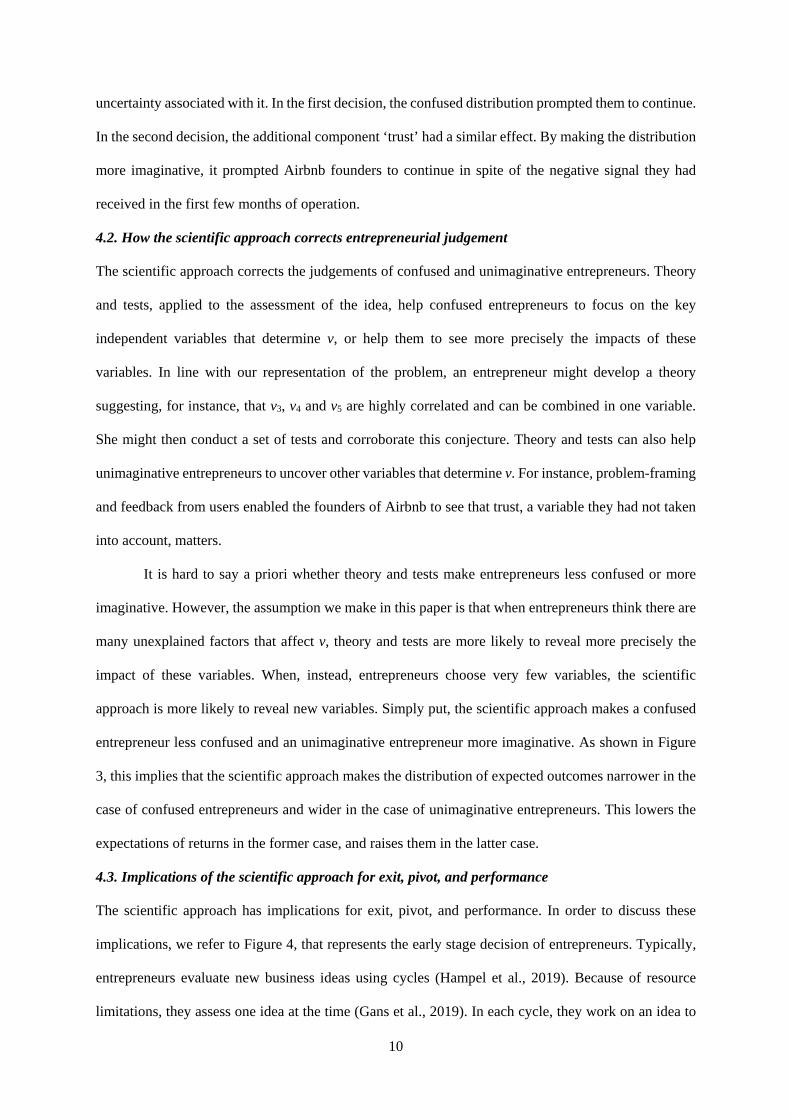
4.2. How the scientific approach corrects entrepreneurial judgement
The scientific approach corrects the judgements of confused and unimaginative entrepreneurs. Theory
and tests, applied to the assessment of the idea, help confused entrepreneurs to focus on the key
independent variables that determine v, or help them to see more precisely the impacts of these
variables. In line with our representation of the problem, an entrepreneur might develop a theory
suggesting, for instance, that v3, v4 and v5 are highly correlated and can be combined in one variable.
She might then conduct a set of tests and corroborate this conjecture. Theory and tests can also help
unimaginative entrepreneurs to uncover other variables that determine v. For instance, problem-framing
and feedback from users enabled the founders of Airbnb to see that trust, a variable they had not taken
into account, matters.
It is hard to say a priori whether theory and tests make entrepreneurs less confused or more
imaginative. However, the assumption we make in this paper is that when entrepreneurs think there are
many unexplained factors that affect v, theory and tests are more likely to reveal more precisely the
impact of these variables. When, instead, entrepreneurs choose very few variables, the scientific
approach is more likely to reveal new variables. Simply put, the scientific approach makes a confused
entrepreneur less confused and an unimaginative entrepreneur more imaginative. As shown in Figure
3, this implies that the scientific approach makes the distribution of expected outcomes narrower in the
case of confused entrepreneurs and wider in the case of unimaginative entrepreneurs. This lowers the
expectations of returns in the former case, and raises them in the latter case.
4.3. Implications of the scientific approach for exit, pivot, and performance
The scientific approach has implications for exit, pivot, and performance. In order to discuss these
implications, we refer to Figure 4, that represents the early stage decision of entrepreneurs. Typically,
entrepreneurs evaluate new business ideas using cycles (Hampel et al., 2019). Because of resource
limitations, they assess one idea at the time (Gans et al., 2019). In each cycle, they work on an idea to
11
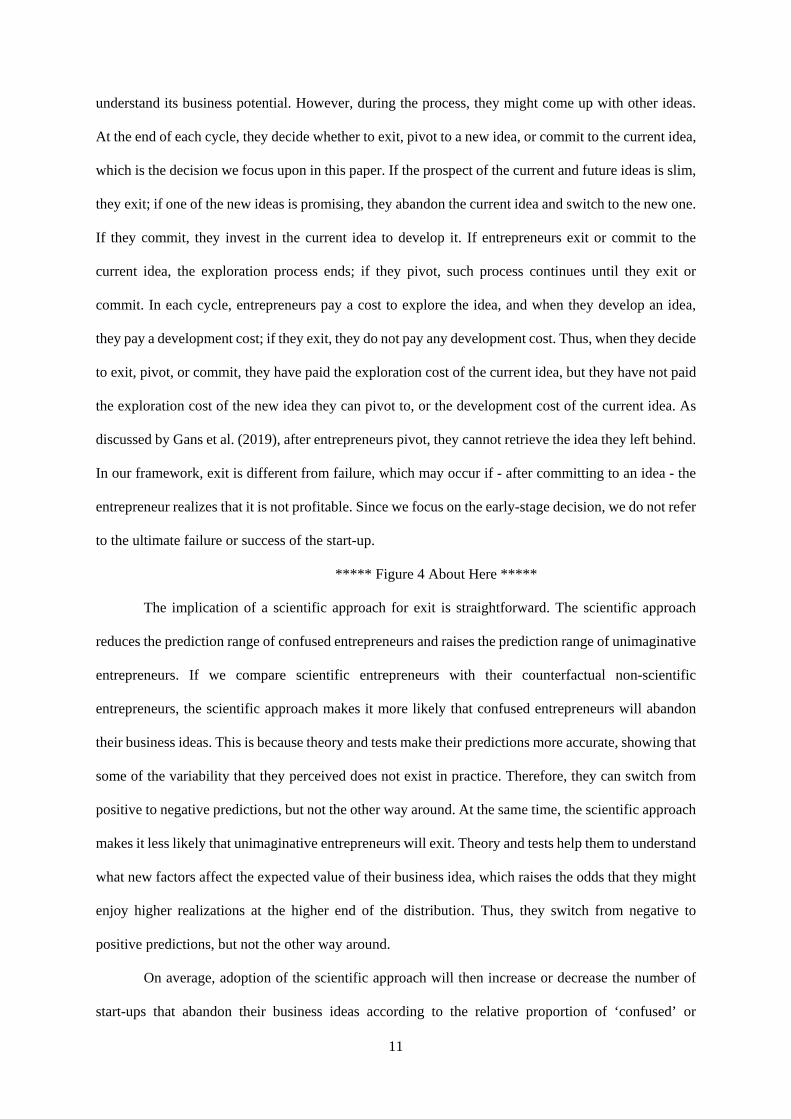
understand its business potential. However, during the process, they might come up with other ideas.
At the end of each cycle, they decide whether to exit, pivot to a new idea, or commit to the current idea,
which is the decision we focus upon in this paper. If the prospect of the current and future ideas is slim,
they exit; if one of the new ideas is promising, they abandon the current idea and switch to the new one.
If they commit, they invest in the current idea to develop it. If entrepreneurs exit or commit to the
current idea, the exploration process ends; if they pivot, such process continues until they exit or
commit. In each cycle, entrepreneurs pay a cost to explore the idea, and when they develop an idea,
they pay a development cost; if they exit, they do not pay any development cost. Thus, when they decide
to exit, pivot, or commit, they have paid the exploration cost of the current idea, but they have not paid
the exploration cost of the new idea they can pivot to, or the development cost of the current idea. As
discussed by Gans et al. (2019), after entrepreneurs pivot, they cannot retrieve the idea they left behind.
In our framework, exit is different from failure, which may occur if - after committing to an idea - the
entrepreneur realizes that it is not profitable. Since we focus on the early-stage decision, we do not refer
to the ultimate failure or success of the start-up.
***** Figure 4 About Here *****
The implication of a scientific approach for exit is straightforward. The scientific approach
reduces the prediction range of confused entrepreneurs and raises the prediction range of unimaginative
entrepreneurs. If we compare scientific entrepreneurs with their counterfactual non-scientific
entrepreneurs, the scientific approach makes it more likely that confused entrepreneurs will abandon
their business ideas. This is because theory and tests make their predictions more accurate, showing that
some of the variability that they perceived does not exist in practice. Therefore, they can switch from
positive to negative predictions, but not the other way around. At the same time, the scientific approach
makes it less likely that unimaginative entrepreneurs will exit. Theory and tests help them to understand
what new factors affect the expected value of their business idea, which raises the odds that they might
enjoy higher realizations at the higher end of the distribution. Thus, they switch from negative to
positive predictions, but not the other way around.
On average, adoption of the scientific approach will then increase or decrease the number of
start-ups that abandon their business ideas according to the relative proportion of ‘confused’ or
12
‘unimaginative’ entrepreneurs. Current evidence suggests that entrepreneurs tend to perceive their ideas
as more valuable than they actually are, as shown by the high failure rate of start-ups (Fairlie and
Miranda, 2017), excess entry (Camerer and Lovallo, 1999) and other analyses of the perception of
entrepreneurial returns (Astebro, 2002; Cain et al., 2015). Therefore, if on average entrepreneurs
overestimate the values of their business ideas, the scientific approach ought to increase the share of
exits, which is consistent with the data we presented in the previous section. Our assumption that the
scientific approach does not affect the mean of the distributions is not crucial. If the scientific approach
increased the mean of the distribution, both confused and unimaginative entrepreneurs would be less
likely to exit. Still, if we observe that the scientific approach increases exit, our theory suggests that this
must be because most entrepreneurs are confused. We state our first proposition as follows:
Proposition 1. If most entrepreneurs overestimate the value of their idea, the scientific approach is
more likely to reduce the expected value of their ideas, increasing the share of entrepreneurs that exit;
the opposite will be true if entrepreneurs underestimate the value of their idea.
With regards to pivoting, entrepreneurs compare the current idea with the new idea. The new
idea is more uncertain because entrepreneurs have studied the current idea for some time, which has
reduced uncertainty. This also raises differences in the perception of the new idea vis-à-vis the current
idea. Lack of imagination or confusion can be traits of the entrepreneurs or of the domain that they
explore. As a matter of fact, entrepreneurs explore in similar domains or activities; for instance, the new
idea could be related to a variation of the original product, or it could be offered to a different market.
Whatever the reason, lack of imagination affects both the current and the new idea, and so does
confusion. For example, by working on the current idea for some time, unimaginative entrepreneurs
understand aspects of it that were unclear when they started exploring. In particular, as they understand
the current idea better, and they assess it, they may see determinants of its value that they were unable
to see before exploring, and become more imaginative about it. Similarly, confused entrepreneurs are
unable to select important determinants. After they explore, they reduce confusion about the current
idea. Of course, this does not eliminate uncertainty about the current idea. Moreover, as we discussed,
the scientific approach helps decision-makers to correct lack of imagination and confusion to a greater
13
extent. The point we make here is simply that this correction arises, in part and to a lesser extent, just
from exploring and understanding the idea better. In contrast, uncertainty about the new idea looms
larger. Unimaginative entrepreneurs are then relatively more unimaginative about the new idea than the
current idea. Similarly, confused entrepreneurs are relatively more confused about the new idea
compared to the current idea.
As discussed earlier, lack of imagination, which implies inability to see important determinants,
implies that entrepreneurs perceive a lower value of the idea. As a result, if unimaginative entrepreneurs
are more imaginative about the current than the new idea, they are less likely to pivot because they
perceive a relatively higher value of the current idea with respect to the new one. Confused
entrepreneurs are less likely to be confused about the current idea because of the exploration they did,
and they are more likely to be confused about the new idea they did not explore. Since greater confusion
raises the perceived prospects, confused entrepreneurs are, instead, more likely to pivot.
The scientific approach reduces these differences in perception of the current and new idea
between different types of entrepreneurs, or different entrepreneurial projects. As we said, entrepreneurs
tend to search in the same domain. Over the search cycles, they learn about this domain, which implies
that they learn about common elements that link current and new ideas. In turn, this means that if
unimaginative entrepreneurs become more imaginative thanks to theory and tests, they are likely to
learn more about potential determinants of the new idea as well. Thus, unimaginative entrepreneurs
become more imaginative about the current idea because of the exploration they did; however, the
unimaginative entrepreneurs who adopt a scientific approach, which corrects their lack of imagination,
realize the common elements between the current and the future idea, know how to link them, and
therefore they become more imaginative about the new idea as well. As a result, the adoption of the
scientific approach raises the relative value of the new idea with respect to the current one. The
unimaginative scientific entrepreneurs are then more likely to pivot than the unimaginative non-
scientific entrepreneurs.
Consider now the case of confused entrepreneurs. Like in the previous case, exploring the
current idea substitutes - in part – for the scientific approach. This makes the assessment of the current
14
idea of non-scientific and confused entrepreneurs more similar to the scientific and confused
entrepreneurs. This difference is instead more pronounced for the new idea that does not benefit from
the levelling off generated by exploring. Thus, non-scientific and confused entrepreneurs perceive a
relatively higher potential of the new idea vis-à-vis the current idea compared to confused entrepreneurs
that adopt the scientific approach. The former are then more likely to pivot than the latter.
Overall, this implies that the scientific approach reduces the difference between the perceived
value of the current and new idea between unimaginative and confused entrepreneurs . Assuming that
there are both unimaginative and confused entrepreneurs, the scientific approach makes it more likely
that unimaginative entrepreneurs pivot, and less likely that confused entrepreneurs pivot. If we rule out
exit because the current idea is good enough, then, following the sequence of cycles of Figure 4,
confused entrepreneurs are the most likely to pivot at each stage. Therefore they exhibit the highest
number of pivots across cycles. Unimaginative entrepreneurs are the least likely to pivot at each stage,
and exhibit the least number of pivots. Scientific entrepreneurs are in between: they pivot a few times
but not many times. Specifically, confused entrepreneurs who adopt the scientific approach are less
likely to pivot at each stage than the counterfactual confused entrepreneurs who do not adopt the
approach: therefore, the former entrepreneurs pivot fewer times than the latter entrepreneurs.
Unimaginative entrepreneurs who adopt the scientific approach are more likely to pivot than the
counterfactual unimaginative entrepreneurs at each stage: therefore the former entrepreneurs pivot more
times than the latter entrepreneurs.
If the scientific approach increase the mean of the distributions, then irrespective of whether
entrepreneurs are unimaginative or confused, both the current and new idea will generate higher returns.
As we discussed earlier, this process affects exit, but it is unclear how it affects the decision to pivot
because it does not produce a clear indication of whether the current and new idea change to a different
extent. We would need to make assumptions about the changes across search cycles produced by the
impact of the scientific approach on the expected value of the ideas. If we do not make these
assumptions, we can conclude that the main drivers of the decision to pivot are the lower variability of
the current idea, and the lower difference on the variability of the current vis-à-vis the new idea
15
produced, the use of a scientific approach, and the characteristics of the entrepreneurs (or the domain
of the problem). We state our second proposition as follows.
Proposition 2. Entrepreneurs who adopt the scientific approach are likely to pivot a few times but
unlikely to pivot many times.
So far, we have been agnostic about whether the scientific approach generates better
predictions. The logic we discussed simply states that the scientific approach narrows the perception of
excessively wide distributions and widens the perception of excessively narrow distributions of
expected returns. Wide or narrow distributions do not correspond to worse or better predictions, per se.
However, a corollary of Propositions 1 and 2 is that the scientific approach should improve
performance. In fact, at a minimum, if we assume that the scientific approach does not have any effect
on the development of the business idea and that there is no heterogeneity in development capabilities
(or that these are randomly distributed), scientist entrepreneurs should perform better on average. This
is because, having assessed their ideas better, they avoid pursuing or pivoting to less promising ideas
(if confused), or they pursue or pivot to ideas that did not initially look promising enough but that turn
out to be so (if unimaginative). Our third proposition is as follows:
Proposition 3. Entrepreneurs adopting the scientific approach will enjoy higher revenue than non-
scientist entrepreneurs because they will avoid pursuing less promising ideas (if ‘confused’) or they
will pursue more promising ideas (if ‘unimaginative’).
5. Research design
5.1. The randomized control trial
Our research embeds a field experiment into a pre-acceleration program, or a ‘start-up school’ that
provides training to early-stage entrepreneurs for short periods of time. This type of program represents
an ideal setting for our enquiry because it selects and trains entrepreneurs that only have a business idea
and have yet to undertake significant steps to bring their product or service to the market. Moreover,
administering our treatment through training is a suitable choice because training programs have been
shown to affect outcomes for treated entrepreneurs (Anderson et al., 2018; Campos et al., 2018).
16
Participants in our program are early-stage entrepreneurial firms, which are defined as those
run by founders in the process of starting a business (Bosma et al., 2012). We issued a call for
applications using multiple online (blogs, online communities) and offline channels (magazines for
entrepreneurs, events), resulting in a total of 272 applications, out of which we selected into the
intervention 258 start-ups. Seven start-ups abandoned the program before its start, so our final sample
consisted of 251 participants. We used a statistical software package (Stata) to randomly assign each
start-up to one of the two arms of the experiment (treatment and control groups)1. We checked that the
treatment (126 start-ups) and control groups (125 start-ups) were balanced on a number of key
covariates that might affect the absorption of the intervention and its subsequent outcomes. We report
the results of these randomization checks in the Online Appendix. This analysis confirms that the two
arms of the experiment are balanced on key characteristics such as demographic variables (age, highest
education level, work experience of the entrepreneurial team), industry, founding team size and
composition, effort, and the expected performance and subjectively estimated value of the business
idea. Given the number of checks, we are confident that the randomization was successful.
Following best practices (Baird et al., 2016), we pre-registered this randomized controlled trial
on September 15, 2017. The intervention took place at the end of September 2017 and finished in
December 2017 with the 251 participants attending a training program designed by the research team.
Our pre-acceleration program focuses on market validation, with a series of activities aimed at testing
the desirability of a product or service concept against a potential target market. These activities provide
suitable information to help entrepreneurs assess the potential of their business ideas and are frequently
taught in pre-acceleration programs. In order to offer engaging lessons and a valuable learning
experience to participants, we divided the treated and control groups into smaller groups that were
randomly matched with seven experienced instructors, recruited and trained for the purpose of this
study. Since each instructor was teaching one group of treated entrepreneurs and one group of control
entrepreneurs, we organized several ‘train-the-trainer’ sessions and conducted tests and simulations
1 We opted for pure randomization with balance checks, as this was, in our case, a better strategy than stratified randomisation. Choosing the appropriate strata among these variables to implement stratified randomisation and to allocate the participants to the treatment and control groups was not obvious from a theoretical standpoint.

17
with the instructors to make sure that instructors were able to deliver the training material in accordance
with our experimental design. We ensured that the instructors trained the start-ups in each group using
the exact same content by providing all training material ourselves, and by attending the lectures as
observers.
The course comprised eight sessions (for a total of 24 hours of training), and the content and
duration of each session was the same for both groups. Both the treatment and control groups learnt
about tools that are widely used in entrepreneurial education (such as the Business Model Canvas, and
Minimum Viable Product). However, the treatment group was taught how to use each of these tools
using a scientific approach. Throughout the training program, treated start-ups were taught to elaborate
a theory behind their choices, and to articulate hypotheses and test them rigorously. The control group,
meanwhile, did not learn about the scientific approach, but followed the traditional approach to market
validation used by entrepreneurs, which often relies on trial-and-error techniques. We took a number of
measures to ensure the internal validity of our results and the soundness of our experiment. We avoided
contamination by teaching treated and control start-ups in different time slots of the same day (morning
and afternoon) to prevent them from meeting and discussing key elements of the treatment. For the
same reasons, we kept communications about the program separate and discrete for the two groups.
5.2. Data collection procedure
We collected detailed information on all the participants with an extensive pre-intervention survey,
which we used to randomly assign participants to treatment and control groups and to assess the pre-
intervention levels of a number of covariates. During and after the intervention, we collected 18 data
points through telephone interviews, following Bloom and Van Reenen’s (2010) approach. Telephone
interviews usually lasted for 30 minutes and were conceived as open-ended conversations with
entrepreneurs. To guide these conversations, we created an interview protocol for interviewers. In the
first part of the interview, entrepreneurs were asked to report changes in the entrepreneurial team and
describe the activities they had been conducting in the last two weeks. Using an approach similar to
qualitative interviews, we let key themes emerge from entrepreneurial narratives. However, research
assistants were instructed to code the content of the interview for the frequency of occurrence of themes
related to scientific decision-making using non-leading questions. In the second part of the telephone
18
interview, we asked entrepreneurs to self-report their performance, as well as to provide estimates of
the value of their idea. In collecting this information, we were also able to observe entrepreneurs who
abandoned their business idea altogether or who decided to pivot to a different one. The first telephone
interview took place eight weeks after the training program had begun. We then collected data every
two weeks until week 18 (the training program ended in week 12), and every four weeks until week 66.
Our panel dataset includes 4518 observations for 251 firms over 18 periods.
5.3. Measures
5.3.1. Dependent variables
In order to accurately capture the events that unfolded in the first 14 months of activity of the
entrepreneurs that participated in the program, we collected multiple measures of performance and
outcomes of interest, as detailed below.
Exit – We regularly ascertained through telephone interviews if entrepreneurs had abandoned
the program and/or ceased activities related to their start-up. We coded this event into a binary variable
that takes the value 0 until the firm exits (abandons the program and ceases the start-up), 1 in the time
period over which the firm exits, and a missing value thereafter. To avoid attrition biases, we checked
that the entrepreneurs who informed us of their decision to discontinue their initiative had truly
abandoned their activity. We found that 20 start-ups left the course but continued to develop their
business ideas, while 105 abandoned their ideas as well. We kept the 20 start-ups that abandoned the
course in our sample to preserve the balance checks between treatment and control, but we did not count
them as start-ups that exited. When we remove these start-ups from the sample, the treatment and
control groups are still balanced, and in general the results of our analyses are not qualitatively different.
Pivot – Through the telephone interviews we collected detailed information about the activities
conducted by entrepreneurs and the changes they made to their business ideas during the observation
period. In the first session of the course, we taught entrepreneurs to use a Business Model Canvas
(BMC), a visual representation of the core aspects of their business. As entrepreneurs were taught to
use this tool and keep it updated, we were able to keep track of the changes that they made in relation
to nine key business elements (value proposition, customers, channels, customer relationships, key
partners, key activities, key resources, costs and revenue streams). We considered a pivot as a major
19
change in the business model – that is, if the entrepreneur moved from the original idea to another idea
that changed the core value proposition of the business or its target customers. Our start-ups pivoted
from zero to five times in our time frame, and we recorded the week in which the pivot took place.
Revenue – During each telephone interview, we collected the cumulative revenues generated
by each start-up. To obtain the flow of revenue between two periods we subtracted one amount of
revenue from another over two contiguous periods. Understandably, not all firms in our sample reached
the revenue stage in the 66-week observation window. In particular, 33 of the 251 start-ups produced
some revenue in this period; 16 of these firms were in the treatment group and 17 in the control group.
5.3.2. Independent variable
The main independent variable is Intervention, a dummy variable taking a value of 1 for start-ups in the
treatment group and 0 for those in the control group. We also computed another variable, Cumulative
Intervention, which takes values 1-4 for the treatment group in the four periods in which the treatment
is ongoing, and 4 in the following periods. The variable is equal to zero in all periods for the control
group. Finally, Postintervention is equal to 1 for the treatment group after the treatment (from period
five on) and 0 in the first four periods, and in all periods for the control group. We present all our results
using Intervention, but our results remain the same when we use Cumulative Intervention or
Postintervention as the independent variable. We use these alternative specifications as robustness
checks, and we do not report them for brevity’s sake.
We also show results using Scientific Intensity, a measure of the level of adoption of the
scientific approach derived from the content analysis of the telephone interviews. Scientific Intensity is
a time-varying score (ranging from one to five) that captures the level of adoption of the scientific
approach. In order to calculate this score, a team of research assistants analyzed and coded each
interview’s content according to a pre-defined coding scheme. This scheme includes themes and
behavioral indicators of the adoption of the four components of the scientific approach (theory,
hypotheses, tests and evaluation) that quantify the extent to which entrepreneurs are scientific in their
decision-making process, as detailed in the Online Appendix. Through this scheme, we obtain an overall
additive score of the level of adoption. Even if we created coding guidelines and extensively trained the
team of research assistants through examples that create solid reference points, Scientific Intensity
20
remains a subjective measure. To assess the reliability of the coding, we randomly selected a sample of
interviews that underwent double coding with multiple research assistants who were not aware of the
allocation of entrepreneurs to the treatment or control group. Additional analysis (not reported for
brevity’s sake) shows that there is generally agreement between multiple coders.
While a basic premise behind this study is that entrepreneurs can learn to think and act like
scientists in developing their business ideas, we are aware that the extent to which they use scientific
thinking largely depends on endogenous characteristics. Even the random allocation to either a
treatment or a control group might not be enough to resolve all endogeneity concerns related to this
issue. For this reason, we use Intervention as an instrument for Scientific Intensity. The rationale is that
Intervention is completely exogenous in this setting and allows us to quantify the extent to which our
treatment induced an exogenous change in scientific entrepreneurial thinking. In the 2SLS regressions
in which we use Scientific Intensity, we also employ Hours Worked as a control for the fact that the
treatment may affect the intensity of the start-up activities (entrepreneurs’ effort). Hours Worked is a
self-reported measure collected during the telephone interviews; it quantifies the total number of hours
worked by the entrepreneurial team in each observation period. The length of the observation period
differs for some of the interviews, as detailed at the beginning of Section 5.2. However, all our
regressions include time dummies that take into account differences in the lengths of the observation
periods. Table 1 defines all the variables that we use in our analyses and reports descriptive statistics.
***** Table 1 About Here *****
6. Regression Analysis
6.1. Exit
We begin by looking at the regression results of the effect of our intervention on exit in Table 2.
***** Insert Table 2 About Here *****
The first two columns of Table 2 report our cross-section results. They are, respectively, the
results of a linear probability model and a probit model. The dependent variable is a binary one and
equal to 0 if the start-up did not exit, and to 1 if the start-up abandoned the business during our
observation window. The regressions include dummies for the instructors who taught the training
program to account for differences in teaching styles across instructors. We cluster the errors of the
21
regressions by intervention and instructor. The next two columns report the results of a panel analysis
of the 251 start-ups during the 18 periods of data collection. Along with dummies for instructors and
errors clustered by intervention and instructor, the panel includes time-fixed effects. Finally, the last
column of Table 2 shows a survival regression that predicts the time of exit. This regression also
includes instructor dummies, and the errors are clustered by intervention and instructor. Consistently
with Proposition 1, Table 2 shows that the intervention makes exit more likely. In all the regressions of
Table 2, exit increases with intervention, and the estimated coefficients display a low p-value. The
survival regression shows that the intervention raises the odds that start-ups exit at any moment in time.
In terms of effect sizes, our intervention increases the probability of exit by 10% in the cross-
section. This is a sizable effect given that scientist entrepreneurs exit earlier. To appreciate what this
might mean, consider the following cases. At an individual level, these results imply that one
entrepreneur out of ten could avoid wasting time, money and effort developing business ideas that are
not as promising as they initially thought they were. At an institutional level, consider an accelerator
with a capacity of 100 start-ups, monthly intakes of ten start-ups and a one-year program to accelerate
start-ups. The adoption of the scientific approach as an ‘accelerating philosophy’ could improve the
time to acceleration, freeing up a considerable amount of resources (roughly more than 10% without
considering faster turnover). This derives from the fact that ‘confused’ entrepreneurs – of whom we
assume a prevalence – exit more, allowing for a more efficient use of the accelerator resources.
6.2. Pivot
Proposition 2 states that treated start-ups are more likely to pivot a few times but less likely to do so
many times. We again present cross-section and panel regression results regarding pivot.
We start with the cross-section in Table 3. All the regressions in this table use dummies for
instructors, and they cluster errors by intervention and instructor. The first column of Table 3 presents
the OLS results of the change in the total number of pivots produced by the intervention. As the results
in the column show, the intervention does not affect the number of pivots. This is in line with
Proposition 2, which states that treated start-ups are more likely to pivot a few but not many times.
Since in our sample start-ups pivot between zero and five times, the next two columns of Table 3 show
the linear probability models, using as dependent variables a dummy that takes the value 1 if the start-
22
ups experience, respectively, one or one to two pivots, vis-à-vis zero and two to five, or zero and three
to five pivots. In both cases, the effect of the treatment is sizable and statistically significant. Treated
start-ups are more likely to pivot once or twice than zero times, or than two or three times. The last four
columns of Table 3 estimate two multinomial probit models with three categories. The baseline category
in both models, not shown in the table, is zero pivots. The other two categories in the first model are
one and two to five pivots, while in the second model they are one to two and three to five pivots. As
the table shows, the intervention raises the probability of the intermediate category vis-à-vis the other
two extreme categories.
***** Insert Table 3 About Here *****
Table 4 shows the results of a panel analysis of pivots. We employ four dependent variables.
The first one is a dummy that is equal to one when a start-up pivots (any pivot) and equal to zero
otherwise. First Pivot, Second Pivot, and Third Pivot are dummies that are equal to one when the start-
up pivots, respectively, the first, second and third time, and zero otherwise. In these three regressions
we drop the observations after the first, second or third pivot.
***** Insert Table 4 About Here *****
These three regressions explain whether the treatment affects the probability of observing one,
two or three pivots. We use OLS and Poisson specifications instead of probit because there are certain
weeks with no pivots, which probit would drop from our sample, and these include time dummies. We
also ran survival regressions for the first, second and third pivot (which we do not report for brevity’s
sake, but which are available upon request), and these results are in line with those shown in Table 4.
Overall, the results in Table 4 show that, consistently with Proposition 2, the treatment does not affect
the probability of start-ups pivoting. However, the treatment positively affects the probability that
entrepreneurs pivot once, and negatively affects the probability that they pivot a third time, while it has
no effect on the probability that they pivot a second time. This suggests that the scientific approach
makes it more likely that start-ups pivot once, and less likely that they pivot three or more times.
The effects sizes of the regressions are more complex to interpret in the case of pivot. However,
going back to the examples discussed in the case of exit, at the individual level, more selective pivoting
(fewer, better pivots) allows entrepreneurs to explore ideas that would otherwise be lost (foregone
23
options). But it also brings about the opportunity to avoid wasteful pivoting, saving significant amounts
of time, money and effort. At the institutional level, acceleration programs could be more effective and
efficient – redundant pivoting could be reduced by as much as 80% (one pivot instead of five).
6.3. Performance
Our theory predicts that the scientific approach improves start-ups’ performance (Proposition 3). The
adoption of the scientific approach improves the accuracy of entrepreneurs’ predictive models, drives
better assessment of their ideas and reduces the probability of incurring false positives (pursuing an idea
whose value is overestimated) or false negatives (abandoning an idea whose value is underestimated).
For this reason, and even assuming that the adoption of the scientific approach has no effect on the
development stage (which is a very conservative assumption), scientist entrepreneurs should, on
average, develop better ideas and, hence, perform better. Table 5 reports the cross-section and panel
results of the differential in revenues attributable to the treatment. All these regressions include
dummies for instructors, and the errors are clustered by intervention and instructor. The results show
that the adoption of the scientific approach has a sizable effect on revenue, and that this effect is
statistically significant.
***** Insert Table 5 About Here *****
The first column of Table 5 reports the results of a survival regression where the dependent
variable is the failure event, which is the first week in which the start-up generates revenue. The
treatment has no effect, i.e. scientific entrepreneurs do not obtain revenue earlier than non-scientists.
The next two columns (cross-section and panel) show that scientific entrepreneurs generate, on average,
higher income. As already mentioned in Section 3, in our sample only 33 firms produce revenue, 16 in
the treatment group and 17 in the control group. These are reasonable numbers given that nascent
entrepreneurs normally take more than one year to produce revenue. Overall, it seems that, at least
within the time frame of about one year of our RCT, the scientific approach neither induces more start-
ups to make revenue, nor causes them to make revenue earlier. However, the start-ups that make revenue
seem to make more revenue, which suggests that they have been able to tap into better business
opportunities. Together with the greater probability of exit, and selective pivoting, the scientific
24
approach seems to encourage entrepreneurs to make better decisions in the sense that they go after better
opportunities or avoid bad opportunities.
In terms of effect sizes, the average effects obtained through the panel regressions in Table 5
(an average biweekly differential of approximately € 90 between treated and control start-ups) are
small. However, Figure 2 provides an indication of what might be the magnitude of the treatment effect
after approximately one year. Scientist entrepreneurs average three times the amount of cumulative
revenue of non-scientists. Furthermore, the variation of scientist entrepreneurs is much higher than that
of non-scientists, suggesting that the scientific approach, as stated in our third proposition, operates
through better idea selection.
6.4. The intensity of adoption of the scientific approach and other robustness checks
Finally, we report the results of regressions that use our measure of Scientific Intensity instrumented by
Intervention instead of the Intention-To-Treat (ITT) regressions that only use Intervention. The
limitation of this analysis is that we make the ad-hoc exclusion restriction that Intervention only affects
Scientific Intensity in the first stage. This assumes that our treatment does not have any direct effect on
the dependent variables other than through Scientific Intensity. Another limitation is that, while we
measure Scientific Intensity at the firm and time levels, Intervention only varies across firms. Thus, the
regressions we show in this section are only cross-sections or survivals (no longitudinal analysis).
Overall, these regressions confirm the results of the ITT regressions. First and foremost, Table
6 shows that Scientific Intensity is correlated with Intervention. Table 7 shows clearly that Scientific
Intensity makes exit more likely, and Table 8 shows equally clearly that Scientific Intensity makes start-
ups more likely to pivot once or twice rather than never or three or more times, and that Scientific
Intensity makes it more likely that the first pivot occurs earlier, while later pivots occur later. Finally,
Table 9 shows that Scientific Intensity raises revenue. In this case, the statistical significance implies p-
values higher than 10%, which can only be expected with an instrumental-variable regression compared
to an ITT regression. Table 9 also shows that the number of hours worked by the start-up (Hours
Worked) is not correlated with Intervention, and when used as a regressor together with Scientific
Intensity in the revenue regression, it does not cancel the effect of Scientific Intensity. A potential
25
alternative effect of our treatment is that it made entrepreneurs more energetic because the lectures or
topics were more interesting and challenging. Table 9 suggests that this is not the case.
***** Insert Tables 6, 7, 8 and 9 About Here *****
7. Discussion and Conclusion
This study confirms and extends the evidence provided by Camuffo et al. (2019) about the positive
effects of the adoption of a scientific approach in the assessment of entrepreneurial ideas. Research-
wise, we offer a comprehensive theory about why and how adopting a scientific approach improves
entrepreneurial predictions and judgement, highlighting how it works under different conditions. More
specifically, we distinguish between two general types of entrepreneurs – those who cannot make
precise predictions (‘confused’), and those who do not see opportunities (‘unimaginative’). In doing so,
we highlight the flaws in their predictive models and in their assessment of entrepreneurial ideas, and
we show how adopting a scientific approach can correct these flaws and lead to better decisions. We
connect this line of reasoning to the current debate in entrepreneurship, highlighting how the scientific
approach might be thought of as a ‘rational heuristic’ – a set of behavioral routines or a discipline that
can mitigate decision biases (Zhang and Cueto, 2017) and improve the combination of thinking and
doing that characterizes any entrepreneurial venture (Eisenhardt and Bingham, 2017; Ott et al., 2017).
From the standpoint of entrepreneurial practice, the adoption of a scientific approach can be
beneficial for entrepreneurs, who can improve their decisions, mitigating the risk of incurring false
positives and false negatives. We also believe the scientific approach can represent a way to reframe
entrepreneurship education, at least in the early stages of entrepreneurial activity. Our intervention
could represent a starting point to think about how to make some types of entrepreneurial training more
effective. Finally, we believe that the adoption of the scientific approach could be beneficial for
institutions that train, assist, support, mentor and accelerate entrepreneurial ventures. The scientific
approach might represent a nice complement to other practices, such as peer or expert reviews, that
have been proven to be successful and are conceptually consistent with a scientific approach (Cohen et
al., 2018; Chatterji et al., 2019).
This study is also subject to limitations. As in most field experiments in social sciences, its
design does not allow perfect identification. Given the high financial costs of running a similar field
26
experiment, the sample size is limited, which limits the power of the experiment. However, the fact that
we have repeated observation over a reasonably long period of time mitigates this problem and makes
our findings more robust. Other limitations represent opportunities for extensions and directions for
further research. An important point is that our theory is fundamentally a theory of precision or accuracy
in the assessment of entrepreneurial ideas. However, while mitigating fallible judgement and biases is
an important component of entrepreneurial decision-making, understanding decision-making dynamics
and how entrepreneurs search and learn over time is also important. In this respect, an important open
question stems from the fact that we observe that scientist-entrepreneurs are not more likely to make
revenue or to make revenue earlier. Our sense, corroborated by the interviews and the direct observation
of the participants, is that this derives from two factors. First, it reflects the fact that the adoption of the
scientific approach is more demanding. Assessing an idea based on theory and tests requires one to
think deeply, elicit hypotheses, collect data, design and run experiments, engage in critical analysis and
ask for independent third-party opinions. All other things being equal, complying with the disciplined
behavior required by the scientific approach inevitably slows down entrepreneurs, who therefore will
not achieve revenue faster, despite their more accurate predictions. Second, it reflects the fact that
scientist entrepreneurs, at least in our research setting, exit more and pivot more selectively. Indeed,
non-scientists in the control group, who tend to continue with their original idea (and develop it), might
achieve revenue earlier, on average.
We do find, however, that scientific entrepreneurs select more promising ideas, which generate,
on average, higher income. Given that we randomized on the quality of ideas, it seems that the scientific
approach equips treated entrepreneurs with ways of thinking and acting that allow them to select more
promising ideas. At the same time, the fact that scientist entrepreneurs make higher revenue, on average,
could also stem, at least in principle, from another mechanism, i.e. that the scientific approach allows
them to generate, over time, better ideas. Extant literature (Ries, 2011; Furr & Dyer, 2014) explicitly
conceptualizes pivoting as a strategic iteration as being a new idea in the neighborhood of the current
idea. In our case, it might be that, through better thinking and doing, not only can scientist entrepreneurs
better assess their current ideas, but they also have a higher probability of moving to a better idea.
27
Unfortunately, in this study we do not have the data to investigate this potential mechanism (learning
through pivoting across ideas).
Other limitations of our study represent opportunities for further research. For example, we
sample Italian early-stage start-ups across regions and industries. We believe that the scientific approach
might work differently under different contingencies (e.g. specific countries, regions, industries). We
are not able to investigate such differences in this study, but they might be the object of interesting
extensions. We are particularly intrigued by what the effect might be in situations where technologies
(and technological innovations) play a particular role and when entrepreneurs are scientists or have a
science background. Similarly, it would be interesting to observe the effect of the adoption of the
scientific approach in the context of corporate entrepreneurship. Furthermore, our study uses an
intervention embedded in a given learning model. It would be interesting to see under which teaching
approach and learning model (e.g. more or less experiential, in presence or online, one-on-one
mentorship-based versus team or class-based, etc.) the scientific approach exerts better effects. This
would allow us to understand how to scale similar interventions with a view to improving
entrepreneurship education, a priority for many policymakers who are looking to stimulate economic
growth through entrepreneurship. Additionally, our study did not identify the micro-mechanisms that,
at the individual level, drive the different perceptions and predictions of scientist entrepreneurs. There
is a vast body of literature about the corrections of perceptions, changes in predictive models and
mitigation of biases. However, we did not have the data to actually show what the mechanism is that,
given an idea, leads scientist entrepreneurs to have different perceptions regarding the variability of its
outcomes, compared to non-scientists.
Finally, it would be intriguing to evaluate the effects of the scientific approach vis-à-vis other
approaches, corresponding to other entrepreneurship theories, such as effectuation. An interesting study
could test if, to what extent, and under which conditions, non-predictive techniques – with entrepreneurs
‘making do’ with what they have to hand, improvising to win over stakeholders and co-creating new
products and markets – are more effective than the scientific approach.
28
REFERENCES
Aldrich, H. E., & Martinez, M. A. (2015). Why aren’t entrepreneurs more creative? Conditions affecting creativity and innovation in entrepreneurial activity. The Oxford handbook of creativity, innovation, and entrepreneurship, 445-456.
Alvarez, S. A., & Barney, J. B. (2007). Discovery and creation: Alternative theories of entrepreneurial action. Strategic entrepreneurship journal, 1(1‐2), 11-26.
Alvarez, S. A., & Barney, J. B. (2013). Epistemology, opportunities, and entrepreneurship: Comments on Venkataraman et al.(2012) and Shane (2012). Academy of Management Review, 38(1), 154-157.
Alvarez, S. A., & Barney, J. B. (2019). Has the Concept of Opportunities Been Fruitful in the Field of Entrepreneurship? Academy of management perspectives, forthcoming.
Anderson, S. J., Chandy, R., & Zia, B. (2018). Pathways to profits: The impact of marketing vs. Finance Skills on Business Performance. Management Science, 64(12), 5559-5583.
Artinger, S., & Powell, T. C. (2016). Entrepreneurial failure: Statistical and psychological explanations. Strategic Management Journal, 37(6), 1047-1064.
Åstebro, T. (2002). The Return to independent invention: evidence of unrealistic optimism, risk seeking or skewness loving?. The Economic Journal, 113(484), 226-239.
Astebro, T., Herz, H., Nanda, R., & Weber, R. A. (2014). Seeking the roots of entrepreneurship: Insights from behavioral economics. Journal of Economic Perspectives, 28(3), 49-70.
Baird, S., McIntosh, C., & Özler, B. (2016). When the money runs out: do cash transfers have sustained effects on human capital accumulation?. The World Bank.
Baker, T., & Nelson, R. E. (2005). Creating something from nothing: Resource construction through entrepreneurial bricolage. Administrative science quarterly, 50(3), 329-366.
Baron, R. A., & Ensley, M. D. (2006). Opportunity recognition as the detection of meaningful patterns: Evidence from comparisons of novice and experienced entrepreneurs. Management science, 52(9), 1331-1344.
Bennett, V., & Chatterji, A. (2017). The Entrepreneurial Process: Evidence from a Nationally Representative Survey. Working Paper, Fuqua School, Duke University.
Bettis, R. A., Ethiraj, S., Gambardella, A., Helfat, C., & Mitchell, W. (2016). Creating repeatable cumulative knowledge in strategic management: A call for a broad and deep conversation among authors, referees, and editors. Strategic Management Journal, 37(2), 257-261.
Bloom, N., & Van Reenen, J. (2010). New approaches to surveying organizations. American economic review, 100(2), 105-09.
Bosma, N., Schutjens, V., & Stam, E. (2012). A multilevel analysis of growth-oriented entrepreneurship (summary). Frontiers of Entrepreneurship Research, 32(15), 4.
Busenitz, L. W., & Barney, J. B. (1997). Differences between entrepreneurs and managers in organizations: Biases and heuristics in decision-making. Journal of business venturing, 12(1), 9-30.
Cain, D. M., Moore, D. A., & Haran, U. (2015). Making sense of overconfidence in market entry. Strategic Management Journal, 36(1), 1-18.
Camerer, C., & Lovallo, D. (1999). Overconfidence and excess entry: An experimental approach. American economic review, 89(1), 306-318.
29
Camuffo, A., Cordova, A., Gambardella, A., & Spina, C. (2019). A Scientific Approach to Entrepreneurial Decision Making: Evidence Form a Randomized Control Trial. Management Science, Forthcoming.
Chatterji, A., Delecourt, S., Hasan, S., & Koning, R. (2019). When does advice impact startup performance?. Strategic Management Journal, 40(3), 331-356.
Christianson, M. K. (2019). More and less effective updating: The role of trajectory management in making sense again. Administrative Science Quarterly, 64(1), 45-86.
Cohen, S. L., Bingham, C. B., & Hallen, B. L. (2018). The role of accelerator designs in mitigating bounded rationality in new ventures. Administrative Science Quarterly, 0001839218782131.
Contigiani, A., & Levinthal, D. A. (2019). Situating the construct of lean start-up: adjacent conversations and possible future directions. Industrial and Corporate Change, 28(3), 551-564.
Csaszar, F.A. (2018) What Makes a Decision Strategic? Strategic Representations. Strategy Science 3(4):606-619.
Davenport, T. H. (2009). How to design smart business experiments. Strategic Direction, 25(8).
Delmar, F., & Shane, S. (2003). Does business planning facilitate the development of new ventures?. Strategic management journal, 24(12), 1165-1185.
Dencker, J. C., Gruber, M., & Shah, S. K. (2009). Pre-entry knowledge, learning, and the survival of new firms. Organization Science, 20(3), 516-537.
Dimov, D. (2007). Beyond the single-person, single-insight attribution in understanding entrepreneurial opportunities. Entrepreneurship Theory and Practice, 31(5), 713-731.
Dorst, K. (2015), Frame Innovation: Create New Thinking By Design. Cambridge, The Mit Press.
Durand, R., & Paolella, L. (2013). Category stretching: Reorienting research on categories in strategy, entrepreneurship, and organization theory. Journal of Management Studies, 50(6), 1100-1123.
Durand, R., Granqvist, N., & Tyllström, A. (2017). From Categories to Categorization: Studies in Sociology, Organizations and Strategy at the Crossroads. Research in Sociology of Organizations, 51, Emerald Group Publishing.
Eisenhardt, K. M., & Bingham, C. B. (2017). Superior strategy in entrepreneurial settings: Thinking, doing, and the logic of opportunity. Strategy Science, 2(4), 246-257.
Eisenhardt, K. M., & Brown, S. L. (1998). Competing on the edge: Strategy as structured chaos. Long Range Planning, 31(5), 786-789.
Fairlie, R. W., & Miranda, J. (2017). Taking the leap: The determinants of entrepreneurs hiring their first employee. Journal of Economics & Management Strategy, 26(1), 3-34.
Felin, T., & Zenger, T. R. (2009). Entrepreneurs as theorists: on the origins of collective beliefs and novel strategies. Strategic Entrepreneurship Journal, 3(2), 127-146.
Felin, T., & Zenger, T. R. (2017). The Theory-Based View: Economic Actors as Theorists. Strategy Science, 2(4), 258-271.
Fleming, L. (2001). Recombinant uncertainty in technological search. Management science, 47(1), 117-132.
Foss, N. J., & Klein, P. G. (2012). Organizing entrepreneurial judgment: A new approach to the firm. Cambridge University Press.
Foss, N. J., & Klein, P. G. (2017). Entrepreneurial discovery or creation? In search of the middle ground. Academy of Management Review, 42(4), 733-736.
30
Foss, N. J., Klein, P. G., & Bjørnskov, C. (2018). The context of entrepreneurial judgment: organizations, markets, and institutions. Journal of Management Studies.
Furr, N. R. (2009). Cognitive flexibility: The adaptive reality of concrete organization change. Stanford University.
Furr, N. R., & Dyer, J. (2014). The Innovator's Method: Bringing the Lean Start-Up Into Your Organization. Harvard Business Press.
Gans, J. S., Stern, S., & Wu, J. (2019). Foundations of entrepreneurial strategy. Strategic Management Journal, 40(5), 736-756.
Garbuio, M., Dong, A., Lin, N., Tschang, T., & Lovallo, D. (2018). Demystifying the genius of entrepreneurship: How design cognition can help create the next generation of entrepreneurs. Academy of Management Learning & Education, 17(1), 41-61.
Gavetti, G., Levinthal, D. A., & Rivkin, J. W. (2005). Strategy making in novel and complex worlds: The power of analogy. Strategic Management Journal, 26(8), 691-712.
Goldfarb, B., & King, A. A. (2016). Scientific apophenia in strategic management research: Significance tests & mistaken inference. Strategic Management Journal, 37(1), 167-176.
Greve, H. R. (2018). Show Me the Data! Improving Evidence Presentation for Publication. Management and Organization Review, 14(2), 423-432.
Gruber, M., De Leon, N., George, G., & Thompson, P. (2015). Managing by design. Academy of Management Journal, 58(1), 1-7.
Halsey, L. G., Curran-Everett, D., Vowler, S. L., & Drummond, G. B. (2015). The fickle P value generates irreproducible results. Nature methods, 12(3), 179.
Hampel, C. E., Tracey, P., & Weber, K. (2019). The Art of the Pivot: How New Ventures Manage Identification Relationships with Stakeholders as They Change Direction. Academy of Management Journal, (ja).
Hill, R. C., & Levenhagen, M. (1995). Metaphors and mental models: Sensemaking and sensegiving in innovative and entrepreneurial activities. Journal of Management, 21(6), 1057-1074.
Hill, S. A., & Birkinshaw, J. M. (2010). Idea sets: Conceptualizing and measuring a new unit of analysis in entrepreneurship research. Organizational research methods, 13(1), 85-113.
Hogarth, R. M., & Karelaia, N. (2012). Entrepreneurial success and failure: Confidence and fallible judgment. Organization Science, 23(6), 1733-1747.
Kahneman, D., Lovallo, D., & Sibony, O. (2019). A Structured Approach to Strategic Decisions. MIT Sloan Management Review, 60(3), 67-73.
Kerr, W. R., Nanda, R., & Rhodes-Kropf, M. (2014). Entrepreneurship as experimentation. Journal of Economic Perspectives, 28(3), 25-48.
Levine, Sheen S. "Show us your data: Connect the dots, improve science." Management and Organization Review 14, no. 2 (2018): 433-437.
Moore, D. A., & Cain, D. M. (2007). Overconfidence and underconfidence: When and why people underestimate (and overestimate) the competition. Organizational Behavior and Human Decision Processes, 103(2), 197-213.
Moore, D. A., & Healy, P. J. (2008). ‘The trouble with overconfidence’. Psychological Review, 115, 502-517.
31
Murray, F., & Tripsas, M. (2004). The exploratory processes of entrepreneurial firms: The role of purposeful experimentation. In Business strategy over the industry lifecycle (pp. 45-75). Emerald Group Publishing Limited.
Nickerson, J. A., & Zenger, T. R. (2004). A knowledge-based theory of the firm—The problem-solving perspective. Organization science, 15(6), 617-632.
Nickerson, J. A., Silverman, B. S., & Zenger, T. R. (2007). The problem of creating and capturing value. Strategic Organization, 5(3), 211-225.
Nickerson, J., & Argyres, N. (2018). Strategizing before strategic decision making. Strategy Science, 3(4), 592-605.
Ott, T. E., Eisenhardt, K. M., & Bingham, C. B. (2017). Strategy formation in entrepreneurial settings: Past insights and future directions. Strategic Entrepreneurship Journal, 11(3), 306-325.
Parker, S. C. (2006). Learning about the unknown: How fast do entrepreneurs adjust their beliefs?. Journal of business venturing, 21(1), 1-26.
Pfeffer, J., & Sutton, R. I. (2006). Profiting from evidence-based management. Strategy & Leadership, 34(2), 35-42.
Ries, E. (2011). The lean startup: How today's entrepreneurs use continuous innovation to create radically successful businesses. Crown Books.
Rothschild, M., & Stiglitz, J. E. (1970). Increasing risk: I. A definition. Journal of Economic theory, 2(3), 225-243.
Sarasvathy, S. D. (2001). Causation and effectuation: Toward a theoretical shift from economic inevitability to entrepreneurial contingency. Academy of management Review, 26(2), 243-263.
Sarasvathy, S. D. (2009). Effectuation: Elements of entrepreneurial expertise. Edward Elgar Publishing.
Sarasvathy, S. D. et al. (2003). Three Views of Entrepreneurial Opportunity, in Z.J. Acs and D.B. Audretsch (eds.), Handbook of Entrepreneurship Research, Kluwer, pp.141–160
Shepherd, Dean A., J. Michael Haynie, and Jeffery S. McMullen. "Confirmatory search as a useful heuristic? Testing the veracity of entrepreneurial conjectures." Journal of Business Venturing 27, no. 6 (2012): 637-651.
Starr, E., & Goldfarb, B. D. (2018). A Binned Scatterplot is Worth a Hundred Regressions: Diffusing a Simple Tool to Make Empirical Research Easier and Better. Available at SSRN 3257345.
Vogel, P. (2017). From Venture Idea to Venture Opportunity. Entrepreneurship Theory and Practice, 41(6), 943–971.
Von Hippel, E., & Von Krogh, G. (2015). Crossroads—Identifying viable “need–solution pairs”: Problem solving without problem formulation. Organization Science, 27(1), 207-221.
Wiltbank, Robert, Nicholas Dew, Stuart Read, and Saras D. Sarasvathy. "What to do next? The case for non‐predictive strategy." Strategic management journal 27, no. 10 (2006): 981-998.
Wry, T., & Lounsbury, M. (2013). Contextualizing the categorical imperative: Category linkages, technology focus, and resource acquisition in nanotechnology entrepreneurship. Journal of Business Venturing, 28(1), 117-133.
Zenger, T. (2016). Beyond competitive advantage: How to solve the puzzle of sustaining growth while creating value. Harvard Business Review Press.
Zhang, S. X., & Cueto, J. (2017). The study of bias in entrepreneurship. Entrepreneurship theory and Practice, 41(3), 419-454.
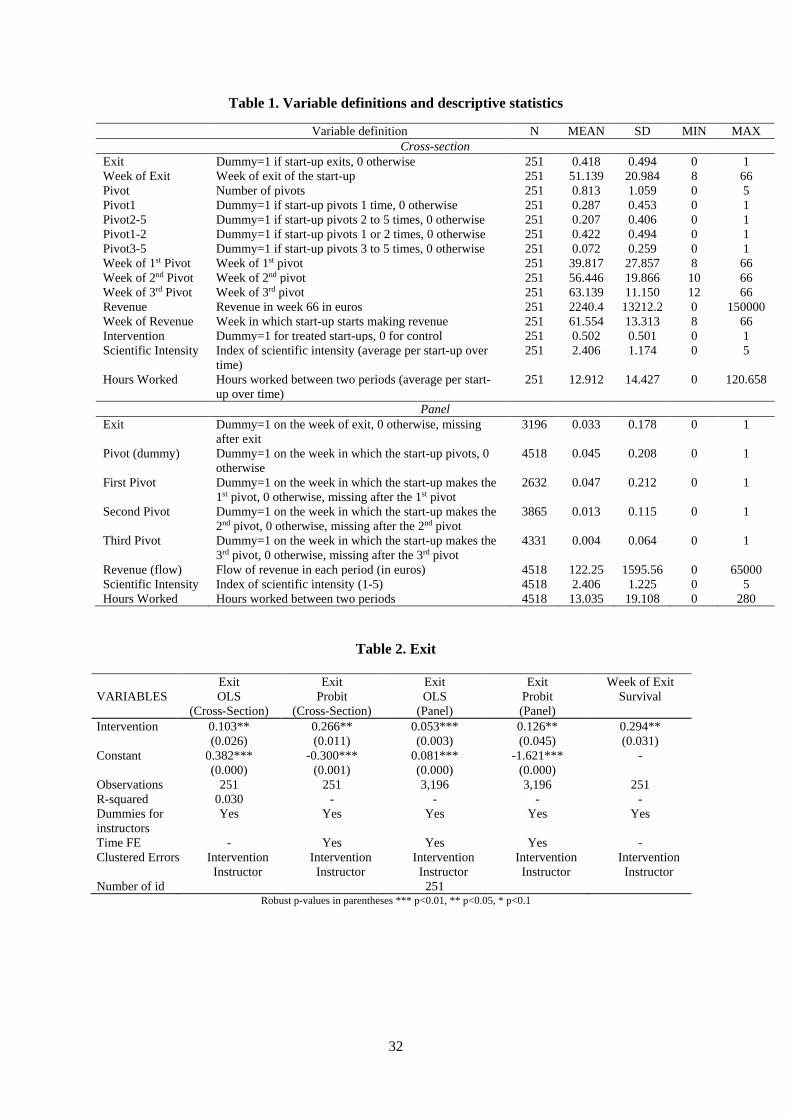
32
Table 1. Variable definitions and descriptive statistics
Variable definition N MEAN SD MIN MAX Cross-section
Exit Dummy=1 if start-up exits, 0 otherwise 251 0.418 0.494 0 1 Week of Exit Week of exit of the start-up 251 51.139 20.984 8 66 Pivot Number of pivots 251 0.813 1.059 0 5 Pivot1 Dummy=1 if start-up pivots 1 time, 0 otherwise 251 0.287 0.453 0 1 Pivot2-5 Dummy=1 if start-up pivots 2 to 5 times, 0 otherwise 251 0.207 0.406 0 1 Pivot1-2 Dummy=1 if start-up pivots 1 or 2 times, 0 otherwise 251 0.422 0.494 0 1 Pivot3-5 Dummy=1 if start-up pivots 3 to 5 times, 0 otherwise 251 0.072 0.259 0 1 Week of 1st Pivot Week of 1st pivot 251 39.817 27.857 8 66 Week of 2nd Pivot Week of 2nd pivot 251 56.446 19.866 10 66 Week of 3rd Pivot Week of 3rd pivot 251 63.139 11.150 12 66 Revenue Revenue in week 66 in euros 251 2240.4 13212.2 0 150000 Week of Revenue Week in which start-up starts making revenue 251 61.554 13.313 8 66 Intervention Dummy=1 for treated start-ups, 0 for control 251 0.502 0.501 0 1 Scientific Intensity Index of scientific intensity (average per start-up over
time) 251 2.406 1.174 0 5
Hours Worked Hours worked between two periods (average per start-up over time)
251 12.912 14.427 0 120.658
Panel Exit Dummy=1 on the week of exit, 0 otherwise, missing
after exit 3196 0.033 0.178 0 1
Pivot (dummy) Dummy=1 on the week in which the start-up pivots, 0 otherwise
4518 0.045 0.208 0 1
First Pivot Dummy=1 on the week in which the start-up makes the 1st pivot, 0 otherwise, missing after the 1st pivot
2632 0.047 0.212 0 1
Second Pivot Dummy=1 on the week in which the start-up makes the 2nd pivot, 0 otherwise, missing after the 2nd pivot
3865 0.013 0.115 0 1
Third Pivot Dummy=1 on the week in which the start-up makes the 3rd pivot, 0 otherwise, missing after the 3rd pivot
4331 0.004 0.064 0 1
Revenue (flow) Flow of revenue in each period (in euros) 4518 122.25 1595.56 0 65000 Scientific Intensity Index of scientific intensity (1-5) 4518 2.406 1.225 0 5 Hours Worked Hours worked between two periods 4518 13.035 19.108 0 280
Table 2. Exit
Exit Exit Exit Exit Week of Exit VARIABLES OLS
(Cross-Section) Probit
(Cross-Section) OLS
(Panel) Probit (Panel)
Survival
Intervention 0.103** 0.266** 0.053*** 0.126** 0.294** (0.026) (0.011) (0.003) (0.045) (0.031) Constant 0.382*** -0.300*** 0.081*** -1.621*** - (0.000) (0.001) (0.000) (0.000) Observations 251 251 3,196 3,196 251 R-squared 0.030 - - - - Dummies for instructors
Yes Yes Yes Yes Yes
Time FE - Yes Yes Yes - Clustered Errors Intervention
Instructor Intervention Instructor
Intervention Instructor
Intervention Instructor
Intervention Instructor
Number of id 251 Robust p-values in parentheses *** p<0.01, ** p<0.05, * p<0.1

33
Table 3. Pivot (cross-section)
Pivot = 0; 1; 2-5 Pivot = 0; 1-2; 3-5
Pivot Pivot1 Pivot1-2 Pivot1 Pivot2-5 Pivot1-2 Pivot3-5
VARIABLES OLS OLS OLS Multinomial Probit
Multinomial Probit
Multinomial Probit
Multinomial Probit
Intervention 0.020 0.105*** 0.104*** 0.422*** -0.009 0.355*** -0.165 (0.748) (0.001) (0.001) (0.000) (0.955) (0.000) (0.264) Constant 1.017*** 0.273*** 0.436*** -0.392*** -0.312** -0.020 -0.879*** (0.000) (0.000) (0.000) (0.000) (0.029) (0.804) (0.000) Observations 251 251 251 251 251 251 251 R-squared 0.061 0.045 0.067 - - - - Dummies for instructors Yes Yes Yes Yes Yes Yes Yes Clustered Errors Intervention
Instructor Intervention Instructor
Intervention Instructor
Intervention Instructor
Intervention Instructor
Intervention Instructor
Intervention Instructor
In multinomial probit models the omitted regression is pivot = 0. Robust pval in parentheses *** p<0.01, ** p<0.05, * p<0.1
Table 4. Pivot (panel: OLS, Poisson)
VARIABLES Pivot (dummy) First Pivot Second Pivot Third Pivot Intervention (OLS) 0.001 0.008** -0.002 -0.002*** (0.740) (0.012) (0.403) (0.009) Intervention (Poisson) 0.024 0.170** -0.149 -0.465** (0.738) (0.013) (0.404) (0.026) Observations 4,518 2,632 3,865 4,331 Number of id 251 251 251 251 Dummies for instructors Yes Yes Yes Yes Time FE Yes Yes Yes Yes Clustered Errors Intervention
Instructor Intervention
Instructor Intervention
Instructor Intervention Instructor
Robust pval in parentheses *** p<0.01, ** p<0.05, * p<0.1
Table 5. Performance
VARIABLES Week of Revenue (Survival) Revenue (OLS, Cross-section) Revenue Flow (OLS, Panel) Intervention -0.093 1,679.216* 89.052* (0.757) (0.090) (0.072) Constant - -348.051 95.849 (0.514) (0.493) Observations 251 251 4,518 R-squared 0.026 Dummies for instructors Yes Yes Yes Time FE - - Yes Clustered Errors Intervention Instructor Intervention Instructor Intervention Instructor Number of id 251
Robust pval in parentheses *** p<0.01, ** p<0.05, * p<0.1
Table 6. First Stage Regression, Scientific Intensity with respect to Intervention
VARIABLES Scientific Intensity Intervention 0.308** (0.011) Constant 2.431*** (0.000) Observations 251 R-squared 0.085 Dummies for instructors Yes Clustered Errors Intervention Instructor
Robust pval in parentheses *** p<0.01, ** p<0.05, * p<0.1
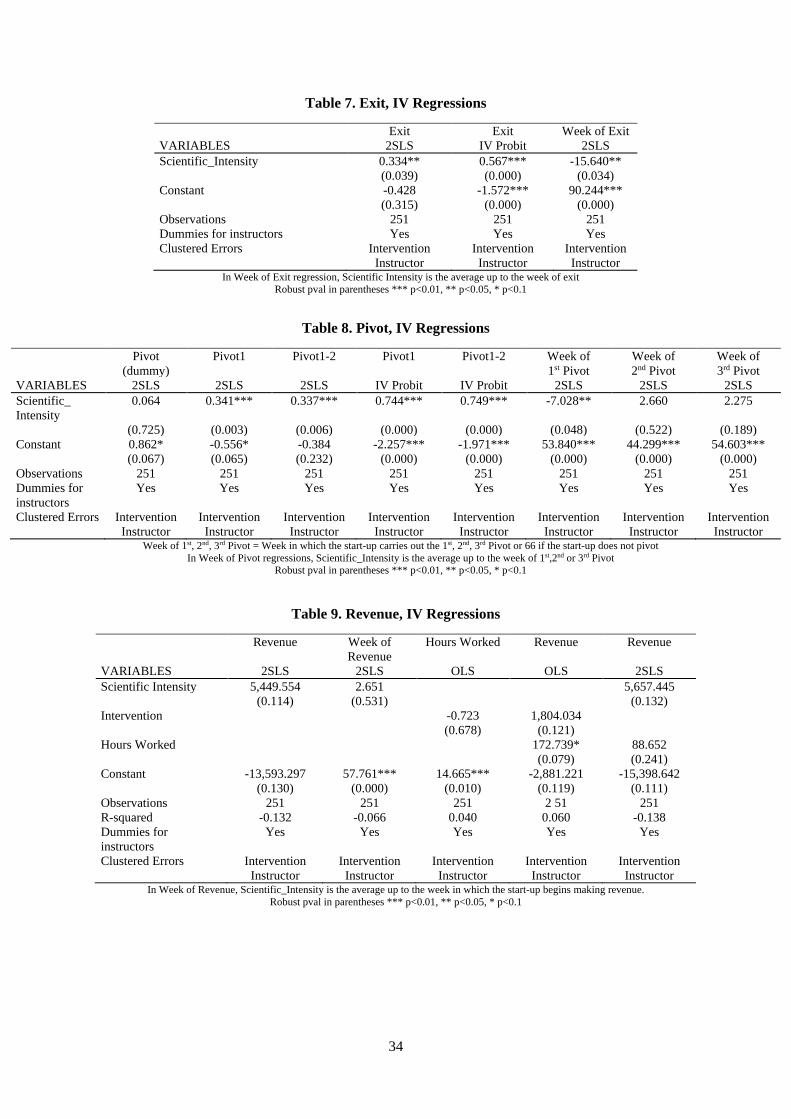
34
Table 7. Exit, IV Regressions
Exit Exit Week of Exit VARIABLES 2SLS IV Probit 2SLS Scientific_Intensity 0.334** 0.567*** -15.640** (0.039) (0.000) (0.034) Constant -0.428 -1.572*** 90.244*** (0.315) (0.000) (0.000) Observations 251 251 251 Dummies for instructors Yes Yes Yes Clustered Errors Intervention
Instructor Intervention Instructor
Intervention Instructor
In Week of Exit regression, Scientific Intensity is the average up to the week of exit Robust pval in parentheses *** p<0.01, ** p<0.05, * p<0.1
Table 8. Pivot, IV Regressions
Pivot (dummy)
Pivot1 Pivot1-2 Pivot1 Pivot1-2 Week of 1st Pivot
Week of 2nd Pivot
Week of 3rd Pivot
VARIABLES 2SLS 2SLS 2SLS IV Probit IV Probit 2SLS 2SLS 2SLS Scientific_ Intensity
0.064 0.341*** 0.337*** 0.744*** 0.749*** -7.028** 2.660 2.275
(0.725) (0.003) (0.006) (0.000) (0.000) (0.048) (0.522) (0.189) Constant 0.862* -0.556* -0.384 -2.257*** -1.971*** 53.840*** 44.299*** 54.603*** (0.067) (0.065) (0.232) (0.000) (0.000) (0.000) (0.000) (0.000) Observations 251 251 251 251 251 251 251 251 Dummies for instructors
Yes Yes Yes Yes Yes Yes Yes Yes
Clustered Errors Intervention Instructor
Intervention Instructor
Intervention Instructor
Intervention Instructor
Intervention Instructor
Intervention Instructor
Intervention Instructor
Intervention Instructor
Week of 1st, 2nd, 3rd Pivot = Week in which the start-up carries out the 1st, 2nd, 3rd Pivot or 66 if the start-up does not pivot In Week of Pivot regressions, Scientific_Intensity is the average up to the week of 1st,2nd or 3rd Pivot
Robust pval in parentheses *** p<0.01, ** p<0.05, * p<0.1
Table 9. Revenue, IV Regressions
Revenue Week of Revenue
Hours Worked Revenue Revenue
VARIABLES 2SLS 2SLS OLS OLS 2SLS Scientific Intensity 5,449.554 2.651 5,657.445 (0.114) (0.531) (0.132) Intervention -0.723 1,804.034 (0.678) (0.121) Hours Worked 172.739* 88.652 (0.079) (0.241) Constant -13,593.297 57.761*** 14.665*** -2,881.221 -15,398.642 (0.130) (0.000) (0.010) (0.119) (0.111) Observations 251 251 251 2 51 251 R-squared -0.132 -0.066 0.040 0.060 -0.138 Dummies for instructors
Yes Yes Yes Yes Yes
Clustered Errors Intervention Instructor
Intervention Instructor
Intervention Instructor
Intervention Instructor
Intervention Instructor
In Week of Revenue, Scientific_Intensity is the average up to the week in which the start-up begins making revenue. Robust pval in parentheses *** p<0.01, ** p<0.05, * p<0.1
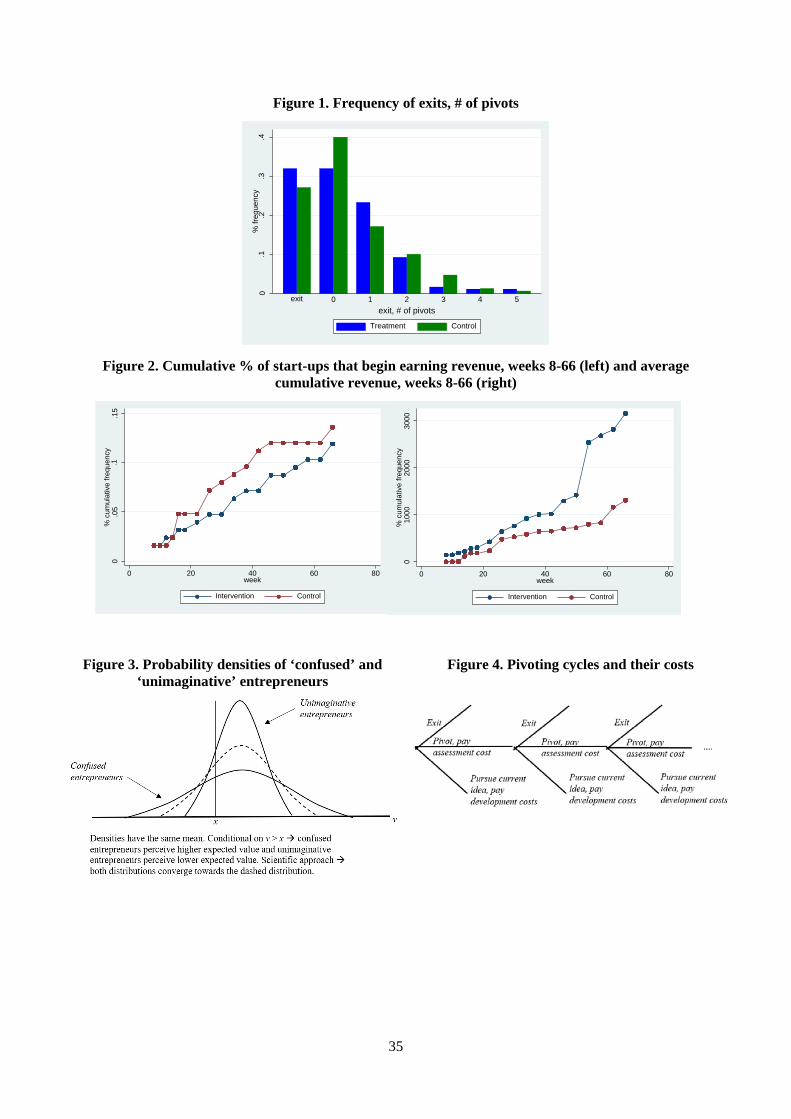
35
Figure 1. Frequency of exits, # of pivots
Figure 2. Cumulative % of start-ups that begin earning revenue, weeks 8-66 (left) and average cumulative revenue, weeks 8-66 (right)
Figure 3. Probability densities of ‘confused’ and ‘unimaginative’ entrepreneurs
Figure 4. Pivoting cycles and their costs
0.1
.2.3
.4%
freq
uenc
y
exit 0 1 2 3 4 5exit, # of pivots
Treatment Control
0.0
5.1
.15
% c
umul
ativ
e fre
quen
cy
0 20 40 60 80week
Intervention Control
010
0020
0030
00%
cum
ulat
ive
frequ
ency
0 20 40 60 80week
Intervention Control
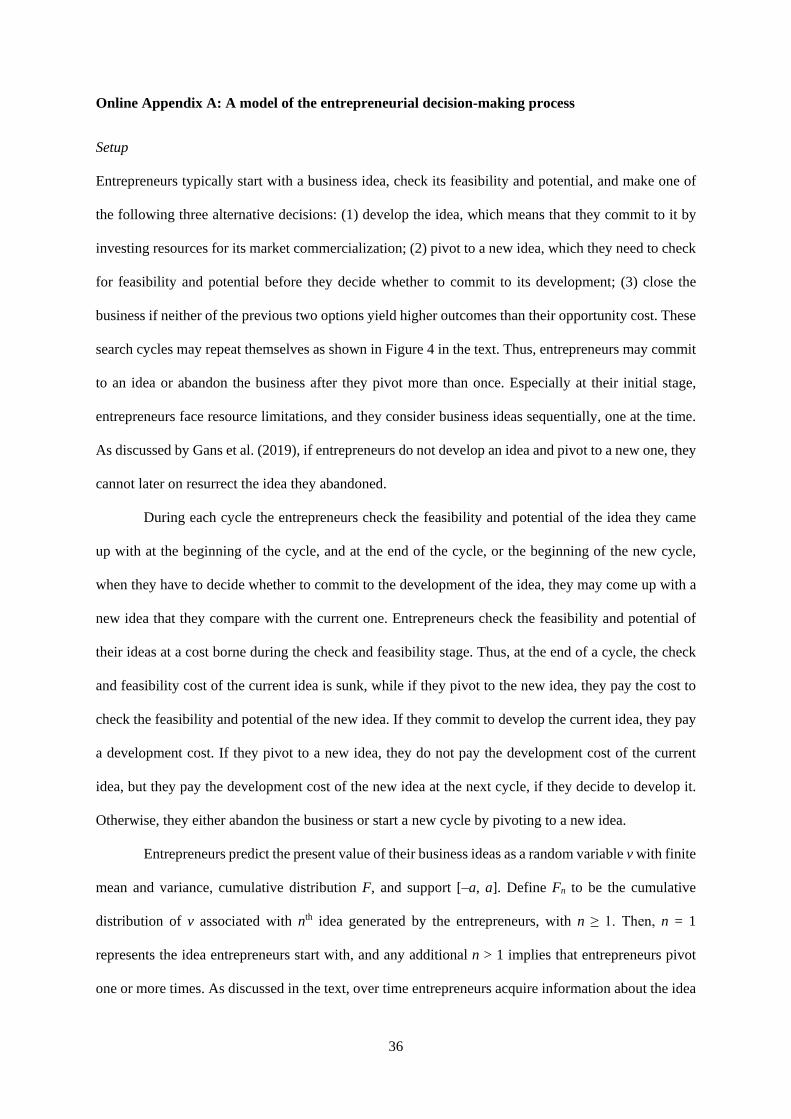
36
Online Appendix A: A model of the entrepreneurial decision-making process
Setup
Entrepreneurs typically start with a business idea, check its feasibility and potential, and make one of
the following three alternative decisions: (1) develop the idea, which means that they commit to it by
investing resources for its market commercialization; (2) pivot to a new idea, which they need to check
for feasibility and potential before they decide whether to commit to its development; (3) close the
business if neither of the previous two options yield higher outcomes than their opportunity cost. These
search cycles may repeat themselves as shown in Figure 4 in the text. Thus, entrepreneurs may commit
to an idea or abandon the business after they pivot more than once. Especially at their initial stage,
entrepreneurs face resource limitations, and they consider business ideas sequentially, one at the time.
As discussed by Gans et al. (2019), if entrepreneurs do not develop an idea and pivot to a new one, they
cannot later on resurrect the idea they abandoned.
During each cycle the entrepreneurs check the feasibility and potential of the idea they came
up with at the beginning of the cycle, and at the end of the cycle, or the beginning of the new cycle,
when they have to decide whether to commit to the development of the idea, they may come up with a
new idea that they compare with the current one. Entrepreneurs check the feasibility and potential of
their ideas at a cost borne during the check and feasibility stage. Thus, at the end of a cycle, the check
and feasibility cost of the current idea is sunk, while if they pivot to the new idea, they pay the cost to
check the feasibility and potential of the new idea. If they commit to develop the current idea, they pay
a development cost. If they pivot to a new idea, they do not pay the development cost of the current
idea, but they pay the development cost of the new idea at the next cycle, if they decide to develop it.
Otherwise, they either abandon the business or start a new cycle by pivoting to a new idea.
Entrepreneurs predict the present value of their business ideas as a random variable v with finite
mean and variance, cumulative distribution F, and support [–a, a]. Define Fn to be the cumulative
distribution of v associated with nth idea generated by the entrepreneurs, with n ≥ 1. Then, n = 1
represents the idea entrepreneurs start with, and any additional n > 1 implies that entrepreneurs pivot
one or more times. As discussed in the text, over time entrepreneurs acquire information about the idea
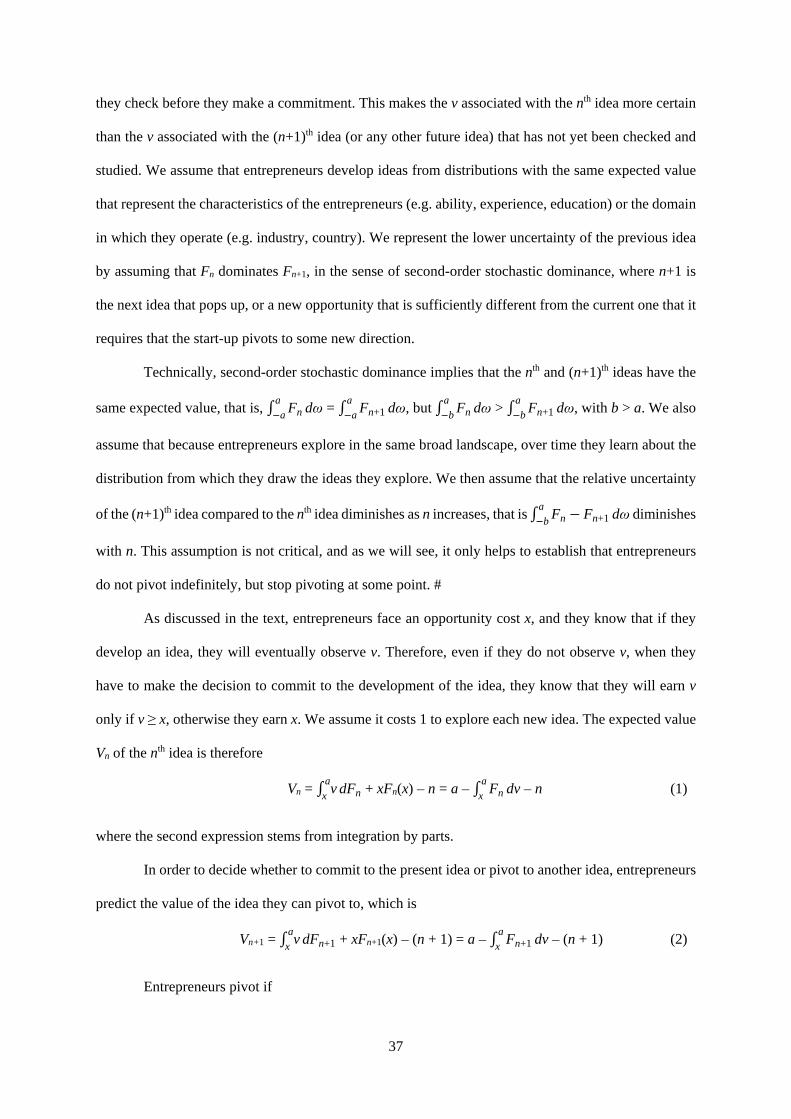
37
they check before they make a commitment. This makes the v associated with the nth idea more certain
than the v associated with the (n+1)th idea (or any other future idea) that has not yet been checked and
studied. We assume that entrepreneurs develop ideas from distributions with the same expected value
that represent the characteristics of the entrepreneurs (e.g. ability, experience, education) or the domain
in which they operate (e.g. industry, country). We represent the lower uncertainty of the previous idea
by assuming that Fn dominates Fn+1, in the sense of second-order stochastic dominance, where n+1 is
the next idea that pops up, or a new opportunity that is sufficiently different from the current one that it
requires that the start-up pivots to some new direction.
Technically, second-order stochastic dominance implies that the nth and (n+1)th ideas have the
same expected value, that is, ∫ Fna−a dω = ∫ Fn+1
a−a dω, but ∫ Fn
a−b dω > ∫ Fn+1
a−b dω, with b > a. We also
assume that because entrepreneurs explore in the same broad landscape, over time they learn about the
distribution from which they draw the ideas they explore. We then assume that the relative uncertainty
of the (n+1)th idea compared to the nth idea diminishes as n increases, that is ∫ Fn − Fn+1a−b dω diminishes
with n. This assumption is not critical, and as we will see, it only helps to establish that entrepreneurs
do not pivot indefinitely, but stop pivoting at some point. #
As discussed in the text, entrepreneurs face an opportunity cost x, and they know that if they
develop an idea, they will eventually observe v. Therefore, even if they do not observe v, when they
have to make the decision to commit to the development of the idea, they know that they will earn v
only if v ≥ x, otherwise they earn x. We assume it costs 1 to explore each new idea. The expected value
Vn of the nth idea is therefore
Vn = ∫ vax dFn + xFn(x) – n = a – ∫ Fn
ax dv – n (1)
where the second expression stems from integration by parts.
In order to decide whether to commit to the present idea or pivot to another idea, entrepreneurs
predict the value of the idea they can pivot to, which is
Vn+1 = ∫ vax dFn+1 + xFn+1(x) – (n + 1) = a – ∫ Fn+1
ax dv – (n + 1) (2)
Entrepreneurs pivot if
38
Vn+1 – Vn = ∫ Fn − Fn+1a
x dv – 1 ≥ 0 (3)
Assuming that –a < x < a, the expression ∫ Fn − Fn+1a
x dv is non-negative and declines with n.
Therefore, (3) eventually becomes negative, and entrepreneurs stop pivoting when n becomes such that
Vn+1 – Vn ≤ 0. To characterize the decision to exit, we assume that the full returns of entrepreneurs are
Vn + ξn, where ξn is a shock revealed after the entrepreneurs decide whether to pivot. Therefore, the
shock does not affect Vn+1 – Vn. However, it affects the decision to exit. When the entrepreneurs commit
to the nth idea, they exit if ξn < –Vn, otherwise they develop the idea. Since n maximizes Vn, the
entrepreneurs could not make a better decision about exit or commitment by picking a different n.
Scientific entrepreneurs
Thanks to theory and tests, the scientific approach affects the prediction of entrepreneurs. We assume
that it affects the degree of second-order stochastic dominance of F. As discussed in the text, we have
two cases. On the one hand, theory and tests help scientific entrepreneurs to explain more precisely
some stochastic factors that they think affect v. This raises the degree of second-order stochastic
dominance of F because the stochastic process depends on a subset of the stochastic factors that affect
the dominated distribution. On the other hand, theory and tests help scientific entrepreneurs to see new
stochastic factors. The scientific approach then produces a dominated distribution, in the second-order
stochastic sense, because it reveals more randomness than in the case of the counter-factual non-
scientific entrepreneur.
As discussed in the text, we assume that the scientific approach has no effect on the mean of
the distribution. This may be an extreme assumption in that the scientific approach may eliminate biases
that could generate higher or lower expected values, or it may show where to find better distributions
of returns. However, the most important effect of the scientific approach is prediction, and we focus on
this. To put it slightly more weakly, our analysis assumes that the effect of this approach is largely on
the variability of F, and the effect on the mean is negligible. This is most reasonable if we assume, as
we do, that F reflects the characteristics of our entrepreneurs or the landscape in which they search. In
this respect, we study a context in which the opportunities of the entrepreneurs are defined, and the
question is mostly how entrepreneurs predict the realizations of these opportunities.
39
Our two cases imply that ∫ Fna
x dv could be smaller or larger, according to whether the scientist
entrepreneurs believe the phenomenon exhibits higher or lower variability. If the perceived variability
is higher, it is easy to see from (1) that, other things being equal, Vn is larger, and vice versa if the
perceived variability is lower. As noted, the distributions Fn yield the same mean. However, because
we focus on the mean of the distribution when v ≥ x, we only count the realizations of v in the higher
end of its support, which implies a higher mean of the distribution with fatter tails, conditional on v ≥
x.
Suppose that Vn is the level of n such that entrepreneurs stop pivoting. As discussed in the
previous section, entrepreneurs exit if ξn < –Vn. Then, if entrepreneurs perceive high opportunities at
the high end of the distribution (fatter tails), the scientific approach makes them more conservative,
lowering the perceived expected value Vn. The scientific entrepreneurs will then be more likely to exit;
vice versa if entrepreneurs perceive low opportunities, and the scientific approach raises their
confidence that they can reach higher-end results. This implies that the effect of the scientific approach
on exit depends on whether entrepreneurs are more likely to underestimate or overestimate
opportunities. This leads to Proposition 1 in the text: if there are more overconfident entrepreneurs, we
observe on average that the scientific approach raises the share of exits.
We now turn to the effect of the scientific approach on pivot. As discussed earlier, the
distribution Fn dominates, in the second-order sense, the new idea that entrepreneurs explore, whose
distribution is Fn+1. This implies ∫ Fna
x dv ≥ ∫ Fn+1a
x dv. The question is whether the distribution Fn+1 of
the scientist entrepreneurs dominates, in the second-order stochastic sense, the distribution Fn+1 of the
counterfactual non-scientist entrepreneurs. As noted earlier, the scientific approach could affect this
distribution in both directions. Scientists may see fewer or more opportunities, which raises or lowers
∫ Fn+1a
x dv.
As discussed in the text, we make two reasonable assumptions. The first one is that, whether
scientists or non-scientists, unimaginative or confused, entrepreneurs show a less pronounced difference
in ∫ Fna
x dv than ∫ Fn+1a
x dv. There will still be some differences among these entrepreneurs in ∫ Fna
x dv,
with unimaginative entrepreneurs showing slimmer tails than confused, and scientist entrepreneurs
40
correcting these biases by expanding or contracting the distribution accordingly. However, as discussed
in the theory section in the text, the information that has become available about the nth idea, which has
just been explored, has levelled the information set of the different entrepreneur types, making their
distributions closer. The second assumption is that being unimaginative or confused is a trait of the
entrepreneur. Therefore, entrepreneurs predict in unimaginative or confused ways both the current and
the next idea. However, because they have less information about the next idea, a confused entrepreneur
exhibits a higher positive gap in ∫ Fn − Fn+1a
x dv, which the scientific approach reduces; conversely, an
unimaginative entrepreneur exhibits a lower positive gap, which the scientific approach increases.
As a result, from the right-hand side of (3), if the scientific approach makes entrepreneurs less
confused, the optimal n of scientist-entrepreneurs lowers compared to the counterfactual non-scientist
entrepreneurs, and vice versa if the scientific approach makes the entrepreneurs more imaginative. In
turn, this implies that unimaginative non-scientist entrepreneurs exhibit the lowest optimal n, while
confused non-scientist entrepreneurs exhibit the highest optimal n. Therefore, the scientific approach
reduces the range between high and low numbers of pivots, as stated in Proposition 2 in the text.
Finally, a minimalistic approach suggests that whether scientific entrepreneurs adjust to a
distribution closer to the ‘true’ distribution of the phenomenon is an empirical question. A stronger view
suggests instead that if the scientific approach helps to make better predictions, entrepreneurs who adopt
this approach enjoy higher performance. As shown in the text, empirically we corroborate this
prediction.
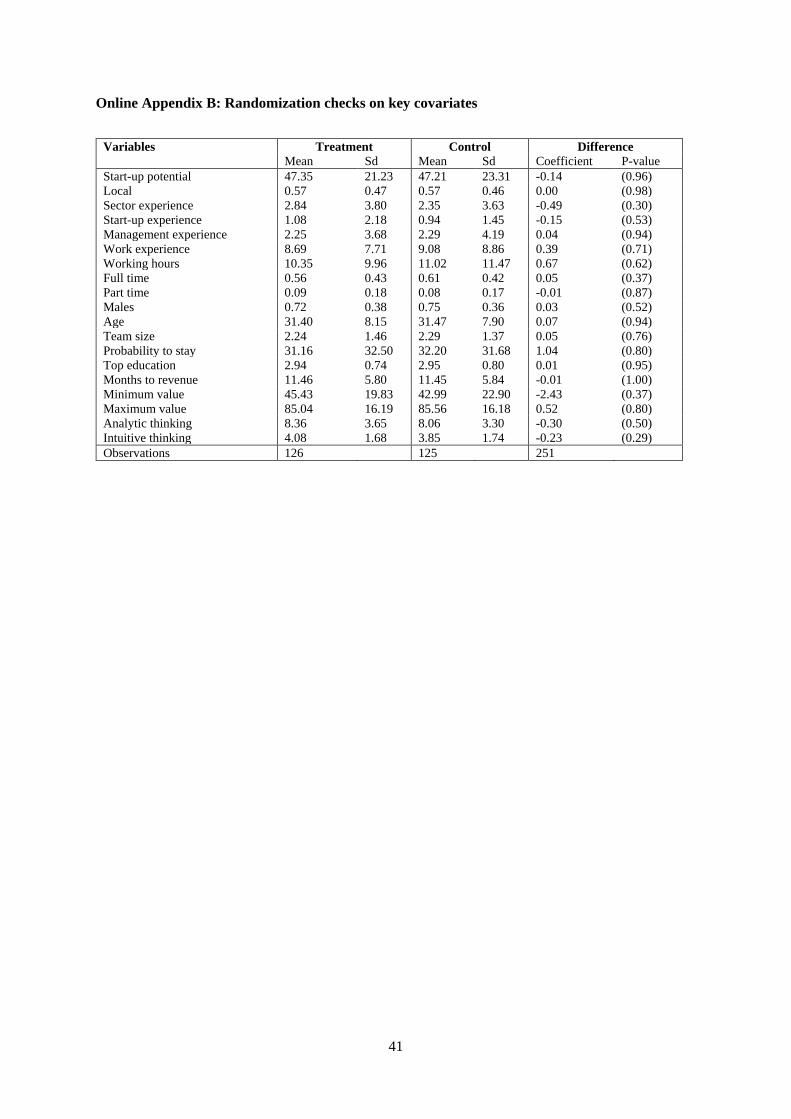
41
Online Appendix B: Randomization checks on key covariates
Variables Treatment Control Difference Mean Sd Mean Sd Coefficient P-value Start-up potential 47.35 21.23 47.21 23.31 -0.14 (0.96) Local 0.57 0.47 0.57 0.46 0.00 (0.98) Sector experience 2.84 3.80 2.35 3.63 -0.49 (0.30) Start-up experience 1.08 2.18 0.94 1.45 -0.15 (0.53) Management experience 2.25 3.68 2.29 4.19 0.04 (0.94) Work experience 8.69 7.71 9.08 8.86 0.39 (0.71) Working hours 10.35 9.96 11.02 11.47 0.67 (0.62) Full time 0.56 0.43 0.61 0.42 0.05 (0.37) Part time 0.09 0.18 0.08 0.17 -0.01 (0.87) Males 0.72 0.38 0.75 0.36 0.03 (0.52) Age 31.40 8.15 31.47 7.90 0.07 (0.94) Team size 2.24 1.46 2.29 1.37 0.05 (0.76) Probability to stay 31.16 32.50 32.20 31.68 1.04 (0.80) Top education 2.94 0.74 2.95 0.80 0.01 (0.95) Months to revenue 11.46 5.80 11.45 5.84 -0.01 (1.00) Minimum value 45.43 19.83 42.99 22.90 -2.43 (0.37) Maximum value 85.04 16.19 85.56 16.18 0.52 (0.80) Analytic thinking 8.36 3.65 8.06 3.30 -0.30 (0.50) Intuitive thinking 4.08 1.68 3.85 1.74 -0.23 (0.29) Observations 126 125 251
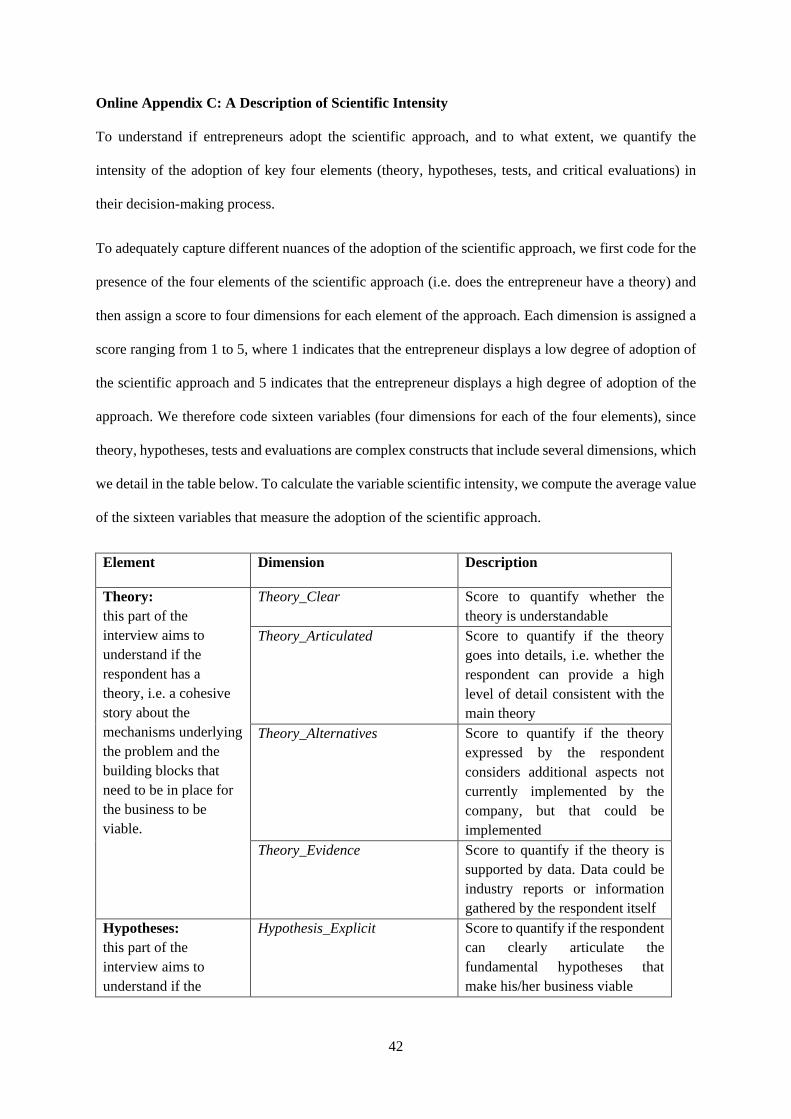
42
Online Appendix C: A Description of Scientific Intensity
To understand if entrepreneurs adopt the scientific approach, and to what extent, we quantify the
intensity of the adoption of key four elements (theory, hypotheses, tests, and critical evaluations) in
their decision-making process.
To adequately capture different nuances of the adoption of the scientific approach, we first code for the
presence of the four elements of the scientific approach (i.e. does the entrepreneur have a theory) and
then assign a score to four dimensions for each element of the approach. Each dimension is assigned a
score ranging from 1 to 5, where 1 indicates that the entrepreneur displays a low degree of adoption of
the scientific approach and 5 indicates that the entrepreneur displays a high degree of adoption of the
approach. We therefore code sixteen variables (four dimensions for each of the four elements), since
theory, hypotheses, tests and evaluations are complex constructs that include several dimensions, which
we detail in the table below. To calculate the variable scientific intensity, we compute the average value
of the sixteen variables that measure the adoption of the scientific approach.
Element Dimension Description
Theory: this part of the interview aims to understand if the respondent has a theory, i.e. a cohesive story about the mechanisms underlying the problem and the building blocks that need to be in place for the business to be viable.
Theory_Clear Score to quantify whether the theory is understandable
Theory_Articulated Score to quantify if the theory goes into details, i.e. whether the respondent can provide a high level of detail consistent with the main theory
Theory_Alternatives Score to quantify if the theory expressed by the respondent considers additional aspects not currently implemented by the company, but that could be implemented
Theory_Evidence Score to quantify if the theory is supported by data. Data could be industry reports or information gathered by the respondent itself
Hypotheses: this part of the interview aims to understand if the
Hypothesis_Explicit Score to quantify if the respondent can clearly articulate the fundamental hypotheses that make his/her business viable
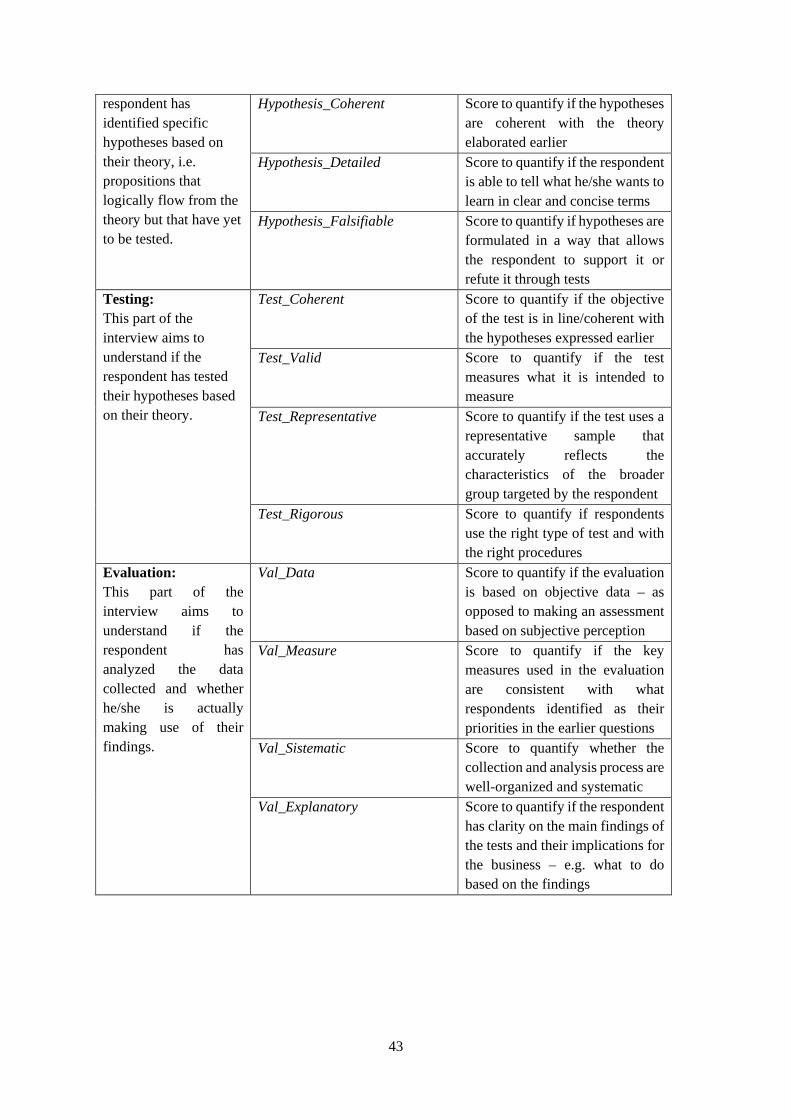
43
respondent has identified specific hypotheses based on their theory, i.e. propositions that logically flow from the theory but that have yet to be tested.
Hypothesis_Coherent Score to quantify if the hypotheses are coherent with the theory elaborated earlier
Hypothesis_Detailed Score to quantify if the respondent is able to tell what he/she wants to learn in clear and concise terms
Hypothesis_Falsifiable Score to quantify if hypotheses are formulated in a way that allows the respondent to support it or refute it through tests
Testing: This part of the interview aims to understand if the respondent has tested their hypotheses based on their theory.
Test_Coherent Score to quantify if the objective of the test is in line/coherent with the hypotheses expressed earlier
Test_Valid Score to quantify if the test measures what it is intended to measure
Test_Representative Score to quantify if the test uses a representative sample that accurately reflects the characteristics of the broader group targeted by the respondent
Test_Rigorous Score to quantify if respondents use the right type of test and with the right procedures
Evaluation: This part of the interview aims to understand if the respondent has analyzed the data collected and whether he/she is actually making use of their findings.
Val_Data Score to quantify if the evaluation is based on objective data – as opposed to making an assessment based on subjective perception
Val_Measure Score to quantify if the key measures used in the evaluation are consistent with what respondents identified as their priorities in the earlier questions
Val_Sistematic Score to quantify whether the collection and analysis process are well-organized and systematic
Val_Explanatory Score to quantify if the respondent has clarity on the main findings of the tests and their implications for the business – e.g. what to do based on the findings