Embed Size (px)
Citation preview
Volume VI, No. 2, 2005 29 Issues in Information Systems
DECISION SUPPORT SYSTEMS ANALYSIS WITH SIMULATION
Shamsuddin Ahmed, BCB, KIMEP, Kazakhstan, [email protected] Cross, Edith Cowan University, Perth, Australia
ABSTRACT
A decision support system (DSS) is developed for car registration in a Gulf Cooperation Council(GCC) country using simulation model. The car registration is managed by a governmentorganization but a private corporation certifies the car fitness. High variation is noticed inregistration and therefore a simulation model is developed to evaluate the registrationoperations and policies. The simulation model replicates the existing operational policies andevaluates feasible policies to maximize system performance. The suggested DSS model providesrobust analysis in system time, service time and average queue lengths as an index to monitorthe service quality.
Key Words: Decision Support System (DSS), Simulation, Car Registration, Service Operation,Systems Analysis, Information Maximization
INTRODUCTION
A visual SLAM [1] computer simulation model is developed to analyze car registration andinspection in a GCC country. Founded on 26 May 1981, the GCC countries consist of Bahrain,Qatar, Saudi Arabia, Kuwait, United Arab Emirates, and Oman. The aim of the GCC countries isto promote coordination between member states in all fields in order to achieve unity.
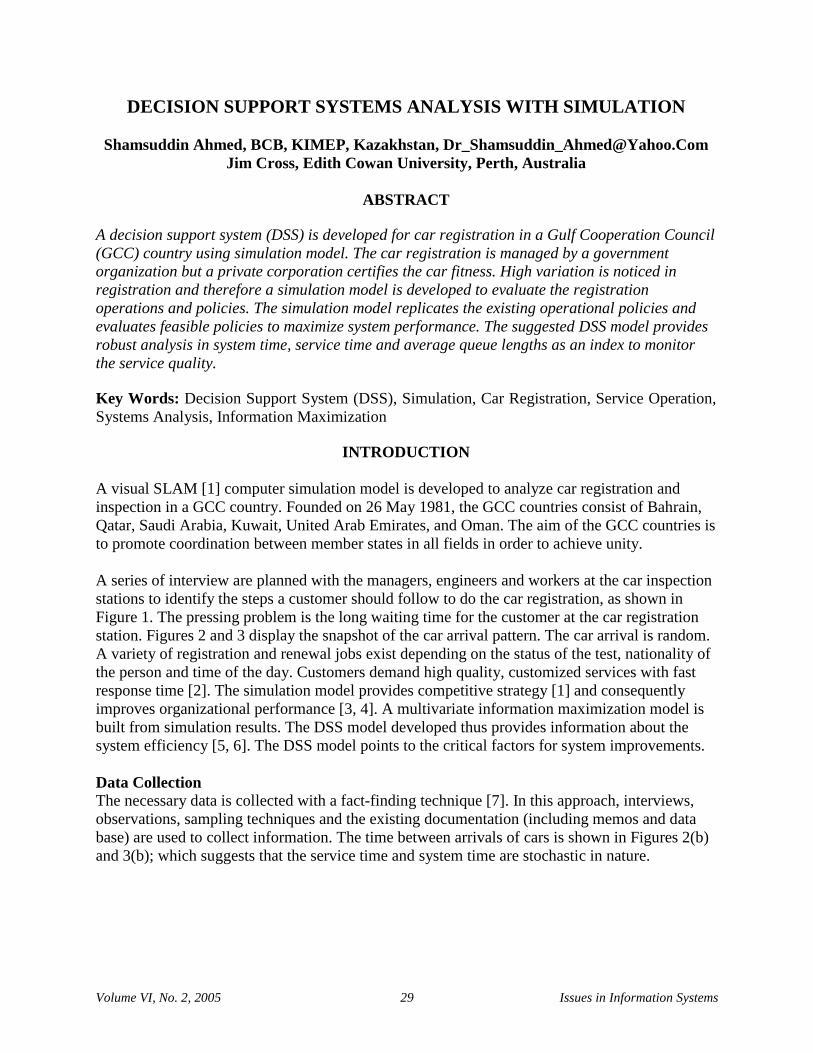
A series of interview are planned with the managers, engineers and workers at the car inspectionstations to identify the steps a customer should follow to do the car registration, as shown inFigure 1. The pressing problem is the long waiting time for the customer at the car registrationstation. Figures 2 and 3 display the snapshot of the car arrival pattern. The car arrival is random.A variety of registration and renewal jobs exist depending on the status of the test, nationality ofthe person and time of the day. Customers demand high quality, customized services with fastresponse time [2]. The simulation model provides competitive strategy [1] and consequentlyimproves organizational performance [3, 4]. A multivariate information maximization model isbuilt from simulation results. The DSS model developed thus provides information about thesystem efficiency [5, 6]. The DSS model points to the critical factors for system improvements.
Data CollectionThe necessary data is collected with a fact-finding technique [7]. In this approach, interviews,observations, sampling techniques and the existing documentation (including memos and database) are used to collect information. The time between arrivals of cars is shown in Figures 2(b)and 3(b); which suggests that the service time and system time are stochastic in nature.

Decision Support Systems Analysis with Simulation
Volume VI, No. 2, 2005 30 Issues in Information Systems
SIMULATION MODELING AND METHOD ANALYSIS
In a simulation model the cars move through a series of testing stations such as hydrocarbon,tires, rims, break system, shock absorber, visual, body and chassis in the inspection process.Figure 4 is the AweSim network simulation model. At the end of the inspection, the result iseither pass or fail. If the final result is fault free, the car is routed to the traffic department tofinish the renewal of the registration card. Otherwise, the result is fail if the car functionsimproperly. Hence, the car is routed to the repair center to fix the defects identified. After beingrepaired, the car is again sent back to the inspection center to obtain a pass certificate if itsatisfies the test requirements. The car registration system is shown in Figure 1, while Figures2(a) and 3(a) are the service and system time information.
The car arrives at the registration center and is routed to the inspection station according toFigure 1. The three independent lanes for testing in the inspection station are represented asservers [8]. If the three testing lanes are busy, three parallel queues of cars are formed. Thisprocess can be conveniently modeled in AweSim with threeQUEUEnodes that precede theservice activity as testing, which represents three independentSERVERS. The service activity isdenoted by the inspectors and 80 percent of the cars passed the test and depart to the traffic
Decision Support Systems Analysis with Simulation
Volume VI, No. 2, 2005 31 Issues in Information Systems
department. The remaining 20 percent of the cars inspected failed the inspection test. Hence,repair is recommended. The repair is modeled with aQUEUEnode followed by a serviceactivity with a capacity of 15 cars. Following the adjustment operation, the car is routed back tothe inspection area ofQUEUEwith a first in first out (FIFO) criteria.
The AweSim graphical model is shown in Figure 4. Entities representing cars are created by theCREATEnode with the time between entities uniformly distributed between 10 and 25 minutes.Each car advances to one of theQUEUEnodes. TheQUEUEnode with the least number of carsproceeds directly to service for inspection. The inspection lane is represented by the threeemanatingSERVICEactivities following the queue. The service time for all the servers isidentified as uniform distribution in the range between 25 and 35 minutes.
After inspection the car arrives at aGOONnode where it is probabilistically routed. One activityleads to theCOLECTnode, representing departure from the traffic department; the other activityleads to theQUEUEnode, representing the waiting line for the repairing activity. Entities, whichare routed to theCOLCTnode, have interval statistics collected based on the time of creation.The information is stored inATRIB[1] that isassignedat theCREATEnode. The total time a carspends in the inspection and repairing areas are recorded. The cars are then removed from themodel with theTERMINATEnode. TheCONTROLstatement runs the simulation model.
SIMULATION EXPERIMENT SETTING
The simulation summary report is collected in Table 2. The report contains interval statistics ontheTIME IN SYSTEMacquired from theCOLCTnode. The length of simulation run is 6000minutes and is controlled with theINITILIZE statement. A high variability in system times forcar registration is evident from the minimum and maximum times recorded in report. A highvalue of standard deviation in the system suggests that some of the cars can’t be repaired on thespot in repair station. The second part of the report is theFILE STATISTICS. TheSERVICEACTIVITY STATISTICSshow that the four service activities modeled as activities 31, 32, 33 and34 (Figure 4) are highly utilized (e.g. more than 95% of the time) [6]. The inspection activitiesare 31, 32 and 33, while activity 34 is the repair phase when a vehicle fails the test.

Decision Support Systems Analysis with Simulation
Volume VI, No. 2, 2005 32 Issues in Information Systems
Simulation ResultsThe model performance is evaluated according to the scenarios as shown in Table 1. Thesimulation model is run 14 times and the results are shown in Table 2(a). The average systemtime in registration and inspection center is approximately 83 minutes. The standard deviation isabout 51, which suggests that some vehicles need longer times for repair. The number ofobservations in the simulation study is about 2530 cars for a period of 6000 minutes. Thefrequency distribution of the system time is an exponential distribution, with a mean of 83minutes. The maximum and minimum system times are 519 and 31 minutes respectively. Theaverage waiting time in Queues 3, 4, 5 and 6 are shown in Table 2(b). The average waiting timein Queue 3 is about 15 minutes, while in Queues 4 and 5, the waiting time is 5.4 and 1.55minutes. The cars enter theQUEUEnode based onthe smallest size in queue rulewith aSELECTnode in aBLOCKmode and is used when the queues are in full capacity. The car isforced to enter the queue.
DECISION SUPPORT SYSTEM (DSS)
The simulation results show variability; hence, the decisions based on a single set of output isnot reliable. To reduce variance in the simulation study, various replications of the study aregenerated. The DSS analysis with experimental design is a meta-model [9] and is convenient to
Decision Support Systems Analysis with Simulation
Volume VI, No. 2, 2005 33 Issues in Information Systems
interpret the results [10, 11]. In DSS the factors of exogenous and endogenous variables arecalibrated for sensitivity analysis [12, 13]. The DSS also optimizes the system response [14, 10].For a small number of input variables, a 3k factorial design is preferred. In full factorial design,the number of design points is large for a large number of input. A response surface with a smalldesign, the meta-model requires 2k fractional factorial design [15, 16 and 17]. The Plackett andBurmann [18] fractional factorial design investigates many factors simultaneously withouthaving to investigate all the possible combinations of factors [19]. This design is not widely usedin simulation. Multiple replications of simulation results constitute framework to design meta-model. The small designs require less number of simulation runs to model a DSS forperformance evaluation [20]. The DSS model incorporates investigative and projectioncapabilities. The proposed DSS has the following steps:
a.) A design of experiment model with simulated data determines the model parametersb.) Statistical analysis of the model and model parameters supports the DSSc.) The simulation is validated with statistical analysisd.) Cause effect analysis is provided for predictive purpose.
The statistical tests include R2, Sum of Square Error, mean absolute error, Mean PercentageError and probability test. The average waiting time, is an indication of the system responsetime. The system time is a system variable. It is the combination of the waiting time and servicetime. The service time is server related and is a technological factor. If service is consideredconstant with some parameter, then the system time is directly proportional to the waiting time.Hence, the waiting is an indication of the system time. The DSS model is expressed as
ε+++= 332211 xaxaxay
where
Otherwise
Scanerio A,if it isx
ÿ��
=0
11 ; Otherwise
Scanerio B,if it isx
ÿ��
=0
12
Otherwise
Scanerio C,if it isx
ÿ��
=0
13 ; termErrorand =ε
Next, the null hypothesis that the mean waiting times in the system are equal is testedH0: a1=a2=a3
against the hypothesis that at least one mean of the proposed scenario is differentH0: a1ÿa2ÿa3
In Tables 4 and 5, it is evident that the computed value ofF exceeds the critical value; hence thenull hypothesis H0: a1=a2=a3 is rejected and we conclude that the proposed scenarios havedifferent mean waiting times. This implies that resources influence service factors. In order totest the validity of the DSS, we tested the flowing hypotheses: H01: a1=0; H02: a2=0; H03: a3=0against H11: a1ÿ0, H12: a2ÿ0 and H13: a3ÿ0. Since the p-values are almost negligible, we rejectedH01: a1=0, H02: a2=0, and H03: a3=0 and concluded that the regressors in the proposed DSScontributed significantly. Hence some degree of delay in car registration is expected. Also, thecorrelation coefficient is significant and explains about the 85% of the variances, while the Fvalue is also significant at 41.5. It is clear that the system time significantly reduced the waitingtime from 51.33 minutes in scenario A to 12.67 minutes in scenario B, while with scenario C it
Decision Support Systems Analysis with Simulation
Volume VI, No. 2, 2005 34 Issues in Information Systems
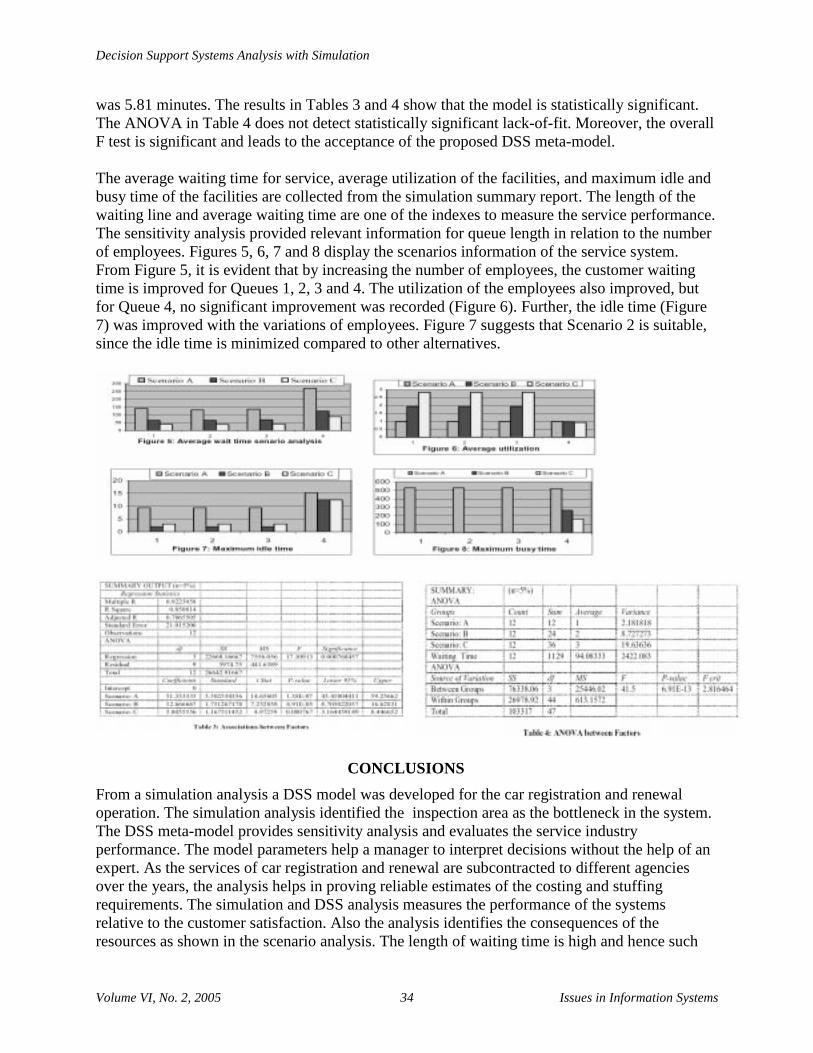
was 5.81 minutes. The results in Tables 3 and 4 show that the model is statistically significant.The ANOVA in Table 4 does not detect statistically significant lack-of-fit. Moreover, the overallF test is significant and leads to the acceptance of the proposed DSS meta-model.
The average waiting time for service, average utilization of the facilities, and maximum idle andbusy time of the facilities are collected from the simulation summary report. The length of thewaiting line and average waiting time are one of the indexes to measure the service performance.The sensitivity analysis provided relevant information for queue length in relation to the numberof employees. Figures 5, 6, 7 and 8 display the scenarios information of the service system.From Figure 5, it is evident that by increasing the number of employees, the customer waitingtime is improved for Queues 1, 2, 3 and 4. The utilization of the employees also improved, butfor Queue 4, no significant improvement was recorded (Figure 6). Further, the idle time (Figure7) was improved with the variations of employees. Figure 7 suggests that Scenario 2 is suitable,since the idle time is minimized compared to other alternatives.
CONCLUSIONS
From a simulation analysis a DSS model was developed for the car registration and renewaloperation. The simulation analysis identified the inspection area as the bottleneck in the system.The DSS meta-model provides sensitivity analysis and evaluates the service industryperformance. The model parameters help a manager to interpret decisions without the help of anexpert. As the services of car registration and renewal are subcontracted to different agenciesover the years, the analysis helps in proving reliable estimates of the costing and stuffingrequirements. The simulation and DSS analysis measures the performance of the systemsrelative to the customer satisfaction. Also the analysis identifies the consequences of theresources as shown in the scenario analysis. The length of waiting time is high and hence such
Decision Support Systems Analysis with Simulation
Volume VI, No. 2, 2005 35 Issues in Information Systems
circumstances indicate loss of productivity in the business. This scenario analysis illustrates howto improve the expected time required to finish the car registration and renewal.
REFERENCES
1. Pritsker, A.A. B., O’Reilly, J.J. (1999). Simulation with Visual SLAM. JW, NY, USA.
2. Valdivia M.T. R and Cowe T.J. (1997). Achieving Hospital Operating Objectives in the Light ofPatient Performances, Int. Journal of health Care Quality Assurance, 10(5), 208-212.
3. Evans J. R. & Olson, D.L., (2002). Introduction to Simulation and Risk Analysis, 2nd Ed. PH,NJ,USA.
4. Lopez-Valcarcel, B.G & Perez, P. B. (1994). Evaluation of Alternative Functional Designs in anEmergency Department by Means of Simulation. Simulation, 63(1), 20-28.
5. Clark Jr. T.D., Hammond, D.H. & Cossick, K. L. (1992). Management Policies to Improve theEffectiveness of Multistation Service Organizations, Decision Science, 3, 1099-1022.
6. Harrell, C., Tumay. K. (1995). Simulation Made Easy A Manager’s Guide, Engineering &Management Press, 25 Technology Park, Norcross, Georgia, USA.
7. Kelton W. D., Sadowski, R. P. & Sadowski D.A. (2002). Simulation with ARENA, McGraw Hill,NY, USA.
8. Fardane, T., Obaidly, M. (2002). Renewal & Registration in Traffic Department, Report, UAEU.
9. Friedman, L.W. (1996). The Simulation Metamodel, Kluwer Academic Pub., Norwell, MA.
10. Shang,J.S. & Tadikamalla, P.R., (1998). Multicriteria design and control of cellularmanufacturing system through simulation & optimization, IJPR, 36(6),1515–1528.
11. Hurrion, R.D. & Birgul, S., (1999). A comparison of factorial & random experimental designmethods for the development of regression & neural network simulation metamodels, J. of theOperational Research Society, 50(10), 1018–1033.
12. Kleijnen, J.P.C. (1977). Searching for important factors in simulation models with manyfactors: Sequential bifurcation, EJOR, 96(1), 180–194.
13. Hunter, J.S., & Naylor, T. H. (1970). Experimental designs for computer simulationexperiments, Management Science, 16(7), 422–434.
14. Madu, C.N. & Kuei, C.H. (1992). Group screening and taguchi design in the optimization ofmulti-echelon maintenance .oat simulation metamodels, Comp. & O.R, 19(2), 95–105.
15. Box, G.E.P., Hunter, J.S. (1961). The 2k_p factorial designs, Technometrics 3, 311–351.
16. Hood, S.J. and Welch, P. D. (1993). Response surface methodology and its applications insimulation, Proceedings of Winter Simulation Conference, 115–122.
17. Inci, B. & Semra, T. (2003). Small response surface designs for metamodel estimation,European Journal of Operational Research, 145, 455–470.
18. Plackett, R.L. & Burman, J.P (1946). The design of optimum multifactorial experiments.Biometrica, 33, 305-325.
19. Durig, T. & Fassihi, A. R. (1993). Identification of stabilizing and destabilizing effects ofexperiment-drug interactions in solid dosage from design. Int. J. of Pharmaceutics, 97, 161-170.
20. John, R.C. & Draper, N.R. (1975). D-optimality for regression designs: A review,Technometrics, 17, 5–23.


![Decision Support Systems - Universitatea Babeş-Bolyaiper/Dss/Dss_1.pdf · - Expert Systems and Artificial Intelligence in Decision Support Systems 12. ... [22]-Decision Support System](https://img.pdfslide.net/doc/110x75/5a75bc927f8b9a63638cb53e/decision-support-systems-universitatea-babes-bolyai-perdssdss1pdf-expert.jpg)