Embed Size (px)
Citation preview
Decision Usefulness of the Equity Method of
Accounting
by
Amanda L. Gonzales
Business AdministrationDuke University
Date:Approved:
Katherine Schipper, Supervisor
Jennifer Francis
John Graham
William Mayew
Per Olsson
Dissertation submitted in partial fulfillment of the requirements for the degree ofDoctor of Philosophy in Business Administration
in the Graduate School of Duke University2013
Abstract
Decision Usefulness of the Equity Method of Accounting
by
Amanda L. Gonzales
Business AdministrationDuke University
Date:Approved:
Katherine Schipper, Supervisor
Jennifer Francis
John Graham
William Mayew
Per Olsson
An abstract of a dissertation submitted in partial fulfillment of the requirements forthe degree of Doctor of Philosophy in Business Administration
in the Graduate School of Duke University2013

Copyright c© 2013 by Amanda L. GonzalesAll rights reserved except the rights granted by the
Creative Commons Attribution-Noncommercial Licence
Abstract
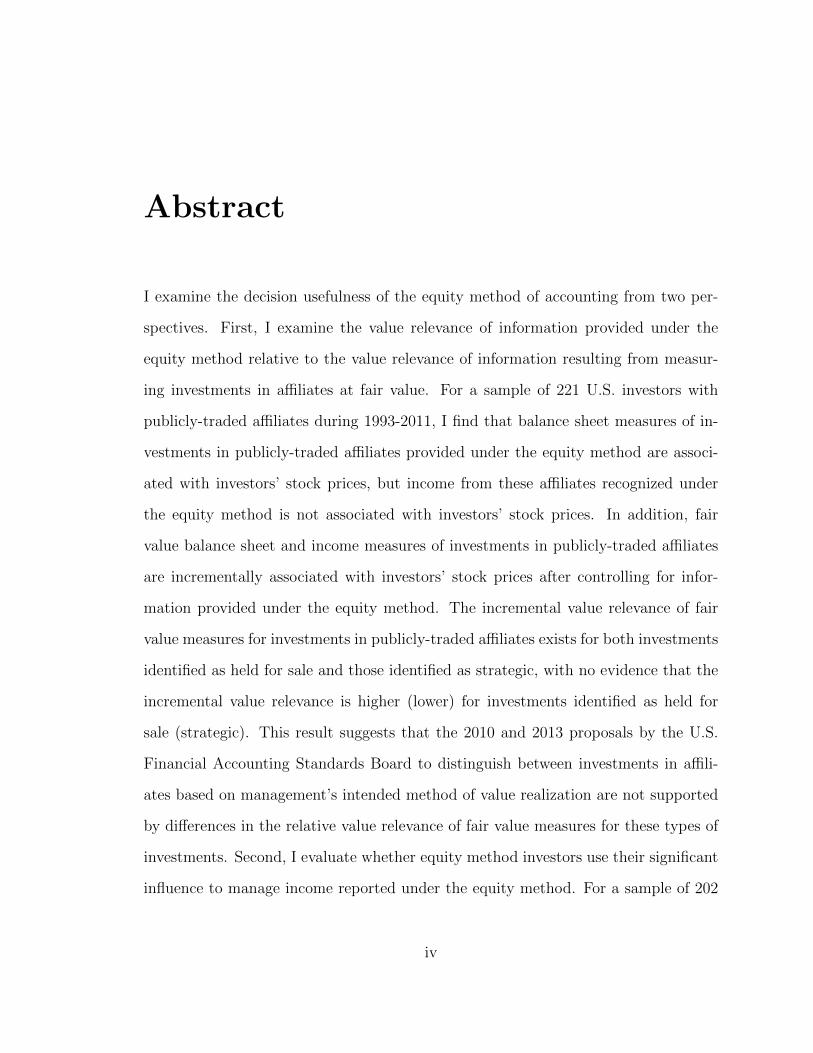
I examine the decision usefulness of the equity method of accounting from two per-
spectives. First, I examine the value relevance of information provided under the
equity method relative to the value relevance of information resulting from measur-
ing investments in affiliates at fair value. For a sample of 221 U.S. investors with
publicly-traded affiliates during 1993-2011, I find that balance sheet measures of in-
vestments in publicly-traded affiliates provided under the equity method are associ-
ated with investors’ stock prices, but income from these affiliates recognized under
the equity method is not associated with investors’ stock prices. In addition, fair
value balance sheet and income measures of investments in publicly-traded affiliates
are incrementally associated with investors’ stock prices after controlling for infor-
mation provided under the equity method. The incremental value relevance of fair
value measures for investments in publicly-traded affiliates exists for both investments
identified as held for sale and those identified as strategic, with no evidence that the
incremental value relevance is higher (lower) for investments identified as held for
sale (strategic). This result suggests that the 2010 and 2013 proposals by the U.S.
Financial Accounting Standards Board to distinguish between investments in affili-
ates based on management’s intended method of value realization are not supported
by differences in the relative value relevance of fair value measures for these types of
investments. Second, I evaluate whether equity method investors use their significant
influence to manage income reported under the equity method. For a sample of 202
iv

U.S. firms from 1993-2011, I find that signed discretionary accruals of affiliates are
higher when income from affiliates allows investors to meet earnings targets. This
result is consistent with equity method investors influencing the financial reporting
of affiliates to achieve earnings targets.
v

To my husband, Kevin, whose unending support, encouragement, and sacrificial
love made it possible for me to complete this dissertation.
vi
Contents
Abstract iv
List of Tables ix
Acknowledgements xi
1 Introduction 1
2 The Equity Method of Accounting 8
3 Sample and Data 10
4 Descriptive Statistics 14
4.1 Variables Specific to the Equity Method . . . . . . . . . . . . . . . . 14
4.2 Comparison of Equity Method Investors and Affiliates with the FullCompustat Population . . . . . . . . . . . . . . . . . . . . . . . . . . 20
4.3 Analysis of Changes in Firms When Held As Affiliates . . . . . . . . 21
5 Value Relevance of Information Provided by the Equity Method 23
5.1 Related Literature and Hypotheses Development . . . . . . . . . . . . 23
5.2 Research Design . . . . . . . . . . . . . . . . . . . . . . . . . . . . . . 32
5.3 Empirical Results . . . . . . . . . . . . . . . . . . . . . . . . . . . . . 35
5.4 Supplementary Analyses . . . . . . . . . . . . . . . . . . . . . . . . . 42
5.4.1 Correlation between Investor and Affiliate Returns . . . . . . 42
5.4.2 Theoretical Values in a Residual Income Model . . . . . . . . 43
vii
6 Earnings Management by Investors with Significant Influence 46
6.1 Related Literature and Hypotheses Development . . . . . . . . . . . . 46
6.2 Research Design . . . . . . . . . . . . . . . . . . . . . . . . . . . . . . 50
6.3 Empirical Results . . . . . . . . . . . . . . . . . . . . . . . . . . . . . 55
6.4 Supplementary Analyses . . . . . . . . . . . . . . . . . . . . . . . . . 60
6.4.1 Effect of “True” Significant Influence . . . . . . . . . . . . . . 60
6.4.2 Differences in Earnings Management of Public Affiliates andPrivate Affiliates . . . . . . . . . . . . . . . . . . . . . . . . . 63
6.4.3 Potential for Mechanical Relation Between Investor Incentiveand Outcome Variables . . . . . . . . . . . . . . . . . . . . . . 66
6.4.4 Additional Investigation into Effects of Accruals Reversal . . . 67
6.4.5 Other Potential Methods of Managing Earnings from Invest-ments in Affiliates . . . . . . . . . . . . . . . . . . . . . . . . . 68
6.4.6 Reverse Causality/Endogeneity . . . . . . . . . . . . . . . . . 72
6.4.7 Effect of Equity Method Ownership on Accounting Conser-vatism of Affiliates . . . . . . . . . . . . . . . . . . . . . . . . 72
7 Link between Value Relevance and Earnings Management 78
8 Conclusion 82
A Description of the Cost Method 84
Bibliography 87
Biography 94
viii

List of Tables
3.1 Sample Identification . . . . . . . . . . . . . . . . . . . . . . . . . . . 11
4.1 Descriptive Statistics for Full Sample of Equity Method Investors . . 16
4.2 Descriptive Statistics for Full Sample of Affiliates . . . . . . . . . . . 17
4.3 Investors’ Prior and Subsequent Ownership of Affiliates . . . . . . . . 19
4.4 Industry Analysis . . . . . . . . . . . . . . . . . . . . . . . . . . . . . 20
5.1 Descriptive Statistics for the Analysis of the Relation between In-vestors’ Stock Prices and Balance Sheet and Income Measures of In-vestments in Affiliates . . . . . . . . . . . . . . . . . . . . . . . . . . 36
5.2 Correlation Coefficients for the Analysis of the Relation between In-vestors’ Stock Prices and Balance Sheet and Income Measures of In-vestments in Affiliates . . . . . . . . . . . . . . . . . . . . . . . . . . 37
5.3 Relation between Investors’ Stock Prices and Balance Sheet and In-come Measures of Investments in Affiliates . . . . . . . . . . . . . . . 40
5.4 Effect of the Correlation of Investor and Affiliate Stock Returns onthe Relation between Investors’ Stock Prices and Balance Sheet andIncome Measures of Investments in Affiliates . . . . . . . . . . . . . . 43
5.5 Evaluation of Theoretical Values of Coefficients Relating Investors’Stock Prices to Balance Sheet and Income Measures of Investmentsin Affiliates . . . . . . . . . . . . . . . . . . . . . . . . . . . . . . . . 45
6.1 Descriptive Statistics for the Discretionary Accruals Analysis . . . . . 56
6.2 Correlation Coefficients for the Discretionary Accruals Analysis . . . 57
6.3 Relation between Equity Method Ownership and Discretionary Accru-als of Affiliates . . . . . . . . . . . . . . . . . . . . . . . . . . . . . . 59
ix

6.4 Effect of “True” Significant Influence on the Relation between EquityMethod Ownership and Discretionary Accruals of Affiliates . . . . . . 64
6.5 Effect of Existence of Private Affiliates on the Relation between EquityMethod Ownership and Discretionary Accruals of Affiliates . . . . . . 66
6.6 Effect of Defining Investor Incentive Variable as Just Meeting or Beat-ing an Earnings Target on the Relation between Equity Method Own-ership and Discretionary Accruals of Affiliates . . . . . . . . . . . . . 67
6.7 Relation between Equity Method Ownership and Discretionary Accru-als of Affiliates for Investors with INCENTIVEINV ESTORk,t = 0 in AllPeriods . . . . . . . . . . . . . . . . . . . . . . . . . . . . . . . . . . 69
6.8 Relation between Equity Method Ownership and Accounting Conser-vatism of Affiliates . . . . . . . . . . . . . . . . . . . . . . . . . . . . 77
7.1 Effect of Earnings Management by Investors on the Relation betweenInvestors’ Stock Prices and Balance Sheet and Income Measures ofInvestments in Affiliates . . . . . . . . . . . . . . . . . . . . . . . . . 80
7.2 Effect of Separating Publicly-Traded and Private Affiliates on the Re-lation between Investors’ Stock Prices and Balance Sheet and IncomeMeasures of Investments in Affiliates . . . . . . . . . . . . . . . . . . 81
x

Acknowledgements
I thank my dissertation committee members Jennifer Francis, John Graham, Bill
Mayew, Per Olsson, and Katherine Schipper (chair) for valuable comments and di-
rection. I also thank Dirk Black, Thomas Steffen, and workshop participants at Duke
University, Georgetown University, Indiana University, Pennsylvania State Univer-
sity, Texas A&M University, the University of Nebraska—Lincoln, and the University
of Washington for helpful suggestions.
xi
1
Introduction
This paper examines two aspects of the decision usefulness of information provided
by applying the equity method of accounting. First, I examine the value relevance of
balance sheet and income statement information provided under the equity method
relative to the value relevance of balance sheet and income statement information
resulting from measuring investments in affiliates at fair value.1 Second, I evaluate
whether equity method investors use their significant influence to manage income
reported under the equity method.
The equity method of accounting was promulgated in its current form over forty
years ago by APB Opinion No. 18 “The Equity Method of Accounting for Invest-
ments in Common Stock” (APB 18). APB 18 preceded the Conceptual Framework
of the U.S. Financial Accounting Standards Board (FASB) and does not specify a
measurement attribute for investments in affiliates.2 Instead, it describes the me-
1 Throughout this paper, I use the term “affiliate” to refer to a firm that has a corporate investorapplying the equity method of accounting to its investment in that firm.
2 The FASB (ASC Glossary) defines a measurement attribute as the “quantifiable characteristic ofan item that is measured for accounting purposes.” For example, fair value is the “amount at whichan asset (or liability) could be bought (or incurred) or sold (or settled) in a current transactionbetween willing parties, that is, other than in a forced or liquidation sale.” In contrast, the carrying
1
chanics of calculating the carrying value for such investments (a calculated value, not
a measurement). Since APB 18 was issued, accounting standard setters have required
fair value measurement for certain financial assets (e.g., SFAS No. 12, Accounting
for Certain Marketable Securities (1975); SFAS No. 115, Accounting for Certain
Investments in Debt and Equity Securities (1993); SFAS No. 133, Accounting for
Derivative Instruments and Hedging Activities (1998)). However, the FASB has not
changed the accounting requirements for investments in affiliates. The durability of
the equity method raises questions about whether some distinctive feature of invest-
ments in which investors have the ability to exercise “significant influence” over the
operating and financial policies of investees makes the equity method a decision useful
accounting treatment for these types of investments.
My research aims to shed light on the decision usefulness of the information pro-
vided by applying the equity method from two perspectives. First, I examine the
value relevance of balance sheet and income statement information provided under
the equity method relative to the value relevance of information resulting from mea-
suring investments in affiliates at fair value; that is, accounting for them as if they
were trading securities. This analysis can be thought of as a joint test of relevance
and faithful representation, the two fundamental qualitative characteristics of useful
financial information identified in Chapter 3, Qualitative Characteristics of Useful
Financial Information, of the FASB’s Conceptual Framework. For a sample of 221
U.S. investors with publicly-traded affiliates during 1993-2011, I find that balance
sheet measures of investments in publicly-traded affiliates provided under the equity
method are associated with investors’ stock prices, but income from these affiliates
recognized under the equity method is not associated with investors’ stock prices. In
addition, fair value balance sheet and income measures of investments in publicly-
value of an equity method investment can only be described by explaining how it is calculated; it isnot a characteristic of the underlying equity securities held.
2
traded affiliates are incrementally associated with investors’ stock prices after con-
trolling for information provided under the equity method. This result suggests that
fair value measurement provides incremental relevant information, compared to the
equity method, for investments in affiliates.3
I refine this analysis to incorporate the FASB’s most recent deliberations on the
accounting for investments in affiliates, which reflect the idea that an entity’s plan for
realizing value from its investment in an affiliate (i.e., its business model) affects the
relevance of various measurement attributes. In particular, the FASB’s 2010 Exposure
Draft, Accounting for Financial Instruments and Revisions to the Accounting for
Derivative Instruments and Hedging Activities, proposed restricting the application
of the equity method to cases where the investor has significant influence over the
investee and the operations of the investee are considered related to the investor’s
consolidated operations (“strategic” investments in affiliates). If these two criteria
are not satisfied, the investment would be measured at fair value with changes in
fair value included in net income. The FASB’s 2013 Exposure Draft, Recognition and
Measurement of Financial Assets and Financial Liabilities, revised the proposals to
require investors with the ability to exercise significant influence over an investee to
use the equity method unless the plan is to realize value by selling the investment. In
that case, the investment should be measured at fair value with changes in fair value
included in net income. I separately analyze the incremental value relevance of fair
value measures for investments in affiliates identified as held for sale and strategic. I
find that fair value measurement provides incremental relevant information, compared
to the equity method, for both categories of investments in affiliates. In addition, I
find no evidence that the incremental value relevance of fair value measures is higher
3 I acknowledge that fair value measurements might be less reliable in other samples, includinginvestments in non-publicly traded affiliates (e.g., investments in some joint ventures). However,that is a measurement (reliability) issue, separate from the relevance of the information providedby measuring investments in affiliates at fair value. The issue of reliability is discussed further inChapter 5.1.
3
(lower) for investments in affiliates identified as held for sale (strategic). This result
suggests that the FASB’s 2010 and 2013 proposals to distinguish between investments
in affiliates based on management’s intended method of value realization are not
supported by differences in the relative value relevance of fair value measures for
these types of investments.
My second research question views the equity method from an income statement
perspective and examines the neutrality of income reported under the equity method.
Neutrality is identified as a component of faithful representation in the FASB’s Con-
ceptual Framework. Specifically, I investigate whether the equity method achieves
its objective of reducing earnings management. In developing APB 18, a reason
noted for requiring the equity method when investors can exercise significant influ-
ence is that the cost method might invite earnings management through the timing of
dividend payments. However, the equity method does not eliminate the potential op-
portunity for earnings management; it shifts the opportunity to a different channel.
Equity method investors might have the ability to use their “significant influence”
to manage the earnings of affiliates and thereby affect their own income, because a
proportionate share of the affiliates’ income flows into investors’ net income.
I investigate this issue by examining signed discretionary accruals of affiliates,
using a sample of 202 publicly-traded U.S. firms that were affiliates for a portion
of the period 1993-2011. I find that signed discretionary accruals of publicly-traded
affiliates are higher when income from the affiliates allows investors to meet earnings
targets. This result indicates that the equity method does not eliminate concerns
about earnings management (such as those expressed in relation to the cost method);
instead, it changes the mechanism through which earnings are managed. In supple-
mentary analyses, I find evidence that the earnings management result is stronger (a)
for equity method investors that are more likely to exercise significant influence (e.g.,
those that held a subsidiary-level interest in the affiliate prior to application of the
4
equity method, those with ownership of less than 20%, and those with longer holding
periods) and (b) when equity method investors do not have an option to manage
income from private affiliates and therefore might be more likely to manage income
from publicly-traded affiliates even though it might be more difficult or costly.
Two previous studies compare the decision usefulness of the equity method of ac-
counting with that of proportional consolidation for Canadian firms during 1995-2001.
Graham et al. (2003a) and Kothavala (2003) find that proportionate consolidation
better predicts future return on equity and price volatility, respectively. Kothavala
also finds that the equity method is more risk relevant than proportionate consoli-
dation for explaining bond ratings. In addition, Lee et al. (2013) find that analysts’
annual earnings forecasts are less accurate and more dispersed for firms with affiliates
relative to firms without affiliates for a sample of 21,336 U.S firm-year observations
from 1985-2010. The authors suggest that this is due to the lack of disclosure of com-
ponents of affiliate earnings under the equity method. Related to my study, Graham
et al. (2003b) examine a sample of 55 U.S. investors from 1993-1997 and find that
both the carrying values reported under the equity method and the fair values of in-
vestments in publicly-traded affiliates have a positive association with stock prices of
investor firms. The authors also find no association between income from investments
in affiliates reported under the equity method and investors’ stock prices. I confirm
this result for a larger sample and longer time period and also provide evidence of
the incremental value relevance of income from investments in affiliates measured
using fair value. I also contribute to the equity method literature by providing ev-
idence that equity method investors influence the financial reporting of affiliates to
achieve their own earnings objectives; that is, use of the equity method does not elim-
inate concerns about earnings management. This identification of ex post earnings
management extends previous literature documenting ex ante actions taken by firms
to manage earnings in relation to equity method investments (e.g., Comiskey and
5
Mulford (1986, 1988); Morris and Gordon (2006)).
I also extend the literature investigating the relation between large shareholder
ownership and financial reporting characteristics of investees. The literature finds
divergent effects of large shareholders on financial reporting quality and suggests the
importance of considering the heterogeneity of large shareholders (e.g., Cronqvist and
Fahlenbrach (2009) and Hope (2013)). I contribute to this literature by identifying
the financial reporting requirements of the large shareholder as a potential factor that
can influence the large shareholder’s effect on the financial reporting of its investee.
In particular, I find that the mechanics of the equity method (the flow-through of
affiliate income to investor income) create both an incentive and an opportunity for
earnings management.
Finally, I contribute to the ongoing debate at the FASB and International Ac-
counting Standards Board (IASB) about the appropriateness of business-model-based
accounting for financial instruments. The IASB has promulgated IFRS 9 Financial
Instruments which includes a business-model-based provision for the measurement of
financial assets; the FASB is proposing a similar provision for investments in debt
securities in its project on financial instruments.4 However, the FASB previously
stated an objective to improve and simplify the accounting for financial instruments
by requiring “all financial instruments to be measured at fair value with realized and
unrealized gains and losses recognized in the period in which they occur.”5 These
differences in the standard setters’ decisions illustrate a fundamental difference of
views about whether measurement attributes should be based on management’s in-
tended method of value realization for the items in question (the IFRS 9 position) or
4 IFRS 9 requires entities to measure financial assets at amortized cost subject to impairment if theassets meet specified criteria, including that they are “held within a business model whose objectiveis to hold assets in order to collect contractual cash flows” (para 4.2(a)).
5 FASB website, Accounting for Financial Instruments—Joint Project of the FASB and IASB.Available at http://www.fasb.org/cs/ContentServer?c=FASBContent C&pagename=FASB%2FFASBContent C%2F ProjectUpdatePage&cid=1175801889654.
6
whether the same measurement attribute should be applied to similar items regard-
less of management’s intent. The issue is also part of the FASB’s and IASB’s joint
work to develop conceptual guidance for selecting measurement attributes that sat-
isfy the objectives and qualitative characteristics of financial reporting and contribute
to the reporting of decision useful information. My results suggest that significant
influence might not be a foundation for requiring or permitting the use of a different
measurement method for investments in affiliates than other investments in mar-
ketable equity securities (which are required to be measured at fair value under U.S.
GAAP). The results might generalize to other investments in securities accounted for
under the business-model-based guidance in SFAS No. 115. For example, the results
suggest that fair value might be an appropriate measurement attribute for debt se-
curities classified as held to maturity. Even though a firm might intend to realize the
value of a debt security through the collection of cash flows, fair value measurement
might provide a similar level of information about that investment as is provided for
investments that the firm intends to sell.
This paper proceeds as follows. Chapter 2 provides a description of the equity
method of accounting. Chapter 3 summarizes my sample and data. Chapter 4
presents descriptive statistics. Chapters 5 and 6 summarize related literature, for-
mulate hypotheses, outline my research design, discuss the results of my empirical
tests, and present supplementary analyses for the value relevance and earnings man-
agement tests, respectively. Chapter 7 describes the link between the value relevance
and earnings management analyses. Chapter 8 summarizes and concludes.
7
2
The Equity Method of Accounting
In March 1971, the Accounting Principles Board issued APB 18, requiring the eq-
uity method of accounting to be used by an investor whose investment in voting stock
gives it the ability to exercise significant influence over the operating and financial
policies of an investee. APB 18 describes significant influence and specifies that an
investment of 20% or more indicates significant influence in the absence of evidence
to the contrary and an investment of less than 20% indicates that an investor does
not have significant influence unless it can be demonstrated to exist.
Under the equity method of accounting, the investor initially recognizes its in-
vestment at acquisition cost as a single line item in its balance sheet. Subsequent
measurement is based on a calculated value, rather than on a measurement attribute.
Each period, the investor recognizes its proportionate share of the affiliate’s net in-
come (loss) as income (expense) with the offsetting amount increasing (decreasing)
the investment asset balance. Dividends received from the affiliate are recognized as
a reduction in the carrying value of the investment.
In calculating the amount of income from affiliates, the investor eliminates profits
and losses arising from transactions between the investor and affiliate and accounts
8
for any difference between the acquisition cost of the investment and the investor’s
share of the underlying equity in the net assets of the affiliate as if the affiliate were a
consolidated subsidiary. For example, if the fair value of the affiliate’s property, plant
and equipment (PPE) at the time of the investor’s purchase exceeds its carrying
amount, the investor adjusts the affiliate’s income to reflect the additional deprecia-
tion expense associated with the higher value of PPE.
If an investor’s share of affiliate losses exceeds the carrying value of its investment,
the investor suspends application of the equity method and does not recognize addi-
tional losses (unless it has otherwise committed to provide financial support to the
affiliate). The investor resumes applying the equity method only after its proportion-
ate share of income exceeds any losses that were not recognized during the time the
equity method was suspended.
The investor evaluates its equity method investment (as a whole) to determine
whether an other-than-temporary impairment has occurred. The equity method in-
vestor does not separately test the affiliate’s underlying assets for impairment. If
the affiliate recognizes an impairment charge, the investor considers the effect of that
impairment on the investor’s basis difference in the assets giving rise to the affiliate’s
impairment charge.1
1 ASC 323-10-35 (based on APB 18 and EITF Issue No. 08-6, “Equity Method Investment Ac-counting Considerations) clarifies, “A series of operating losses of an investee or other factors mayindicate that a decrease in value of the investment has occurred that is other than temporary andthat shall be recognized even though the decrease in value is in excess of what would otherwise berecognized by application of the equity method. A loss in value of an investment that is other thana temporary decline shall be recognized. Evidence of a loss in value might include, but would notnecessarily be limited to, absence of an ability to recover the carrying amount of the investmentor inability of the investee to sustain an earnings capacity that would justify the carrying amountof the investment. A current fair value of an investment that is less than its carrying amount mayindicate a loss in value of the investment. However, a decline in the quoted market price below thecarrying amount or the existence of operating losses is not necessarily indicative of a loss in valuethat is other than temporary. All are factors that shall be evaluated.”
9
3
Sample and Data
I identify 283 U.S. firms (“equity method investors”) with investments in equity
securities of 414 publicly-traded firms (“affiliates”) accounted for under the equity
method at some point during the period 1993-2011.1 Although the equity method
applies to investments in both publicly-traded and private affiliates, I focus on firms
with publicly-traded affiliates because of the data required for my analyses.2 Table
3.1 summarizes the sample identification process.
I begin by identifying all U.S. firms in the Compustat annual dataset with at least
1 My study is based on U.S. firms. Although similar equity method accounting requirements existfor international firms, I focus on U.S. firms because of the availability of Schedule 13D data toassist me in identifying publicly-traded investees. I am exploring the use of the Amadeus databaseto expand my sample to European firms.
2 Equity method investors are required (by APB 18) to disclose the fair values of investments inaffiliates only when a quoted market price is available. Investments in affiliates are excluded fromthe scope of SFAS No. 107, Disclosures about Fair Value of Financial Instruments, and thereforeno fair value information is required to be disclosed for private affiliates. It is not practicable toconstruct an “as if” fair value measure of private affiliates in my sample. One possibility would beto use a price-earnings ratio. Equity method investors are required to disclose the name of eachaffiliate and percentage of ownership of common stock (ASC 323-10-50-3a). However, investors arenot required to provide summarized financial information (including net income) about affiliatesunless the investments are “material” in relation to the financial position or results of operations ofthe investor (ASC 323-10-50-3c) and often the summarized financial information presented combinesseveral affiliates.
10
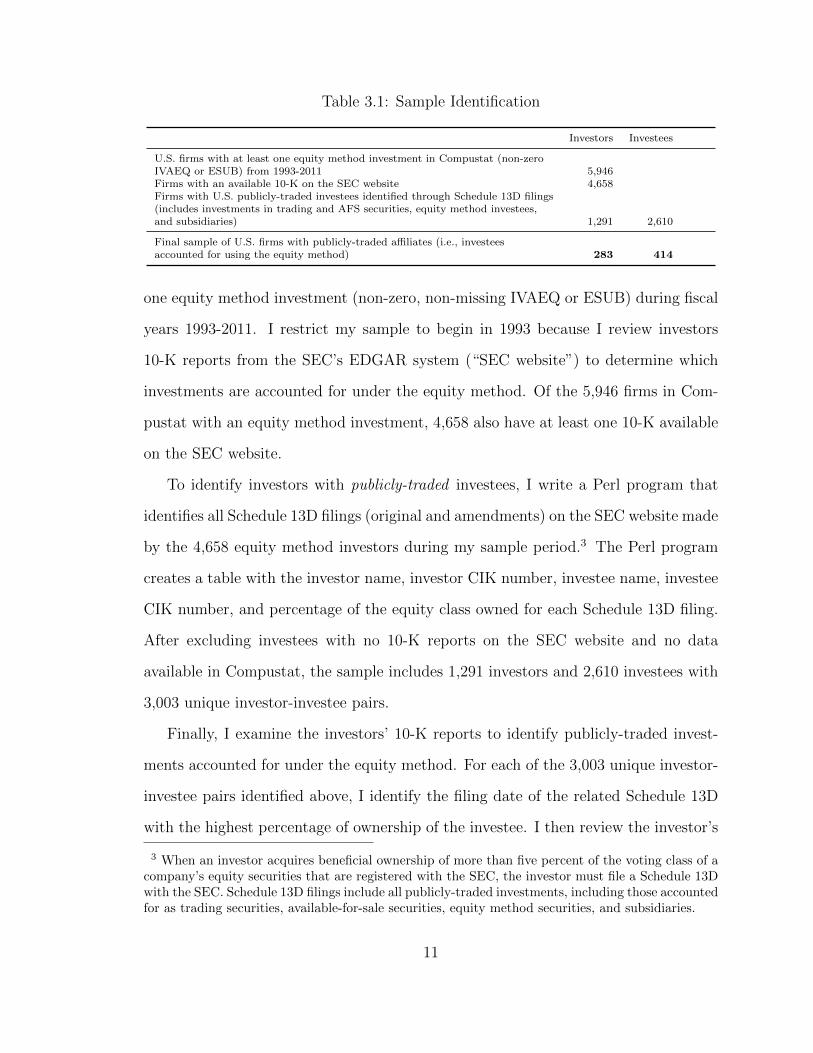
Table 3.1: Sample Identification
Investors Investees
U.S. firms with at least one equity method investment in Compustat (non-zeroIVAEQ or ESUB) from 1993-2011 5,946Firms with an available 10-K on the SEC website 4,658Firms with U.S. publicly-traded investees identified through Schedule 13D filings(includes investments in trading and AFS securities, equity method investees,and subsidiaries) 1,291 2,610
Final sample of U.S. firms with publicly-traded affiliates (i.e., investeesaccounted for using the equity method) 283 414
one equity method investment (non-zero, non-missing IVAEQ or ESUB) during fiscal
years 1993-2011. I restrict my sample to begin in 1993 because I review investors
10-K reports from the SEC’s EDGAR system (“SEC website”) to determine which
investments are accounted for under the equity method. Of the 5,946 firms in Com-
pustat with an equity method investment, 4,658 also have at least one 10-K available
on the SEC website.
To identify investors with publicly-traded investees, I write a Perl program that
identifies all Schedule 13D filings (original and amendments) on the SEC website made
by the 4,658 equity method investors during my sample period.3 The Perl program
creates a table with the investor name, investor CIK number, investee name, investee
CIK number, and percentage of the equity class owned for each Schedule 13D filing.
After excluding investees with no 10-K reports on the SEC website and no data
available in Compustat, the sample includes 1,291 investors and 2,610 investees with
3,003 unique investor-investee pairs.
Finally, I examine the investors’ 10-K reports to identify publicly-traded invest-
ments accounted for under the equity method. For each of the 3,003 unique investor-
investee pairs identified above, I identify the filing date of the related Schedule 13D
with the highest percentage of ownership of the investee. I then review the investor’s
3 When an investor acquires beneficial ownership of more than five percent of the voting class of acompany’s equity securities that are registered with the SEC, the investor must file a Schedule 13Dwith the SEC. Schedule 13D filings include all publicly-traded investments, including those accountedfor as trading securities, available-for-sale securities, equity method securities, and subsidiaries.
11

10-K report for the period including that Schedule 13D filing date. I search for “eq-
uity method”, “equity basis”, and “equity in” to identify investments accounted for
by the equity method. I determine which of those investments are publicly traded by
searching for the investees’ names using the “Company Search” feature on the SEC
website.
When I identify an investor with a publicly-traded affiliate, I examine all of that
investor’s 10-K reports available on the SEC website during my sample period to
identify any additional publicly-traded affiliates. For each publicly-traded affiliate
identified, I record the dates that the equity method began and ceased to be ap-
plied.4 After excluding affiliates with no data available in Compustat, my final sample
includes data for 283 investors and 414 affiliates during the period 1993-2011.
For each investor 10-K in which a publicly-traded affiliate is identified, I hand-
collect the following data (where disclosed) for each publicly-traded affiliate: number
of shares held, percentage of ownership, carrying value of investment in affiliate, and
income from investment in affiliate.5 APB 18 (ASC 323-10-50-3b) requires disclosure
of the aggregate value (i.e., fair value) of each identified investment in an affiliate when
a quoted market price is available. I record this value as my measure of the fair value
of an investment in a publicly-traded affiliate when it is available. However, I observe
noncompliance with this disclosure requirement in 54.43% (768 out of 1,411 firm-
years) of my sample. In those cases, I calculate the fair value of the investment in a
4 Some firms do not explicitly disclose the start and end dates of the application of the equitymethod to a particular investment. In those cases, I assume that the start date is the fiscal year-enddate of the first fiscal year in which the investment appears as an equity method investment. Iassume that the end date is the fiscal year-end date of the last fiscal year in which the investmentappears as an equity method investment. If an investment is accounted for under the equity methodbefore the start of the 1993 fiscal year, I assume that the start date is the first day of the 1993 fiscalyear. If an investment is accounted for under the equity method after the end of the 2011 fiscal year,I assume that the end date is the last day of the 2011 fiscal year.
5 If the number of shares held or percentage of ownership is not disclosed, I calculate the amountbased on disclosed information and publicly-available data. For example, if the percentage of own-ership is disclosed but the number of shares held is not, I calculate the number of shares held as thepercentage of ownership multiplied by the number of shares outstanding recorded in CRSP.
12

publicly-traded affiliate using information disclosed by the investor (either the number
of shares held in the affiliate or the percentage of shares held in the affiliate) and
publicly-available data from CRSP (the share price of the affiliate and, if necessary,
the total number of outstanding shares of the affiliate). If I cannot calculate the
fair value of an equity method investment using publicly-available data (329/1,411
firm-years), I do not estimate or impute it. I also construct a measure of income from
affiliates as if the investment in the affiliate were remeasured to fair value at each
reporting date (“fair value income”), by multiplying the number of shares held at a
reporting date by the change in the affiliate’s share price during the period.6
The additional data required for my analyses are from Compustat (accounting
data), CRSP (stock price and returns data) and the Thomson Reuters Institutional
Holdings Database (institutional ownership data). I use the institutional investor
classification data available on Brian Bushee’s website to classify institutions as tran-
sient; quasi-indexing; monitoring; and dedicated, non-independent.
6 If the equity method investment was acquired during the reporting period, I calculate fair valueincome as the number of shares held in the affiliate at the reporting date multiplied by the changein the price per share of the affiliate from the date that the investment was made to the reportingdate.
13
4
Descriptive Statistics
4.1 Variables Specific to the Equity Method
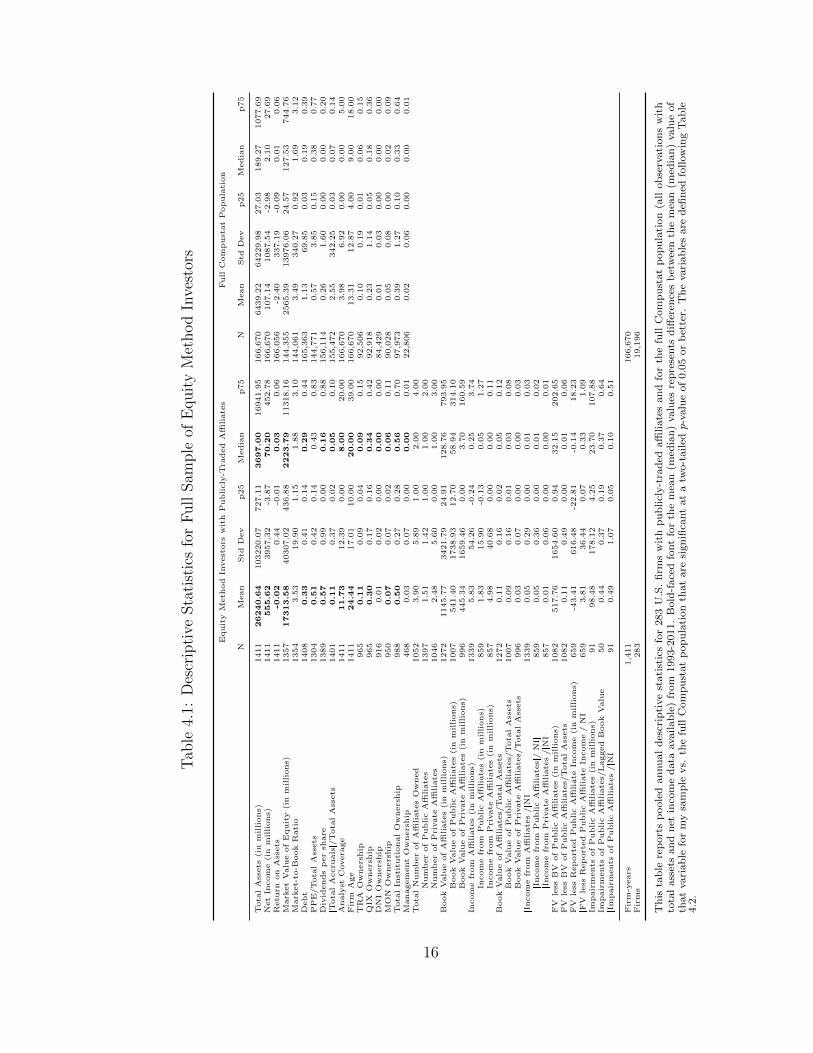
Tables 4.1 and 4.2 provide descriptive statistics for the 283 equity method investors
and 414 publicly-traded affiliates in my sample. As shown in Table 4.1, equity method
investors invest in an average (median) of 3.90 (2.00) affiliates, including an average
(median) of 1.51 (1.00) publicly-traded affiliates and 2.48 (1.00) private affiliates.1
Equity method investments comprise an average (median) of 11% (5%) of total assets,
including average (median) carrying values of investments in publicly-traded affiliates
of $541.40 million ($58.94 million) and in private affiliates of $445.34 million ($3.70
million). The absolute value of income from affiliates comprises an average (median) of
5% (1%) of the absolute value of net income, including average (median) income from
public affiliates of $1.83 million ($0.05 million) and private affiliates of $4.98 million
($0.00 million). The average (median) difference between fair value and carrying
value of publicly-traded affiliates is $517.76 million ($32.15 million). If income were
1 In an untabulated result, I find that 47.70% (135 out of 283) of the equity method investors inmy sample have both publicly-traded and private affiliates.
14
calculated by remeasuring investments in publicly-traded affiliates to fair value each
reporting period, some firms would report much lower income (25th percentile reports
decrease in income of $22.81 million) and some firms would report much higher income
(75th percentile reports increase in income of $18.23 million).
I find that 22.61% (64 out of 283) of investors and 6.45% (91 out of 1,411) of
investor firm-years in my sample report an impairment of a publicly-traded equity
method investment (untabulated). As shown in Table 4.1, for those firm-years, the
average (median) impairment totals $98.48 million ($23.70 million), which is an aver-
age (median) of 44% (37%) of the lagged carrying value of the impaired investment.2
In an untabulated investigation, I find that equity method investors do not recognize
impairments of their investments in 275 cases in which the fair value of the investment
is below its carrying value at the reporting date. The investor often states that it
believes that the decline in fair value is temporary in these cases. In 13.10% of these
cases (36/275), an impairment of the investment is recognized in a future period.
In untabulated results, I also find that 9.54% (27/283) of firms in my sample cease
applying the equity method for at least one investment because of the recognition
of losses in excess of the carrying value of the investment. This represents 4.96%
(70/1,411) of available firm-year observations.
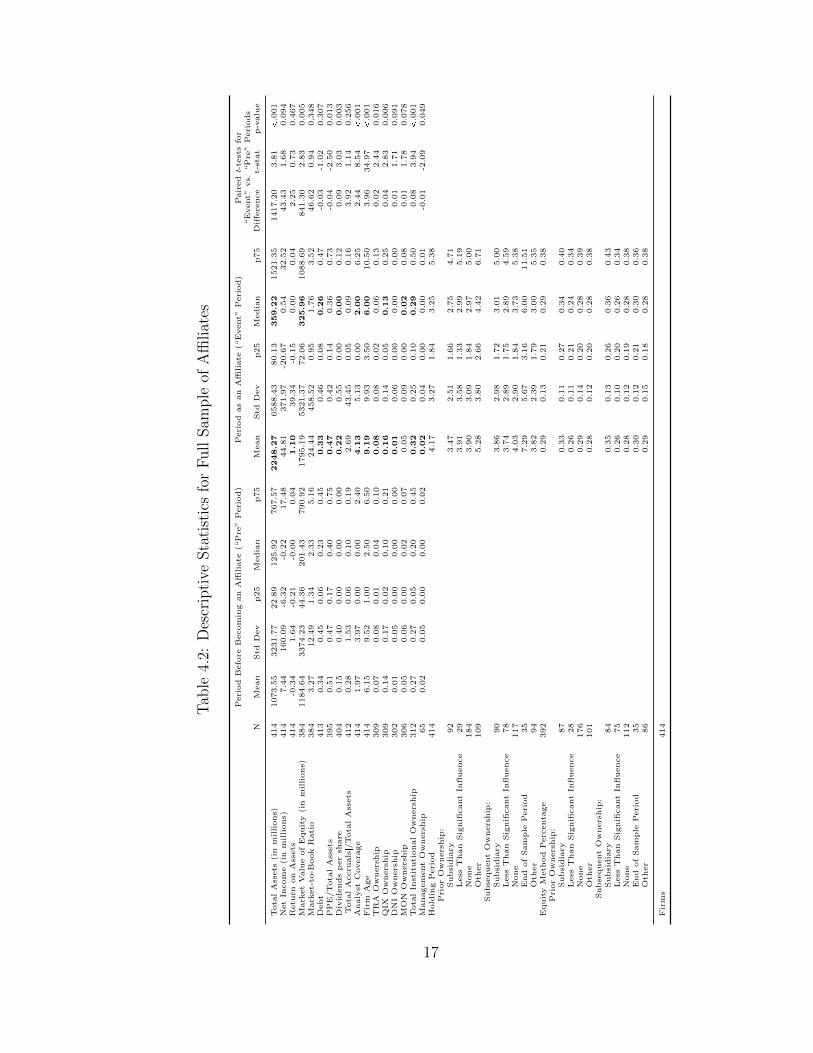
Table 4.2 documents that for my sample of 414 publicly-traded affiliates, the
average (median) equity method holding period during 1993-2011 is 4.17 years (3.25
years) and the average (median) percentage of equity method ownership is 29% (29%).
In untabulated results, I find that 83 of the 392 affiliates with data available have a
percentage of equity method ownership less than 20% and 7 of the 392 affiliates have
a percentage of equity method ownership more than 50%. This suggests that, in some
circumstances, firms “rebut” the presumption in APB 18 that significant influence
2 The number of observations for the Impairments of Public Affiliates/Lagged Book Value variableis less than 91 because the lagged book value of the affiliate that was impaired is not available in 41cases.
15
Tab
le4.
1:D
escr
ipti
veSta
tist
ics
for
Full
Sam
ple
ofE
quit
yM
ethod
Inve
stor
s
Equit
yM
eth
od
Invest
ors
wit
hP
ublicly
-Tra
ded
Affi
liate
sFull
Com
pust
at
Popula
tion
NM
ean
Std
Dev
p25
Media
np75
NM
ean
Std
Dev
p25
Media
np75
Tota
lA
ssets
(in
millions)
1411
26240.6
4103220.0
7727.1
13697.0
016941.9
5166,6
70
6439.2
264229.9
827.0
3189.2
71077.6
9N
et
Incom
e(i
nm
illions)
1411
555.6
23957.3
2-3
.87
70.2
0452.7
8166,6
70
107.1
41087.5
4-2
.98
2.1
027.6
9R
etu
rnon
Ass
ets
1411
-0.0
20.4
4-0
.01
0.0
30.0
6166,0
56
-2.4
0337.1
9-0
.09
0.0
10.0
6M
ark
et
Valu
eof
Equit
y(i
nm
illi
ons)
1357
17313.5
840307.0
2436.8
82223.7
911318.1
6144,3
55
2565.3
913976.0
624.5
7127.5
3744.7
6M
ark
et-
to-B
ook
Rati
o1354
3.5
319.9
01.1
51.8
83.1
0144,0
61
3.4
9340.2
70.9
21.6
93.1
2D
ebt
1408
0.3
30.4
10.1
40.2
90.4
4165,3
63
1.1
369.8
50.0
30.1
90.3
9P
PE
/T
ota
lA
ssets
1304
0.5
10.4
20.1
40.4
30.8
3144,7
71
0.5
73.8
50.1
50.3
80.7
7D
ivid
ends
per
share
1389
0.5
70.9
90.0
00.1
60.8
8156,1
14
0.2
61.6
00.0
00.0
00.2
0|T
ota
lA
ccru
als|/
Tota
lA
ssets
1401
0.1
10.3
70.0
20.0
50.1
0155,4
72
2.5
5342.2
50.0
30.0
70.1
4A
naly
stC
overa
ge
1411
11.7
312.3
90.0
08.0
020.0
0166,6
70
3.9
86.9
20.0
00.0
05.0
0F
irm
Age
1411
24.4
417.0
110.0
020.0
039.0
0166,6
70
13.3
112.8
74.0
09.0
018.0
0T
RA
Ow
ners
hip
965
0.1
10.0
90.0
40.0
90.1
592,5
06
0.1
00.1
90.0
10.0
60.1
5Q
IXO
wners
hip
965
0.3
00.1
70.1
60.3
40.4
292,9
18
0.2
31.1
40.0
50.1
80.3
6D
NI
Ow
ners
hip
916
0.0
10.0
20.0
00.0
00.0
084,4
29
0.0
10.0
30.0
00.0
00.0
0M
ON
Ow
ners
hip
950
0.0
70.0
70.0
20.0
60.1
190,0
28
0.0
50.0
80.0
00.0
20.0
9T
ota
lIn
stit
uti
onal
Ow
ners
hip
988
0.5
00.2
70.2
80.5
60.7
097,9
73
0.3
91.2
70.1
00.3
30.6
4M
anagem
ent
Ow
ners
hip
468
0.0
30.0
70.0
00.0
00.0
122,8
06
0.0
20.0
60.0
00.0
00.0
1T
ota
lN
um
ber
of
Affi
liate
sO
wned
1052
3.9
05.8
91.0
02.0
04.0
0N
um
ber
of
Public
Affi
liate
s1397
1.5
11.4
21.0
01.0
02.0
0N
um
ber
of
Pri
vate
Affi
liate
s1046
2.4
85.6
00.0
01.0
03.0
0B
ook
Valu
eof
Affi
liate
s(i
nm
illions)
1272
1145.7
73421.7
924.9
1128.7
6793.9
5B
ook
Valu
eof
Public
Affi
liate
s(i
nm
illi
ons)
1007
541.4
01738.9
312.7
058.9
4314.1
0B
ook
Valu
eof
Pri
vate
Affi
liate
s(i
nm
illi
ons)
996
445.3
41659.4
60.0
03.7
0160.5
9In
com
efr
om
Affi
liate
s(i
nm
illions)
1339
5.8
354.2
6-0
.24
0.2
53.7
4In
com
efr
om
Public
Affi
liate
s(i
nm
illi
ons)
859
1.8
315.9
0-0
.13
0.0
51.2
7In
com
efr
om
Pri
vate
Affi
liate
s(i
nm
illions)
857
4.9
840.6
80.0
00.0
00.1
1B
ook
Valu
eof
Affi
liate
s/T
ota
lA
ssets
1272
0.1
10.1
60.0
20.0
50.1
2B
ook
Valu
eof
Public
Affi
liate
s/T
ota
lA
ssets
1007
0.0
90.1
60.0
10.0
30.0
8B
ook
Valu
eof
Pri
vate
Affi
liate
s/T
ota
lA
ssets
996
0.0
30.0
70.0
00.0
00.0
3|I
ncom
efr
om
Affi
liate
s|/|N
I|1339
0.0
50.2
90.0
00.0
10.0
3|I
ncom
efr
om
Public
Affi
liate
s|/|N
I|859
0.0
50.3
60.0
00.0
10.0
2|I
ncom
efr
om
Pri
vate
Affi
liate
s|/|N
I|857
0.0
10.0
60.0
00.0
00.0
1F
Vle
ssB
Vof
Public
Affi
liate
s(i
nm
illions)
1082
517.7
61654.6
00.9
432.1
5202.6
5F
Vle
ssB
Vof
Public
Affi
liate
s/T
ota
lA
ssets
1082
0.1
10.4
90.0
00.0
10.0
6F
Vle
ssR
ep
ort
ed
Public
Affi
liate
Incom
e(i
nm
illions)
659
-43.4
1616.4
8-2
2.8
1-0
.14
18.2
3|F
Vle
ssR
ep
ort
ed
Public
Affi
liate
Incom
e|/|N
I|659
3.8
136.4
40.0
70.3
31.0
9Im
pair
ments
of
Public
Affi
liate
s(i
nm
illions)
91
98.4
8178.1
24.2
523.7
0107.8
8Im
pair
ments
of
Public
Affi
liate
s/L
agged
Book
Valu
e50
0.4
40.3
70.1
90.3
70.6
4|I
mpair
ments
of
Public
Affi
liate
s|/|N
I|91
0.4
91.0
70.0
50.1
00.5
1
Fir
m-y
ears
1,4
11
166,6
70
Fir
ms
283
19,1
96
Th
ista
ble
rep
ort
sp
oole
dan
nu
al
des
crip
tive
stati
stic
sfo
r283
U.S
.fi
rms
wit
hp
ub
licl
y-t
rad
edaffi
liate
san
dfo
rth
efu
llC
om
pu
stat
pop
ula
tion
(all
ob
serv
ati
on
sw
ith
tota
lass
ets
an
dn
etin
com
ed
ata
availab
le)
from
1993-2
011.
Bold
-face
dfo
nt
for
the
mea
n(m
edia
n)
valu
esre
pre
sents
diff
eren
ces
bet
wee
nth
em
ean
(med
ian
)valu
eof
that
vari
ab
lefo
rm
ysa
mp
levs.
the
full
Com
pu
stat
pop
ula
tion
that
are
sign
ifica
nt
at
atw
o-t
ailed
p-v
alu
eof
0.0
5or
bet
ter.
Th
evari
ab
les
are
defi
ned
follow
ing
Tab
le4.2
.
16
Tab
le4.
2:D
escr
ipti
veSta
tist
ics
for
Full
Sam
ple
ofA
ffiliat
es
Peri
od
Befo
reB
ecom
ing
an
Affi
liate
(“P
re”
Peri
od)
Peri
od
as
an
Affi
liate
(“E
vent”
Peri
od)
Pair
ed
t-te
sts
for
“E
vent”
vs.
“P
re”
Peri
ods
NM
ean
Std
Dev
p25
Media
np75
Mean
Std
Dev
p25
Media
np75
Diff
ere
nce
t-st
at
p-v
alu
e
Tota
lA
ssets
(in
millions)
414
1073.5
53231.7
722.8
9125.9
2767.5
72248.2
76588.4
380.1
3359.2
21521.3
51417.2
03.8
1
.001
Net
Incom
e(i
nm
illions)
414
7.4
4160.0
9-6
.32
-0.2
217.4
844.8
1371.9
7-2
0.6
70.5
432.5
243.4
31.6
80.0
94
Retu
rnon
Ass
ets
414
-0.3
41.6
4-0
.21
-0.0
00.0
41.1
039.3
4-0
.15
0.0
00.0
42.2
50.7
30.4
67
Mark
et
Valu
eof
Equit
y(i
nm
illions)
384
1184.6
43374.2
344.3
6201.4
3790.9
21795.1
95321.3
772.0
6325.9
61088.6
9841.3
02.8
30.0
05
Mark
et-
to-B
ook
Rati
o384
3.2
712.4
91.3
42.3
35.1
624.4
4458.5
20.9
51.7
63.5
246.6
20.9
40.3
48
Debt
413
0.3
40.4
50.0
60.2
30.4
50.3
30.4
60.0
80.2
60.4
7-0
.03
-1.0
20.3
07
PP
E/T
ota
lA
ssets
395
0.5
10.4
70.1
70.4
00.7
50.4
70.4
20.1
40.3
60.7
3-0
.04
-2.5
00.0
13
Div
idends
per
share
404
0.1
50.4
00.0
00.0
00.0
00.2
20.5
50.0
00.0
00.1
20.0
93.0
30.0
03
|Tota
lA
ccru
als|/
Tota
lA
ssets
412
0.2
81.5
30.0
60.1
00.1
92.6
943.4
50.0
50.0
90.1
63.9
21.1
40.2
56
Analy
stC
overa
ge
414
1.9
73.9
70.0
00.0
02.4
04.1
35.1
30.0
02.0
06.2
52.4
48.5
4
.001
Fir
mA
ge
414
6.1
59.5
21.0
02.5
06.5
09.1
99.9
33.5
06.0
010.5
03.9
634.9
7
.001
TR
AO
wners
hip
309
0.0
70.0
80.0
10.0
40.1
00.0
80.0
80.0
20.0
60.1
30.0
22.4
40.0
16
QIX
Ow
ners
hip
309
0.1
40.1
70.0
20.1
00.2
10.1
60.1
40.0
50.1
30.2
50.0
42.8
30.0
06
DN
IO
wners
hip
302
0.0
10.0
50.0
00.0
00.0
00.0
10.0
60.0
00.0
00.0
00.0
11.7
10.0
91
MO
NO
wners
hip
306
0.0
50.0
60.0
00.0
20.0
70.0
50.0
90.0
00.0
20.0
80.0
11.7
80.0
78
Tota
lIn
stit
uti
onal
Ow
ners
hip
312
0.2
70.2
70.0
50.2
00.4
50.3
20.2
50.1
00.2
90.5
00.0
83.9
4
.001
Managem
ent
Ow
ners
hip
65
0.0
20.0
50.0
00.0
00.0
20.0
20.0
40.0
00.0
00.0
1-0
.01
-2.0
90.0
49
Hold
ing
Peri
od
414
4.1
73.2
71.8
43.2
55.3
8P
rior
Ow
ners
hip
:Subsi
dia
ry92
3.4
72.5
11.6
62.7
54.7
1L
ess
Than
Sig
nifi
cant
Infl
uence
29
3.9
13.5
81.3
32.9
95.1
9N
one
184
3.9
03.0
91.8
42.9
75.0
0O
ther
109
5.2
83.8
02.6
64.4
26.7
1Subse
quent
Ow
ners
hip
:Subsi
dia
ry90
3.8
62.9
81.7
23.0
15.0
0L
ess
Than
Sig
nifi
cant
Infl
uence
78
3.7
42.8
91.7
52.8
94.5
9N
one
117
4.0
32.9
01.8
43.7
35.3
8E
nd
of
Sam
ple
Peri
od
35
7.2
95.6
73.1
66.0
011.5
1O
ther
94
3.8
22.3
91.7
93.0
05.3
5E
quit
yM
eth
od
Perc
enta
ge
392
0.2
90.1
30.2
10.2
90.3
8P
rior
Ow
ners
hip
:Subsi
dia
ry87
0.3
30.1
10.2
70.3
40.4
0L
ess
Than
Sig
nifi
cant
Infl
uence
28
0.2
60.1
10.2
10.2
40.3
4N
one
176
0.2
90.1
40.2
00.2
80.3
9O
ther
101
0.2
80.1
20.2
00.2
80.3
8Subse
quent
Ow
ners
hip
:Subsi
dia
ry84
0.3
50.1
30.2
60.3
60.4
3L
ess
Than
Sig
nifi
cant
Infl
uence
75
0.2
60.1
00.2
00.2
60.3
4N
one
112
0.2
80.1
20.1
90.2
80.3
8E
nd
of
Sam
ple
Peri
od
35
0.3
00.1
20.2
10.3
00.3
6O
ther
86
0.2
90.1
50.1
80.2
80.3
8
Fir
ms
414
17
Per
iod
Aft
erB
ecom
ing
an
Affi
liate
(“P
ost
”P
erio
d)
Pair
edt-
test
sfo
rP
air
edt-
test
sfo
r“P
ost
”vs.
“E
ven
t”P
erio
ds
“P
ost
”vs.
“P
re”
Per
iod
sM
ean
Std
Dev
p25
Med
ian
p75
Diff
eren
cet-
stat
p-v
alu
eD
iffer
ence
t-st
at
p-v
alu
e
Tota
lA
sset
s(i
nm
illion
s)3740.1
514318.7
484.4
8585.8
21934.5
21590.3
03.0
40.0
03
3536.7
02.4
80.0
14
Net
Inco
me
(in
million
s)10.4
5867.6
1-1
6.8
80.3
251.2
5-2
5.9
5-0
.42
0.6
73
35.0
70.6
80.5
00
Ret
urn
on
Ass
ets
-0.4
21.9
3-0
.16
-0.0
00.0
4-0
.15
-1.3
10.1
90
-0.2
7-1
.31
0.1
93
Mark
etV
alu
eof
Equ
ity
(in
million
s)1869.6
05423.7
852.7
6268.7
91280.1
9240.5
00.9
70.3
34
1685.5
02.7
10.0
08
Mark
et-t
o-B
ook
Rati
o4.6
531.7
50.7
81.6
32.8
41.9
40.8
90.3
73
1.4
90.6
30.5
29
Deb
t0.9
46.7
50.1
10.2
80.4
70.6
11.3
90.1
67
0.9
21.2
10.2
28
PP
E/T
ota
lA
sset
s0.5
50.6
60.1
50.4
20.8
10.0
92.2
10.0
28
0.1
11.7
00.0
91
Div
iden
ds
per
share
0.3
30.9
60.0
00.0
00.1
20.1
01.9
00.0
58
0.1
82.4
60.0
16
|Tota
lA
ccru
als|/
Tota
lA
sset
s0.5
02.3
10.0
60.1
00.1
70.2
61.7
90.0
74
0.1
11.3
70.1
73
An
aly
stC
over
age
5.2
76.6
30.0
02.5
68.0
01.1
73.5
9
.001
3.3
86.3
3
.001
Fir
mA
ge
14.3
710.7
68.0
011.0
016.0
05.3
534.3
3
.001
8.8
137.5
2
.001
TR
AO
wn
ersh
ip0.1
20.1
00.0
20.1
10.2
00.0
55.4
9
.001
0.0
95.7
7
.001
QIX
Ow
ner
ship
0.2
50.2
00.0
60.2
10.4
20.1
07.7
8
.001
0.2
06.9
2
.001
DN
IO
wn
ersh
ip0.0
00.0
20.0
00.0
00.0
0-0
.01
-2.0
90.0
38
-0.0
1-0
.88
0.3
84
MO
NO
wn
ersh
ip0.0
60.0
80.0
00.0
40.0
90.0
23.7
7
.001
0.0
21.8
90.0
65
Tota
lIn
stit
uti
on
al
Ow
ner
ship
0.4
50.3
30.1
10.4
00.7
60.1
58.0
6
.001
0.2
95.4
8
.001
Man
agem
ent
Ow
ner
ship
0.0
20.0
50.0
00.0
00.0
1-0
.00
-0.7
60.4
55
-0.0
2-1
.28
0.2
43
This
table
rep
ort
sannual
desc
ripti
ve
stati
stic
sfo
r414
U.S
.publicly
-tra
ded
firm
sfr
om
1993-2
011.
The
table
rep
ort
sse
para
tem
easu
res
for
the
peri
od
pri
or
toth
efi
rms
becom
ing
affi
liate
s(t
he
“pre
”p
eri
od),
the
peri
od
inw
hic
hth
efi
rms
are
affi
liate
s(t
he
“event”
peri
od),
and
the
peri
od
aft
er
the
firm
sare
affi
liate
s(t
he
“p
ost
”p
eri
od).
The
table
pre
sents
the
avera
ge
of
the
avera
ge
valu
es
for
each
firm
.T
hat
is,
the
avera
ge
valu
efo
ra
vari
able
iscalc
ula
ted
separa
tely
for
afi
rmover
each
peri
od
(“pre
”,
“event”
,and
“p
ost
”).
Then
the
table
pre
sents
the
avera
ges
of
these
valu
es
over
the
414
firm
sin
the
sam
ple
.T
he
table
als
opre
sents
the
resu
lts
of
pair
ed
t-te
sts
com
pari
ng
the
“event”
peri
od
toth
e“pre
”p
eri
od,
the
“p
ost
”p
eri
od
toth
e“event”
peri
od,
and
the
“p
ost
”p
eri
od
toth
e“pre
”p
eri
od.
Bold
-faced
font
for
the
mean
(media
n)
valu
es
duri
ng
the
“event”
peri
od
repre
sents
diff
ere
nces
betw
een
the
mean
(media
n)
valu
eof
that
vari
able
for
my
sam
ple
vs.
the
full
Com
pust
at
popula
tion
that
are
signifi
cant
at
atw
o-t
ailed
p-v
alu
eof
0.0
5or
bett
er.
Desc
ripti
ve
stati
stic
sfo
rth
efu
llC
om
pust
at
popula
tion
are
pre
sente
din
Table
4.1
.
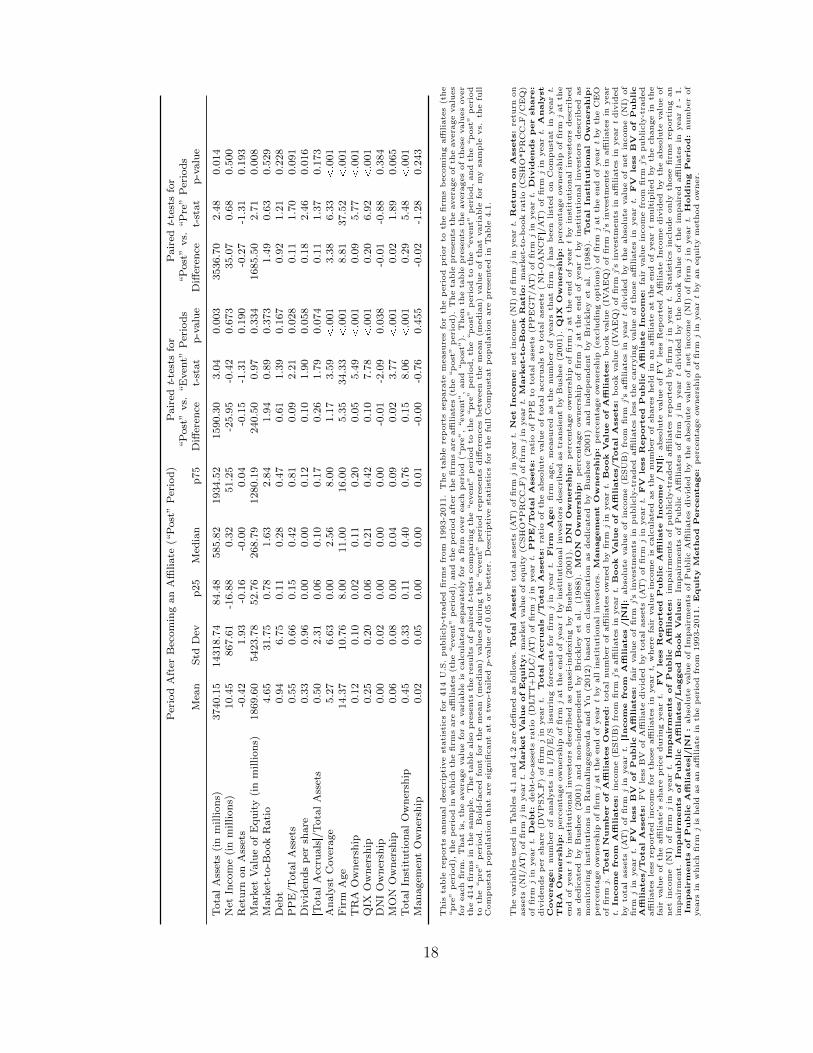
The
vari
able
suse
din
Table
s4.1
and
4.2
are
defi
ned
as
follow
s.T
otal
Assets:
tota
lass
ets
(AT
)of
firm
jin
yeart.
Net
Incom
e:
net
incom
e(N
I)of
firm
jin
yeart.
Return
on
Assets:
retu
rnon
ass
ets
(NI/
AT
)of
firm
jin
yeart.
Market
Valu
eof
Equit
y:
mark
et
valu
eof
equit
y(C
SH
O*P
RC
CF
)of
firm
jin
yeart.
Market-t
o-B
ook
Ratio
:m
ark
et-
to-b
ook
rati
o(C
SH
O*P
RC
CF
/C
EQ
)of
firm
jin
yeart.
Debt:
debt-
to-a
ssets
rati
o(D
LT
T+
DL
C/A
T)
of
firm
jin
yeart.
PP
E/T
otal
Assets:
rati
oof
PP
Eto
tota
lass
ets
(PP
EG
T/A
T)
of
firm
jin
yeart.
Div
idends
per
share:
div
idends
per
share
(DV
PSX
F)
of
firm
jin
yeart.|T
otal
Accruals|/
Total
Assets:
rati
oof
the
abso
lute
valu
eof
tota
laccru
als
toto
tal
ass
ets
(|N
I-O
AN
CF|/
AT
)of
firm
jin
yeart.
Analy
st
Coverage:
num
ber
of
analy
sts
inI/
B/E
/S
issu
ring
fore
cast
sfo
rfi
rmj
inyeart.
Fir
mA
ge:
firm
age,
measu
red
as
the
num
ber
of
years
that
firm
jhas
been
list
ed
on
Com
pust
at
inyeart.
TR
AO
wnership
:p
erc
enta
ge
ow
ners
hip
of
firm
jat
the
end
of
yeart
by
inst
ituti
onal
invest
ors
desc
rib
ed
as
transi
ent
by
Bush
ee
(2001).
QIX
Ow
nership
:p
erc
enta
ge
ow
ners
hip
of
firm
jat
the
end
of
yeart
by
inst
ituti
onal
invest
ors
desc
rib
ed
as
quasi
-indexin
gby
Bush
ee
(2001).
DN
IO
wnership
:p
erc
enta
ge
ow
ners
hip
of
firm
jat
the
end
of
yeart
by
inst
ituti
onal
invest
ors
desc
rib
ed
as
dedic
ate
dby
Bush
ee
(2001)
and
non-i
ndep
endent
by
Bri
ckle
yet
al.
(1988).
MO
NO
wnership
:p
erc
enta
ge
ow
ners
hip
of
firm
jat
the
end
of
yeart
by
inst
ituti
onal
invest
ors
desc
rib
ed
as
monit
ori
ng
inst
ituti
ons
inR
am
alingegow
da
and
Yu
(2012)
base
don
cla
ssifi
cati
on
as
dedic
ate
dby
Bush
ee
(2001)
and
indep
endent
by
Bri
ckle
yet
al.
(1988).
Total
Instit
utio
nal
Ow
nership
:p
erc
enta
ge
ow
ners
hip
of
firm
jat
the
end
of
yeart
by
all
inst
ituti
onal
invest
ors
.M
anagem
ent
Ow
nership
:p
erc
enta
ge
ow
ners
hip
(exclu
din
gopti
ons)
of
firm
jat
the
end
of
yeart
by
the
CE
Oof
firm
j.T
otal
Num
ber
of
Affi
liates
Ow
ned:
tota
lnum
ber
of
affi
liate
sow
ned
by
firm
jin
yeart.
Book
Valu
eof
Affi
liates:
book
valu
e(I
VA
EQ
)of
firm
j’s
invest
ments
inaffi
liate
sin
year
t.Incom
efr
om
Affi
liates:
incom
e(E
SU
B)
from
firm
j’s
affi
liate
sin
yeart.
Book
Valu
eof
Affi
liates/T
otal
Assets:
book
valu
e(I
VA
EQ
)of
firm
j’s
invest
ments
inaffi
liate
sin
yeart
div
ided
by
tota
lass
ets
(AT
)of
firm
jin
yeart.|I
ncom
efr
om
Affi
liates|/|N
I|:
abso
lute
valu
eof
incom
e(E
SU
B)
from
firm
j’s
affi
liate
sin
yeart
div
ided
by
the
abso
lute
valu
eof
net
incom
e(N
I)of
firm
jin
yeart.
FV
less
BV
of
Publi
cA
ffili
ates:
fair
valu
eof
firm
j’s
invest
ments
inpublicly
-tra
ded
affi
liate
sle
ssth
ecarr
yin
gvalu
eof
those
affi
liate
sin
yeart.
FV
less
BV
of
Publi
cA
ffili
ates/T
otal
Assets:
FV
less
BV
of
Affi
liate
div
ided
by
tota
lass
ets
(AT
)of
firm
jin
yeart.
FV
less
Rep
orted
Publi
cA
ffili
ate
Incom
e:
fair
valu
ein
com
efr
om
firm
j’s
publi
cly
-tra
ded
affi
liate
sle
ssre
port
ed
incom
efo
rth
ose
affi
liate
sin
yeart,
where
fair
valu
ein
com
eis
calc
ula
ted
as
the
num
ber
of
share
sheld
inan
affi
liate
at
the
end
of
yeart
mult
iplied
by
the
change
inth
efa
irvalu
eof
the
affi
liate
’ssh
are
pri
ce
duri
ng
yeart.|F
Vle
ss
Rep
orted
Publi
cA
ffili
ate
Incom
e|/|N
I|:
abso
lute
valu
eof
FV
less
Rep
ort
ed
Affi
liate
Incom
ediv
ided
by
the
abso
lute
valu
eof
net
incom
e(N
I)of
firm
jin
yeart.
Im
pair
ments
of
Publi
cA
ffili
ates:
impair
ments
of
publicly
-tra
ded
affi
liate
sre
port
ed
by
firm
jin
yeart.
Sta
tist
ics
inclu
de
only
those
firm
sre
port
ing
an
impair
ment.
Im
pair
ments
of
Publi
cA
ffili
ates/L
agged
Book
Valu
e:
Impair
ments
of
Public
Affi
liate
sof
firm
jin
yeart
div
ided
by
the
book
valu
eof
the
impair
ed
affi
liate
sin
yeart
-1.
|Im
pair
ments
of
Publi
cA
ffili
ates|/|N
I|:
abso
lute
valu
eof
Impair
ments
of
Public
Affi
liate
sdiv
ided
by
the
abso
lute
valu
eof
net
incom
e(N
I)of
firm
jin
yeart.
Hold
ing
Perio
d:
num
ber
of
years
inw
hic
hfi
rmj
isheld
as
an
affi
liate
inth
ep
eri
od
from
1993-2
011.
Equit
yM
ethod
Percentage:
perc
enta
ge
ow
ners
hip
of
firm
jin
yeart
by
an
equit
ym
eth
od
ow
ner.
18

exists when ownership is between 20-50%.
I also analyze the relationships of the investors and affiliates prior to and after
application of the equity method. The results are summarized in Table 4.3. I find that
prior to application of the equity method, the investor has no holding in the affiliate
in 44.44% of cases, a holding of less than significant influence in 7.00% of cases, and
a subsidiary-level holding in 22.22% of cases. After application of the equity method,
the investor retains no interest in the affiliate in 28.26% of cases, a holding of less
than significant influence in 18.84% of cases, and a subsidiary-level holding in 21.74%
of cases.
Table 4.3: Investors’ Prior and Subsequent Ownership of Affiliates
Investors’ Prior Ownership of Affiliates # of Affiliates % of Affiliates
Subsidiary 92 22.22Less than significant influence 29 7.00None 184 44.44Debtholder 4 0.97Held shares in another entity that was reorganized to form affiliate 13 3.14Unknown: no previous investor 10Ks available 10 2.42Unknown: could not determine from available investor 10Ks 82 19.81
Total 414
Investors’ Subsequent Ownership of Affiliates # of Affiliates % of Affiliates
Subsidiary 90 21.74Less than significant influence 78 18.84None 117 28.26Distributed to shareholders as dividend 5 1.21Bankruptcy/dissolution of affiliate 10 2.42Reorganization/transfer/exchange of shares of affiliate 8 1.93Unknown: no further investor 10Ks available (prior to end of sample period) 38 9.18Unknown: end of sample period 35 8.45Unknown: could not determine from available investor 10Ks 33 7.97
Total 414
Table 4.4 shows the distribution of equity method investors and affiliates across
industries. In untabulated results, I find that 50% (39%) of publicly-traded affiliates
are in the same 1-digit (2-digit) SIC code as their investors.
19
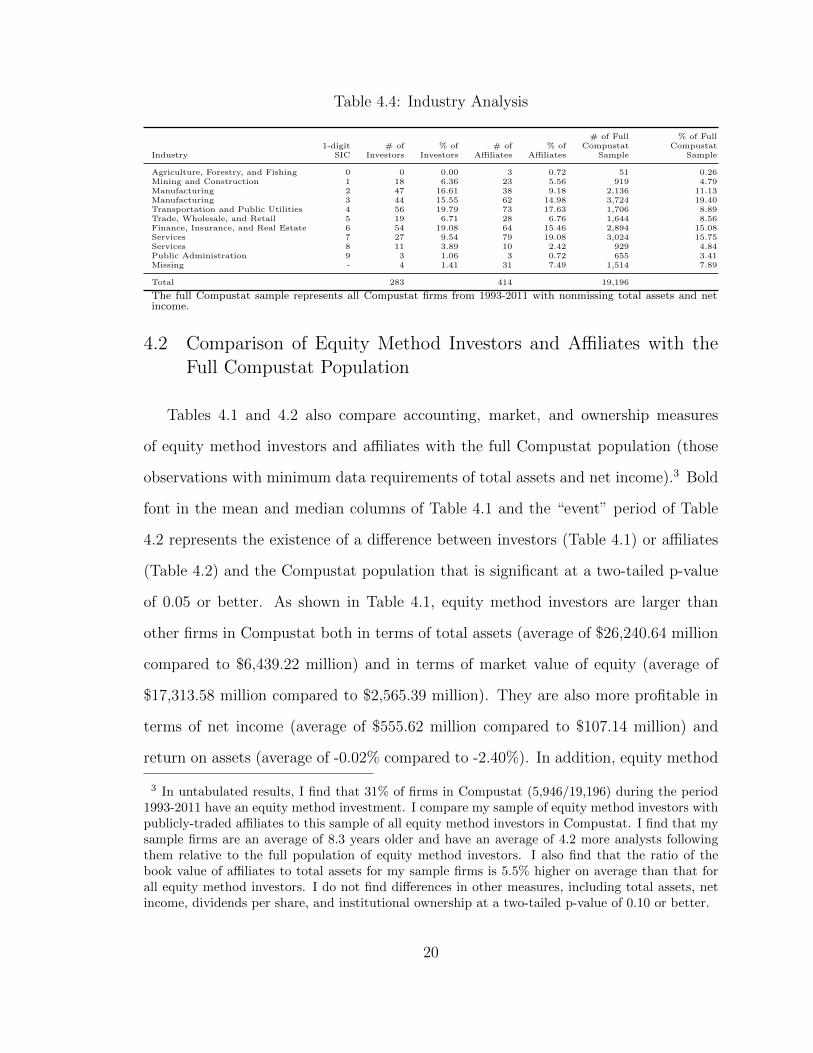
Table 4.4: Industry Analysis
# of Full % of Full1-digit # of % of # of % of Compustat Compustat
Industry SIC Investors Investors Affiliates Affiliates Sample Sample
Agriculture, Forestry, and Fishing 0 0 0.00 3 0.72 51 0.26Mining and Construction 1 18 6.36 23 5.56 919 4.79Manufacturing 2 47 16.61 38 9.18 2,136 11.13Manufacturing 3 44 15.55 62 14.98 3,724 19.40Transportation and Public Utilities 4 56 19.79 73 17.63 1,706 8.89Trade, Wholesale, and Retail 5 19 6.71 28 6.76 1,644 8.56Finance, Insurance, and Real Estate 6 54 19.08 64 15.46 2,894 15.08Services 7 27 9.54 79 19.08 3,024 15.75Services 8 11 3.89 10 2.42 929 4.84Public Administration 9 3 1.06 3 0.72 655 3.41Missing - 4 1.41 31 7.49 1,514 7.89
Total 283 414 19,196
The full Compustat sample represents all Compustat firms from 1993-2011 with nonmissing total assets and netincome.
4.2 Comparison of Equity Method Investors and Affiliates with theFull Compustat Population
Tables 4.1 and 4.2 also compare accounting, market, and ownership measures
of equity method investors and affiliates with the full Compustat population (those
observations with minimum data requirements of total assets and net income).3 Bold
font in the mean and median columns of Table 4.1 and the “event” period of Table
4.2 represents the existence of a difference between investors (Table 4.1) or affiliates
(Table 4.2) and the Compustat population that is significant at a two-tailed p-value
of 0.05 or better. As shown in Table 4.1, equity method investors are larger than
other firms in Compustat both in terms of total assets (average of $26,240.64 million
compared to $6,439.22 million) and in terms of market value of equity (average of
$17,313.58 million compared to $2,565.39 million). They are also more profitable in
terms of net income (average of $555.62 million compared to $107.14 million) and
return on assets (average of -0.02% compared to -2.40%). In addition, equity method
3 In untabulated results, I find that 31% of firms in Compustat (5,946/19,196) during the period1993-2011 have an equity method investment. I compare my sample of equity method investors withpublicly-traded affiliates to this sample of all equity method investors in Compustat. I find that mysample firms are an average of 8.3 years older and have an average of 4.2 more analysts followingthem relative to the full population of equity method investors. I also find that the ratio of thebook value of affiliates to total assets for my sample firms is 5.5% higher on average than that forall equity method investors. I do not find differences in other measures, including total assets, netincome, dividends per share, and institutional ownership at a two-tailed p-value of 0.10 or better.
20

investors have a higher institutional ownership percentage (average of 50% compared
to 39%) and more analyst following (average of 11.73 analysts compared to 3.98
analysts).
As shown in Table 4.2, although the average affiliate is smaller than the aver-
age firm in the Compustat population (total assets of $2,248.27 million compared to
$6,439.22 million), the median affiliate is larger than the median firm in the Com-
pustat population (total assets of $359.22 million compared to $189.27 million). In
addition, I find that the average affiliate is younger (firm age of 9.19 years compared
to 13.31 years), has more analyst coverage (4.13 analysts compared to 3.98 analysts),
and has less institutional ownership (32% compared to 39%) relative to the average
firm in the Compustat population.
4.3 Analysis of Changes in Firms When Held As Affiliates
Finally, Table 4.2 documents accounting, market, and ownership measures for the
period before a firm became an affiliate (the “pre” period), the period in which the
firm is an affiliate (the “event” period), and the period after the firm is an affiliate
(the “post” period). The results of paired t-tests indicate that firms become larger
in the “event” period relative to the “pre” period both in terms of total assets (an
average increase of $1,417.20 million, p-value 0.001) and market value of equity
(an average increase of $841.30 million, p-value = 0.005). This trend continues in
the “post” period, with an average additional growth in total assets of $1,590.30
million (p-value = 0.003). Firms also appear to attract more institutional ownership
and more analyst attention when they become affiliates, with institutional ownership
increasing an average of 8% (p-value 0.001) and analyst coverage increasing an
average of 2.44 analysts per firm (p-value 0.001). This trend also continues during
the “post” period, with institutional ownership increasing an average of an additional
15% (p-value 0.001) and analyst coverage increasing an average of an additional
21
1.17 analysts per firm (p-value 0.001). In contrast, firms do not exhibit changes in
net income or return on assets from the “pre” period to the “post” period (two-tailed
p-values = 0.500 and 0.193, respectively).
I examine several potential manifestations of “significant influence” by equity
method investors. First, I calculate a measure of leverage (debt-to-assets) to evaluate
whether equity method owners are prompting changes in affiliates’ financing strate-
gies. I do not find evidence supporting this type of influence (p-value = 0.307 for the
paired t-test from the “pre” period to the “event” period). I find an average decrease
of 4% in the ratio of property, plant, and equipment to total assets from the “pre”
period to the “event” period (p-value = 0.013). This might reflect changes in the
operating structure of the affiliate. I also find that dividends increase an average of
$0.09 per share (p-value = 0.003), which represents a more than 50% increase from
the average of $0.15 dividends per share in the “pre” period.4 This is consistent with
concerns expressed during the development of APB 18 that firms with “significant
influence” could affect the amounts and timing of dividend payments. However, the
upward trend in dividends per share continues during the “post” period, with an
average additional increase in dividends per share of $0.10 (p-value = 0.058), which
might indicate that the increase in dividends is due to factors other than equity
method ownership.
4 In my sample, 161 firms do not pay dividends prior to becoming affiliates. Of those 161 firms, 18begin paying dividends when they become affiliates.
22
5
Value Relevance of Information Provided by theEquity Method
5.1 Related Literature and Hypotheses Development
Debate about the appropriate accounting for investments in affiliates predates the
issuance of APB 18 over 40 years ago.1 APB 18 (para. 7) describes the concerns about
the cost method as follows (see Appendix A for a description of the cost method):
“Financial statements of an investor prepared under the cost method may not reflect
substantial changes in the affairs of an investee. Dividends included in income of
an investor for a period may be unrelated to the earnings (or losses) of an investee
for that period. For example, an investee may pay no dividends for several periods
1 Nobes (2002) describes the international development of the equity method. He states thatthe earliest uses of the equity method were in the early 1900s as a way to include subsidiariesin parents’ financial statements before the practice of consolidation was fully established. Afterconsolidated financial statements became common, some jurisdictions still required/permitted theuse of the equity method in parent company financial statements. The equity method is described asa “useful arithmetic device for preparing consolidated balance sheets when there are several layers ofsubsidiaries” (Nobes, page 19). The application of the equity method to joint ventures and affiliatesarose during the 1960s as this type of ownership structure became more common. Nobes (page 40)states that the “uses [of the equity method for inclusion of joint ventures and associates in investorstatements or consolidated statements] seem to have arisen with little theoretical justification andno prior research into their usefulness.”
23
and then pay dividends substantially in excess of the earnings of a period. Losses of
an investee of one period may be offset against earnings of another period because
the investor reports neither in results of operations at the time they are reported by
the investee. Some dividends received from an investee do not cover the carrying
costs of an investment whereas the investor’s share of the investee’s earnings more
than covers those costs. Those characteristics of the cost method may prevent an
investor from reflecting adequately the earnings related to an investment in common
stock—either cumulatively or in the appropriate periods.” However, APB 18 (para.
13) also indicates that some supported the cost method because “the investor is not
entitled to recognize earnings on its investment until a right to claim the earnings
arises, and that claim arises only to the extent dividends are declared. The investor
is considered to have no earnings on its investment unless it is in a position to control
the distribution of earnings. Likewise, an investment or an investor’s operations are
not affected by losses of an investee unless those losses indicate a loss in value of the
investment that should be recognized.”
APB 18 (paras. 10 and 12) indicates that the Accounting Principles Board be-
lieved that the equity method provides useful information to investors, stating “the
equity method is an appropriate means of recognizing increases or decreases measured
by generally accepted accounting principles in the economic resources underlying the
investments. Furthermore, the equity method of accounting more closely meets the
objectives of accrual accounting than does the cost method since the investor rec-
ognizes its share of the earnings and losses of the investee in the periods in which
they are reflected in the accounts of the investee. ... The equity method tends to be
most appropriate if an investment enables the investor to influence the operating or
financial decisions of the investee. The investor then has a degree of responsibility
for the return on its investment, and it is appropriate to include in the results of
operations of the investor its share of the earnings or losses of the investee.”
24
However, APB 18 also describes a market value method analogous to fair value
measurement and states that the market value method “is considered to meet most
closely the objective of reporting the economic consequences of holding the invest-
ment” (para. 9). At the time that APB 18 was issued, the market value method
was used only in special circumstances. APB 18 (para. 9) states, “While the Board
believes the market value method provides the best presentation of investments in
some situations, it concludes that further study is necessary before the market value
method is extended beyond current practice.” The APB did not describe the nature
of that further study.
Since the issuance of APB 18 in 1971, accounting standard setters have required
fair value measurement for certain financial assets (e.g., SFAS No. 12, Accounting
for Certain Marketable Securities (1975); SFAS No. 115, Accounting for Certain
Investments in Debt and Equity Securities (1993); SFAS No. 133, Accounting for
Derivative Instruments and Hedging Activities (1998)). It is also the stated objective
of the FASB to improve and simplify the accounting for financial instruments by
requiring “all financial instruments to be measured at fair value with realized and
unrealized gains and losses recognized in the period in which they occur.”2
However, the FASB has not required fair value measurement for investments in
affiliates.3 One possibility is that the FASB is concerned about the reliability or
difficulty of fair value measurements for investments in affiliates that are not publicly-
traded (as discussed in Chapter 4.1, many firms in my sample have private affiliates).
2 FASB website, Accounting for Financial Instruments —Joint Project of the FASB and IASB.Available at http://www.fasb.org/cs/ContentServer?c=FASBContent C&pagename=FASB%2FFASBContent C%2FProjectUpdatePage&cid=1175801889654.
3 SFAS No. 159, The Fair Value Option for Financial Assets and Financial Liabilities (2007),permits entities to measure investments otherwise accounted for under the equity method at fairvalue with realized and unrealized gains and losses recognized in earnings at each reporting date. Ihave identified one firm (out of 283) applying the fair value option to an investment that otherwisewould be accounted for under the equity method. The FASB’s 2013 Exposure Draft would removethe option to measure investments in affiliates at fair value and instead require investments inaffiliates classified as held for sale to be measured at fair value.
25
However, APB 18 and the most recent FASB discussions on the equity method did
not raise the reliability of fair value measurements as a basis for retaining the equity
method. In fact, the 2013 Exposure Draft would require fair value measurement
for investments in affiliates that an entity intends to sell regardless of whether the
affiliate is public or private. Other standards on the accounting for financial assets
issued since APB 18 tend to exclude investments in affiliates from their scopes. For
example, SFAS 115 (para. 44) states, “The Board decided to limit the scope of the
project because of its desire to expedite resolution of the problems with the current
accounting and reporting practices for investment securities. Accordingly, the Board
decided to address the accounting for only certain financial assets and not to change
the accounting for financial liabilities nor include other assets.”4 In summary, if the
continued existence of the equity method is based on the reluctance of the FASB to
require fair value measurement for financial assets without active markets, the FASB
has not articulated that as a basis.
This raises questions about whether some distinctive feature of investments in
which “significant influence” can be exercised makes fair value a less relevant mea-
surement attribute than for other investments in equity securities. The FASB’s most
recent discussions on the accounting for investments in affiliates reflect the possibility
that management’s plan for realizing value from the investment (i.e., the business
model) affects the relevance of various measurement attributes. For example, invest-
ments in affiliates might be undertaken for long-term operating or strategic purposes,
and thus, the method of value realization might differ from management’s method
for realizing value from other investments in equity securities.
4 Similarly, IFRS 9 (para. BC2.1) states, “The scope of IAS 39 has not been raised as a matterof concern during the financial crisis and, hence, the Board believes that the scope of IFRS 9should be based on that of IAS 39 until it considers the scope more generally in a later phaseof the project to replace IAS 39.” The IASB is in the preliminary stages of a research projectto fundamentally assess the usefulness of the equity method to investors and the difficulties thatpreparers face in implementing the equity method (http://www.ifrs.org/Current-Projects/IASB-Projects/equity-method-accounting/Pages/equity-method-accounting.aspx).
26
In its May 2010 Exposure Draft, Accounting for Financial Instruments and Revi-
sions to the Accounting for Derivative Instruments and Hedging Activities, the FASB
proposed restricting the application of the equity method to cases where the investor
has significant influence over the investee and the operations of the investee are
considered related to the investor’s consolidated operations (the “related operations
criterion”). If these two criteria are not satisfied, the investment would be accounted
for at fair value with all changes in fair value recognized in net income. The Basis
for Conclusions (para. BC24) explains that the FASB “believes that an entity gen-
erally should measure investments in equity securities at fair value with all changes
recognized in net income because the only way to realize gains or losses from equity
securities is to sell the equity securities. ... However, the Board decided that for those
equity investments in which the entity has significant influence over the investee and
the investee’s operations are related to those of the entity’s consolidated operations ...
the equity method of accounting would provide the most appropriate representation
of the underlying economic activity in the entity’s financial statements.”
In its redeliberations, the FASB tentatively decided not to retain the “related
operations criterion” because of concerns about interpretive and operational issues.
Instead, the FASB’s 2013 Exposure Draft would require investments in affiliates to
be accounted for under the equity method unless the investment is held for sale (i.e.,
the plan is to realize value by selling the investment). In that case, the investment
should be measured at fair value with changes in fair value included in net income.
The classification as a held-for-sale investment would be made upon the investment’s
initial qualification for the equity method and could not be changed. This proposal
reflects the notion that management’s intended method of value realization from the
investment (i.e., sale or strategic operation) should determine whether the item is
measured at fair value or using some other approach.
I investigate this issue in the context of equity method investments by examining
27
the value relevance of information provided under the equity method relative to the
value relevance of information resulting from measuring investments in affiliates at
fair value.5 To do this, I treat investments in affiliates as if they were trading securities
and measure them at fair value in each reporting period and calculate income based
on changes in the fair values of the investments.
Previous research generally supports the value relevance of balance sheet measures
of fair values for investment securities, often in banks and often not in a context where
the method of value realization is considered. For example, Barth (1994) finds that
disclosed fair values of investment securities are incrementally associated with bank
share prices for a sample of U.S. banks from 1971-1990. Three studies (Barth et
al. (1996), Eccher et al. (1996), and Nelson (1996)) examine the value relevance of
fair value disclosures made under SFAS No. 107, Disclosures about Fair Values of
Financial Instruments, by a sample of U.S. banks from 1992-1993. All three studies
find that the fair values of investment securities are incrementally informative relative
to book values in explaining bank share prices in at least some specifications. A recent
study by Song et al. (2010) confirms the value relevance of fair value measurements
for investment securities disclosed under SFAS No. 157, Fair Value Measurements,
using quarterly reports of U.S. banking firms in 2008.
Evidence on the value relevance of unrealized gains and losses on investment se-
curities is less definitive (see Rees and Shane (2012) for a summary). For example,
Dhaliwal et al. (1999) find evidence of the value relevance of unrealized gains and
losses on marketable securities only for the financial services industry. Chambers et
al. (2007) find that unrealized gains and losses on available-for-sale (AFS) securities
5 I use an interpretation of value relevance from Francis and Schipper (1999, pages 326-327): “valuerelevance is measured by the ability of financial statement information to capture or summarizeinformation, regardless of source, that affects share values.” My research design does not let medetermine whether investors use the reported information provided under the equity method ordisclosed about the fair value of affiliates. I cannot rule out that the accounting information Iexamine is merely correlated with information used by investors.
28
are positively associated with investor returns for a sample of S&P 500 firms from
1998-2003. However, the magnitude of the valuation coefficient on unrealized gains
and losses on AFS securities in their study is significantly larger than that for other
components of other comprehensive income and net income and the authors suggest
that further study is needed to explain the result.
It is not certain that the value relevance results for AFS securities will apply to
investments in affiliates because of differences in the prominence of the presentation
of information about the fair values of the investments. Hirst and Hopkins (1998)
and Maines and McDaniel (2000) find evidence that the format presentation (e.g.,
performance statement, statement of shareholders’ equity, note disclosure) of other
comprehensive income can affect how investors use that information. In the case of
investments in publicly-traded affiliates, the fair value of the investment is disclosed
in the notes (vs. presented on the face of the balance sheet for AFS securities) and
the change in the fair value is not disclosed (vs. recognized in other comprehensive
income for AFS securities). Therefore, it is possible that the value relevance results
for AFS securities would not hold for investments in publicly-traded affiliates.
Related to my study, Graham et al. (2003b) examine a sample of 55 U.S. investors
with affiliates from 1993-1997 and find that both the carrying values reported under
the equity method and the fair values of investments in publicly-traded affiliates have
a positive association with stock prices and stock returns of investor firms. The
authors also find (a) no association between income from investments in affiliates
reported under the equity method and investors’ stock prices and returns and (b) a
positive association between investors’ stock returns and the annual change in fair
value of an equity method investment less the annual change in the income from the
equity investment. Given the FASB’s recent discussions about expanding the use of
fair value measurement for investments in affiliates, I revisit these findings for a larger
sample and a longer and more recent time period. I also examine the value relevance
29
of income from investments in affiliates using fair value measurement by constructing
a “levels” measure of fair value income from affiliates by multiplying the number of
shares held at a reporting date by the change in the affiliate’s share price during the
period. Based on the balance sheet results in Graham et al. (2003b), I expect fair
value income from investments in affiliates to be incrementally value relevant relative
to information provided under the equity method.
The main focus of my value relevance analysis is on evaluating whether manage-
ment’s plan for realizing value from an investment in an affiliate affects the relevance
of fair value measurement. In particular, I separately analyze the incremental value
relevance of fair value measures for investments in publicly-traded affiliates based on
the distinguishing criteria proposed by the FASB in 2010 and 2013. The FASB’s
2010 Exposure Draft (para. BC24) suggests that the FASB “believes that an en-
tity generally should measure investments in equity securities at fair value with all
changes recognized in net income because the only way to realize gains or losses from
equity securities is to sell the equity securities ... However, the Board decided that
for those equity investments in which the entity has significant influence over the
investee and the investee’s operations are related to those of the entity’s consolidated
operations...the equity method of accounting would provide the most appropriate rep-
resentation of the underlying economic activity in the entity’s financial statements.”
This suggests that the FASB believes that there is something distinct about invest-
ments in affiliates related to the investor’s operations (“strategic” investments in
affiliates) that makes fair value a less relevant measurement attribute than for other
investments in equity securities. I operationalize this proposal by identifying invest-
ments in publicly-traded affiliates as “strategic” when the investor and affiliate have
the same 2-digit SIC code and propose the following hypothesis (in alternative form):
H1A: Fair value measures of investments in publicly-traded affiliates identified
30
as “strategic” have less incremental value relevance relative to information
provided under the equity method of accounting than fair value measures of
other investments in publicly-traded affiliates.
The FASB’s 2013 Exposure Draft revised the proposals for investments in affiliates
and would require the equity method unless the investment is classified as “held
for sale” upon the investment’s initial qualification for the equity method. In that
case, the investment would be measured at fair value with changes in fair value
included in net income. This suggests that the FASB believes that fair value is a
more relevant measurement attribute for investments in affiliates classified as held
for sale than for other investments in affiliates. I operationalize this proposal by
identifying investments in publicly-traded affiliates as “held for sale” when they are
sold either in part or in entirety after application of the equity method and propose
the following hypothesis (in alternative form):
H1B: Fair value measures of investments in publicly-traded affiliates iden-
tified as “held for sale” have more incremental value relevance relative to
information provided under the equity method of accounting than fair value
measures of other investments in publicly-traded affiliates.
In contrast, fair value might be the appropriate measurement attribute for all in-
vestments in affiliates regardless of how management intends to realize value from the
investment. For example, Leisenring et al. (2012) suggest that basing measurement
on management intent impairs comparability by permitting alternative accounting
models for the same economic phenomenon (unless management’s intended method
of value realization is considered to alter the economic characteristics of the under-
lying equity securities held). The authors suggest (page 339) that “both relevance
and comparability are achievable by basing recognition on the rights and obligations
in an item or arrangement and not on management’s plans for those rights and obli-
31
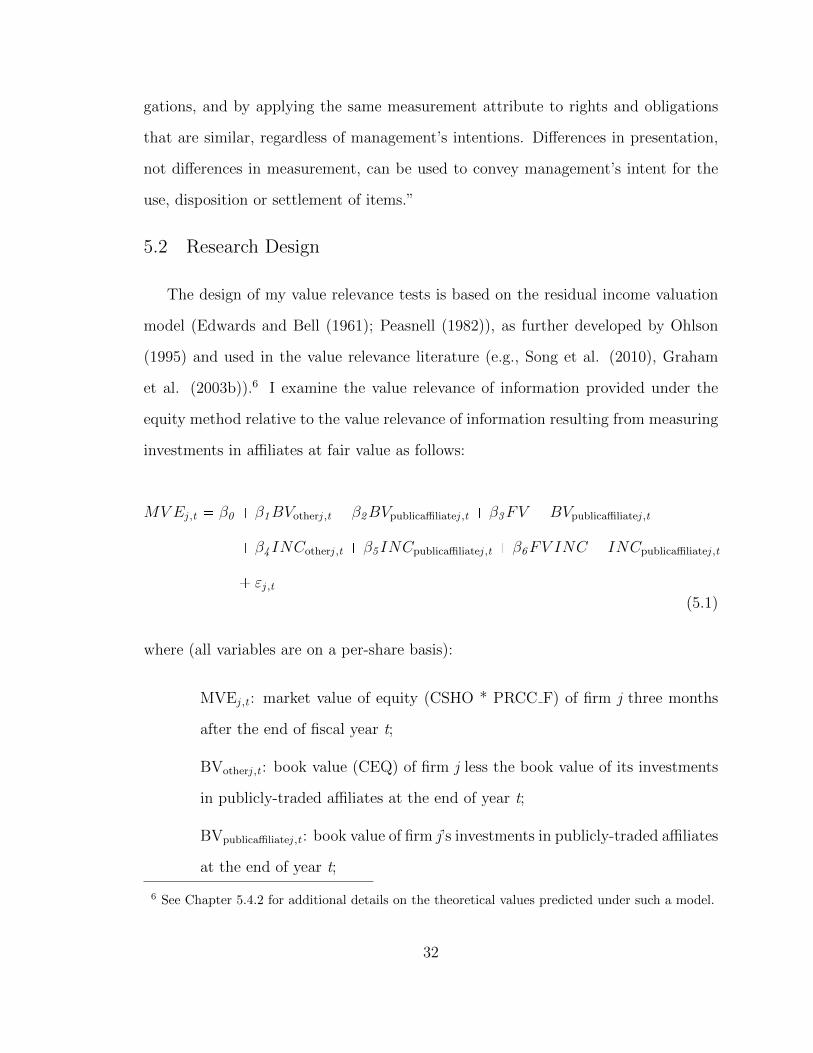
gations, and by applying the same measurement attribute to rights and obligations
that are similar, regardless of management’s intentions. Differences in presentation,
not differences in measurement, can be used to convey management’s intent for the
use, disposition or settlement of items.”
5.2 Research Design
The design of my value relevance tests is based on the residual income valuation
model (Edwards and Bell (1961); Peasnell (1982)), as further developed by Ohlson
(1995) and used in the value relevance literature (e.g., Song et al. (2010), Graham
et al. (2003b)).6 I examine the value relevance of information provided under the
equity method relative to the value relevance of information resulting from measuring
investments in affiliates at fair value as follows:
MVEj ,t � β0 � β1BVotherj ,t � β2BVpublicaffiliatej ,t � β3FV �BVpublicaffiliatej ,t
� β4 INCotherj ,t � β5 INCpublicaffiliatej ,t � β6FV INC � INCpublicaffiliatej ,t
� εj ,t(5.1)
where (all variables are on a per-share basis):
MVEj ,t : market value of equity (CSHO * PRCC F) of firm j three months
after the end of fiscal year t;
BVotherj ,t : book value (CEQ) of firm j less the book value of its investments
in publicly-traded affiliates at the end of year t;
BVpublicaffiliatej ,t : book value of firm j’s investments in publicly-traded affiliates
at the end of year t;
6 See Chapter 5.4.2 for additional details on the theoretical values predicted under such a model.
32
FV-BVpublicaffiliatej ,t : fair value less book value of investments in publicly-
traded affiliates of firm j at the end of year t;
INCotherj ,t : income before extraordinary items (IB) less reported income from
publicly-traded affiliates of firm j in year t;
INCpublicaffiliatej ,t : reported income from publicly-traded affiliates of firm j in
year t; and
FVINC-INCpublicaffiliatej ,t : fair value income less reported income of publicly-
traded affiliates of firm j in year t, where the fair value income of an affiliate
is calculated as the number of shares held in the affiliate at the end of year t
multiplied by the change in the price per share of the affiliate from the end
of year t - 1 to the end of year t.
I scale all variables by number of shares outstanding as Barth and Clinch (2009) show
that this deflator generally performs better than other deflators in mitigating scale
effects in this type of regression.
I am interested in the value relevance of information provided by the equity
method, captured by β2 and β5. A positive β2 (β5) indicates that the balance sheet
(income statement) information about investments in affiliates is associated with in-
vestors’ share prices. I am also interested in whether fair value measurement of invest-
ments in affiliates is incrementally value relevant relative to the information provided
under the equity method, captured by β3 and β6. A positive β3 (β6) indicates that the
balance sheet (income statement) measurement of affiliates at fair value has an incre-
mental association with investors’ share prices relative to the carrying value (income)
derived under the equity method.
In addition, I examine whether the incremental value relevance of fair value mea-
sures of investments in affiliates depends on the investor’s intended method of realizing
the value from an investment. In particular, I examine the incremental value rele-
33
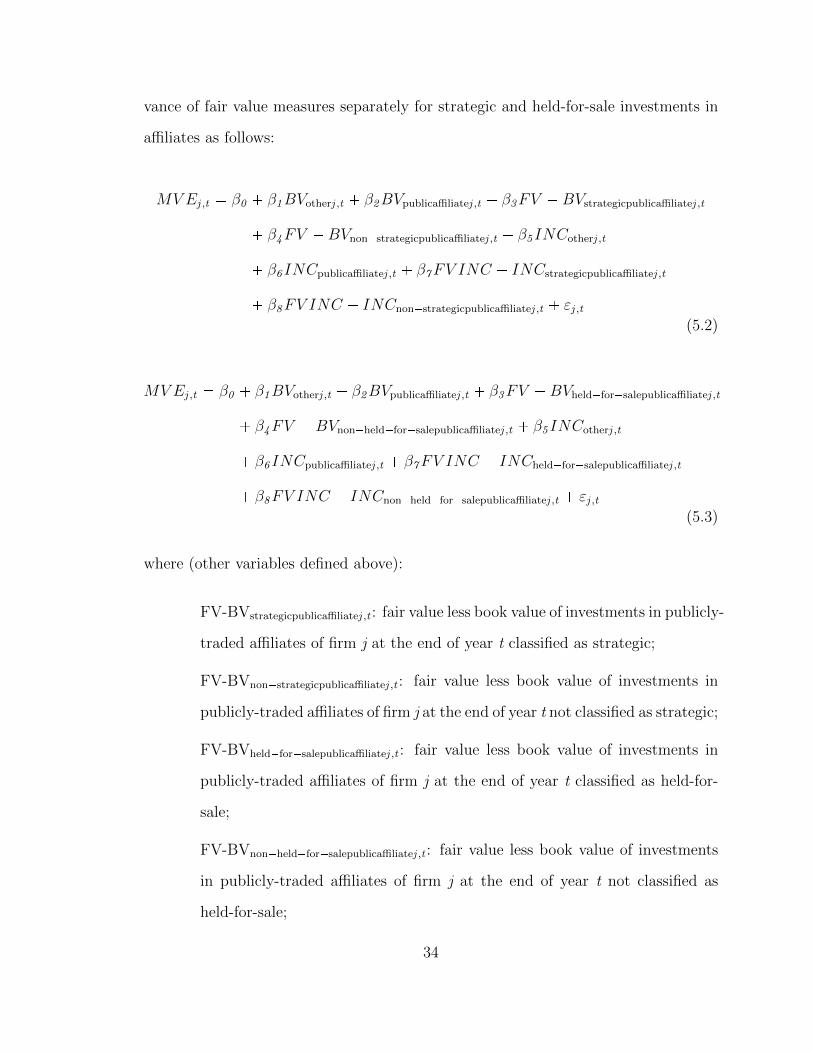
vance of fair value measures separately for strategic and held-for-sale investments in
affiliates as follows:
MVEj ,t � β0 � β1BVotherj ,t � β2BVpublicaffiliatej ,t � β3FV �BVstrategicpublicaffiliatej ,t
� β4FV �BVnon�strategicpublicaffiliatej ,t � β5 INCotherj ,t
� β6 INCpublicaffiliatej ,t � β7FV INC � INCstrategicpublicaffiliatej ,t
� β8FV INC � INCnon�strategicpublicaffiliatej ,t � εj ,t(5.2)
MVEj ,t � β0 � β1BVotherj ,t � β2BVpublicaffiliatej ,t � β3FV �BVheld�for�salepublicaffiliatej ,t
� β4FV �BVnon�held�for�salepublicaffiliatej ,t � β5 INCotherj ,t
� β6 INCpublicaffiliatej ,t � β7FV INC � INCheld�for�salepublicaffiliatej ,t
� β8FV INC � INCnon�held�for�salepublicaffiliatej ,t � εj ,t(5.3)
where (other variables defined above):
FV-BVstrategicpublicaffiliatej ,t : fair value less book value of investments in publicly-
traded affiliates of firm j at the end of year t classified as strategic;
FV-BVnon�strategicpublicaffiliatej ,t : fair value less book value of investments in
publicly-traded affiliates of firm j at the end of year t not classified as strategic;
FV-BVheld�for�salepublicaffiliatej ,t : fair value less book value of investments in
publicly-traded affiliates of firm j at the end of year t classified as held-for-
sale;
FV-BVnon�held�for�salepublicaffiliatej ,t : fair value less book value of investments
in publicly-traded affiliates of firm j at the end of year t not classified as
held-for-sale;
34

FVINC-INCstrategicpublicaffiliatej ,t : fair value income less reported income of
publicly-traded affiliates of firm j in year t classified as strategic;
FVINC-INCnon�strategicpublicaffiliatej ,t : fair value income less reported income of
publicly-traded affiliates of firm j in year t not classified as strategic;
FVINC-INCheld�for�salepublicaffiliatej ,t : fair value income less reported income of
publicly-traded affiliates of firm j in year t classified as held-for-sale;
FVINC-INCnon�held�for�salepublicaffiliatej ,t : fair value income less reported in-
come of publicly-traded affiliates of firm j in year t not classified as held-for-
sale;
As noted in Chapter 5.1, I identify an affiliate as “strategic” when the investor
and affiliate have the same 2-digit SIC code. I identify an affiliate as “held for sale”
when it is sold either in part or in entirety after application of the equity method.
In this analysis, I am interested in the incremental value relevance of fair value
measures of investments in affiliates, both on the balance sheet (β3-β4) and on the
income statement (β7-β8). A positive coefficient indicates that the balance sheet (in-
come statement) measurement of affiliates at fair value has an incremental association
with investors’ share prices relative to the carrying value (income) derived under the
equity method. I am also interested in comparing the relative magnitudes of β3-β4
and β7-β8, respectively.
5.3 Empirical Results
I test the value relevance of information provided under the equity method and the
incremental value relevance of fair value measures of investments in publicly-traded
affiliates by estimating Equation 5.1 using pooled OLS regression for all firm-years
from 1993-2011 for the 221 equity method investors in my sample with the required
data available. I winsorize all variables at the 1st and 99th percentiles and include
35
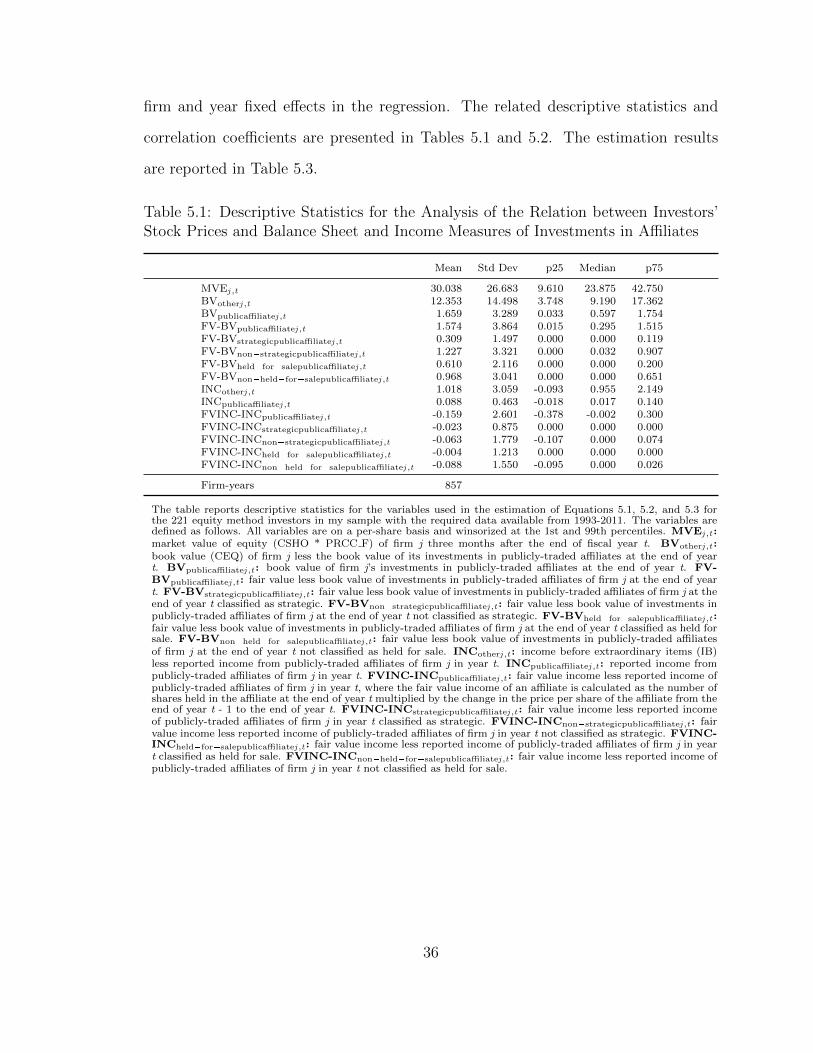
firm and year fixed effects in the regression. The related descriptive statistics and
correlation coefficients are presented in Tables 5.1 and 5.2. The estimation results
are reported in Table 5.3.
Table 5.1: Descriptive Statistics for the Analysis of the Relation between Investors’Stock Prices and Balance Sheet and Income Measures of Investments in Affiliates
Mean Std Dev p25 Median p75
MVEj ,t 30.038 26.683 9.610 23.875 42.750BVotherj ,t 12.353 14.498 3.748 9.190 17.362BVpublicaffiliatej ,t 1.659 3.289 0.033 0.597 1.754FV-BVpublicaffiliatej ,t 1.574 3.864 0.015 0.295 1.515FV-BVstrategicpublicaffiliatej ,t 0.309 1.497 0.000 0.000 0.119FV-BVnon�strategicpublicaffiliatej ,t 1.227 3.321 0.000 0.032 0.907FV-BVheld�for�salepublicaffiliatej ,t 0.610 2.116 0.000 0.000 0.200FV-BVnon�held�for�salepublicaffiliatej ,t 0.968 3.041 0.000 0.000 0.651INCotherj ,t 1.018 3.059 -0.093 0.955 2.149INCpublicaffiliatej ,t 0.088 0.463 -0.018 0.017 0.140FVINC-INCpublicaffiliatej ,t -0.159 2.601 -0.378 -0.002 0.300FVINC-INCstrategicpublicaffiliatej ,t -0.023 0.875 0.000 0.000 0.000FVINC-INCnon�strategicpublicaffiliatej ,t -0.063 1.779 -0.107 0.000 0.074FVINC-INCheld�for�salepublicaffiliatej ,t -0.004 1.213 0.000 0.000 0.000FVINC-INCnon�held�for�salepublicaffiliatej ,t -0.088 1.550 -0.095 0.000 0.026
Firm-years 857
The table reports descriptive statistics for the variables used in the estimation of Equations 5.1, 5.2, and 5.3 forthe 221 equity method investors in my sample with the required data available from 1993-2011. The variables aredefined as follows. All variables are on a per-share basis and winsorized at the 1st and 99th percentiles. MVEj ,t :market value of equity (CSHO * PRCC F) of firm j three months after the end of fiscal year t. BVotherj ,t :book value (CEQ) of firm j less the book value of its investments in publicly-traded affiliates at the end of yeart. BVpublicaffiliatej ,t : book value of firm j’s investments in publicly-traded affiliates at the end of year t. FV-BVpublicaffiliatej ,t : fair value less book value of investments in publicly-traded affiliates of firm j at the end of yeart. FV-BVstrategicpublicaffiliatej ,t : fair value less book value of investments in publicly-traded affiliates of firm j at theend of year t classified as strategic. FV-BVnon�strategicpublicaffiliatej ,t : fair value less book value of investments inpublicly-traded affiliates of firm j at the end of year t not classified as strategic. FV-BVheld�for�salepublicaffiliatej ,t :fair value less book value of investments in publicly-traded affiliates of firm j at the end of year t classified as held forsale. FV-BVnon�held�for�salepublicaffiliatej ,t : fair value less book value of investments in publicly-traded affiliatesof firm j at the end of year t not classified as held for sale. INCotherj ,t : income before extraordinary items (IB)less reported income from publicly-traded affiliates of firm j in year t. INCpublicaffiliatej ,t : reported income frompublicly-traded affiliates of firm j in year t. FVINC-INCpublicaffiliatej ,t : fair value income less reported income ofpublicly-traded affiliates of firm j in year t, where the fair value income of an affiliate is calculated as the number ofshares held in the affiliate at the end of year t multiplied by the change in the price per share of the affiliate from theend of year t - 1 to the end of year t. FVINC-INCstrategicpublicaffiliatej ,t : fair value income less reported incomeof publicly-traded affiliates of firm j in year t classified as strategic. FVINC-INCnon�strategicpublicaffiliatej ,t : fairvalue income less reported income of publicly-traded affiliates of firm j in year t not classified as strategic. FVINC-INCheld�for�salepublicaffiliatej ,t : fair value income less reported income of publicly-traded affiliates of firm j in yeart classified as held for sale. FVINC-INCnon�held�for�salepublicaffiliatej ,t : fair value income less reported income ofpublicly-traded affiliates of firm j in year t not classified as held for sale.
36
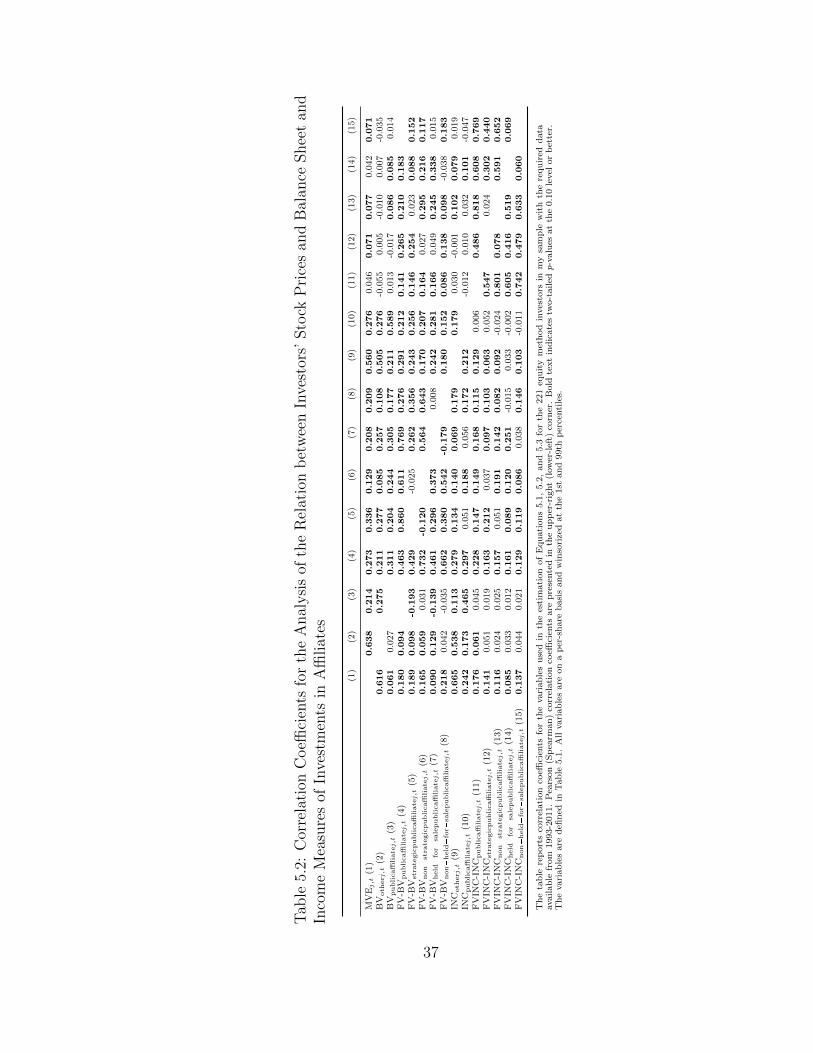
Tab
le5.
2:C
orre
lati
onC
oeffi
cien
tsfo
rth
eA
nal
ysi
sof
the
Rel
atio
nb
etw
een
Inve
stor
s’Sto
ckP
rice
san
dB
alan
ceShee
tan
dIn
com
eM
easu
res
ofIn
vest
men
tsin
Affi
liat
es
(1)
(2)
(3)
(4)
(5)
(6)
(7)
(8)
(9)
(10)
(11)
(12)
(13)
(14)
(15)
MV
Ej,t
(1)
0.638
0.214
0.273
0.336
0.129
0.208
0.209
0.560
0.276
0.0
46
0.071
0.077
0.0
42
0.071
BV
oth
erj,t
(2)
0.616
0.275
0.211
0.277
0.085
0.257
0.108
0.505
0.276
-0.0
55
0.0
05
-0.0
10
0.0
07
-0.0
35
BV
publicaffi
liate
j,t
(3)
0.061
0.0
27
0.311
0.204
0.244
0.305
0.177
0.211
0.589
0.0
13
-0.0
17
0.086
0.085
0.0
14
FV
-BV
publicaffi
liate
j,t
(4)
0.180
0.094
0.463
0.860
0.611
0.769
0.276
0.291
0.212
0.141
0.265
0.210
0.183
FV
-BV
stra
tegic
publicaffi
liate
j,t
(5)
0.189
0.098
-0.193
0.429
-0.0
25
0.262
0.356
0.243
0.256
0.146
0.254
0.0
23
0.088
0.152
FV
-BV
non�
stra
tegic
publicaffi
liate
j,t
(6)
0.165
0.059
0.0
31
0.732
-0.120
0.564
0.643
0.170
0.207
0.164
0.0
27
0.295
0.216
0.117
FV
-BV
held�
for�
sale
publicaffi
liate
j,t
(7)
0.090
0.129
-0.139
0.461
0.296
0.373
0.0
08
0.242
0.281
0.166
0.0
49
0.245
0.338
0.0
15
FV
-BV
non�
held�
for�
sale
publicaffi
liate
j,t
(8)
0.218
0.0
42
-0.0
35
0.662
0.380
0.542
-0.179
0.180
0.152
0.086
0.138
0.098
-0.0
38
0.183
INC
oth
erj,t
(9)
0.665
0.538
0.113
0.279
0.134
0.140
0.069
0.179
0.179
0.0
30
-0.0
01
0.102
0.079
0.0
19
INC
publicaffi
liate
j,t
(10)
0.242
0.173
0.465
0.297
0.0
51
0.188
0.0
56
0.172
0.212
-0.0
12
0.0
10
0.0
32
0.101
-0.0
47
FV
INC
-IN
Cpublicaffi
liate
j,t
(11)
0.176
0.061
0.0
45
0.228
0.147
0.149
0.168
0.115
0.129
0.0
06
0.486
0.818
0.608
0.769
FV
INC
-IN
Cst
rate
gic
publicaffi
liate
j,t
(12)
0.141
0.0
51
0.0
19
0.163
0.212
0.0
37
0.097
0.103
0.063
0.0
52
0.547
0.0
24
0.302
0.440
FV
INC
-IN
Cnon�
stra
tegic
publicaffi
liate
j,t
(13)
0.116
0.0
24
0.0
25
0.157
0.0
51
0.191
0.142
0.082
0.092
-0.0
24
0.801
0.078
0.591
0.652
FV
INC
-IN
Cheld�
for�
sale
publicaffi
liate
j,t
(14)
0.085
0.0
33
0.0
12
0.161
0.089
0.120
0.251
-0.0
15
0.0
33
-0.0
02
0.605
0.416
0.519
0.069
FV
INC
-IN
Cnon�
held�
for�
sale
publicaffi
liate
j,t
(15)
0.137
0.0
44
0.0
21
0.129
0.119
0.086
0.0
38
0.146
0.103
-0.0
11
0.742
0.479
0.633
0.060
Th
eta
ble
rep
ort
sco
rrel
ati
on
coeffi
cien
tsfo
rth
evari
ab
les
use
din
the
esti
mati
on
of
Equ
ati
on
s5.1
,5.2
,an
d5.3
for
the
221
equ
ity
met
hod
inves
tors
inm
ysa
mp
lew
ith
the
requ
ired
data
avail
ab
lefr
om
1993-2
011.
Pea
rson
(Sp
earm
an
)co
rrel
ati
on
coeffi
cien
tsare
pre
sente
din
the
up
per
-rig
ht
(low
er-l
eft)
corn
er.
Bold
text
ind
icate
stw
o-t
ail
edp-v
alu
esat
the
0.1
0le
vel
or
bet
ter.
Th
evari
ab
les
are
defi
ned
inT
ab
le5.1
.A
llvari
ab
les
are
on
ap
er-s
hare
basi
san
dw
inso
rize
dat
the
1st
an
d99th
per
centi
les.
37
The correlation coefficients presented in Table 5.2 indicate a positive univariate
correlation between investors’ market value of equity and both the carrying value of
investments in publicly-traded affiliates reported under the equity method [Spearman
(Pearson) coefficient = 0.061 (0.214)] and the difference between fair value and book
value of investments in publicly-traded affiliates [Spearman (Pearson) coefficient =
0.180 (0.273)]. This provides preliminary confirmation of the results from Graham et
al. (2003b). There is also a positive univariate correlation between investors’ market
value of equity and both income from publicly-traded affiliates reported under the
equity method [Spearman (Pearson) coefficient = 0.242 (0.276)] and the difference
between fair value and reported income from publicly-traded affiliates [Spearman
(Pearson) coefficient = 0.176 (0.046)]. This provides preliminary evidence supporting
the incremental value relevance of fair value measures of income from affiliates relative
to the equity method. There is also a positive correlation between reported income
from affiliates and investors’ other income [Spearman (Pearson) coefficient = 0.212
(0.179)], which might be due to similarities in the industries of some investors and
affiliates.
Regression (1) in Table 5.3 presents results of the multivariate regression anal-
ysis. Turning first to the balance sheet measures for investments in affiliates, the
coefficient on the carrying value of investments in publicly-traded affiliates under the
equity method, BVpublicaffiliatej ,t , is positive (β2 = 1.113, t-statistic = 3.673).7 The
coefficient on FV-BVpublicaffiliatej ,t is also positive (β3 = 0.712, t-statistic = 3.726).
The coefficient on income from publicly-traded affiliates reported under the equity
method, INCpublicaffiliatej ,t , is not distinguishable from zero (β5 = 2.132, t-statistic =
1.591). These results are consistent with the findings in Graham et al. (2003b), for a
7 Unless otherwise indicated, the empirical results discussed in Chapters 5.3 and 6.3 have two-tailedp-values of 0.10 or better.
38

smaller sample (55 firms) and shorter time period (1993-1997).8 I also find evidence
supporting the incremental value relevance of fair value measures of income from
publicly-traded affiliates. In particular, the coefficient on FVINC-INCpublicaffiliatej ,t is
positive (β6 = 0.396, t-statistic = 2.186).
I then extend this analysis to examine whether the incremental value relevance
of fair value measures of investments in affiliates depends on the investor’s intended
method of realizing the value from an investment. I estimate Equation 5.2 identifying
investments in affiliates as either strategic or non-strategic. Regression (2) in Table
5.3 presents the results. The coefficients on FV-BVstrategicpublicaffiliatej ,t (β3 = 1.293, t-
statistic = 2.530) and FVINC-INCstrategicpublicaffiliatej ,t (β7 = 1.420, t-statistic = 2.482)
are positive. In addition, tests of the equality of these coefficients with the related
coefficients for non-strategic affiliates reveal that they are not statistically different
from one another (p-value of 0.1626 for test of β3 = β4 and p-value of 0.1021 for
test of β7 = β8). I then estimate Equation 5.3 identifying investments in affiliates
as either held-for-sale or non-held-for-sale. Regression (3) in Table 5.3 presents the
results. The coefficient on FV-BVheld�for�salepublicaffiliatej ,t (β3 = 0.794, t-statistic =
2.443) is positive, but the coefficient on FVINC-INCheld�for�salepublicaffiliatej ,t (β7 =
0.472, t-statistic = 1.178) is indistinguishable from zero. Tests of the equality of
these coefficients with the related coefficients for non-held-for-sale affiliates reveal
that they are not statistically different from one another (p-value of 0.9986 for test
of β3 = β4 and p-value of 0.7761 for test of β7 = β8).
8 The finding of an insignificant coefficient on income reported under the equity method mightbe due to a lack of power. In untabulated results, I estimate Equation 5.1 for the full Compustatpopulation of equity method investors (non-zero IVAEQ or ESUB) from 1993-2011, excluding theFV-BVpublicaffiliatej ,t and FVINC-INCpublicaffiliatej ,t terms. I find that the coefficient on INCaffiliatej ,t
(β5 = 0.648, t-statistic = 8.500) is positive.
39

Tab
le5.
3:R
elat
ion
bet
wee
nIn
vest
ors’
Sto
ckP
rice
san
dB
alan
ceShee
tan
dIn
com
eM
easu
res
ofIn
vest
men
tsin
Affi
liat
es
MVE
j,t�β0�β1BVotherj,t�β2BVpublicaffilia
tej,t�β3FV�BVpublicaffilia
tej,t�β4INC
otherj,t�β5INC
publicaffilia
tej,t
�β6FVINC�INC
publicaffilia
tej,t�εj,t
(5.1
)
MVE
j,t�β0�β1BVotherj,t�β2BVpublicaffilia
tej,t�β3FV�BVstrategic
publicaffilia
tej,t�β4FV�BVnon�
strategic
publicaffilia
tej,t�β5INC
otherj,t
�β6INC
publicaffilia
tej,t�β7FVINC�INC
strategic
publicaffilia
tej,t�β8FVINC�INC
non�
strategic
publicaffilia
tej,t�εj,t
(5.2
)
MVE
j,t�β0�β1BVotherj,t�β2BVpublicaffilia
tej,t�β3FV�BVheld�
for�
sale
publicaffilia
tej,t�β4FV�BVnon�
held�
for�
sale
publicaffilia
tej,t�β5INC
otherj,t
�β6INC
publicaffilia
tej,t�β7FVINC�INC
held�
for�
sale
publicaffilia
tej,t�β8FVINC�INC
non�
held�
for�
sale
publicaffilia
tej,t�εj,t
(5.3
)
(1)
(2)
(3)
Dep
endent
vari
able
=M
VE
j,t
Dep
endent
vari
able
=M
VE
j,t
Dep
endent
vari
able
=M
VE
j,t
Coeffi
cie
nt
t-valu
eC
oeffi
cie
nt
t-valu
eC
oeffi
cie
nt
t-valu
e
BV
otherj,t
0.7
74���
10.0
92
0.7
66���
10.0
07
0.7
60���
9.8
36
BV
publicaffilia
tej,t
1.1
13���
3.6
73
1.1
90���
3.9
21
1.0
88���
3.6
15
FV
-BV
publicaffilia
tej,t
0.7
12���
3.7
26
FV
-BV
strategic
publicaffilia
tej,t
1.2
93��
2.5
30
FV
-BV
non�
strategic
publicaffilia
tej,t
0.5
61���
2.6
36
FV
-BV
held�
for�
sale
publicaffilia
tej,t
0.7
94��
2.4
43
FV
-BV
non�
held�
for�
sale
publicaffilia
tej,t
0.7
93���
3.2
05
INC
otherj,t
0.8
11���
4.2
85
0.7
89���
4.1
21
0.7
94���
4.1
90
INC
publicaffilia
tej,t
2.1
32
1.5
91
1.9
22
1.4
32
2.1
02
1.5
61
FV
INC
-IN
Cpublicaffilia
tej,t
0.3
96��
2.1
86
FV
INC
-IN
Cstrategic
publicaffilia
tej,t
1.4
20��
2.4
82
FV
INC
-IN
Cnon�
strategic
publicaffilia
tej,t
0.4
13
1.5
77
FV
INC
-IN
Cheld�
for�
sale
publicaffilia
tej,t
0.4
72
1.1
78
FV
INC
-IN
Cnon�
held�
for�
sale
publicaffilia
tej,t
0.6
15��
2.0
60
Inte
rcept
14.4
08���
5.5
60
14.7
49���
5.7
08
14.6
00���
5.6
41
Year
fixed
eff
ects
Inclu
ded
Inclu
ded
Inclu
ded
Fir
mfixed
eff
ects
Inclu
ded
Inclu
ded
Inclu
ded
Fir
m-y
ears
857
857
857
Adju
stedR
20.8
28
0.8
30
0.8
29
Test
sof
Equality
of
Coeffi
cie
nts
:p-v
alu
e
FV
-BV
strategic
publicaffilia
tej,t
=F
V-B
Vnon�
strategic
publicaffilia
tej,t
.1626
FV
-BV
held�
for�
sale
publicaffilia
tej,t
=F
V-B
Vnon�
held�
for�
sale
publicaffilia
tej,t
.9986
FV
INC
-IN
Cstrategic
publicaffilia
tej,t
=F
VIN
C-I
NC
non�
strategic
publicaffilia
tej,t
.1021
FV
INC
-IN
Cheld�
for�
sale
publicaffilia
tej,t
=F
VIN
C-I
NC
non�
held�
for�
sale
publicaffilia
tej,t
.7761
The
table
rep
ort
sth
ere
sult
sof
est
imati
on
of
Equati
ons
5.1
,5.2
,and
5.3
usi
ng
poole
dO
LS
regre
ssio
nw
ith
annual
data
from
1993-2
011
for
the
221
equit
ym
eth
od
invest
ors
inm
ysa
mple
wit
hth
ere
quir
ed
data
available
.T
wo-t
ailed
p-v
alu
es
are
rep
ort
ed
as
follow
s:�p
0.1
0,��p
0.0
5,���p
0.0
1.
The
vari
able
sare
defined
inT
able
5.1
.A
llvari
able
sare
on
ap
er-
share
basi
sand
win
sori
zed
at
the
1st
and
99th
perc
enti
les.
40
These results suggest that the incremental value relevance of fair value measures
for investments in affiliates exists for both investments identified as held for sale
and those identified as strategic. The results do not provide evidence in support
of H1A (fair value measures of investments in publicly-traded affiliates identified as
“strategic” have less incremental value relevance relative to information provided
under the equity method of accounting than fair value measures of other investments
in publicly-traded affiliates) and H1B (fair value measures of investments in publicly-
traded affiliates identified as “held for sale” have more incremental value relevance
relative to information provided under the equity method of accounting than fair
value measures of other investments in publicly-traded affiliates).
In summary, I find that balance sheet measures of investments in affiliates provided
under the equity method are associated with investors’ stock prices and that fair
value balance sheet and income measures of investments in affiliates are incrementally
associated with investors’ stock prices after controlling for information provided under
the equity method. Income from affiliates recognized under the equity method is not
associated with investors’ stock prices. These results support the incremental value
relevance of fair value measurement of investments in affiliates relative to the equity
method. I also find that the incremental value relevance of fair value measures for
investments in affiliates exists for both investments identified as held for sale and those
identified as strategic, with no evidence that the incremental value relevance is higher
(lower) for investments identified as held for sale (strategic). This result suggests that
the FASB’s 2010 and 2013 proposals to distinguish between investments in affiliates
based on management’s intended method of value realization are not supported by
differences in the relative value relevance of fair value measures for these types of
investments.
41
5.4 Supplementary Analyses
5.4.1 Correlation between Investor and Affiliate Returns
I investigate whether the results in Table 5.3 of a positive association between
investors’ stock prices and the fair value measures (both balance sheet and income
statement) of investments in affiliates simply capture the correlation between investor
and affiliate stock returns. This concern arises because of the overlap in industry mem-
berships of investors and affiliates noted in Chapter 4.1. To do this, I first calculate
the correlation of investor and affiliate monthly stock returns for each investor-affiliate
pair in my sample during the period in which the equity method is applied. The av-
erage (median) number of monthly observations used to calculate this correlation is
43.59 (32.00):
Variable N Mean Std Dev P25 Median P75
Number of monthly observations used to calculate correlations 253 43.59 39.99 17.00 32.00 56.00
The average Pearson (Spearman) correlation of monthly stock returns of investors
and affiliates across firms in my sample is 0.322 (0.329):
Variable N Mean Std Dev P25 Median P75
Pearson correlation between monthly stock returns of investorsand publicly-traded affiliates during the periodin which the equity method is applied 253 0.322 .0272 0.138 0.327 0.511Spearman correlation between monthly stock returns of investorsand publicly-traded affiliates during the periodin which the equity method is applied 253 0.329 0.260 0.154 0.335 0.500
I then include in my value relevance analysis an indicator variable (and related
interaction terms) equal to one when the investor-affiliate correlation is above the
sample median. As shown in Table 5.4, I find that the incremental value relevance
of fair value balance sheet measures exists in the low correlation group (coefficient
on FV-BVpublicaffiliatej ,t = 0.965, t-statistic = 2.931) and that the incremental value
relevance of fair value income statement measures is not higher for the high correlation
42
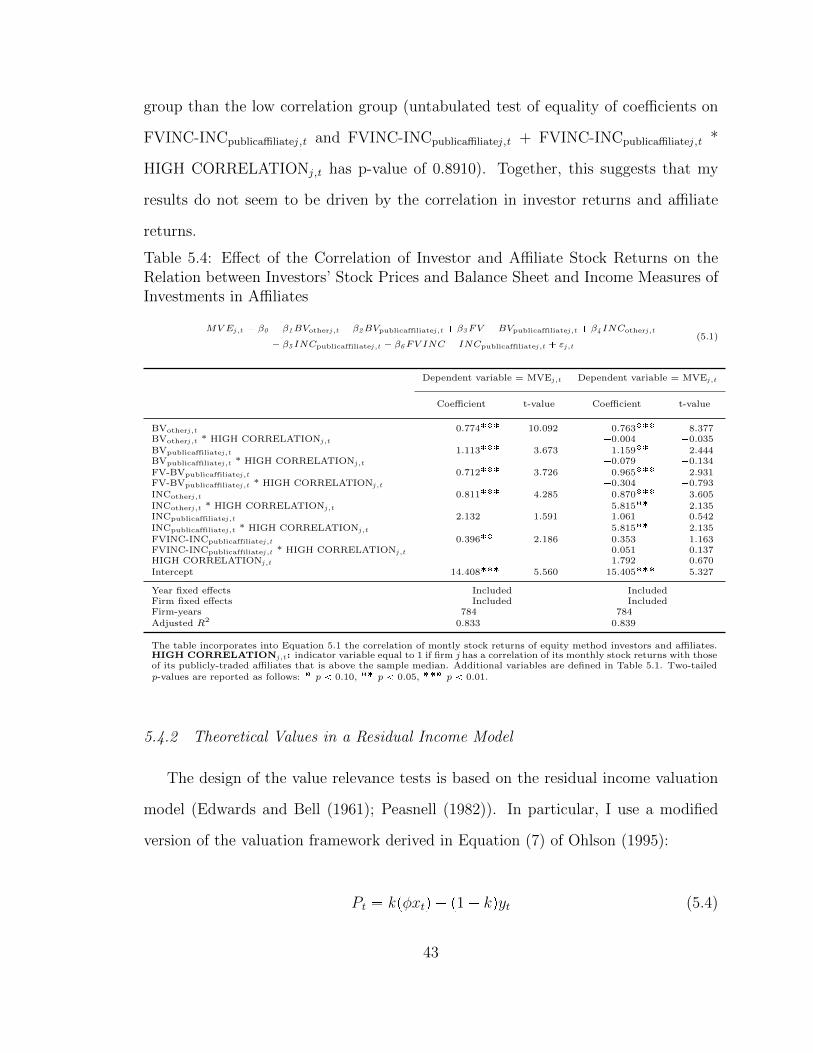
group than the low correlation group (untabulated test of equality of coefficients on
FVINC-INCpublicaffiliatej ,t and FVINC-INCpublicaffiliatej ,t + FVINC-INCpublicaffiliatej ,t *
HIGH CORRELATIONj ,t has p-value of 0.8910). Together, this suggests that my
results do not seem to be driven by the correlation in investor returns and affiliate
returns.
Table 5.4: Effect of the Correlation of Investor and Affiliate Stock Returns on theRelation between Investors’ Stock Prices and Balance Sheet and Income Measures ofInvestments in Affiliates
MVEj ,t � β0 � β1BVotherj ,t � β2BVpublicaffiliatej ,t � β3FV � BVpublicaffiliatej ,t � β4 INCotherj ,t
� β5 INCpublicaffiliatej ,t � β6FV INC � INCpublicaffiliatej ,t � εj ,t(5.1)
Dependent variable = MVEj ,t Dependent variable = MVEj ,t
Coefficient t-value Coefficient t-value
BVotherj ,t 0.774��� 10.092 0.763��� 8.377BVotherj ,t * HIGH CORRELATIONj ,t �0.004 �0.035BVpublicaffiliatej ,t 1.113��� 3.673 1.159�� 2.444BVpublicaffiliatej ,t * HIGH CORRELATIONj ,t �0.079 �0.134FV-BVpublicaffiliatej ,t 0.712��� 3.726 0.965��� 2.931FV-BVpublicaffiliatej ,t * HIGH CORRELATIONj ,t �0.304 �0.793INCotherj ,t 0.811��� 4.285 0.870��� 3.605INCotherj ,t * HIGH CORRELATIONj ,t 5.815�� 2.135INCpublicaffiliatej ,t 2.132 1.591 �1.061 �0.542INCpublicaffiliatej ,t * HIGH CORRELATIONj ,t 5.815�� 2.135FVINC-INCpublicaffiliatej ,t 0.396�� 2.186 0.353 1.163FVINC-INCpublicaffiliatej ,t * HIGH CORRELATIONj ,t 0.051 0.137HIGH CORRELATIONj ,t �1.792 �0.670Intercept 14.408��� 5.560 15.405��� 5.327
Year fixed effects Included IncludedFirm fixed effects Included IncludedFirm-years 784 784Adjusted R2 0.833 0.839
The table incorporates into Equation 5.1 the correlation of montly stock returns of equity method investors and affiliates.HIGH CORRELATIONj ,t : indicator variable equal to 1 if firm j has a correlation of its monthly stock returns with thoseof its publicly-traded affiliates that is above the sample median. Additional variables are defined in Table 5.1. Two-tailedp-values are reported as follows: � p 0.10, �� p 0.05, ��� p 0.01.
5.4.2 Theoretical Values in a Residual Income Model
The design of the value relevance tests is based on the residual income valuation
model (Edwards and Bell (1961); Peasnell (1982)). In particular, I use a modified
version of the valuation framework derived in Equation (7) of Ohlson (1995):
Pt � kpφxtq � p1 � kqyt (5.4)
43

where:
Pt: the market value, or price, of the firm’s equity at date t;
xt: earnings for the period t - 1 to t;
yt: (net) book value at date t;
Rf : the risk-free rate plus one;
ω: persistence of abnormal earnings, i.e., xat�1 � ωxat � ε1t�1;
xat : xt - (Rf - 1) yt�1;
k:pRf�1qω
Rf�ω; and
φ:Rf
Rf�1.
For my sample period, the average monthly risk-free rate of return (one-month
treasury bill rate) is .00259474, which implies an average annual risk-free rate of
return of approximately 3.11%. I also calculate an average persistence of abnormal
earnings for my sample firms. In particular, I estimate xat�1 � ωxat � vt � ε1t�1 for
each sample firm and calculate the average ω across firms. I do this in two ways: (a)
using all fiscal years from 1993-2011 for my sample firms and (b) using only those
fiscal years which appear in my value relevance regression. I calculate an average ω
of 0.517 and 0.806, respectively.9
Therefore, the theoretical value for the balance sheet variables in my value rel-
evance regression should be either 0.969 or 0.889 based on the average persistence
measures calculated and the following formula:
1 � k � 1 �pRf � 1qω
Rf � ω(5.5)
9 In a t-test, I find no statistical difference between these average persistence values (p-value of0.286).
44
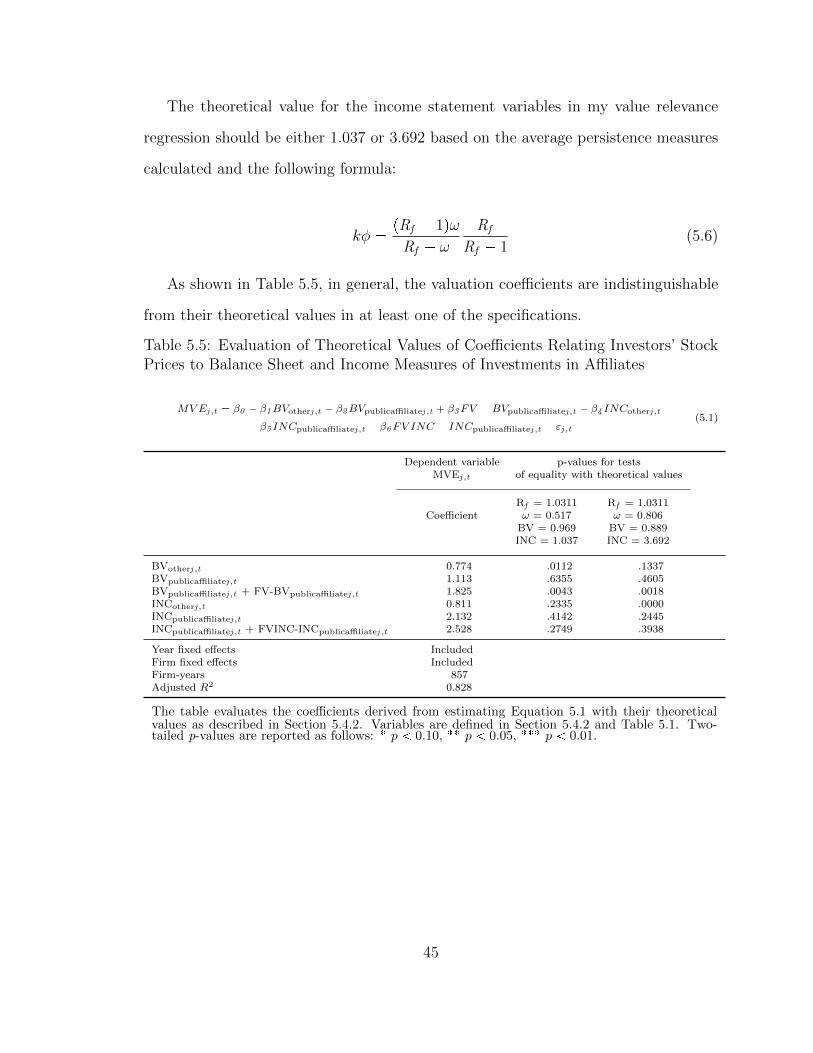
The theoretical value for the income statement variables in my value relevance
regression should be either 1.037 or 3.692 based on the average persistence measures
calculated and the following formula:
kφ �pRf � 1qω
Rf � ω
Rf
Rf � 1(5.6)
As shown in Table 5.5, in general, the valuation coefficients are indistinguishable
from their theoretical values in at least one of the specifications.
Table 5.5: Evaluation of Theoretical Values of Coefficients Relating Investors’ StockPrices to Balance Sheet and Income Measures of Investments in Affiliates
MVEj ,t � β0 � β1BVotherj ,t � β2BVpublicaffiliatej ,t � β3FV �BVpublicaffiliatej ,t � β4 INCotherj ,t
� β5 INCpublicaffiliatej ,t � β6FV INC � INCpublicaffiliatej ,t � εj ,t(5.1)
Dependent variable p-values for testsMVEj ,t of equality with theoretical values
Rf = 1.0311 Rf = 1.0311Coefficient ω = 0.517 ω = 0.806
BV = 0.969 BV = 0.889INC = 1.037 INC = 3.692
BVotherj ,t 0.774 .0112 .1337BVpublicaffiliatej ,t 1.113 .6355 .4605BVpublicaffiliatej ,t + FV-BVpublicaffiliatej ,t 1.825 .0043 .0018INCotherj ,t 0.811 .2335 .0000INCpublicaffiliatej ,t 2.132 .4142 .2445INCpublicaffiliatej ,t + FVINC-INCpublicaffiliatej ,t 2.528 .2749 .3938
Year fixed effects IncludedFirm fixed effects IncludedFirm-years 857Adjusted R2 0.828
The table evaluates the coefficients derived from estimating Equation 5.1 with their theoreticalvalues as described in Section 5.4.2. Variables are defined in Section 5.4.2 and Table 5.1. Two-tailed p-values are reported as follows: � p 0.10, �� p 0.05, ��� p 0.01.
45
6
Earnings Management by Investors with SignificantInfluence
6.1 Related Literature and Hypotheses Development
I also examine the neutrality of income reported under the equity method. Specif-
ically, I investigate whether the equity method achieves its objective of reducing earn-
ings management. During the development of APB 18, concern was expressed that
when investors can exercise significant influence, the cost method might invite earn-
ings management through the timing of dividend payments (e.g., Miller and Bahnson
(2007)).1 Earnings management is inconsistent with neutral financial reporting. The
FASB’s Conceptual Framework (SFAC No. 8, para. QC12) confirms the importance
of neutrality by including it as a component of faithful representation, one of the
fundamental qualitative characteristics of decision useful financial information.2
However, the equity method does not eliminate all opportunities for earnings
1 Under the cost method, income recognition only occurs through dividend payments (or impair-ments of investments, when required).
2 SFAC No. 8 (para. QC14) states, “A neutral depiction is without bias in the selection orpresentation of financial information. A neutral depiction is not slanted, weighted, emphasized,deemphasized, or otherwise manipulated to increase the probability that financial information willbe received favorably or unfavorably by users.”
46
management. Because a proportionate share of the affiliates’ income flows into the
investors’ net income, investors might use their “significant influence” to manage the
earnings of affiliates for the investors’ benefit. I explore whether the equity method
achieves its objective of reducing earnings management by examining the effect of
equity method ownership on the signed discretionary accruals of affiliates.3,4
There is an extensive literature examining earnings management (see, for example,
Dechow et al. (2010) for a review). The literature (e.g., Libby and Seybert (2009))
suggests a variety of factors that might drive earnings management, including capital
market pressures, individual reputation concerns, tax savings, and bonus compensa-
tion. For example, Graham et al. (2005) survey more than 400 chief financial officers
and find more than 80% of participants believe that meeting earnings benchmarks
builds credibility with the capital market and helps maintain or increase the firm’s
stock price (Table 4). The authors (page 28) also find that more than 75% of partici-
pants “agree or strongly agree that a manager’s concern about her external reputation
helps explain the desire to hit the earnings benchmark” with interviews confirming
that “the desire to hit the earnings target appears to be driven less by short-run
compensation motivations than by career concerns.” This paper does not attempt to
isolate the specific motivation(s) driving management of income from affiliates.
The one-line balance sheet and income statement presentation of information
about investments in affiliates might make managing income from this source less
transparent than managing income from other sources. For example, Lee et al. (2013)
find that analysts’ annual earnings forecasts are less accurate and more dispersed for
firms with affiliates relative to firms without affiliates for a sample of 21,336 U.S firm-
3 In future work, I plan to examine whether equity method investors influence operating decisionsof affiliates (“real actions”) for the investors’ benefit (e.g., to achieve earnings targets).
4 Accounting for investments in affiliates similar to trading securities or available-for-sale securitieswould result in recognizing dividends received as income. Therefore, those methods would not elim-inate concerns about earnings management, but the effects would appear in the timing of dividends,rather than in discretionary accruals.
47
year observations from 1985-2010. The authors suggest that this is due to the lack of
disclosure of components of affiliate earnings under the equity method.
Previous literature documents two ex ante actions taken by firms to manage earn-
ings in relation to equity method investments. First, Comiskey and Mulford (1986,
1988) find evidence that the requirements of the equity method affect the level of
ownership taken by investor firms. In particular, they find that for a sample of 1,255
investment positions taken in U.S firms in 1982, a statistically significant concentra-
tion of positions were taken just under and just over 20 percent, and investees that
were owned in the 19-19.99 percent range (applying the cost method) reported net
losses significantly more often than investees that were owned in the 20-20.99 percent
range (applying the equity method). Second, Morris and Gordon (2006) examine the
reporting choices of Australian firms holding investments in affiliates before and after
the first accounting standard on the subject was implemented in 1984. They find that
firms choose to show the effects of the equity method in a third column on the face of
the financial statements if doing so increases reported earnings, but in a footnote if
the equity method decreases reported earnings. I extend this literature by examining
whether investors manage earnings from affiliates ex post. That is, once firms make
investments with “significant influence” and apply the equity method of accounting,
do those investors manage reported earnings from affiliates?
I propose the following hypothesis (in alternative form):
H2A: Signed discretionary accruals of affiliates are higher when equity method
investors have an incentive to manage income from affiliates.
Equity method investors might also affect the discretionary accruals of affiliates
for reasons apart from a desire to achieve their own earnings targets. For example, the
literature examining the effects of large shareholders (mainly institutional investors)
on the financial reporting of investees suggests monitoring or the consumption of
48
private benefits by large shareholders as two possible examples of factors affecting
financial reporting. The monitoring effect exists when large shareholders can mitigate
the effects of self-interested actions taken by an affiliate’s management (e.g., reporting
higher discretionary accruals during their tenure and deferring the recognition of
losses until after their tenure) by monitoring the actions of affiliate’s management.
Previous research (e.g., Chung et al. (2002), Yeo et al. (2002), Velury and Jenkins
(2006), Koh (2007), Hadani et al. (2011)) documents a negative relation between
earnings management and the presence of large shareholders. The private benefits
effect exists when insiders use their positions of influence to benefit themselves at
the expense of other shareholders (e.g., Shleifer and Vishny (1997) and La Porta et
al. (1999)) and then manage reported amounts so as to deter or impede scrutiny.
This includes engaging in self-serving transactions, transferring assets to the insider
or another firm owned by the insider, or consuming perquisites. Previous research
documents the effects of concealing private benefits consumption through a positive
relation between earnings management and the presence of “insiders” (e.g., Leuz et
al. (2003), Haw et al. (2004), Gopalan and Jayaraman (2012)).
The list of factors above is not exhaustive. In addition, it is possible that there will
be no association between an equity method investor and the financial reporting of
an affiliate. Equity method investors might not use or wish to influence the external
financial reporting of affiliates. By definition, equity method investors have “signif-
icant influence” over the operating and financial policies of affiliates. This implies
that equity method investors have access to information necessary to affect operating
and financial decisions of affiliates and might not need to rely on external financial
reporting to monitor affiliates’ management. In addition, as discussed in Chapter 5.1,
equity method investments are undertaken for a variety of reasons (including strategic
operational benefits) unrelated to influencing the financial reporting of affiliates.
The focus of my analysis of the relation between equity method ownership and
49
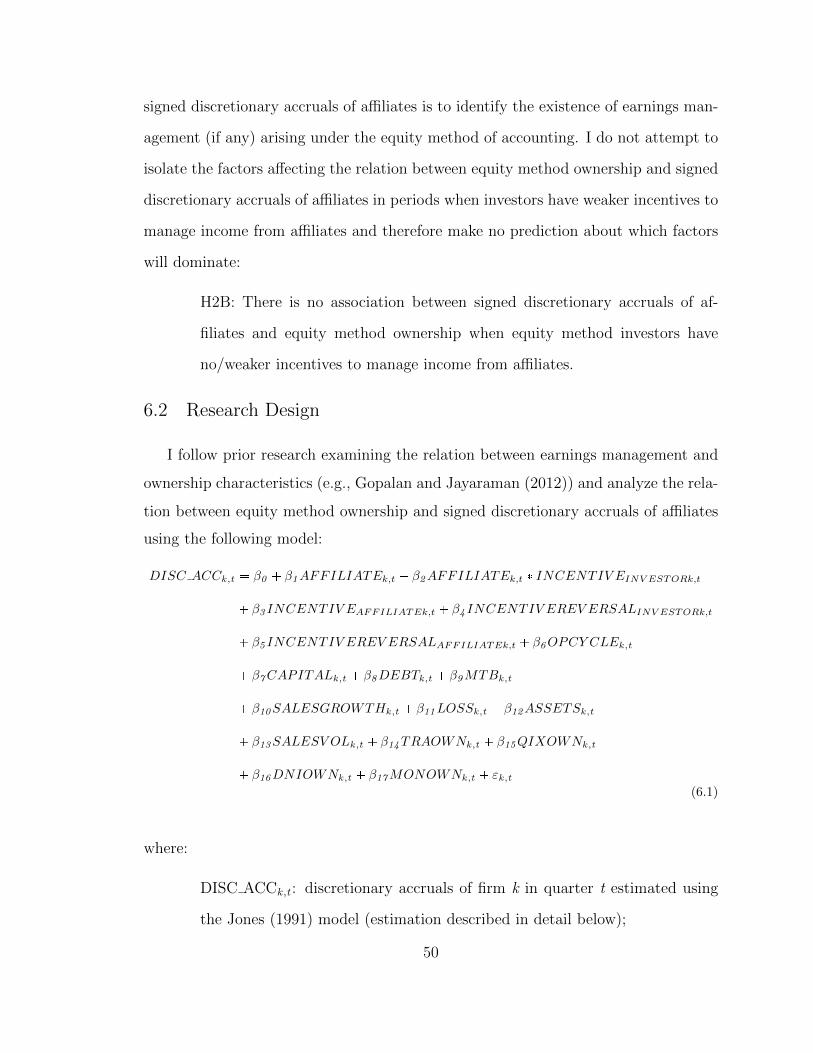
signed discretionary accruals of affiliates is to identify the existence of earnings man-
agement (if any) arising under the equity method of accounting. I do not attempt to
isolate the factors affecting the relation between equity method ownership and signed
discretionary accruals of affiliates in periods when investors have weaker incentives to
manage income from affiliates and therefore make no prediction about which factors
will dominate:
H2B: There is no association between signed discretionary accruals of af-
filiates and equity method ownership when equity method investors have
no/weaker incentives to manage income from affiliates.
6.2 Research Design
I follow prior research examining the relation between earnings management and
ownership characteristics (e.g., Gopalan and Jayaraman (2012)) and analyze the rela-
tion between equity method ownership and signed discretionary accruals of affiliates
using the following model:
DISC ACCk ,t � β0 � β1AFFILIATEk,t � β2AFFILIATEk,t � INCENTIV EINV ESTORk,t
� β3 INCENTIV EAFFILIATEk,t � β4 INCENTIV EREV ERSALINV ESTORk,t
� β5 INCENTIV EREV ERSALAFFILIATEk,t � β6OPCY CLEk ,t
� β7CAPITALk ,t � β8DEBTk ,t � β9MTBk ,t
� β10SALESGROWTHk ,t � β11LOSSk ,t � β12ASSETSk ,t
� β13SALESV OLk ,t � β14TRAOWNk ,t � β15QIXOWNk ,t
� β16DNIOWNk ,t � β17MONOWNk ,t � εk ,t(6.1)
where:
DISC ACCk ,t : discretionary accruals of firm k in quarter t estimated using
the Jones (1991) model (estimation described in detail below);
50
AFFILIATEk,t: indicator variable equal to 1 if firm k is an affiliate (i.e., has
an equity method investor) during quarter t, and 0 otherwise;
INCENTIVEINV ESTORk,t: indicator variable equal to 1 if income from affili-
ates allows the equity method investor of firm k to meet one of three earnings
targets (non-negative income, non-negative change in income, analysts’ fore-
casted earnings) in year t, and 0 otherwise;
CONTROLS:
INCENTIVEAFFILIATEk,t: indicator variable equal to 1 if firm k just meets
one of three earnings targets (non-negative income, non-negative change in
income, analysts’ forecasted earnings) in quarter t, and 0 otherwise;5
INCENTIVE REVERSALINV ESTORk,t: indicator variable equal to 1 if quar-
ter t is identified as the reversal period for accruals from an INCENTIVEINV ESTOR
period using the Baber et al. (2011) methodology;
INCENTIVE REVERSALAFFILIATEk,t: indicator variable equal to 1 if quar-
ter t is identified as the reversal period for accruals from an INCENTIVEAFFILIATE
period using the Baber et al. (2011) methodology;
OPCYCLEk ,t : length of the operating cycle of firm k in quarter t, measured
as days receivable plus days inventory less days payable at the beginning of
the quarter, as defined in Zang (2012);
CAPITALk ,t : capital intensity of firm k in quarter t, measured as the ratio
of noncurrent assets (ATQ - ACTQ) to lagged total assets;
5 In particular, INCENTIVEAFFILIATEk,t = 1 when an affiliate has small positive earnings, asmall positive change in earnings, or just meets analyst expectations. To define “small”, I calculatethe ratio of the absolute value of net income to total assets for my sample. Firms are then defined ashaving “small” positive earnings (change in earnings) if their earnings (change in earnings) dividedby total assets in period t are less than the 10th percentile of this ratio for my overall sample offirms. I define “just meeting” analyst expectations as situations in which actual I/B/E/S earningsper share less the median analyst forecast (using the most recent forecast for each analyst within 90days of the earnings announcement) is greater than zero and less than or equal to 0.01.
51

LEVk ,t : leverage ((DLTTQ + DLCQ)/(CSHOQ * PRCCQ) of firm k at the
end of quarter t;
MTBk ,t : market-to-book ratio (CSHOQ*PRCCQ/CEQQ) of firm k in quar-
ter t;
SALESGROWTHk ,t : quarterly sales (SALEQ) growth rate of firm k from
quarter t - 1 to quarter t;
LOSSk ,t : an indicator variable equal to 1 if firm k has a loss in quarter t;
ASSETSk ,t : logarithm of total assets (ATQ) of firm k in quarter t;
SALESVOLk ,t : sales volatility, measured as the standard deviation of quar-
terly sales (SALEQ) of firm k in quarter t based on the most recent five
quarterly observations;
TRAOWNk ,t : percentage ownership of firm k at the end of quarter t by
institutional investors described as transient by Bushee (2001);
QIXOWNk ,t : percentage ownership of firm k at the end of quarter t by insti-
tutional investors described as quasi-indexing by Bushee (2001);
DNIOWNk ,t : percentage ownership of firm k at the end of quarter t by
institutional investors described as dedicated by Bushee (2001) and non-
independent by Brickley et al. (1988); and
MONOWNk ,t : percentage ownership of firm k at the end of quarter t by in-
stitutional investors described as monitoring institutions in Ramalingegowda
and Yu (2012) based on classification as dedicated by Bushee (2001) and
independent by Brickley et al. (1988).
The main coefficient of interest is β2, which investigates whether earnings man-
agement (investors using the flow-through of affiliate income to investor income to
achieve their own earnings targets) exists in my sample. I include an interaction term
52
representing situations when it is likely that equity method investors would have an
incentive to manage the earnings of affiliates. I capture this construct by identifying
situations in which income from an affiliate allows an equity method investor to meet
an earnings target (non-negative income, non-negative change in income, or analysts’
forecasted earnings). That is, I identify situations in which the earnings of an eq-
uity method investor without incorporating income from an affiliate are below the
earnings target, but the inclusion of income from the affiliate in the investor’s earn-
ings results in the investor meeting or exceeding its earnings target. A positive β2
indicates that affiliates have higher signed discretionary accruals when income from
an affiliate allows their equity method investors to meet an earnings target and thus
provides evidence of earnings management.
I also investigate the relation between equity method ownership and discretionary
accruals of affiliates in periods when investors have weaker incentives to manage in-
come from affiliates. A negative (positive) β1 indicates that firms have lower (higher)
signed discretionary accruals when they are affiliates. As discussed in Chapter 6.1,
this relation might arise due to the effects of monitoring, concealment of private
benefits, or other factors related to equity method ownership.
I measure discretionary accruals using the Jones (1991) model. I estimate Equa-
tion 6.2 for each firm in my sample, using all quarterly observations for that firm
from 1993-2011 in periods in which the firm is not an affiliate (with a minimum of 10
observations required).6,7 This approach allows me to control for firm-specific factors
affecting accruals. I control for time-specific factors affecting accruals by including
year fixed effects in my regression.
6 The use of a “non-event” period to develop firm-specific estimates of discretionary accruals isdiscussed, for example, by Dechow et al. (1995).
7 In untabulated tests, I find that my main results are robust to excluding the intercept in Equation6.2, estimating discretionary accruals using the modified Jones model (Dechow et al. (1995)), andusing annual data rather than quarterly data.
53
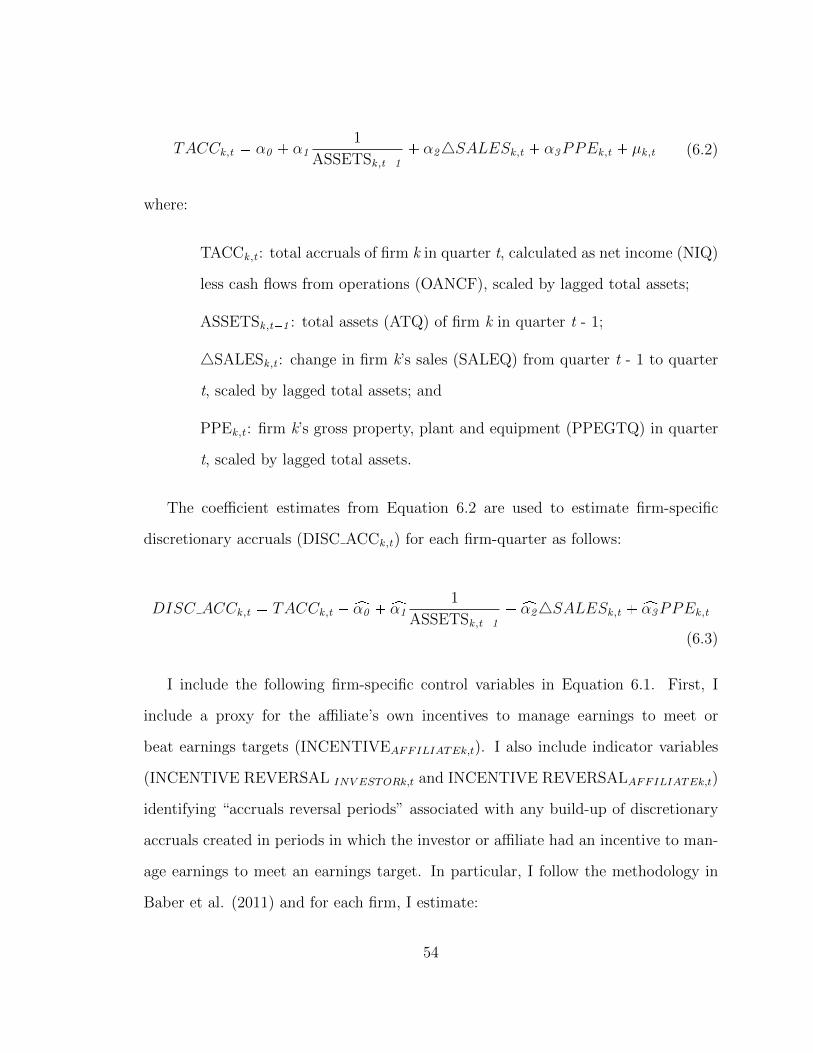
TACCk ,t � α0 � α11
ASSETSk ,t�1
� α24SALESk ,t � α3PPEk ,t � µk ,t (6.2)
where:
TACCk ,t : total accruals of firm k in quarter t, calculated as net income (NIQ)
less cash flows from operations (OANCF), scaled by lagged total assets;
ASSETSk ,t�1 : total assets (ATQ) of firm k in quarter t - 1;
4SALESk ,t : change in firm k’s sales (SALEQ) from quarter t - 1 to quarter
t, scaled by lagged total assets; and
PPEk ,t : firm k’s gross property, plant and equipment (PPEGTQ) in quarter
t, scaled by lagged total assets.
The coefficient estimates from Equation 6.2 are used to estimate firm-specific
discretionary accruals (DISC ACCk ,t) for each firm-quarter as follows:
DISC ACCk ,t � TACCk ,t �xα0 �xα11
ASSETSk ,t�1
�xα24SALESk ,t �xα3PPEk ,t
(6.3)
I include the following firm-specific control variables in Equation 6.1. First, I
include a proxy for the affiliate’s own incentives to manage earnings to meet or
beat earnings targets (INCENTIVEAFFILIATEk,t). I also include indicator variables
(INCENTIVE REVERSAL INV ESTORk,t and INCENTIVE REVERSALAFFILIATEk,t)
identifying “accruals reversal periods” associated with any build-up of discretionary
accruals created in periods in which the investor or affiliate had an incentive to man-
age earnings to meet an earnings target. In particular, I follow the methodology in
Baber et al. (2011) and for each firm, I estimate:
54
DISC ACCk ,t � αk ,t � ρmDISC ACCk,t�m � εk,t (6.4)
for m = 1 to 16 quarters. Following Proposition 1 in Baber et al. (2011), the minimum
value of ρm is achieved in the period in which period t discretionary accruals reverse.
Prior studies (e.g., Dechow (1994), Dechow and Dichev (2002), Hribar and Nichols
(2007)) find that accruals can be affected by differences in the following factors:
operating cycle (OPCYCLEk ,t), capital intensity (CAPITALk ,t), leverage (LEVk ,t),
size (ASSETSk ,t), and sales volatility (SALESVOLk ,t). I also control for differences
in growth opportunities (MTBk ,t and SALESGROWTHk ,t). Finally, I control for
the effects of various types of institutional ownership (TRAOWNk ,t , QIXOWNk ,t ,
DNIOWNk ,t , MONOWNk ,t) as monitoring or other actions taken by these investors
might also affect discretionary accruals (e.g., Chung et al. (2002), Yeo et al. (2002)).
6.3 Empirical Results
I investigate the relation between equity method ownership and signed discre-
tionary accruals of affiliates (H2) by estimating Equation 6.1 using a pooled OLS
regression for all firm-quarters from 1993-2011 for the publicly-traded affiliates in my
sample with the required data available. I include year and firm fixed effects in the
regression and winsorize all variables at the 1st and 99th percentiles. The related
descriptive statistics and correlation coefficients are presented in Tables 6.1 and 6.2.
The estimation results are reported in Table 6.3.
As shown in Table 6.1, the mean of INCENTIVEINV ESTORk,t indicates that in
3.5% of my firm-quarter observations (175/4,937), the firm has an equity method
investor and income from the firm calculated under the equity method allows the eq-
uity method investor to meet an earnings target (non-negative income, non-negative
change in income, or analysts’ forecasted earnings). This translates into equity
55
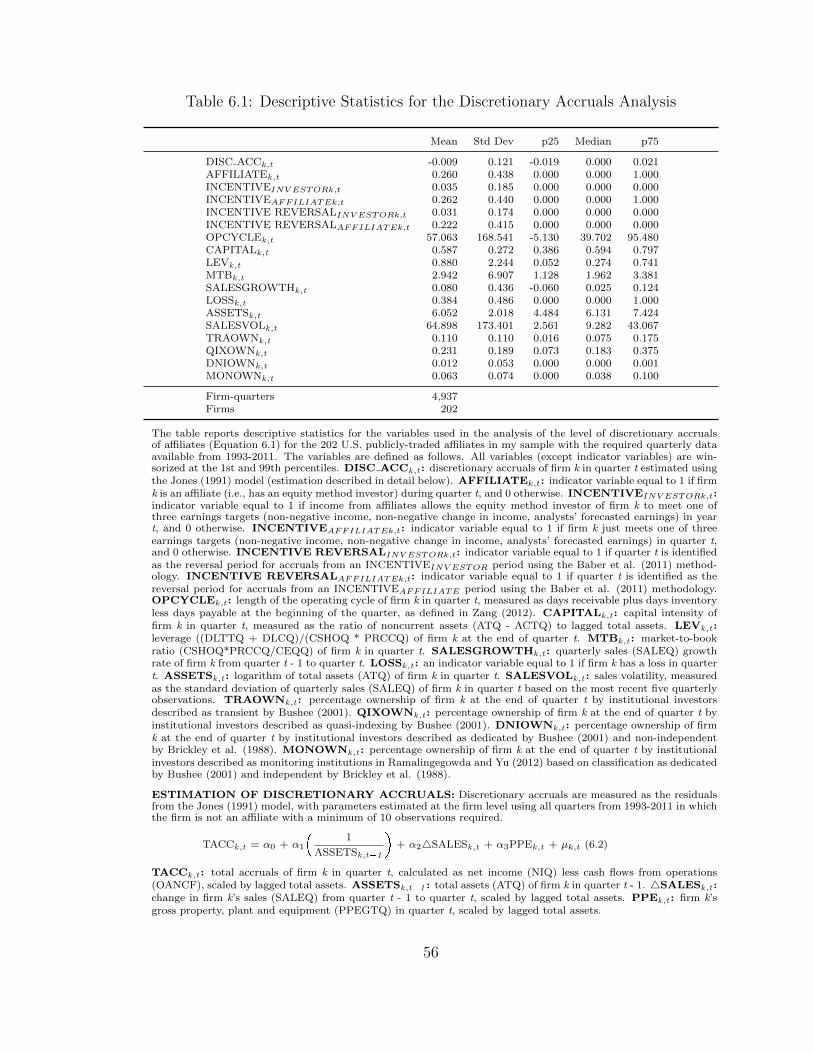
Table 6.1: Descriptive Statistics for the Discretionary Accruals Analysis
Mean Std Dev p25 Median p75
DISC ACCk,t -0.009 0.121 -0.019 0.000 0.021AFFILIATEk,t 0.260 0.438 0.000 0.000 1.000INCENTIVEINV ESTORk,t 0.035 0.185 0.000 0.000 0.000INCENTIVEAFFILIATEk,t 0.262 0.440 0.000 0.000 1.000INCENTIVE REVERSALINV ESTORk,t 0.031 0.174 0.000 0.000 0.000INCENTIVE REVERSALAFFILIATEk,t 0.222 0.415 0.000 0.000 0.000OPCYCLEk,t 57.063 168.541 -5.130 39.702 95.480CAPITALk,t 0.587 0.272 0.386 0.594 0.797LEVk,t 0.880 2.244 0.052 0.274 0.741MTBk,t 2.942 6.907 1.128 1.962 3.381SALESGROWTHk,t 0.080 0.436 -0.060 0.025 0.124LOSSk,t 0.384 0.486 0.000 0.000 1.000ASSETSk,t 6.052 2.018 4.484 6.131 7.424SALESVOLk,t 64.898 173.401 2.561 9.282 43.067TRAOWNk,t 0.110 0.110 0.016 0.075 0.175QIXOWNk,t 0.231 0.189 0.073 0.183 0.375DNIOWNk,t 0.012 0.053 0.000 0.000 0.001MONOWNk,t 0.063 0.074 0.000 0.038 0.100
Firm-quarters 4,937Firms 202
The table reports descriptive statistics for the variables used in the analysis of the level of discretionary accrualsof affiliates (Equation 6.1) for the 202 U.S. publicly-traded affiliates in my sample with the required quarterly dataavailable from 1993-2011. The variables are defined as follows. All variables (except indicator variables) are win-sorized at the 1st and 99th percentiles. DISC ACCk,t : discretionary accruals of firm k in quarter t estimated usingthe Jones (1991) model (estimation described in detail below). AFFILIATEk,t: indicator variable equal to 1 if firmk is an affiliate (i.e., has an equity method investor) during quarter t, and 0 otherwise. INCENTIVEINV ESTORk,t:indicator variable equal to 1 if income from affiliates allows the equity method investor of firm k to meet one ofthree earnings targets (non-negative income, non-negative change in income, analysts’ forecasted earnings) in yeart, and 0 otherwise. INCENTIVEAFFILIATEk,t: indicator variable equal to 1 if firm k just meets one of threeearnings targets (non-negative income, non-negative change in income, analysts’ forecasted earnings) in quarter t,and 0 otherwise. INCENTIVE REVERSALINV ESTORk,t: indicator variable equal to 1 if quarter t is identifiedas the reversal period for accruals from an INCENTIVEINV ESTOR period using the Baber et al. (2011) method-ology. INCENTIVE REVERSALAFFILIATEk,t: indicator variable equal to 1 if quarter t is identified as thereversal period for accruals from an INCENTIVEAFFILIATE period using the Baber et al. (2011) methodology.OPCYCLEk,t : length of the operating cycle of firm k in quarter t, measured as days receivable plus days inventoryless days payable at the beginning of the quarter, as defined in Zang (2012). CAPITALk,t : capital intensity offirm k in quarter t, measured as the ratio of noncurrent assets (ATQ - ACTQ) to lagged total assets. LEVk,t :leverage ((DLTTQ + DLCQ)/(CSHOQ * PRCCQ) of firm k at the end of quarter t. MTBk,t : market-to-bookratio (CSHOQ*PRCCQ/CEQQ) of firm k in quarter t. SALESGROWTHk,t : quarterly sales (SALEQ) growthrate of firm k from quarter t - 1 to quarter t. LOSSk,t : an indicator variable equal to 1 if firm k has a loss in quartert. ASSETSk,t : logarithm of total assets (ATQ) of firm k in quarter t. SALESVOLk,t : sales volatility, measuredas the standard deviation of quarterly sales (SALEQ) of firm k in quarter t based on the most recent five quarterlyobservations. TRAOWNk,t : percentage ownership of firm k at the end of quarter t by institutional investorsdescribed as transient by Bushee (2001). QIXOWNk,t : percentage ownership of firm k at the end of quarter t byinstitutional investors described as quasi-indexing by Bushee (2001). DNIOWNk,t : percentage ownership of firmk at the end of quarter t by institutional investors described as dedicated by Bushee (2001) and non-independentby Brickley et al. (1988). MONOWNk,t : percentage ownership of firm k at the end of quarter t by institutionalinvestors described as monitoring institutions in Ramalingegowda and Yu (2012) based on classification as dedicatedby Bushee (2001) and independent by Brickley et al. (1988).
ESTIMATION OF DISCRETIONARY ACCRUALS: Discretionary accruals are measured as the residualsfrom the Jones (1991) model, with parameters estimated at the firm level using all quarters from 1993-2011 in whichthe firm is not an affiliate with a minimum of 10 observations required.
TACCk,t = α0 + α1
�1
ASSETSk,t�1
+ α24SALESk,t + α3PPEk,t + µk,t (6.2)
TACCk,t : total accruals of firm k in quarter t, calculated as net income (NIQ) less cash flows from operations(OANCF), scaled by lagged total assets. ASSETSk,t�1 : total assets (ATQ) of firm k in quarter t - 1. 4SALESk,t :change in firm k’s sales (SALEQ) from quarter t - 1 to quarter t, scaled by lagged total assets. PPEk,t : firm k’sgross property, plant and equipment (PPEGTQ) in quarter t, scaled by lagged total assets.
56
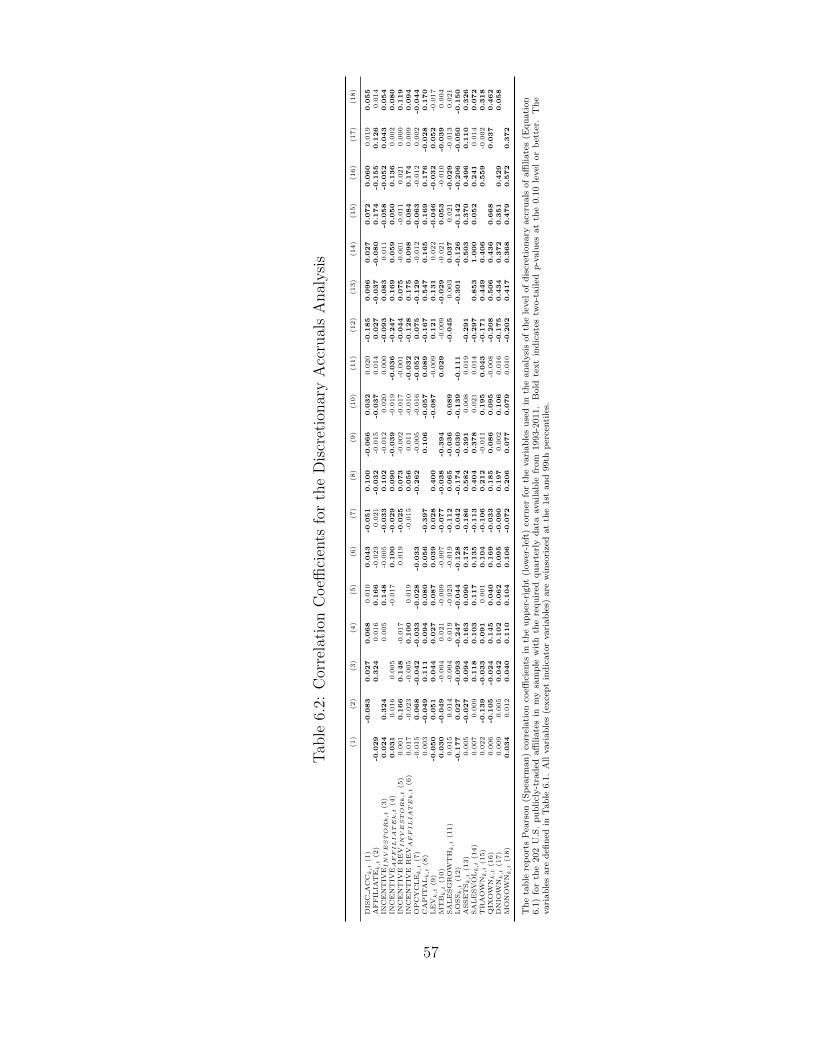
Tab
le6.
2:C
orre
lati
onC
oeffi
cien
tsfo
rth
eD
iscr
etio
nar
yA
ccru
als
Anal
ysi
s
(1)
(2)
(3)
(4)
(5)
(6)
(7)
(8)
(9)
(10)
(11)
(12)
(13)
(14)
(15)
(16)
(17)
(18)
DIS
CA
CC
k,t
(1)
-0.0
83
0.0
27
0.0
68
0.0
10
0.0
43
-0.0
51
0.1
00
-0.0
66
0.0
32
0.0
20
-0.1
85
0.0
96
0.0
27
0.0
72
0.0
60
0.0
19
0.0
55
AF
FIL
IAT
Ek,t
(2)
-0.0
29
0.3
24
0.0
16
0.1
66
-0.0
23
0.0
21
-0.0
32
-0.0
15
-0.0
37
0.0
14
0.0
27
-0.0
37
-0.0
80
0.1
74
-0.1
55
0.1
26
0.0
14
INC
EN
TIV
EIN
VE
ST
OR
k,t
(3)
0.0
24
0.3
24
0.0
05
0.1
48
-0.0
05
-0.0
33
0.1
02
-0.0
12
0.0
20
0.0
00
-0.0
93
0.0
83
0.0
11
-0.0
58
-0.0
52
0.0
43
0.0
54
INC
EN
TIV
EA
FF
ILIA
TE
k,t
(4)
0.0
31
0.0
16
0.0
05
-0.0
17
0.1
00
-0.0
29
0.0
90
-0.0
39
-0.0
19
-0.0
36
-0.2
47
0.1
69
0.0
59
0.0
50
0.1
36
0.0
02
0.0
80
INC
EN
TIV
ER
EV
IN
VE
ST
OR
k,t
(5)
0.0
01
0.1
66
0.1
48
-0.0
17
0.0
19
-0.0
25
0.0
73
-0.0
02
-0.0
17
-0.0
01
-0.0
44
0.0
75
-0.0
01
-0.0
11
0.0
21
0.0
00
0.1
19
INC
EN
TIV
ER
EV
AF
FILIA
TE
k,t
(6)
0.0
17
-0.0
23
-0.0
05
0.1
00
0.0
19
-0.0
15
0.0
56
0.0
11
-0.0
10
-0.0
32
-0.1
28
0.1
75
0.0
98
0.0
84
0.1
74
0.0
09
0.0
94
OP
CY
CL
Ek,t
(7)
-0.0
15
0.0
68
-0.0
42
-0.0
33
-0.0
28
-0.0
33
-0.2
62
-0.0
05
-0.0
16
-0.0
52
0.0
75
-0.1
29
-0.0
12
-0.0
63
-0.0
12
0.0
02
-0.0
44
CA
PIT
ALk,t
(8)
0.0
03
-0.0
49
0.1
11
0.0
94
0.0
80
0.0
56
-0.3
97
0.1
06
-0.0
57
0.0
89
-0.1
67
0.5
47
0.1
65
0.1
69
0.1
76
-0.0
28
0.1
70
LE
Vk,t
(9)
-0.0
50
0.0
51
0.0
44
0.0
27
0.0
87
0.0
39
0.0
28
0.4
00
-0.0
87
-0.0
09
0.1
21
0.1
31
0.0
22
-0.0
46
-0.0
32
0.0
52
-0.0
17
MT
Bk,t
(10)
0.0
30
-0.0
49
-0.0
04
0.0
21
-0.0
09
-0.0
07
-0.0
77
-0.0
38
-0.3
94
0.0
29
-0.0
09
-0.0
29
-0.0
21
0.0
53
-0.0
10
-0.0
39
0.0
04
SA
LE
SG
RO
WT
Hk,t
(11)
0.0
15
0.0
14
-0.0
04
0.0
19
-0.0
23
-0.0
19
-0.1
12
0.0
65
-0.0
36
0.0
89
-0.0
45
0.0
03
0.0
37
0.0
21
-0.0
29
-0.0
13
0.0
21
LO
SSk,t
(12)
-0.1
77
0.0
27
-0.0
93
-0.2
47
-0.0
44
-0.1
28
0.0
42
-0.1
74
-0.0
30
-0.1
39
-0.1
11
-0.3
01
-0.1
26
-0.1
42
-0.2
06
-0.0
50
-0.1
50
ASSE
TSk,t
(13)
0.0
05
-0.0
27
0.0
94
0.1
63
0.0
90
0.1
73
-0.1
86
0.5
82
0.3
91
0.0
08
0.0
19
-0.2
91
0.5
03
0.3
70
0.4
96
0.1
10
0.3
26
SA
LE
SV
OLk,t
(14)
0.0
07
0.0
09
0.1
18
0.1
03
0.1
17
0.1
35
-0.1
13
0.4
04
0.3
78
0.0
21
0.0
14
-0.2
97
0.8
53
1.0
00
0.0
52
0.2
41
0.0
14
0.0
72
TR
AO
WN
k,t
(15)
0.0
22
-0.1
39
-0.0
33
0.0
91
0.0
01
0.1
04
-0.1
06
0.2
12
-0.0
11
0.1
95
0.0
43
-0.1
71
0.4
49
0.4
06
0.5
59
-0.0
02
0.3
18
QIX
OW
Nk,t
(16)
0.0
06
-0.1
05
-0.0
24
0.1
45
0.0
40
0.1
69
-0.0
33
0.1
85
0.0
86
0.0
95
-0.0
08
-0.2
08
0.5
06
0.4
36
0.6
68
0.0
37
0.4
62
DN
IOW
Nk,t
(17)
0.0
09
0.0
05
0.0
42
0.1
02
0.0
62
0.0
95
-0.0
90
0.1
97
0.0
02
0.1
06
0.0
16
-0.1
75
0.4
34
0.3
72
0.3
51
0.4
29
0.0
58
MO
NO
WN
k,t
(18)
0.0
34
0.0
12
0.0
40
0.1
10
0.1
04
0.1
06
-0.0
72
0.2
06
0.0
77
0.0
79
0.0
10
-0.2
02
0.4
17
0.3
68
0.4
79
0.5
72
0.3
72
Th
eta
ble
rep
ort
sP
ears
on
(Sp
earm
an
)co
rrel
ati
on
coeffi
cien
tsin
the
up
per
-rig
ht
(low
er-l
eft)
corn
erfo
rth
evari
ab
les
use
din
the
an
aly
sis
of
the
level
of
dis
cret
ion
ary
acc
ruals
of
affi
liate
s(E
qu
ati
on
6.1
)fo
rth
e202
U.S
.p
ub
licl
y-t
rad
edaffi
liate
sin
my
sam
ple
wit
hth
ere
qu
ired
qu
art
erly
data
avail
ab
lefr
om
1993-2
011.
Bold
text
ind
icate
stw
o-t
ail
edp-v
alu
esat
the
0.1
0le
vel
or
bet
ter.
Th
evari
ab
les
are
defi
ned
inT
ab
le6.1
.A
llvari
ab
les
(exce
pt
ind
icato
rvari
ab
les)
are
win
sori
zed
at
the
1st
an
d99th
per
centi
les.
57
method investors having an incentive to manage earnings from affiliates in 13.7%
(175/1,282) of the firm-quarters in which an equity method relationship exists. In unt-
abulated results, I find evidence of meeting the non-negative income target in 12.6%
(22/175) of the cases, the non-negative change in income target in 17.1% (30/175) of
the cases, and analysts’ forecasted earnings in 80.0% (140/175) of the cases.8 Table
6.2 shows that there is a positive correlation between signed discretionary accruals and
INCENTIVEINV ESTORk,t [Spearman (Pearson) coefficient = 0.024 (0.027)], providing
preliminary evidence that equity method investors manage earnings of affiliates to
achieve their own income targets. There is also a negative correlation between signed
discretionary accruals and equity method ownership [Spearman (Pearson) coefficient
= -0.029 (-0.083)].
The data required to calculate the control variables included in Equation 6.1 re-
duce the sample from 250 affiliates to 202 affiliates. In the first two columns of Table
6.3, I report the results of an estimation of the coefficients on AFFILIATEk,t and
AFFILIATEk,t * INCENTIVEINV ESTORk,t including control variables for the affiliate
having an incentive to manage its own discretionary accruals
(INCENTIVEAFFILIATEk,t) and for the reversal of any build-up of discretionary ac-
cruals created in periods in which the investor or affiliate had an incentive to manage
earnings to meet an earnings target (INCENTIVE REVERSALINV ESTORk,t and IN-
CENTIVE REVERSALAFFILIATEk,t). The coefficient on AFFILIATEk,t
* INCENTIVEINV ESTORk,t is positive (β2 = 0.030, t-statistic = 2.929). This result
indicates that signed discretionary accruals of affiliates are higher when income from
affiliates allows equity method investors to meet earnings targets. This result provides
evidence that equity method investors take advantage of the mechanics of the equity
method (the flow-through of affiliate income to investor income) to manage earnings
8 The total exceeds 100% because in 17 cases income from the affiliate allows the investor to meettwo earnings targets.
58
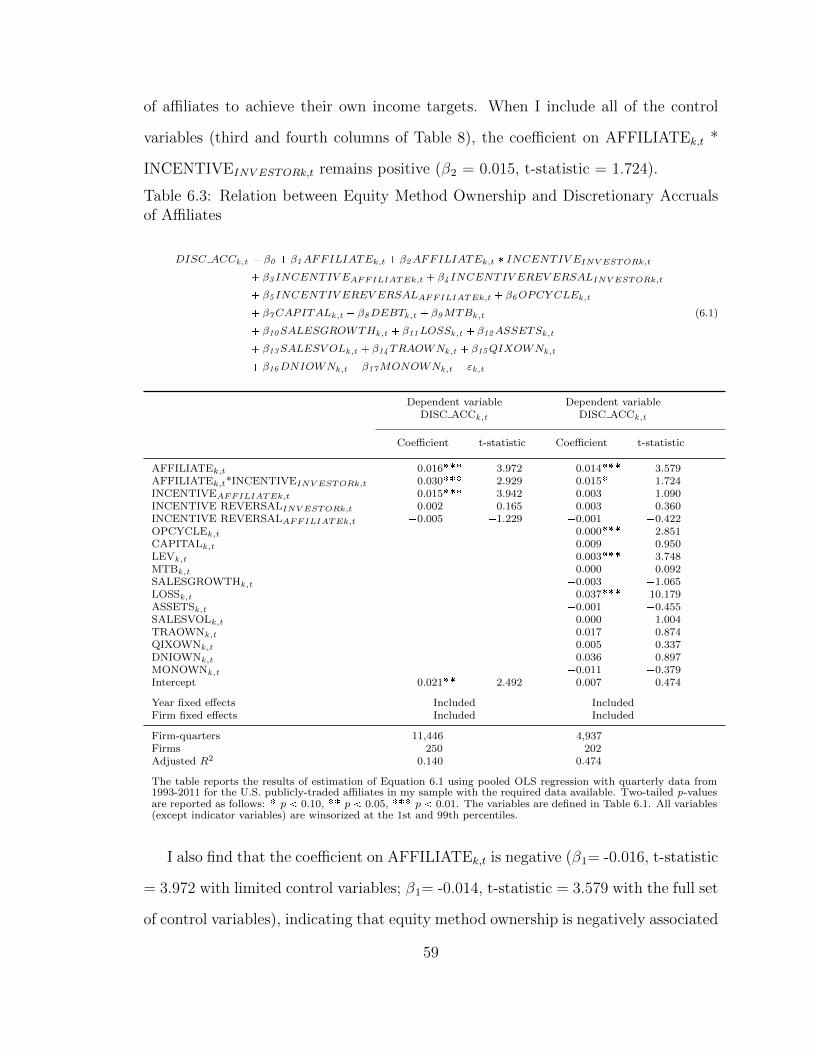
of affiliates to achieve their own income targets. When I include all of the control
variables (third and fourth columns of Table 8), the coefficient on AFFILIATEk,t *
INCENTIVEINV ESTORk,t remains positive (β2 = 0.015, t-statistic = 1.724).
Table 6.3: Relation between Equity Method Ownership and Discretionary Accrualsof Affiliates
DISC ACCk,t � β0 � β1AFFILIATEk,t � β2AFFILIATEk,t � INCENTIV EINV ESTORk,t
� β3 INCENTIV EAFFILIATEk,t � β4 INCENTIV EREV ERSALINV ESTORk,t
� β5 INCENTIV EREV ERSALAFFILIATEk,t � β6OPCY CLEk,t
� β7CAPITALk,t � β8DEBTk,t � β9MTBk,t
� β10SALESGROWTHk,t � β11LOSSk,t � β12ASSETSk,t
� β13SALESV OLk,t � β14TRAOWNk,t � β15QIXOWNk,t
� β16DNIOWNk,t � β17MONOWNk,t � εk,t
(6.1)
Dependent variable Dependent variableDISC ACCk,t DISC ACCk,t
Coefficient t-statistic Coefficient t-statistic
AFFILIATEk,t �0.016��� �3.972 �0.014��� �3.579AFFILIATEk,t*INCENTIVEINV ESTORk,t 0.030��� 2.929 0.015� 1.724INCENTIVEAFFILIATEk,t 0.015��� 3.942 0.003 1.090INCENTIVE REVERSALINV ESTORk,t 0.002 0.165 0.003 0.360INCENTIVE REVERSALAFFILIATEk,t �0.005 �1.229 �0.001 �0.422OPCYCLEk,t �0.000��� �2.851CAPITALk,t 0.009 0.950LEVk,t �0.003��� �3.748MTBk,t 0.000 0.092SALESGROWTHk,t �0.003 �1.065LOSSk,t �0.037��� �10.179ASSETSk,t �0.001 �0.455SALESVOLk,t �0.000 �1.004TRAOWNk,t 0.017 0.874QIXOWNk,t �0.005 �0.337DNIOWNk,t 0.036 0.897MONOWNk,t �0.011 �0.379Intercept �0.021�� �2.492 0.007 0.474
Year fixed effects Included IncludedFirm fixed effects Included Included
Firm-quarters 11,446 4,937Firms 250 202Adjusted R2 0.140 0.474
The table reports the results of estimation of Equation 6.1 using pooled OLS regression with quarterly data from1993-2011 for the U.S. publicly-traded affiliates in my sample with the required data available. Two-tailed p-valuesare reported as follows: � p 0.10, �� p 0.05, ��� p 0.01. The variables are defined in Table 6.1. All variables(except indicator variables) are winsorized at the 1st and 99th percentiles.
I also find that the coefficient on AFFILIATEk,t is negative (β1= -0.016, t-statistic
= 3.972 with limited control variables; β1= -0.014, t-statistic = 3.579 with the full set
of control variables), indicating that equity method ownership is negatively associated
59
with signed discretionary accruals of affiliates. One possible explanation is that equity
method investors monitor management actions and mitigate the effects of actions
taken by affiliates’ management to inflate reported earnings. I do not further explore
or isolate the cause of the negative association in this paper.
In summary, I find that signed discretionary accruals of affiliates are higher when
income from affiliates allows equity method investors to meet earnings targets. I also
find a negative relation between equity method ownership and signed discretionary
accruals of affiliates in other periods. The result provides evidence that the equity
method does not eliminate concerns about earnings management, such as those ex-
pressed in relation to the cost method; it changes the mechanism through which
earnings are managed. The result also suggests that an incentive to manage the
earnings of affiliates can change the effect of equity method ownership on signed dis-
cretionary accruals of affiliates and confirms the importance of considering investors’
characteristics in studies of the effects of large shareholders on investees.
6.4 Supplementary Analyses
6.4.1 Effect of “True” Significant Influence
In this section, I investigate whether there is a difference between “nominal” signif-
icant influence and “true” significant influence in my sample and re-run my earnings
management tests to examine whether the results exist only in, or are stronger in,
the portion of the sample with “true” significant influence. There is a presumption
in APB 18 (para. 17, ASC 323-10-15-8) that, absent evidence to the contrary, an
investment of 20% or more indicates the ability to exercise significant influence over
the operating and financial policies of an investee. As a result, it is possible that
the equity method is applied in situations where ownership is between 20-50%, but
significant influence is not exercised (“nominal” significant influence).
APB 18 (para. 17, ASC 323-10-15-6) identifies the following factors that might
60
indicate an ability to exercise significant influence:
Representation on the board of directors
Participation in policy-making processes
Material intra-entity transactions9
Interchange of managerial personnel
Technological dependency
Extent of ownership by an investor in relation to the concentration of other
shareholdings (but substantial or majority ownership of the voting stock of
an investee by another investor does not necessarily preclude the ability to
exercise significant influence by the investor).
I use these factors to investigate whether there is a difference between “nominal”
significant influence and “true” significant influence in my sample. In particular, I
collect data on the following manifestations of these factors in my sample:10
Existence of a subsidiary relationship with the affiliate either prior to or
after the application of the equity method (proxy for participation in policy-
making processes). I expect that if an investor plans to acquire an affiliate
in the future or previously had control of an affiliate, that investor is more
likely to exert “true” significant influence.
Material transactions between the equity method investor and affiliate (mea-
sured as the magnitude of eliminations from the investor’s proportionate
9 I interpret the phrase “material intra-entity transactions” in APB 18 to mean material transac-tions between the equity method investor and affiliate.
10 In future work, I plan to extend my analysis to collect data on the investor’s representation onthe board of directors and management of the affiliate. Investors are not required to disclose thisinformation in their 10-K reports, except if it is the basis for the investor’s application of the equitymethod when owning less than 20% of the affiliate. I plan to collect background information onaffiliates’ directors from the affiliates’ annual proxy statements.
61
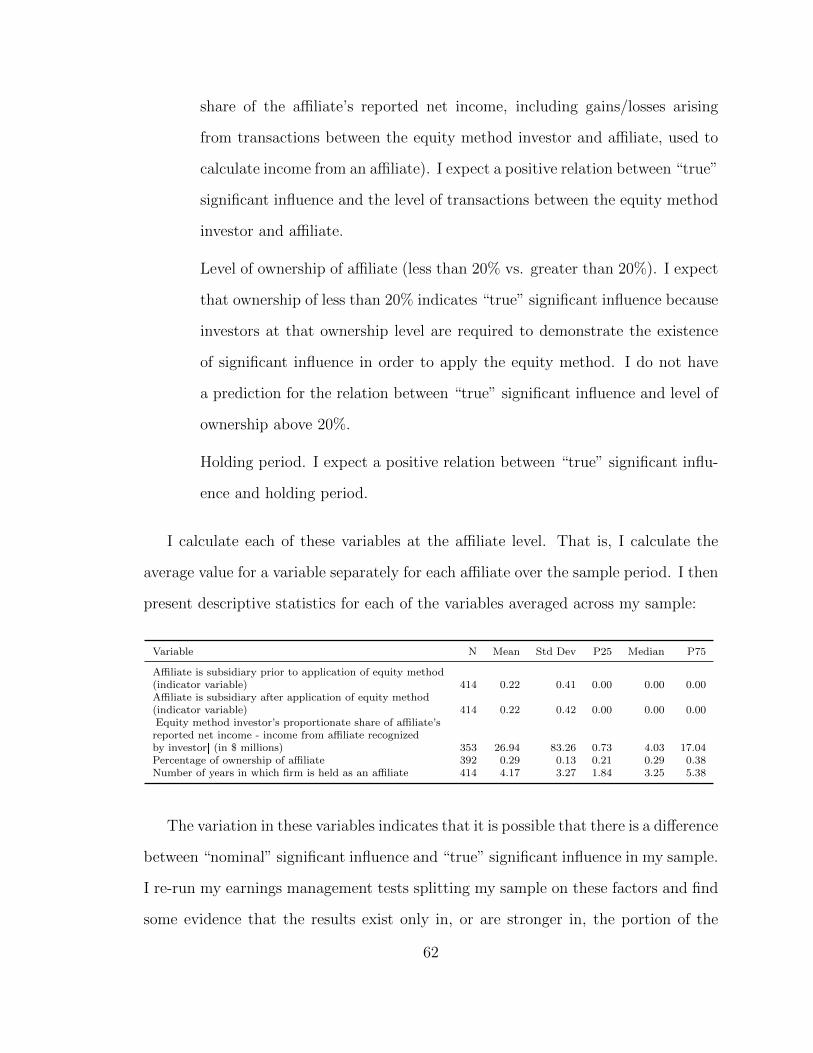
share of the affiliate’s reported net income, including gains/losses arising
from transactions between the equity method investor and affiliate, used to
calculate income from an affiliate). I expect a positive relation between “true”
significant influence and the level of transactions between the equity method
investor and affiliate.
Level of ownership of affiliate (less than 20% vs. greater than 20%). I expect
that ownership of less than 20% indicates “true” significant influence because
investors at that ownership level are required to demonstrate the existence
of significant influence in order to apply the equity method. I do not have
a prediction for the relation between “true” significant influence and level of
ownership above 20%.
Holding period. I expect a positive relation between “true” significant influ-
ence and holding period.
I calculate each of these variables at the affiliate level. That is, I calculate the
average value for a variable separately for each affiliate over the sample period. I then
present descriptive statistics for each of the variables averaged across my sample:
Variable N Mean Std Dev P25 Median P75
Affiliate is subsidiary prior to application of equity method(indicator variable) 414 0.22 0.41 0.00 0.00 0.00Affiliate is subsidiary after application of equity method(indicator variable) 414 0.22 0.42 0.00 0.00 0.00|Equity method investor’s proportionate share of affiliate’sreported net income - income from affiliate recognizedby investor| (in $ millions) 353 26.94 83.26 0.73 4.03 17.04Percentage of ownership of affiliate 392 0.29 0.13 0.21 0.29 0.38Number of years in which firm is held as an affiliate 414 4.17 3.27 1.84 3.25 5.38
The variation in these variables indicates that it is possible that there is a difference
between “nominal” significant influence and “true” significant influence in my sample.
I re-run my earnings management tests splitting my sample on these factors and find
some evidence that the results exist only in, or are stronger in, the portion of the
62
sample with “true” significant influence. As shown in Table 6.4, I find that the
earnings management results are stronger for the subsample of firms (a) that were
subsidiaries prior to becoming affiliates (p-value for test of equality of coefficients
of 0.0000), (b) with ownership percentage less than 20% (p-value of 0.0000), and
(c) with longer holding periods (p-value of 0.0001). These results are consistent
with the intuition that earnings management should be stronger for those investors
that exercise “true” significant influence. I do not find the predicted results for the
existence of a subsidiary relationship after the application of the equity method or
material transactions between the equity method investor and affiliate. It is possible
that the measure of material transactions between the equity method investor and
affiliate is too noisy to capture the effect even if one exists. This is because the
measure includes effects (e.g., treating any difference between the acquisition cost of
the investment and the investor’s share of the underlying equity in the net assets of the
affiliate as if the affiliate were a consolidated subsidiary) other than the elimination
of gains/losses arising from transactions between the equity method investor and
affiliate.
6.4.2 Differences in Earnings Management of Public Affiliates and Private Affiliates
I also consider whether there are differences in the incentives of equity method
investors to exercise significant influence over a private affiliate rather than a public
affiliate and the related implications for my earnings management findings.11 In
Chapter 6.1, I suggest that one motivation for equity method investors to choose to
11 In addition, it might be easier to exercise significant influence over the financial reporting ofan affiliate when there is a well-defined channel through which the influence can be exerted. Oneexample of a well-defined channel is overlap in the management of the equity method investor andthe affiliate (e.g., the affiliate’s CEO is appointed by/associated with the equity method investor).Unfortunately, I do not have data available to permit me to assess whether managerial overlap be-tween equity method investors and affiliates is more common for private affiliates or public affiliates.If it is the case that there is more managerial overlap for private affiliates, I would expect that it iseasier for equity method investors to manage earnings from private affiliates.
63
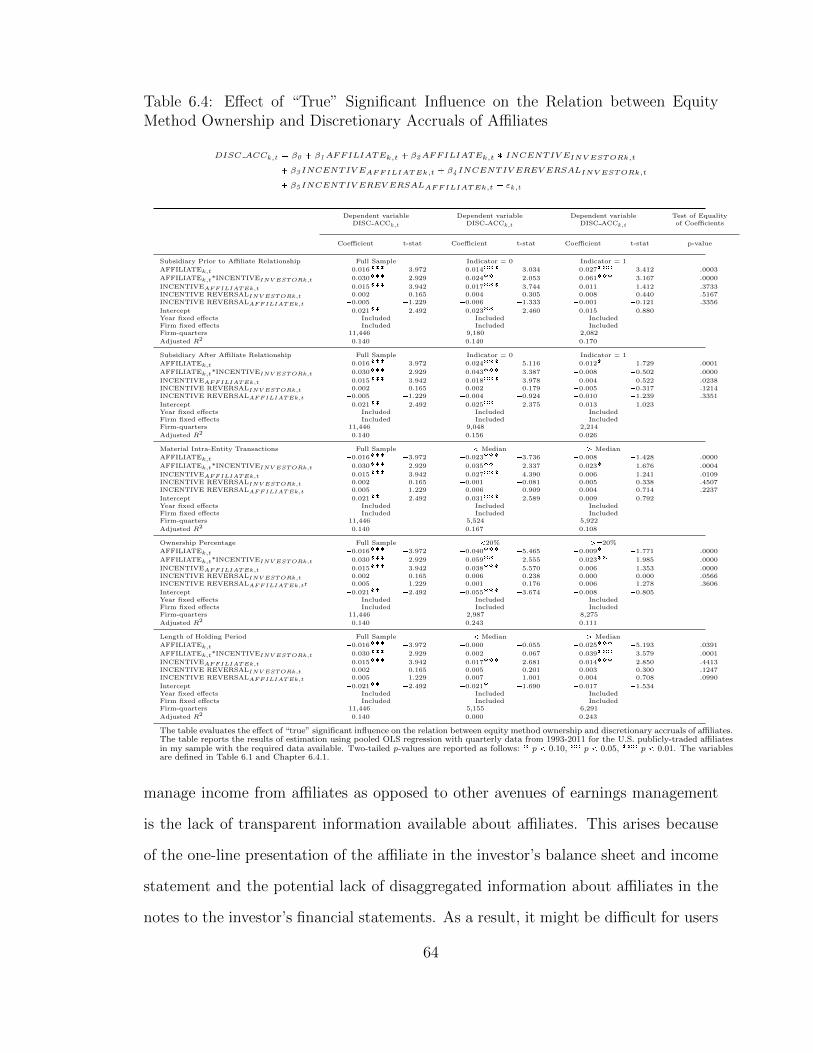
Table 6.4: Effect of “True” Significant Influence on the Relation between EquityMethod Ownership and Discretionary Accruals of Affiliates
DISC ACCk,t � β0 � β1AFFILIATEk,t � β2AFFILIATEk,t � INCENTIV EINV ESTORk,t
� β3 INCENTIV EAFFILIATEk,t � β4 INCENTIV EREV ERSALINV ESTORk,t
� β5 INCENTIV EREV ERSALAFFILIATEk,t � εk,t
Dependent variable Dependent variable Dependent variable Test of EqualityDISC ACCk,t DISC ACCk,t DISC ACCk,t of Coefficients
Coefficient t-stat Coefficient t-stat Coefficient t-stat p-value
Subsidiary Prior to Affiliate Relationship Full Sample Indicator = 0 Indicator = 1
AFFILIATEk,t �0.016��� �3.972 �0.014��� �3.034 �0.027��� �3.412 .0003
AFFILIATEk,t*INCENTIVEINV ESTORk,t 0.030��� 2.929 0.024�� 2.053 0.061��� 3.167 .0000
INCENTIVEAFFILIATEk,t 0.015��� 3.942 0.017��� 3.744 0.011 1.412 .3733INCENTIVE REVERSALINV ESTORk,t 0.002 0.165 0.004 0.305 �0.008 �0.440 .5167INCENTIVE REVERSALAFFILIATEk,t �0.005 �1.229 �0.006 �1.333 �0.001 �0.121 .3356
Intercept �0.021�� �2.492 �0.023�� �2.460 �0.015 �0.880Year fixed effects Included Included IncludedFirm fixed effects Included Included IncludedFirm-quarters 11,446 9,180 2,082
Adjusted R2 0.140 0.140 0.170
Subsidiary After Affiliate Relationship Full Sample Indicator = 0 Indicator = 1
AFFILIATEk,t �0.016��� �3.972 �0.024��� �5.116 0.012� 1.729 .0001
AFFILIATEk,t*INCENTIVEINV ESTORk,t 0.030��� 2.929 0.043��� 3.387 �0.008 �0.502 .0000
INCENTIVEAFFILIATEk,t 0.015��� 3.942 0.018��� 3.978 0.004 0.522 .0238INCENTIVE REVERSALINV ESTORk,t 0.002 0.165 0.002 0.179 �0.005 �0.317 .1214INCENTIVE REVERSALAFFILIATEk,t �0.005 �1.229 �0.004 �0.924 �0.010 �1.239 .3351
Intercept �0.021�� �2.492 �0.025�� �2.375 �0.013 �1.023Year fixed effects Included Included IncludedFirm fixed effects Included Included IncludedFirm-quarters 11,446 9,048 2,214
Adjusted R2 0.140 0.156 0.026
Material Intra-Entity Transactions Full Sample Median ¡ Median
AFFILIATEk,t �0.016��� �3.972 �0.023��� �3.736 �0.008 �1.428 .0000
AFFILIATEk,t*INCENTIVEINV ESTORk,t 0.030��� 2.929 0.035�� 2.337 0.023� 1.676 .0004
INCENTIVEAFFILIATEk,t 0.015��� 3.942 0.027��� 4.390 0.006 1.241 .0109INCENTIVE REVERSALINV ESTORk,t 0.002 0.165 �0.001 �0.081 0.005 0.338 .4507INCENTIVE REVERSALAFFILIATEk,t �0.005 �1.229 �0.006 �0.909 �0.004 �0.714 .2237
Intercept �0.021�� �2.492 �0.031��� �2.589 �0.009 �0.792Year fixed effects Included Included IncludedFirm fixed effects Included Included IncludedFirm-quarters 11,446 5,524 5,922
Adjusted R2 0.140 0.167 0.108
Ownership Percentage Full Sample 20% ¡�20%
AFFILIATEk,t �0.016��� �3.972 �0.040��� �5.465 �0.009� �1.771 .0000
AFFILIATEk,t*INCENTIVEINV ESTORk,t 0.030��� 2.929 0.059�� 2.555 0.023�� 1.985 .0000
INCENTIVEAFFILIATEk,t 0.015��� 3.942 0.038��� 5.570 0.006 1.353 .0000INCENTIVE REVERSALINV ESTORk,t 0.002 0.165 0.006 0.238 0.000 0.000 .0566INCENTIVE REVERSALAFFILIATEk,tr �0.005 �1.229 �0.001 �0.176 �0.006 �1.278 .3606
Intercept �0.021�� �2.492 �0.055��� �3.674 �0.008 �0.805Year fixed effects Included Included IncludedFirm fixed effects Included Included IncludedFirm-quarters 11,446 2,987 8,275
Adjusted R2 0.140 0.243 0.111
Length of Holding Period Full Sample Median ¡ Median
AFFILIATEk,t �0.016��� �3.972 �0.000 �0.055 �0.025��� �5.193 .0391
AFFILIATEk,t*INCENTIVEINV ESTORk,t 0.030��� 2.929 �0.002 �0.067 0.039��� 3.579 .0001
INCENTIVEAFFILIATEk,t 0.015��� 3.942 0.017��� 2.681 0.014��� 2.850 .4413INCENTIVE REVERSALINV ESTORk,t 0.002 0.165 �0.005 �0.201 0.003 0.300 .1247INCENTIVE REVERSALAFFILIATEk,t �0.005 �1.229 �0.007 �1.001 �0.004 �0.708 .0990
Intercept �0.021�� �2.492 �0.021� �1.690 �0.017 �1.534Year fixed effects Included Included IncludedFirm fixed effects Included Included IncludedFirm-quarters 11,446 5,155 6,291
Adjusted R2 0.140 0.000 0.243
The table evaluates the effect of “true” significant influence on the relation between equity method ownership and discretionary accruals of affiliates.The table reports the results of estimation using pooled OLS regression with quarterly data from 1993-2011 for the U.S. publicly-traded affiliatesin my sample with the required data available. Two-tailed p-values are reported as follows: � p 0.10, �� p 0.05, ��� p 0.01. The variablesare defined in Table 6.1 and Chapter 6.4.1.
manage income from affiliates as opposed to other avenues of earnings management
is the lack of transparent information available about affiliates. This arises because
of the one-line presentation of the affiliate in the investor’s balance sheet and income
statement and the potential lack of disaggregated information about affiliates in the
notes to the investor’s financial statements. As a result, it might be difficult for users
64

of the investor’s financial statements to identify/detect earnings management in the
affiliate.
In the case of public affiliates, this lack of transparent information provided by the
investor could be mitigated by reviewing the publicly-available financial statements
of the affiliate. Therefore, equity method investors might have a stronger incentive
to manage income from private affiliates because it would be more difficult to detect
the earnings management. In addition, it is possible that some private affiliates are
subject to less scrutiny from auditors. For example, a 50-50 joint venture with no
debt financing might not have a demand for audited financial statements. Therefore,
it might be easier to avoid detection of earnings management when no auditor is
reviewing the related financial statements of the affiliate.
An affiliate might also have its own incentives to manage its earnings. If these
incentives conflict with the investor’s desire to manage earnings, it might be more
difficult for the investor to affect the financial reporting of the affiliate. To the extent
that these incentives arise more often in public affiliates (e.g., the public affiliate
might desire to manage its earnings for an SEO), an equity method investor might be
more likely to try to manage earnings from a private affiliate than a public affiliate.
This discussion suggests that it might be easier/more likely for an equity method
investor to manage the earnings of a private affiliate than a public affiliate. I investi-
gate this issue by evaluating whether evidence of earnings management exists only for
(or is stronger for) the subsample of equity method investors with no private affiliates.
In that case, equity method investors do not have the option of using private affiliates
to manage their earnings and thus might be more likely to manage the earnings of
public affiliates.
I find some preliminary evidence to support this argument as shown in Table 6.5.
In particular, I find that the coefficient on AFFILIATEk,t * INCENTIVEINV ESTORk,t
is larger when the equity method investor does not have any private affiliates (p-value
65
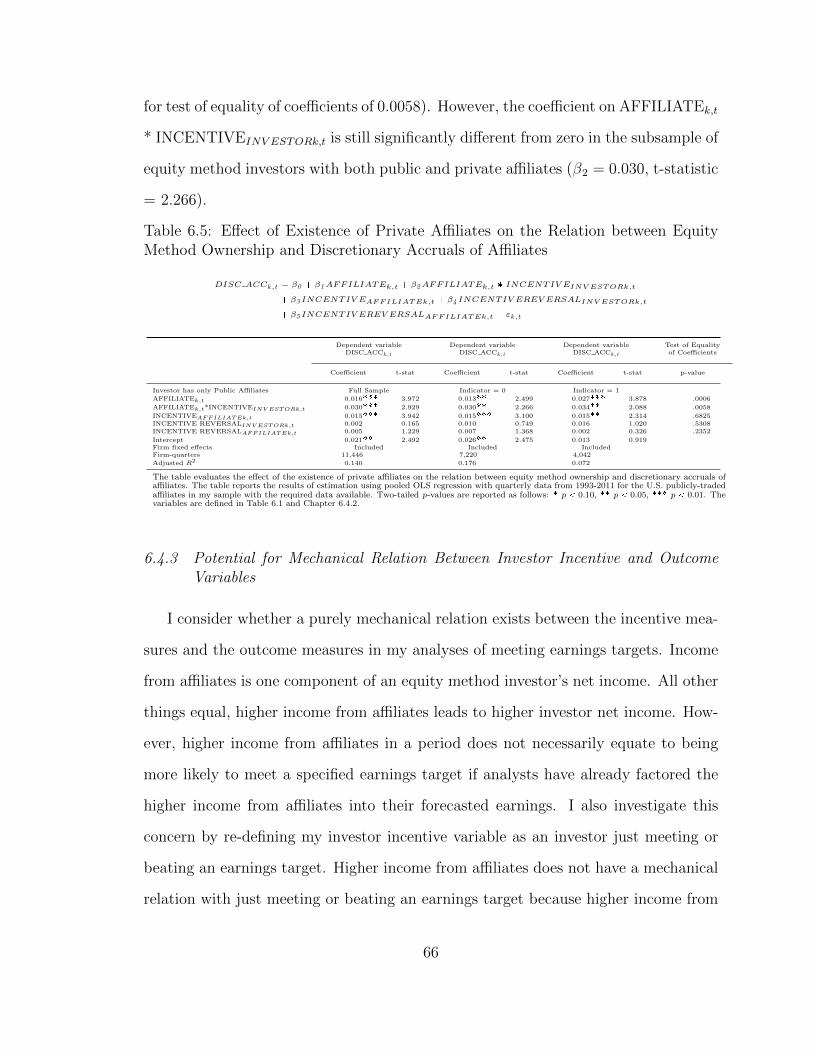
for test of equality of coefficients of 0.0058). However, the coefficient on AFFILIATEk,t
* INCENTIVEINV ESTORk,t is still significantly different from zero in the subsample of
equity method investors with both public and private affiliates (β2 = 0.030, t-statistic
= 2.266).
Table 6.5: Effect of Existence of Private Affiliates on the Relation between EquityMethod Ownership and Discretionary Accruals of Affiliates
DISC ACCk,t � β0 � β1AFFILIATEk,t � β2AFFILIATEk,t � INCENTIV EINV ESTORk,t
� β3 INCENTIV EAFFILIATEk,t � β4 INCENTIV EREV ERSALINV ESTORk,t
� β5 INCENTIV EREV ERSALAFFILIATEk,t � εk,t
Dependent variable Dependent variable Dependent variable Test of EqualityDISC ACCk,t DISC ACCk,t DISC ACCk,t of Coefficients
Coefficient t-stat Coefficient t-stat Coefficient t-stat p-value
Investor has only Public Affiliates Full Sample Indicator = 0 Indicator = 1
AFFILIATEk,t �0.016��� �3.972 �0.013�� �2.499 �0.027��� �3.878 .0006
AFFILIATEk,t*INCENTIVEINV ESTORk,t 0.030��� 2.929 0.030�� 2.266 0.034�� 2.088 .0058
INCENTIVEAFFILIATEk,t 0.015��� 3.942 0.015��� 3.100 0.015�� 2.314 .6825INCENTIVE REVERSALINV ESTORk,t 0.002 0.165 0.010 0.749 �0.016 �1.020 .5308INCENTIVE REVERSALAFFILIATEk,t �0.005 �1.229 �0.007 �1.368 �0.002 �0.326 .2352
Intercept �0.021�� �2.492 �0.026�� �2.475 �0.013 �0.919Firm fixed effects Included Included IncludedFirm-quarters 11,446 7,220 4,042
Adjusted R2 0.140 0.176 0.072
The table evaluates the effect of the existence of private affiliates on the relation between equity method ownership and discretionary accruals ofaffiliates. The table reports the results of estimation using pooled OLS regression with quarterly data from 1993-2011 for the U.S. publicly-tradedaffiliates in my sample with the required data available. Two-tailed p-values are reported as follows: � p 0.10, �� p 0.05, ��� p 0.01. Thevariables are defined in Table 6.1 and Chapter 6.4.2.
6.4.3 Potential for Mechanical Relation Between Investor Incentive and OutcomeVariables
I consider whether a purely mechanical relation exists between the incentive mea-
sures and the outcome measures in my analyses of meeting earnings targets. Income
from affiliates is one component of an equity method investor’s net income. All other
things equal, higher income from affiliates leads to higher investor net income. How-
ever, higher income from affiliates in a period does not necessarily equate to being
more likely to meet a specified earnings target if analysts have already factored the
higher income from affiliates into their forecasted earnings. I also investigate this
concern by re-defining my investor incentive variable as an investor just meeting or
beating an earnings target. Higher income from affiliates does not have a mechanical
relation with just meeting or beating an earnings target because higher income from
66
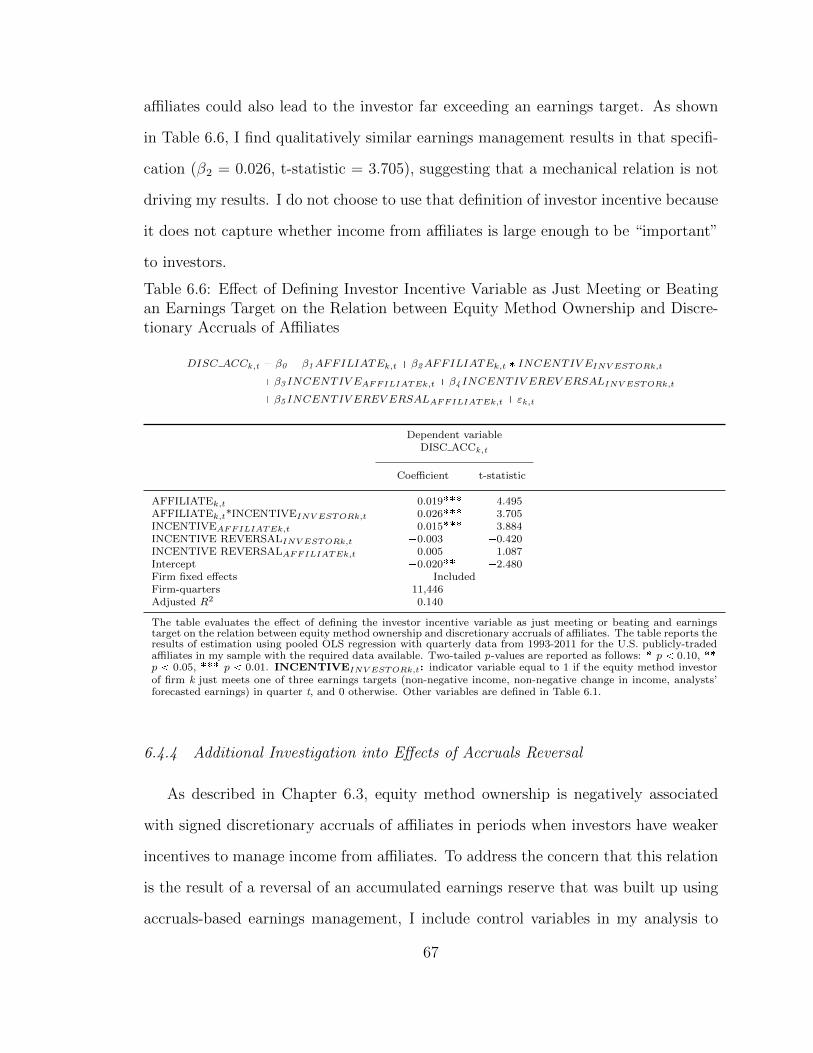
affiliates could also lead to the investor far exceeding an earnings target. As shown
in Table 6.6, I find qualitatively similar earnings management results in that specifi-
cation (β2 = 0.026, t-statistic = 3.705), suggesting that a mechanical relation is not
driving my results. I do not choose to use that definition of investor incentive because
it does not capture whether income from affiliates is large enough to be “important”
to investors.
Table 6.6: Effect of Defining Investor Incentive Variable as Just Meeting or Beatingan Earnings Target on the Relation between Equity Method Ownership and Discre-tionary Accruals of Affiliates
DISC ACCk,t � β0 � β1AFFILIATEk,t � β2AFFILIATEk,t � INCENTIV EINV ESTORk,t
� β3 INCENTIV EAFFILIATEk,t � β4 INCENTIV EREV ERSALINV ESTORk,t
� β5 INCENTIV EREV ERSALAFFILIATEk,t � εk,t
Dependent variableDISC ACCk,t
Coefficient t-statistic
AFFILIATEk,t �0.019��� �4.495AFFILIATEk,t*INCENTIVEINV ESTORk,t 0.026��� 3.705INCENTIVEAFFILIATEk,t 0.015��� 3.884INCENTIVE REVERSALINV ESTORk,t �0.003 �0.420INCENTIVE REVERSALAFFILIATEk,t �0.005 �1.087Intercept �0.020�� �2.480Firm fixed effects IncludedFirm-quarters 11,446Adjusted R2 0.140
The table evaluates the effect of defining the investor incentive variable as just meeting or beating and earningstarget on the relation between equity method ownership and discretionary accruals of affiliates. The table reports theresults of estimation using pooled OLS regression with quarterly data from 1993-2011 for the U.S. publicly-tradedaffiliates in my sample with the required data available. Two-tailed p-values are reported as follows: � p 0.10, ��
p 0.05, ��� p 0.01. INCENTIVEINV ESTORk,t: indicator variable equal to 1 if the equity method investorof firm k just meets one of three earnings targets (non-negative income, non-negative change in income, analysts’forecasted earnings) in quarter t, and 0 otherwise. Other variables are defined in Table 6.1.
6.4.4 Additional Investigation into Effects of Accruals Reversal
As described in Chapter 6.3, equity method ownership is negatively associated
with signed discretionary accruals of affiliates in periods when investors have weaker
incentives to manage income from affiliates. To address the concern that this relation
is the result of a reversal of an accumulated earnings reserve that was built up using
accruals-based earnings management, I include control variables in my analysis to
67
capture the expected reversal period of any build-up of discretionary accruals. I
also consider the behavior of discretionary accruals for the portion of my sample that
never has an equity method investor with a non-zero incentive variable (189 out of 250
affiliates with required data available). In this subsample, there is still a negative and
statistically significant relation between equity method ownership and discretionary
accruals of affiliates (see Table 6.7; β1 = -0.018, t-statistic = -3.516). This suggests
that some factor other than accruals reversal is driving the negative relation between
equity method ownership and discretionary accruals of affiliates.
6.4.5 Other Potential Methods of Managing Earnings from Investments in Affiliates
I also examine whether there are opportunities for equity method investors to man-
age earnings related to investments in affiliates other than influencing discretionary
accruals.12
Small changes in ownership around 20%
As noted above, there is a presumption in APB 18 that, absent evidence to the
contrary, an investment of 20% or more indicates the ability to exercise significant and
an investment of less than 20% indicates a lack of significant influence unless such
influence can be demonstrated. Therefore, if an investor were purely applying the
12 A potential channel for earnings management is the original measurement of individual affili-ate assets and liabilities at fair value. These individual measurements are not observable in theinvestor’s financial statements. Individual assets and liabilities of the affiliate (including goodwill)are not tested for impairment and thus reducing potential future impairment losses is not a reasonto manipulate original measurements of assets and liabilities. However, any difference between theacquisition cost of the investment and the investor’s share of the underlying equity in the net assetsof the affiliate is treated as if the affiliate were a consolidated subsidiary. Prior to the issuance ofSFAS 142, Goodwill and Other Intangible Assets, the residual was treated like purchased goodwilland amortized. Therefore, there might have been an incentive for investors to reduce the amount ofgoodwill recognized as much as possible to mitigate goodwill amortization charges in future periods.Since the issuance of SFAS 142, investors might try to increase the amount of goodwill recognizedas much as possible and lower the fair values assigned to other depreciable assets (e.g., property,plant, and equipment that will be depreciated in the investor’s financial statements based on theassigned fair value at the time of the equity method acquisition). Unfortunately, I cannot observethese potential effects using publicly-available data.
68
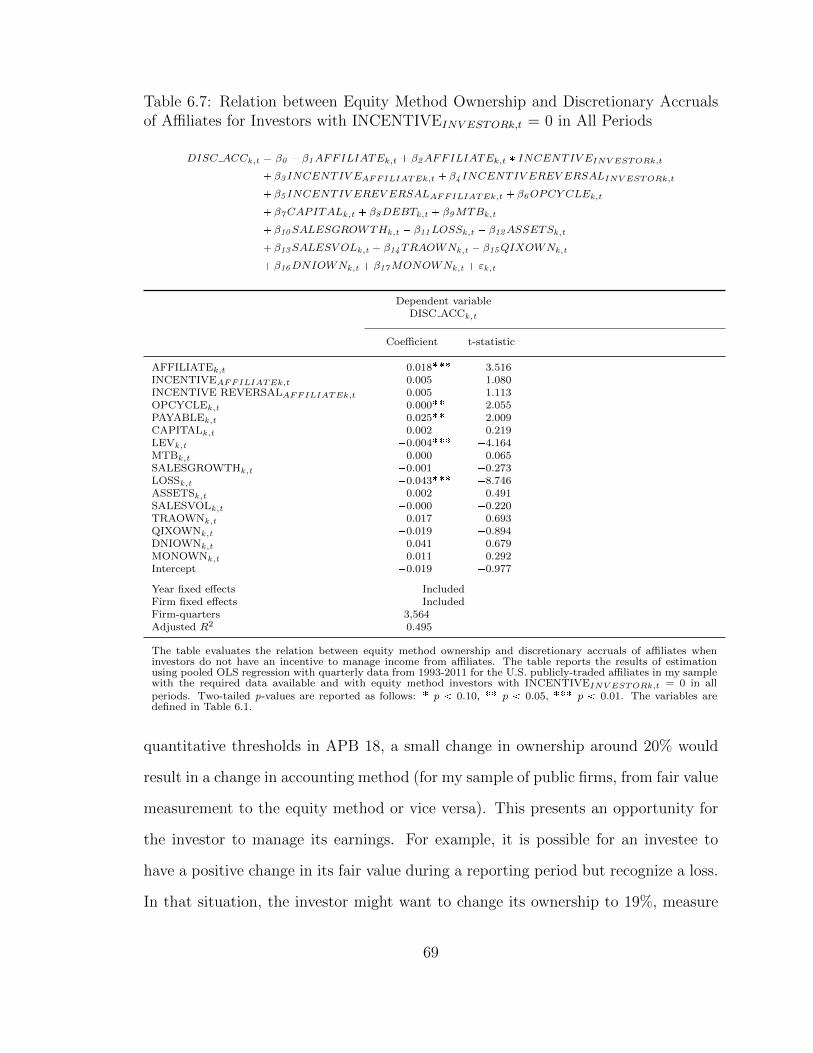
Table 6.7: Relation between Equity Method Ownership and Discretionary Accrualsof Affiliates for Investors with INCENTIVEINV ESTORk,t = 0 in All Periods
DISC ACCk,t � β0 � β1AFFILIATEk,t � β2AFFILIATEk,t � INCENTIV EINV ESTORk,t
� β3 INCENTIV EAFFILIATEk,t � β4 INCENTIV EREV ERSALINV ESTORk,t
� β5 INCENTIV EREV ERSALAFFILIATEk,t � β6OPCY CLEk,t
� β7CAPITALk,t � β8DEBTk,t � β9MTBk,t
� β10SALESGROWTHk,t � β11LOSSk,t � β12ASSETSk,t
� β13SALESV OLk,t � β14TRAOWNk,t � β15QIXOWNk,t
� β16DNIOWNk,t � β17MONOWNk,t � εk,t
Dependent variableDISC ACCk,t
Coefficient t-statistic
AFFILIATEk,t �0.018��� �3.516INCENTIVEAFFILIATEk,t 0.005 1.080INCENTIVE REVERSALAFFILIATEk,t �0.005 �1.113OPCYCLEk,t �0.000�� �2.055PAYABLEk,t 0.025�� 2.009CAPITALk,t 0.002 0.219LEVk,t �0.004��� �4.164MTBk,t �0.000 �0.065SALESGROWTHk,t �0.001 �0.273LOSSk,t �0.043��� �8.746ASSETSk,t 0.002 0.491SALESVOLk,t �0.000 �0.220TRAOWNk,t 0.017 0.693QIXOWNk,t �0.019 �0.894DNIOWNk,t 0.041 0.679MONOWNk,t �0.011 �0.292Intercept �0.019 �0.977
Year fixed effects IncludedFirm fixed effects IncludedFirm-quarters 3,564Adjusted R2 0.495
The table evaluates the relation between equity method ownership and discretionary accruals of affiliates wheninvestors do not have an incentive to manage income from affiliates. The table reports the results of estimationusing pooled OLS regression with quarterly data from 1993-2011 for the U.S. publicly-traded affiliates in my samplewith the required data available and with equity method investors with INCENTIVEINV ESTORk,t = 0 in allperiods. Two-tailed p-values are reported as follows: � p 0.10, �� p 0.05, ��� p 0.01. The variables aredefined in Table 6.1.
quantitative thresholds in APB 18, a small change in ownership around 20% would
result in a change in accounting method (for my sample of public firms, from fair value
measurement to the equity method or vice versa). This presents an opportunity for
the investor to manage its earnings. For example, it is possible for an investee to
have a positive change in its fair value during a reporting period but recognize a loss.
In that situation, the investor might want to change its ownership to 19%, measure
69
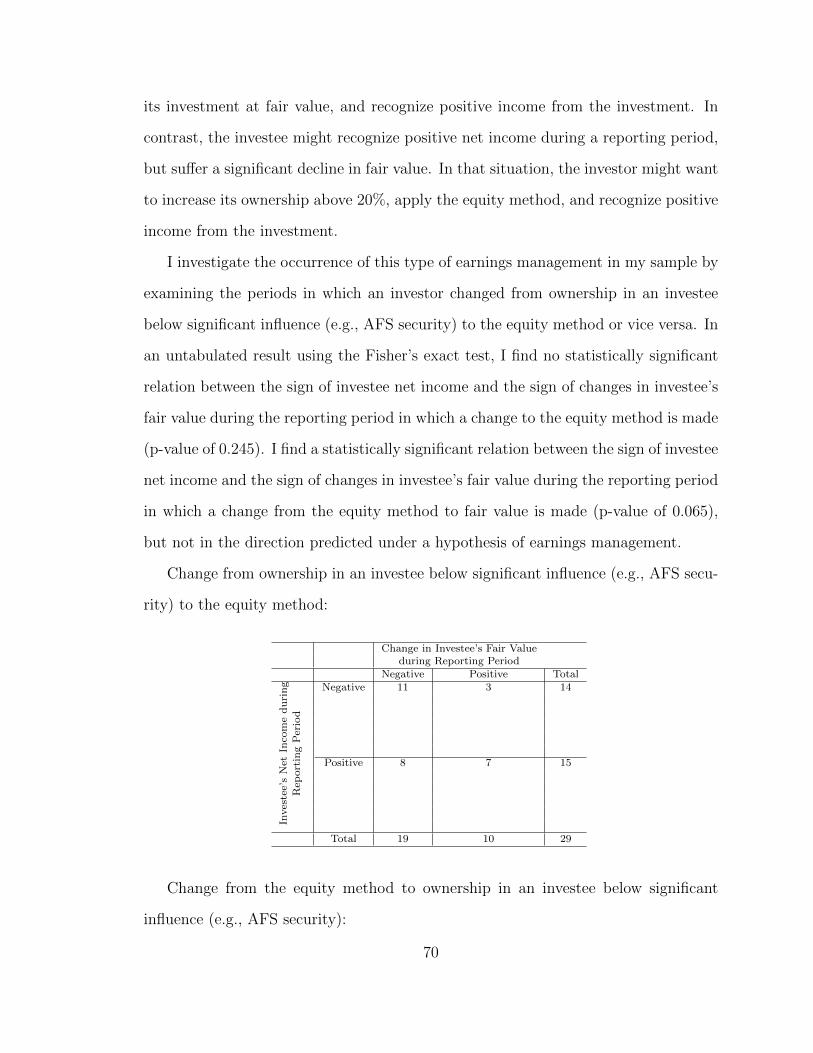
its investment at fair value, and recognize positive income from the investment. In
contrast, the investee might recognize positive net income during a reporting period,
but suffer a significant decline in fair value. In that situation, the investor might want
to increase its ownership above 20%, apply the equity method, and recognize positive
income from the investment.
I investigate the occurrence of this type of earnings management in my sample by
examining the periods in which an investor changed from ownership in an investee
below significant influence (e.g., AFS security) to the equity method or vice versa. In
an untabulated result using the Fisher’s exact test, I find no statistically significant
relation between the sign of investee net income and the sign of changes in investee’s
fair value during the reporting period in which a change to the equity method is made
(p-value of 0.245). I find a statistically significant relation between the sign of investee
net income and the sign of changes in investee’s fair value during the reporting period
in which a change from the equity method to fair value is made (p-value of 0.065),
but not in the direction predicted under a hypothesis of earnings management.
Change from ownership in an investee below significant influence (e.g., AFS secu-
rity) to the equity method:
Change in Investee’s Fair Valueduring Reporting Period
Negative Positive Total
Inves
tee’
sN
etIn
com
ed
uri
ng
Rep
ort
ing
Per
iod
Negative 11 3 14
Positive 8 7 15
Total 19 10 29
Change from the equity method to ownership in an investee below significant
influence (e.g., AFS security):
70
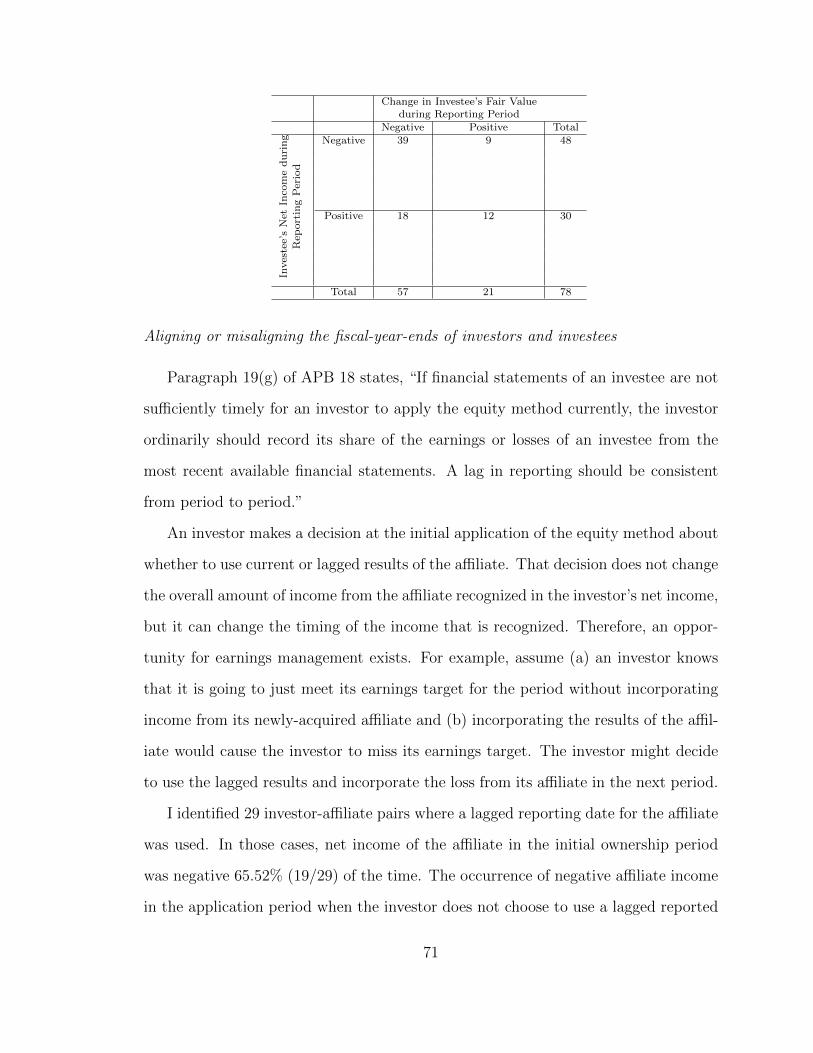
Change in Investee’s Fair Valueduring Reporting Period
Negative Positive Total
Inves
tee’
sN
etIn
com
ed
uri
ng
Rep
ort
ing
Per
iod
Negative 39 9 48
Positive 18 12 30
Total 57 21 78
Aligning or misaligning the fiscal-year-ends of investors and investees
Paragraph 19(g) of APB 18 states, “If financial statements of an investee are not
sufficiently timely for an investor to apply the equity method currently, the investor
ordinarily should record its share of the earnings or losses of an investee from the
most recent available financial statements. A lag in reporting should be consistent
from period to period.”
An investor makes a decision at the initial application of the equity method about
whether to use current or lagged results of the affiliate. That decision does not change
the overall amount of income from the affiliate recognized in the investor’s net income,
but it can change the timing of the income that is recognized. Therefore, an oppor-
tunity for earnings management exists. For example, assume (a) an investor knows
that it is going to just meet its earnings target for the period without incorporating
income from its newly-acquired affiliate and (b) incorporating the results of the affil-
iate would cause the investor to miss its earnings target. The investor might decide
to use the lagged results and incorporate the loss from its affiliate in the next period.
I identified 29 investor-affiliate pairs where a lagged reporting date for the affiliate
was used. In those cases, net income of the affiliate in the initial ownership period
was negative 65.52% (19/29) of the time. The occurrence of negative affiliate income
in the application period when the investor does not choose to use a lagged reported
71
period was 62.24% (305/490). An untabulated Fisher’s exact test suggests that there
is no association between the incidence of negative net income of the affiliate and
the decision to use a lagged reporting date (p-value = .844). This suggests that the
alignment of fiscal year ends does not seem to be a tool for earnings management.
6.4.6 Reverse Causality/Endogeneity
My results are consistent with equity method investors influencing affiliates to
report lower signed discretionary accruals. It is possible instead that firms with lower
signed discretionary accruals attract equity method investors (a reverse causality
explanation). I investigate the change in signed discretionary accruals in the period
prior to equity method ownership. In an untabulated result, I find that there is
no change in the signed discretionary accruals (p-value = 0.341) of affiliates in the
year prior to equity method ownership. This result mitigates concerns about reverse
causality.
It is also possible that unidentified characteristics of the firms in my sample are
correlated with signed discretionary accruals and also make them attractive equity
method investments. My within-firm research design mitigates this issue by showing
discretionary accruals are lower in periods when a firm is an affiliate relative to periods
when a firm is not an affiliate.13
6.4.7 Effect of Equity Method Ownership on Accounting Conservatism of Affiliates
As noted in Chapter 6.3, I find that equity method ownership is negatively as-
sociated with signed discretionary accruals of affiliates when investors have weaker
incentives to manage income from affiliates. I suggest that this result is consistent
with the effects of monitoring by large shareholders, but do not further explore or
13 Another way to mitigate concerns about endogeneity would be use a two-stage test with adeterminant model for equity method investments as the first stage. However, there is no well-defineddeterminant model for equity method investments in the literature. I am considering developing sucha model as an extension to my paper.
72
isolate the cause of the negative association. In this section, I examine another
manifestation of monitoring studied in the large shareholder literature: accounting
conservatism. Previous research suggests that “monitoring” shareholders demand ac-
counting conservatism because it provides more timely indications of bad news, which
allows shareholders to influence management’s decisions and/or discipline manage-
ment earlier (e.g., Watts (2003), Chen et al. (2009), Ahmed and Duellman (2011),
Ramalingegowda and Yu (2012)).
Accounting conservatism and earnings management are related in that both vio-
late the concept of neutrality from Chapter 3, Qualitative Characteristics of Useful
Financial Information, of the FASB’s Conceptual Framework. Paragraph QC14 of
SFAC No. 8 states, “A neutral depiction is without bias in the selection or presen-
tation of financial information. A neutral depiction is not slanted, weighted, em-
phasized, deemphasized, or otherwise manipulated to increase the probability that
financial information will be received favorably or unfavorably by users.” The Basis
for Conclusions (para. BC3.27) explicitly explains that conservatism is not included
as an aspect of faithful representation because it would be inconsistent with neutral-
ity. My earnings management tests focus on biasing reported results by increasing
reported performance, while accounting conservatism decreases reported performance.
However, an equity method investor might not need to rely on public financial
reports in the same way as other investors (e.g., institutional investors) studied in the
large shareholder literature. By definition, an equity method investor has “significant
influence” over the operating and financial policies of an affiliate. This implies that
equity method investors have access to information necessary to affect operating and
financial decisions of affiliates. Such information likely is not available through public
financial reporting channels. Therefore, I might not expect to find a positive relation
between equity method ownership and accounting conservatism of affiliates.
I follow prior research examining the relation between accounting conservatism
73

and ownership characteristics (e.g., Ramalingegowda and Yu (2012)) by using the
Basu (1997) model, modified as follows:
NIk ,t � β0 � β1NEGk ,t � β2RETk ,t � β3RETk ,t �NEGk ,t � β4AFFILIATEk ,t
� β5NEGk ,t � AFFILIATEk ,t � β6RETk ,t � AFFILIATEk ,t
� β7RETk ,t �NEGk ,t � AFFILIATEk ,t � β8�17CONTROLSk ,t�1
� β18�27NEGk ,t � CONTROLSk ,t�1 � β28�37RETk ,t � CONTROLSk ,t�1
� β38�47RETk ,t �NEGk ,t � CONTROLSk ,t�1 � εk ,t(6.5)
where:
NIk ,t : income before extraordinary items (IBQ) of firm k in quarter t, scaled
by the market value of equity (CSHOQ*PRCCQ) at the end of quarter t - 1;
NEGk ,t : indicator variable equal to 1 if RETk ,t is negative, and 0 otherwise;
RETk ,t : buy-and-hold stock returns of firm k over quarter t;
AFFILIATEk,t: an indicator variable equal to 1 if firm k is an affiliate (i.e.,
has an owner using the equity method to account for its investment in firm
k) in quarter t, and 0 otherwise;
MONOWNk ,t�1 : percentage ownership of firm k at the end of quarter t - 1
by institutional investors described as monitoring institutions in Ramalinge-
gowda and Yu (2012) based on classification as dedicated by Bushee (2001)
and independent by Brickley et al. (1988);
TRAOWNk ,t�1 : percentage ownership of firm k at the end of quarter t - 1
by institutional investors described as transient by Bushee (2001);
QIXOWNk ,t�1 : percentage ownership of firm k at the end of quarter t - 1 by
institutional investors described as quasi-indexing by Bushee (2001);
74
DNIOWNk ,t�1 : percentage ownership of firm k at the end of quarter t - 1
by institutional investors described as dedicated by Bushee (2001) and non-
independent by Brickley et al. (1988);
STD RETk ,t�1 : standard deviation of daily stock returns of firm k over quar-
ter t - 1;
AGEk ,t�1 : age of firm k at the end of quarter t - 1, measured as the number
of years a firm is listed on Compustat;
MVEk ,t�1 : market value of equity (CSHOQ*PRCCQ) of firm k at the end of
quarter t - 1;
MTBk ,t�1 : market-to-book ratio (MVE/CEQQ) of firm k at the end of quar-
ter t - 1;
LEVk ,t�1 : leverage ((DLTTQ + DLCQ)/MVE) of firm k at the end of quarter
t - 1; and
LITk ,t�1 : indicator variable equal to 1 if firm k is in one of the following
industries at the end of quarter t - 1: biotechnology (SIC codes 2833-2836
and 8731-8734), computers (SIC codes 3570-3577 and 7370-7374), electronics
(SIC codes 3600-3674), and retail (SIC codes 5200-5990), and 0 otherwise.
I estimate Equation 6.5 using pooled OLS regression for all firm-quarters from
1993-2011 for the U.S. publicly-traded affiliates in my sample with the required data
available. I winsorize all variables at the 1st and 99th percentiles and include year
and firm fixed effects in the regression. The estimation results are reported in Table
6.8. The coefficient on RETk ,t * NEGk ,t * AFFILIATEk,t is positive (β7 = 0.112,
t-statistic = 3.830 for model without control variables; β7= 0.123, t-statistic = 3.288
for model with control variables), indicating a positive association between equity
method ownership and the incremental timeliness of earnings with respect to bad
75

news. This result is consistent with the view, expressed by Ramalingegowda and Yu
(2012) and others, that large shareholders use conservative financial reporting to assist
them in monitoring/disciplining management by providing more timely indications
of bad news.
76
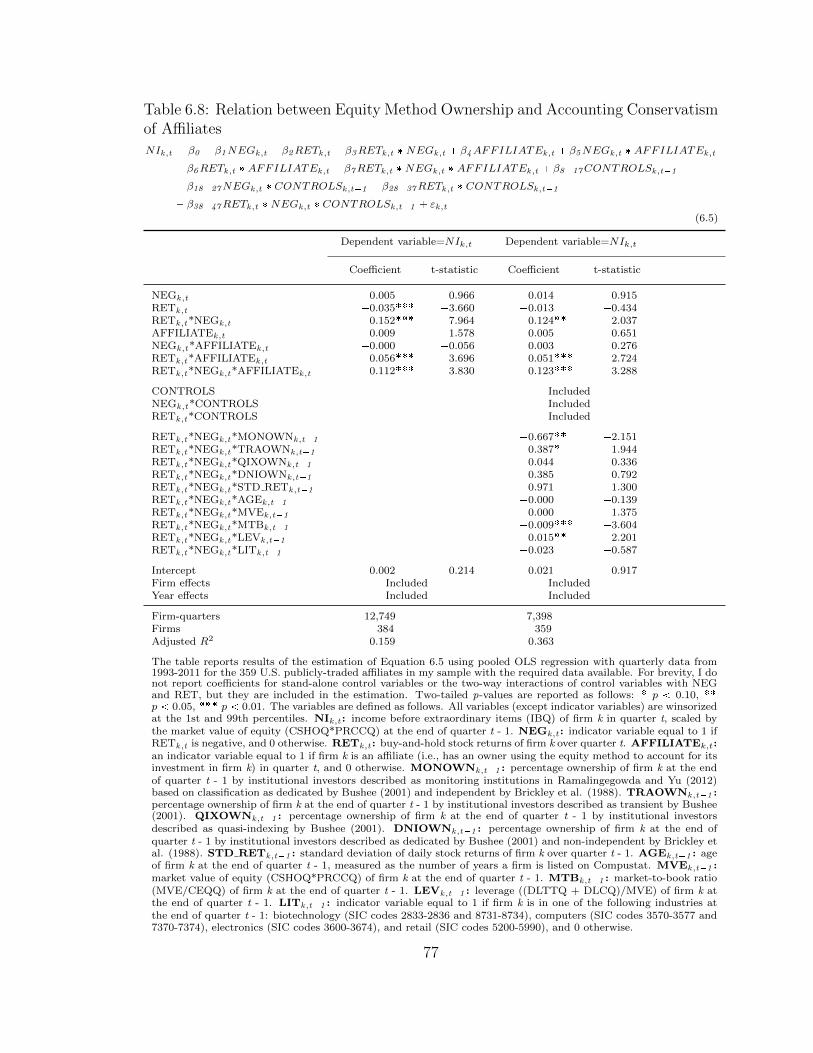
Table 6.8: Relation between Equity Method Ownership and Accounting Conservatismof Affiliates
NIk,t � β0 � β1NEGk,t � β2RETk,t � β3RETk,t �NEGk,t � β4AFFILIATEk,t � β5NEGk,t �AFFILIATEk,t
� β6RETk,t �AFFILIATEk,t � β7RETk,t �NEGk,t �AFFILIATEk,t � β8�17CONTROLSk,t�1
� β18�27NEGk,t � CONTROLSk,t�1 � β28�37RETk,t � CONTROLSk,t�1
� β38�47RETk,t �NEGk,t � CONTROLSk,t�1 � εk,t(6.5)
Dependent variable=NIk,t Dependent variable=NIk,t
Coefficient t-statistic Coefficient t-statistic
NEGk,t 0.005 0.966 0.014 0.915RETk,t �0.035��� �3.660 �0.013 �0.434RETk,t*NEGk,t 0.152��� 7.964 0.124�� 2.037AFFILIATEk,t 0.009 1.578 0.005 0.651NEGk,t*AFFILIATEk,t �0.000 �0.056 0.003 0.276RETk,t*AFFILIATEk,t �0.056��� �3.696 �0.051��� �2.724RETk,t*NEGk,t*AFFILIATEk,t 0.112��� 3.830 0.123��� 3.288
CONTROLS IncludedNEGk,t*CONTROLS IncludedRETk,t*CONTROLS Included
RETk,t*NEGk,t*MONOWNk,t�1 �0.667�� �2.151RETk,t*NEGk,t*TRAOWNk,t�1 �0.387� �1.944RETk,t*NEGk,t*QIXOWNk,t�1 0.044 0.336RETk,t*NEGk,t*DNIOWNk,t�1 �0.385 �0.792RETk,t*NEGk,t*STD RETk,t�1 0.971 1.300RETk,t*NEGk,t*AGEk,t�1 �0.000 �0.139RETk,t*NEGk,t*MVEk,t�1 �0.000 �1.375RETk,t*NEGk,t*MTBk,t�1 �0.009��� �3.604RETk,t*NEGk,t*LEVk,t�1 0.015�� 2.201RETk,t*NEGk,t*LITk,t�1 �0.023 �0.587
Intercept �0.002 �0.214 0.021 0.917Firm effects Included IncludedYear effects Included Included
Firm-quarters 12,749 7,398Firms 384 359Adjusted R2 0.159 0.363
The table reports results of the estimation of Equation 6.5 using pooled OLS regression with quarterly data from1993-2011 for the 359 U.S. publicly-traded affiliates in my sample with the required data available. For brevity, I donot report coefficients for stand-alone control variables or the two-way interactions of control variables with NEGand RET, but they are included in the estimation. Two-tailed p-values are reported as follows: � p 0.10, ��
p 0.05, ��� p 0.01. The variables are defined as follows. All variables (except indicator variables) are winsorizedat the 1st and 99th percentiles. NIk,t : income before extraordinary items (IBQ) of firm k in quarter t, scaled bythe market value of equity (CSHOQ*PRCCQ) at the end of quarter t - 1. NEGk,t : indicator variable equal to 1 ifRETk,t is negative, and 0 otherwise. RETk,t : buy-and-hold stock returns of firm k over quarter t. AFFILIATEk,t:an indicator variable equal to 1 if firm k is an affiliate (i.e., has an owner using the equity method to account for itsinvestment in firm k) in quarter t, and 0 otherwise. MONOWNk,t�1 : percentage ownership of firm k at the endof quarter t - 1 by institutional investors described as monitoring institutions in Ramalingegowda and Yu (2012)based on classification as dedicated by Bushee (2001) and independent by Brickley et al. (1988). TRAOWNk,t�1 :percentage ownership of firm k at the end of quarter t - 1 by institutional investors described as transient by Bushee(2001). QIXOWNk,t�1 : percentage ownership of firm k at the end of quarter t - 1 by institutional investorsdescribed as quasi-indexing by Bushee (2001). DNIOWNk,t�1 : percentage ownership of firm k at the end ofquarter t - 1 by institutional investors described as dedicated by Bushee (2001) and non-independent by Brickley etal. (1988). STD RETk,t�1 : standard deviation of daily stock returns of firm k over quarter t - 1. AGEk,t�1 : ageof firm k at the end of quarter t - 1, measured as the number of years a firm is listed on Compustat. MVEk,t�1 :market value of equity (CSHOQ*PRCCQ) of firm k at the end of quarter t - 1. MTBk,t�1 : market-to-book ratio(MVE/CEQQ) of firm k at the end of quarter t - 1. LEVk,t�1 : leverage ((DLTTQ + DLCQ)/MVE) of firm k atthe end of quarter t - 1. LITk,t�1 : indicator variable equal to 1 if firm k is in one of the following industries atthe end of quarter t - 1: biotechnology (SIC codes 2833-2836 and 8731-8734), computers (SIC codes 3570-3577 and7370-7374), electronics (SIC codes 3600-3674), and retail (SIC codes 5200-5990), and 0 otherwise.
77
7
Link between Value Relevance and EarningsManagement
At a conceptual level, the value relevance and earnings management tests in my
paper are linked because both address the decision usefulness of the equity method
of accounting as described in Chapter 3, Qualitative Characteristics of Useful Fi-
nancial Information, of the FASB’s Conceptual Framework. In particular, the value
relevance tests can be thought of as a joint test of the relevance and representational
faithfulness of information provided by measuring investments in affiliates under the
equity method or at fair value. The earnings management tests are an investigation
of the neutrality of information reported by equity method investors, which is one
component of representational faithfulness.
I also investigate whether there is an empirical link between my value relevance
and earnings management tests. In particular, I examine whether the existence of
an incentive for investors to manage income from affiliates affects the valuation co-
efficients of income reported under the equity method. As shown in Table 7.1, I do
not find evidence of differences in valuation coefficients in my main value relevance
specification depending on the incentives of investors to manage earnings (coefficients
78
on interaction terms all indistinguishable from zero). I then refine the analysis based
on the discussion in Chapter 6.4.2 that it might be more likely for an equity method
investor to manage the earnings of a private affiliate than a public affiliate.1 In par-
ticular, if investors believe that a firm with significant influence might manage income
from private affiliates more than income from public affiliates, we might expect the
valuation coefficients on amounts reported under the equity method to be smaller for
private affiliates than public affiliates. As shown in Table 7.2, I do not find significant
differences in the coefficients for the balance sheet and income statement amounts
reported under the equity method for private and public affiliates (p-value of 0.3769
for test of equality of BVprivateaffiliatej ,t = BVpublicaffiliatej ,t ; p-value of 0.4328 for test of
equality of INCprivateaffiliatej ,t = INCpublicaffiliatej ,t). However, I do find that when in-
vestors have an incentive to manage income from affiliates, the valuation coefficient on
income from private affiliates is lower (coefficient on INCprivateaffiliatej ,t * EARNINGS
MGMTj ,t = -6.676, t-statistic = -2.161). One explanation is that investors under-
stand the incentive and ability of firms with significant influence to manage income
from private affiliates and therefore adjust the valuation of that income accordingly.
1 I also investigate whether there are differences in valuation coefficients based on the lengthof holding period since I find that equity method investors with longer holding periods also havestronger earnings management results (see Chapter 6.4.1). In an untabulated result, I do not finddifferences in any valuation coefficients based on length of holding period.
79

Table 7.1: Effect of Earnings Management by Investors on the Relation betweenInvestors’ Stock Prices and Balance Sheet and Income Measures of Investments inAffiliates
MVEj ,t � β0 � β1BVotherj ,t � β2BVpublicaffiliatej ,t � β3FV � BVpublicaffiliatej ,t � β4 INCotherj ,t
� β5 INCpublicaffiliatej ,t � β6FV INC � INCpublicaffiliatej ,t � εj ,t(5.1)
Dependent variable = MVEj ,t Dependent variable = MVEj ,t
Coefficient t-value Coefficient t-value
BVotherj ,t 0.774��� 10.092 0.746��� 9.516BVotherj ,t * EARNINGS MGMTj ,t 0.115 1.100BVpublicaffiliatej ,t 1.113��� 3.673 1.107��� 3.572BVpublicaffiliatej ,t * EARNINGS MGMTj ,t �0.391 �0.687FV-BVpublicaffiliatej ,t 0.712��� 3.726 0.750��� 3.705FV-BVpublicaffiliatej ,t * EARNINGS MGMTj ,t �0.085 �0.225INCotherj ,t 0.811��� 4.285 0.824��� 4.131INCotherj ,t * EARNINGS MGMTj ,t 0.112 0.200INCpublicaffiliatej ,t 2.132 1.591 1.066 0.629INCpublicaffiliatej ,t * EARNINGS MGMTj ,t 3.577 1.040FVINC-INCpublicaffiliatej ,t 0.396�� 2.186 0.264 1.335FVINC-INCpublicaffiliatej ,t * EARNINGS MGMTj ,t i 0.679 1.355EARNINGS MGMTj ,t 0.028 0.013Intercept 14.408��� 5.560 14.640��� 5.586
Year fixed effects Included IncludedFirm fixed effects Included IncludedFirm-years 857 857Adjusted R2 0.828 0.828
The table incorporates into Equation 5.1 the effect of investors’ incentives to manage income from affiliates. EARNINGSMGMTj ,t : indicator variable equal to 1 if income from affiliates causes firm j to meet one of three earnings targets(non-negative income, non-negative change in income, analysts’ forecasted earnings) in year t, and 0 otherwise. Additional
variables are defined in Table 5.1. Two-tailed p-values are reported as follows: � p 0.10, �� p 0.05, ��� p 0.01.
80
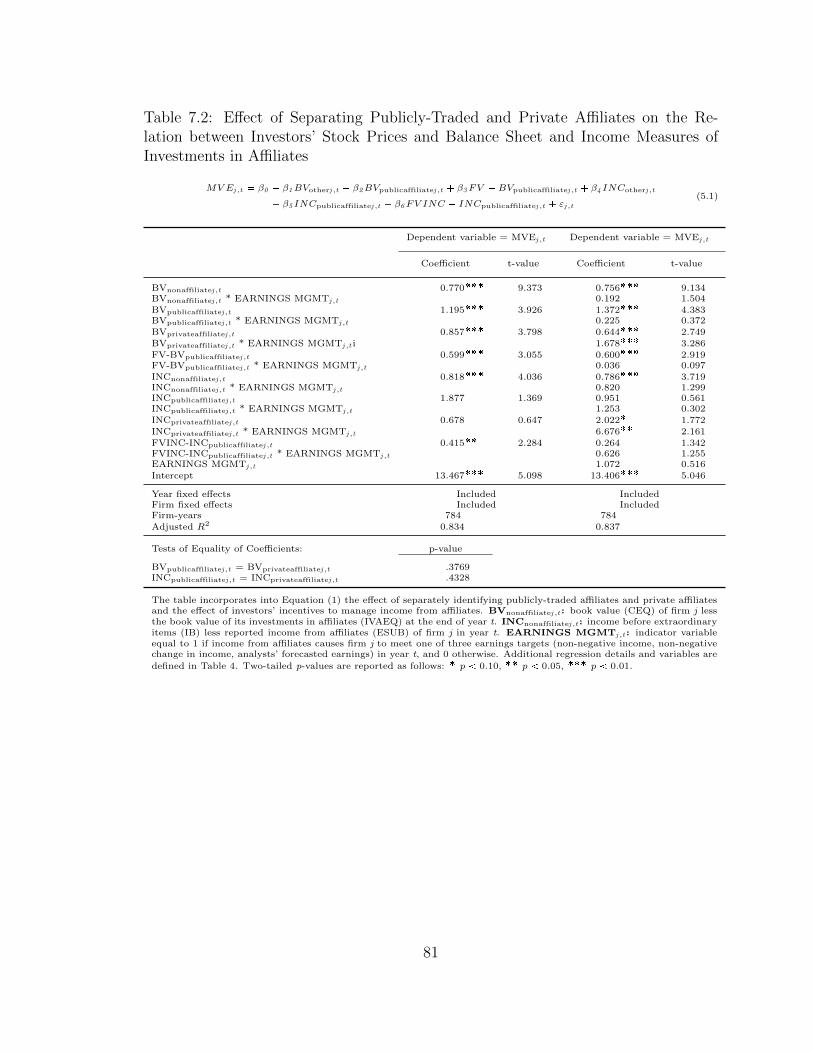
Table 7.2: Effect of Separating Publicly-Traded and Private Affiliates on the Re-lation between Investors’ Stock Prices and Balance Sheet and Income Measures ofInvestments in Affiliates
MVEj ,t � β0 � β1BVotherj ,t � β2BVpublicaffiliatej ,t � β3FV � BVpublicaffiliatej ,t � β4 INCotherj ,t
� β5 INCpublicaffiliatej ,t � β6FV INC � INCpublicaffiliatej ,t � εj ,t(5.1)
Dependent variable = MVEj ,t Dependent variable = MVEj ,t
Coefficient t-value Coefficient t-value
BVnonaffiliatej ,t 0.770��� 9.373 0.756��� 9.134BVnonaffiliatej ,t * EARNINGS MGMTj ,t �0.192 �1.504BVpublicaffiliatej ,t 1.195��� 3.926 1.372��� 4.383BVpublicaffiliatej ,t * EARNINGS MGMTj ,t �0.225 �0.372BVprivateaffiliatej ,t 0.857��� 3.798 0.644��� 2.749BVprivateaffiliatej ,t * EARNINGS MGMTj ,t i 1.678��� 3.286FV-BVpublicaffiliatej ,t 0.599��� 3.055 0.600��� 2.919FV-BVpublicaffiliatej ,t * EARNINGS MGMTj ,t �0.036 �0.097INCnonaffiliatej ,t 0.818��� 4.036 0.786��� 3.719INCnonaffiliatej ,t * EARNINGS MGMTj ,t 0.820 1.299INCpublicaffiliatej ,t 1.877 1.369 0.951 0.561INCpublicaffiliatej ,t * EARNINGS MGMTj ,t �1.253 �0.302INCprivateaffiliatej ,t 0.678 0.647 2.022� 1.772INCprivateaffiliatej ,t * EARNINGS MGMTj ,t �6.676�� �2.161FVINC-INCpublicaffiliatej ,t 0.415�� 2.284 0.264 1.342FVINC-INCpublicaffiliatej ,t * EARNINGS MGMTj ,t 0.626 1.255EARNINGS MGMTj ,t 1.072 0.516Intercept 13.467��� 5.098 13.406��� 5.046
Year fixed effects Included IncludedFirm fixed effects Included IncludedFirm-years 784 784Adjusted R2 0.834 0.837
Tests of Equality of Coefficients: p-value
BVpublicaffiliatej ,t = BVprivateaffiliatej ,t .3769INCpublicaffiliatej ,t = INCprivateaffiliatej ,t .4328
The table incorporates into Equation (1) the effect of separately identifying publicly-traded affiliates and private affiliatesand the effect of investors’ incentives to manage income from affiliates. BVnonaffiliatej ,t : book value (CEQ) of firm j lessthe book value of its investments in affiliates (IVAEQ) at the end of year t. INCnonaffiliatej ,t : income before extraordinaryitems (IB) less reported income from affiliates (ESUB) of firm j in year t. EARNINGS MGMTj ,t : indicator variableequal to 1 if income from affiliates causes firm j to meet one of three earnings targets (non-negative income, non-negativechange in income, analysts’ forecasted earnings) in year t, and 0 otherwise. Additional regression details and variables are
defined in Table 4. Two-tailed p-values are reported as follows: � p 0.10, �� p 0.05, ��� p 0.01.
81
8
Conclusion
This paper examines the decision usefulness of the equity method of accounting.
For a sample of 221 U.S. investors with publicly-traded affiliates during 1993-2011,
I find that fair value balance sheet and income measures of investments in publicly-
traded affiliates are incrementally associated with investors’ stock prices after control-
ling for information provided under the equity method. This result suggests that fair
value provides incremental relevant information, relative to the equity method, for in-
vestments in affiliates. In addition, I find that the incremental value relevance of fair
value measures exists for both investments in affiliates classified as held for sale and
those classified as strategic, with no evidence that the incremental value relevance
is higher (lower) for investments in affiliates identified as held for sale (strategic).
The result speaks to the ongoing debate at the FASB about whether measurement
attributes should be based on management’s intended method of value realization for
the items in question or whether the same measurement attribute should be applied
to similar items regardless of management’s intent. In particular, the result suggests
that significant influence might not be a basis for measuring investments in affiliates
that an entity does not intend to sell differently from other investments in marketable
82
equity securities (which are required to be measured at fair value under U.S. GAAP).
I also find evidence that the equity method does not achieve its objective of
reducing earnings management by investors with significant influence. For a sample
of 202 publicly-traded U.S. firms that were affiliates for a portion of the period 1993-
2011, I find that signed discretionary accruals of affiliates are higher when income
from affiliates allows investors to meet earnings targets. This result indicates that the
equity method does not eliminate concerns about earnings management by investors
with significant influence (such as those expressed about the timing of dividends
under the cost method); instead, it changes the mechanism through which earnings
are managed.
83
Appendix A
Description of the Cost Method
APB 18 (para. 6) describes the cost method as follows: “An investor records an
investment in the stock of an investee at cost, and recognizes as income dividends
received that are distributed from net accumulated earnings of the investee since the
date of acquisition by the investor. The net accumulated earnings of an investee sub-
sequent to the date of investment are recognized by the investor only to the extent
distributed by the investee as dividends.” In contrast, under the equity method, divi-
dends received reduce the carrying amount of the investment and income recognition
by the investor is based on the investor’s share of the net income of the investee (ad-
justed as described in Chapter 2) and also results in a change in the carrying amount
of the investment. Impairment requirements are similar under the cost and equity
methods.
The cost method is distinct from amortized cost used to measure investments in
held-to-maturity debt securities under SFAS 115. Under the amortized cost method
(as described on page 570 of Stickney et al. (2010)), “A firm initially records these
debt securities at acquisition cost. This acquisition cost will differ from the maturity
84
value of the debt if the coupon rate on the bonds differs from the required market
yield on the bonds at the time the firm acquired them. The firm must use the
effective interest method to amortize any difference between acquisition cost and
maturity value over the life of the debt as an adjustment to interest revenue. ...
The amortization procedure involves the following steps: (1) The holder of the debt
securities (the investor) records interest revenue each period at an amount equal to
the carrying value of the debt at the start of the period multiplied by the market rate
of interest applicable to that debt on the day the firm acquired the debt. It debits
the Marketable Securities account and credits Interest Revenue, which after closing
entries increases Retained Earnings. (2) If the investor receives cash each period, it
debits Cash and credits the Marketable Securities account. The result of this process
is a new carrying value (called the amortized cost) for use in the computations during
the next period.”
The key difference between the amortized cost method and the equity method is
the basis for income recognition. Under the amortized cost method, income recog-
nition is based on the amortization of any difference between acquisition cost and
maturity value over the life of the debt security held as interest revenue. The amor-
tized cost method cannot be applied to investments in equity securities because equity
securities do not have maturity dates.
The impairment guidance for debt securities differs from that for equity securi-
ties. After it has been determined that an other-than-temporary impairment exists
for equity securities, the entire difference between the investment’s cost and its fair
value is recognized in earnings (ASC 320-10-35-34). For debt securities (ASC 320-
10-35-34D), the other-than-temporary impairment is separated into (a) the amount
representing the credit loss (exists when present value of cash flows expected to be
collected is less than the amortized cost basis of the security), which is recognized in
earnings, and (b) the amount related to all other factors, which is recognized in other
85
comprehensive income. The guidance for other-than-temporary impairments for debt
securities changed during my sample period. Prior to reporting periods ending after
June 15, 2009, once it was determined that an other-than-temporary impairment ex-
isted, the entire amount of the impairment was recognized in earnings. In addition,
the previous requirement to avoid recognizing an other-than-temporary impairment
was for an investor to assert that it has both the intent and the ability to hold a
security for a period of time sufficient to allow for an anticipated recovery in its fair
value to its amortized cost basis. Now, an entity must assess whether it (a) has the
intent to sell the debt security or (b) more likely than not will be required to sell the
debt security before its anticipated recovery. If either of these conditions is met, the
investor must recognize an other-than-temporary impairment. (FASB Staff Position
No. FAS 115-2 and FAS 124-2, para. 7)
86
Bibliography
Ahmed, A. and Duellman, S. (2007), “Accounting conservatism and board of directorcharacteristics: An empirical analysis,” Journal of Accounting and Economics, 43,411–437.
Ahmed, A. and Duellman, S. (2011), “Evidence on the role of accounting conservatismin monitoring managers investment decisions,” Accounting & Finance, 51, 609–633.
Ahmed, A. S. and Takeda, C. (1995), “Stock market valuation of gains and losseson commercial banks’ investment securities An empirical analysis,” Journal of Ac-counting and Economics, 20, 207 – 225.
Ahmed, A. S., Kilic, E., and Lobo, G. J. (2006), “Does recognition versus disclo-sure matter? Evidence from value-relevance of banks’ recognized and disclosedderivative financial instruments.” Accounting Review, 81, 567 – 588.
Baber, W. R., Kang, S., and Li, Y. (2011), “Modeling discretionary accrual reversaland the balance sheet as an earnings management constraint,” The AccountingReview, 86, 1189–1212.
Barrett, M. (1971), “Accounting for intercorporate investments: a behavior field ex-periment,” Journal of Accounting Research, pp. 50–65.
Barth, M. and Clinch, G. (2009), “Scale effects in capital markets-based accountingresearch,” Journal of Business Finance & Accounting, 36, 253–288.
Barth, M. E. (1994), “Fair value accounting: evidence from investment securities andthe market valuation of banks,” Accounting Review, 69, I – 25.
Barth, M. E., Beaver, W. H., and Landsman, W. R. (1996), “Value-relevance ofbanks’ fair value disclosures under SFAS No. 107,” Accounting Review, 71, 513 –537.
Basu, S. (1997), “The conservatism principle and the asymmetric timeliness of earn-ings,” Journal of Accounting and Economics, 24, 3–37.
Bauman, M. (2003), “The impact and valuation of off-balance-sheet activities con-cealed by equity method accounting,” Accounting Horizons, 17, 303–314.
87
Bohren, O. and Haug, J. (2006), “Managing earnings with intercorporate invest-ments,” Journal of Business Finance & Accounting, 33, 671–695.
Bohren, O., Haug, J., and Michalsen, D. (2004), “Compliance with flexible accountingstandards,” The International Journal of Accounting, 39, 1–19.
Bona-Sanchez, C., Perez-Aleman, J., and Santana-Martin, D. (2011), “Ultimate own-ership and earnings conservatism,” European Accounting Review, 20, 57–80.
Brickley, J., Lease, R., and Smith, C. (1988), “Ownership structure and voting onantitakeover amendments,” Journal of Financial Economics, 20, 267–291.
Bushee, B. (2001), “Do institutional investors prefer near-term earnings over long-runvalue?” Contemporary Accounting Research, 18, 207–246.
Chambers, D., Linsmeier, T., Shakespeare, C., and Sougiannis, T. (2007), “An eval-uation of SFAS No. 130 comprehensive income disclosures.” Review of AccountingStudies, 12, 557 – 593.
Chen, S., Chen, X., Cheng, Q., and Hutton, A. (2009), “Accounting conservatism andlarge shareholders: an empirical analysis,” Tech. rep., Working Paper, Universityof Texas at Austin.
Chung, R., Firth, M., and Kim, J. (2002), “Institutional monitoring and opportunisticearnings management,” Journal of Corporate Finance, 8, 29–48.
Comiskey, E. and Mulford, C. (1986), “Investment decisions and the equity accountingstandard,” Accounting Review, pp. 519–525.
Comiskey, E. and Mulford, C. (1988), “The influence of accounting principles onmanagement investment decisions: an illustration,” Accounting Horizons, 2, 67 –72.
Cronqvist, H. and Fahlenbrach, R. (2009), “Large shareholders and corporate poli-cies,” Review of Financial Studies, 22, 3941–3976.
Cullinan, C., Wang, F., Wang, P., and Zhang, J. (2012), “Ownership structure andaccounting conservatism in China,” Journal of International Accounting, Auditingand Taxation, 21, 1–16.
Davis, M. and Largay III, J. (1999), “Financial reporting of “significant-influence”equity investments: analysis and managerial issues,” Journal of Managerial Issues,pp. 280–298.
Dechow, P. (1994), “Accounting earnings and cash flows as measures of firm perfor-mance: The role of accounting accruals,” Journal of Accounting and Economics,18, 3–42.
88

Dechow, P. and Dichev, I. (2002), “The quality of accruals and earnings: The role ofaccrual estimation errors,” The Accounting Review, 77, 35–59.
Dechow, P., Sloan, R., and Sweeney, A. (1995), “Detecting earnings management,”Accounting Review, pp. 193–225.
Dechow, P., Sloan, R., and Sweeney, A. (2010a), “Causes and consequences of earningsmanipulation: An analysis of firms subject to enforcement actions by the SEC,”Contemporary Accounting Research, 13, 1–36.
Dechow, P., Ge, W., and Schrand, C. (2010b), “Understanding earnings quality:A review of the proxies, their determinants and their consequences,” Journal ofAccounting and Economics, 50, 344–401.
Dhaliwal, D., Subramanyam, K., and Trezevant, R. (1999), “Is comprehensive incomesuperior to net income as a measure of firm performance?” Journal of Accountingand Economics, 26, 43 – 67.
Easley, D., Hvidkjaer, S., and Ohara, M. (2002), “Is information risk a determinantof asset returns?” The Journal of Finance, 57, 2185–2221.
Easton, P. (1999), “Security returns and the value relevance of accounting data,”Accounting Horizons, 13, 399–412.
Easton, P. and Harris, T. (1991), “Earnings as an explanatory variable for returns,”Journal of Accounting Research, pp. 19–36.
Eccher, E. A., Ramesh, K., and Thiagarajan, S. (1996), “Fair value disclosures bybank holding companies,” Journal of Accounting and Economics, 22, 79 – 117.
Edwards, E. O. and Bell, P. W. (1961), The theory and measurement of businessincome, Univ of California Press.
Fan, J. and Wong, T. (2002), “Corporate ownership structure and the informativenessof accounting earnings in East Asia,” Journal of Accounting and Economics, 33,401–425.
Francis, J. and Schipper, K. (1999), “Have financial statements lost their relevance?”Journal of Accounting Research, 37, 319–352.
Givoly, D. and Hayn, C. (2000), “The changing time-series properties of earnings, cashflows and accruals: Has financial reporting become more conservative?” Journal ofAccounting and Economics, 29, 287–320.
Gopalan, R. and Jayaraman, S. (2012), “Private control benefits and earnings man-agement: Evidence from insider controlled firms,” Journal of Accounting Research,50, 117–157.
89
Gordon, I. and Morris, R. (1996), “The equity accounting saga in Australia: cyclicalstandard setting,” Abacus, 32, 153–177.
Graham, J. R., Harvey, C. R., and Rajgopal, S. (2005), “The economic implicationsof corporate financial reporting,” Journal of Accounting and Economics, 40, 3–73.
Graham, R. and Lefanowicz, C. (1996), “Evidence of the relation between accountingfor equity investments and equity valuation,” Journal of Accounting, Auditing &Finance, 11, 587–605.
Graham, R. and Lefanowicz, C. (1997), “Parent and subsidiary earnings announce-ments and parent and subsidiary valuation,” Accounting and Business Research,28, 3–17.
Graham, R. and Lefanowicz, C. (1999), “Majority and minority ownership of publicly-traded firms: a test of the value of control using market multiples,” Journal ofBusiness Finance & Accounting, 26, 171–198.
Graham, R., King, R., and Morrill, C. (2003a), “Decision usefulness of alternativejoint venture reporting methods,” Accounting Horizons, 17, 123–137.
Graham, R., Lefanowicz, C., and Petroni, K. (2003b), “The value relevance of equitymethod fair value disclosures,” Journal of Business Finance & Accounting, 30,1065–1088.
Hadani, M., Goranova, M., and Khan, R. (2011), “Institutional investors, shareholderactivism, and earnings management,” Journal of Business Research, 64, 1352–1360.
Haw, I., Hu, B., Hwang, L., and Wu, W. (2004), “Ultimate ownership, income man-agement, and legal and extra-legal institutions,” Journal of Accounting Research,42, 423–462.
Hirst, D. E. and Hopkins, P. E. (1998), “Comprehensive income reporting and ana-lysts’ valuation judgments,” Journal of Accounting Research, 36, 47–75.
Hirst, D. E., Hopkins, P. E., and Wahlen, J. M. (2004), “Fair values, income measure-ment, and bank analysts’ risk and valuation judgments,” The Accounting Review,79, 453–472.
Hope, O. (2013), “Large shareholders and accounting research,” China Journal ofAccounting Research, 6, 3–20.
Hribar, P. and Craig Nichols, D. (2007), “The use of unsigned earnings quality mea-sures in tests of earnings management,” Journal of Accounting Research, 45, 1017–1053.
90

Jensen, M. and Meckling, W. (1976), “Theory of the firm: Managerial behavior,agency costs and ownership structure,” Journal of Financial Economics, 3, 305–360.
Jiambalvo, J., Rajgopal, S., and Venkatachalam, M. (2002), “Institutional owner-ship and the extent to which stock prices reflect future earnings,” ContemporaryAccounting Research, 19, 117–145.
Jones, J. (1991), “Earnings management during import relief investigations,” Journalof Accounting Research, pp. 193–228.
Khan, M. and Watts, R. (2009), “Estimation and empirical properties of a firm-yearmeasure of accounting conservatism,” Journal of Accounting and Economics, 48,132–150.
Koh, P. (2003), “On the association between institutional ownership and aggressivecorporate earnings management in Australia,” The British Accounting Review, 35,105–128.
Koh, P. (2007), “Institutional investor type, earnings management and benchmarkbeaters,” Journal of Accounting and Public Policy, 26, 267–299.
Kothavala, K. (2003), “Proportional consolidation versus the equity method: A riskmeasurement perspective on reporting interests in joint ventures,” Journal of Ac-counting and Public Policy, 22, 517–538.
La Porta, R., Lopez de Silanes, F., and Shleifer, A. (1999), “Corporate ownershiparound the world,” Journal of Finance, 54, 471–517.
Lafond, R. and Roychowdhury, S. (2008), “Managerial ownership and accountingconservatism,” Journal of Accounting Research, 46, 101–135.
LaFond, R. and Watts, R. (2008), “The information role of conservatism,” The Ac-counting Review, 83, 447–478.
Lambert, C. and Lambert, C. (2011), “An investigation of earnings managementthrough investments in associated companies: An Australian perspective,” Journalof Business & Economics Research, 1.
Lee, S., Pandit, S., and Willis, R. (2013), “Equity method investments and sell-sideanalysts’ information environment,” The Accounting Review, forthcoming.
Leisenring, J., Linsmeier, T., Schipper, K., and Trott, E. (2012), “Business-model(intent)-based accounting,” Accounting and Business Research, 42, 329–344.
Leuz, C., Nanda, D., and Wysocki, P. (2003), “Earnings management and investorprotection: an international comparison,” Journal of Financial Economics, 69,505–527.
91
Libby, R. and Seybert, N. (2009), “Behavioral studies of the effects of regulation onearnings management and accounting choice,” in Accounting, Organizations, andInstitutions: Essays for Anthony Hopwood, eds. C. S. Chapman, D. J. Cooper, andP. B. Miller, Oxford University Press, Oxford.
Lloyd, B. and Weygandt, J. (1971), “Market value information for non-subsidiaryinvestments,” The Accounting Review, 46, 756–764.
Maines, L. A. and McDaniel, L. S. (2000), “Effects of comprehensive-income charac-teristics on nonprofessional investors’ judgments: The role of financial-statementpresentation format,” The Accounting Review, 75, 179–207.
Mazay, V., Wilkins, T., and Zimmer, I. (1993), “Determinants of the choice of ac-counting for investments in associated companies,” Contemporary Accounting Re-search, 10, 31–59.
Miller, P. and Bahnson, P. (2007), “It’s time to throw the equity method overboard,”Accounting Today.
Morris, R. and Gordon, I. (2006), “Equity accounting adoption in regulated andunregulated settings: an empirical study,” Abacus, 42, 22–42.
Nelson, K. K. (1996), “Fair value accounting for commercial banks: an empiricalanalysis of SFAS No. 107,” Accounting Review, 71, 161 – 182.
Nobes, C. (2002), “An analysis of the international development of the equitymethod,” Abacus, 38, 16–45.
Ohlson, J. (1995), “Earnings, book values, and dividends in equity valuation,” Con-temporary Accounting Research, 11, 661–687.
Peasnell, K. V. (1982), “Some formal connections between economic values and yieldsand accounting numbers,” Journal of Business Finance & Accounting, 9, 361–381.
Petersen, M. (2009), “Estimating standard errors in finance panel data sets: Com-paring approaches,” Review of Financial Studies, 22, 435–480.
Ramalingegowda, S. and Yu, Y. (2011), “Institutional ownership and conservatism,”Journal of Accounting and Economics, 53, 98–114.
Rees, L. L. and Shane, P. B. (2012), “Academic Research and Standard-Setting: TheCase of Other Comprehensive Income,” Accounting Horizons, 26, 789–815.
Ricks, W. and Hughes, J. (1985), “Market reactions to a non-discretionary accountingchange: the case of long-term investments,” The Accounting Review, 60, 33–52.
Sacristan-Navarro, M. and Gomez-Anson, S. (2007), “Family ownership and pyramidsin the Spanish market,” Family Business Review, 20, 247–265.
92
Shleifer, A. and Vishny, R. (1997), “A survey of corporate governance,” The Journalof Finance, 52, 737–783.
Song, C. J., Thomas, W. B., and Yi, H. (2010), “Value relevance of FAS No. 157 fairvalue hierarchy information and the impact of corporate governance mechanisms,”Accounting Review, 85, 1375 – 1410.
Stickney, C., Weil, R., Schipper, K., and Francis, J. (2010), “Financial Accounting(13e),” South-Western Cengage Learning, Mason, OH.
Velury, U. and Jenkins, D. (2006), “Institutional ownership and the quality of earn-ings,” Journal of Business Research, 59, 1043–1051.
Venkatachalam, M. (1996), “Value-relevance of banks’ derivatives disclosures,” Jour-nal of Accounting and Economics, 22, 327 – 355.
Wang, D. (2006), “Founding family ownership and earnings quality,” Journal of Ac-counting Research, 44, 619–656.
Watts, R. (2003a), “Conservatism in accounting part I: Explanations and implica-tions,” Accounting Horizons, 17, 207–221.
Watts, R. (2003b), “Conservatism in accounting part II: Evidence and research op-portunities,” Accounting Horizons, 17, 287–301.
Yeo, G., Tan, P., Ho, K., and Chen, S. (2002), “Corporate ownership structure andthe informativeness of earnings,” Journal of Business Finance & Accounting, 29,1023–1046.
Zang, A. Y. (2012), “Evidence on the trade-off between real activities manipulationand accrual-based earnings management,” The Accounting Review, 87, 675–703.
93

Biography
Amanda Lee (Quiring) Gonzales was born on April 24, 1980, in Aurora, Nebraska. She
earned a Bachelor of Arts degree in Professional Accounting and Mathematics from
Hastings College (Hastings, Nebraska) in 2002, a Master’s degree in Professional Ac-
countancy from the University of Nebraska—Lincoln in 2003, and a Ph.D. in Business
Administration from Duke University in 2013. Prior to attending Duke University,
she worked as a project manager at the International Accounting Standards Board
and as a postgraduate technical assistant at the U.S. Financial Accounting Standards
Board. At Duke University, she received recognition as a James B. Duke Fellow and
University Scholar.
94