Embed Size (px)
Citation preview
Trim Size: 6in x 9in Wells c03.tex V2 - 01/27/2017 2:09pm Page 31❦
❦ ❦
❦
3C H A P T E R
Decision Architecture Methodology:Closing the Gap
One approach that gets inconsistent results, for instance, issimple data mining. Corralling huge data sets allows companiesto run dozens of statistical tests to identify submerged patterns,but that provides little benefit if managers can’t effectivelyuse the correlations to enhance business performance. A puredata-mining approach often leads to an endless search for whatthe data really say.
This quote from the Harvard Business Review article, “MakingAdvanced Analytics Work for You,” by Dominic Barton and DavidCourt, sums up one of the biggest challenges that exist in analyticstoday: organizations are throwing data at the problem hoping tofind a solution versus understanding the business problem andaligning the right data and methods to it. The premise of this bookaddresses this shortcoming and we focus on the importance ofconnecting data to decisions in order to truly monetize the wealthof business data accessible.
The Decision Architecture methodology laid out in this chapterhelps you make practical use of the waves of information floodingyour desktop. The methodology provides a framework to translatethe business problem into hypotheses, questions, decisions, actionlevers, metrics, and data needed to build an analytical solutiontied to a monetization strategy. The monetization strategy is a
31
Trim Size: 6in x 9in Wells c03.tex V2 - 01/27/2017 2:09pm Page 32❦
❦ ❦
❦
32 Monetizing Your Data
major component to the overall methodology and has its owndedicated section.
The frameworks, techniques, and tools in the Decision Archi-tecture methodology are similar to Lego™ pieces you can selectto assemble the analytical solution appropriate to the problem oropportunity at hand. Putting the Lego pieces together is a complextask, not always occurring in a straight line; accordingly we havefound that an iterative approach delivers the best solutions. As youbuild your analytical solution, you should expect to iterate throughcomponents of the methodology several times.
Your solution may vary in the level of automation, from anspreadsheet to a fully automated solution. The degree of automa-tion that will work for your case depends on the desired repeatabilityand scale of deployment. As each of these steps in the methodologyare repeated, templates and tools can be built, accelerating theprocess for subsequent projects.
In this chapter we describe how the Lego pieces fit together inthe Decision Architecture methodology. This book pivots aroundthree core concepts—Decision Analysis, Agile Analytics, and Mone-tization Strategy; accordingly in this chapter we provide an overviewof the Decision Architecture methodology that encompasses thethree concepts.
Methodology Overview
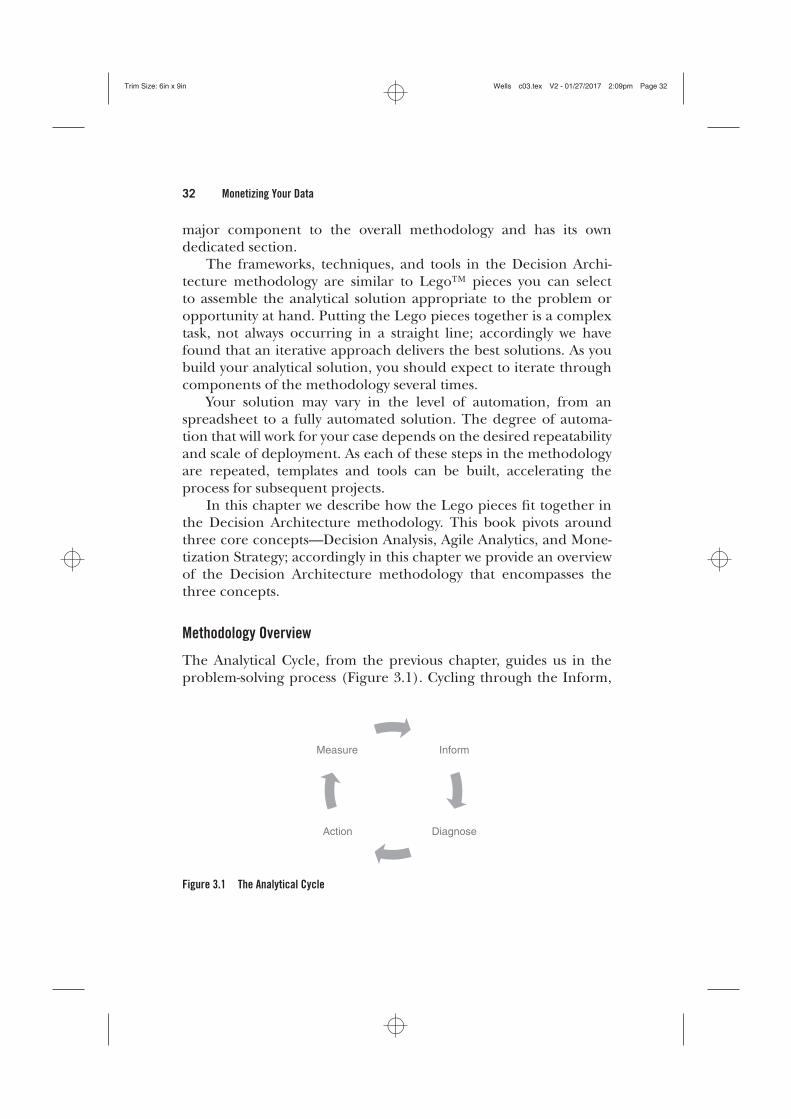
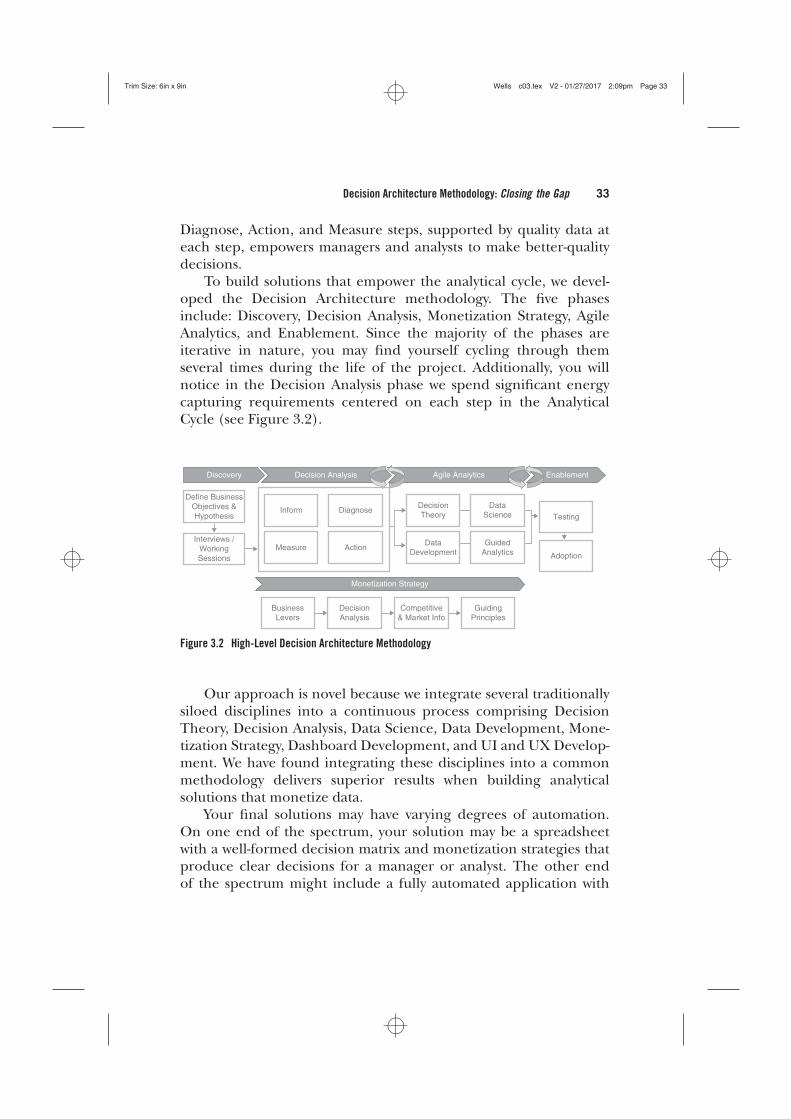
The Analytical Cycle, from the previous chapter, guides us in theproblem-solving process (Figure 3.1). Cycling through the Inform,
Measure
Action Diagnose
Inform
Figure 3.1 The Analytical Cycle
Trim Size: 6in x 9in Wells c03.tex V2 - 01/27/2017 2:09pm Page 33❦
❦ ❦
❦
Decision Architecture Methodology: Closing the Gap 33
Diagnose, Action, and Measure steps, supported by quality data ateach step, empowers managers and analysts to make better-qualitydecisions.
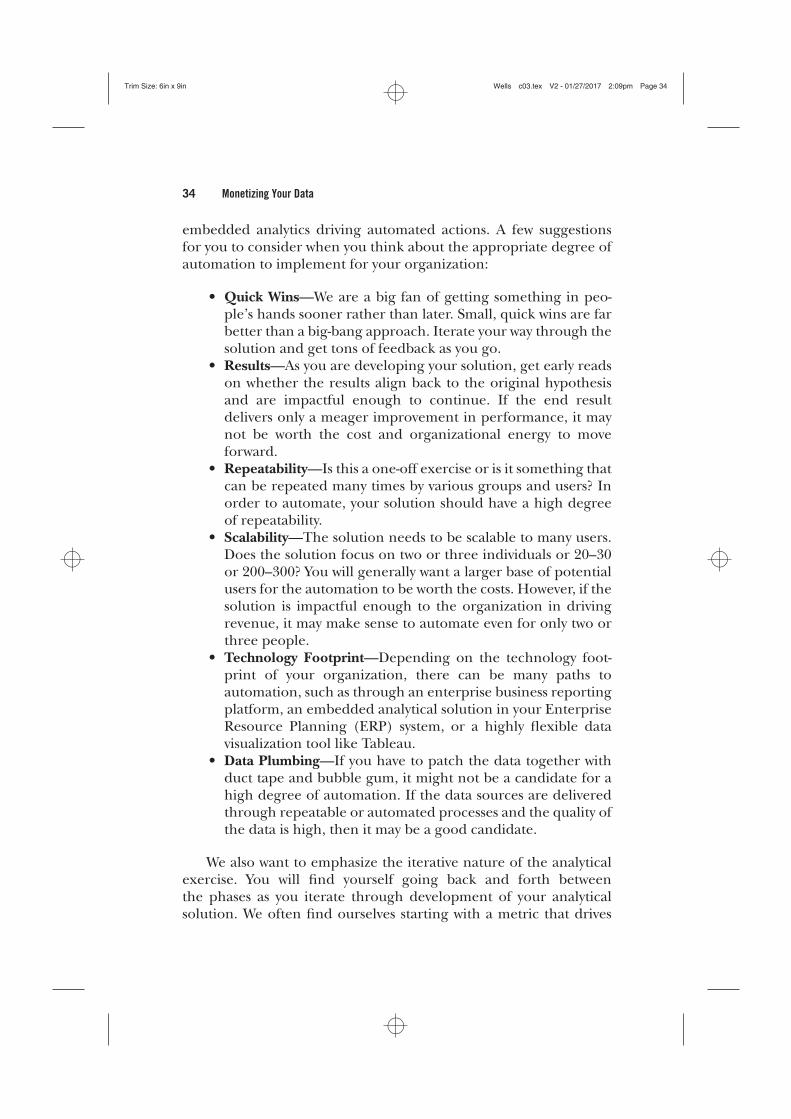
To build solutions that empower the analytical cycle, we devel-oped the Decision Architecture methodology. The five phasesinclude: Discovery, Decision Analysis, Monetization Strategy, AgileAnalytics, and Enablement. Since the majority of the phases areiterative in nature, you may find yourself cycling through themseveral times during the life of the project. Additionally, you willnotice in the Decision Analysis phase we spend significant energycapturing requirements centered on each step in the AnalyticalCycle (see Figure 3.2).
Discovery
Define BusinessObjectives &Hypothesis
Inform
Measure
BusinessLevers
DecisionAnalysis
Monetization Strategy
Competitive& Market Info
GuidingPrinciples
Action
Diagnose DecisionTheory
DataDevelopment
DataScience Testing
Adoption
GuidedAnalytics
Interviews /WorkingSessions
Decision Analysis Agile Analytics Enablement
Figure 3.2 High-Level Decision Architecture Methodology
Our approach is novel because we integrate several traditionallysiloed disciplines into a continuous process comprising DecisionTheory, Decision Analysis, Data Science, Data Development, Mone-tization Strategy, Dashboard Development, and UI and UX Develop-ment. We have found integrating these disciplines into a commonmethodology delivers superior results when building analyticalsolutions that monetize data.
Your final solutions may have varying degrees of automation.On one end of the spectrum, your solution may be a spreadsheetwith a well-formed decision matrix and monetization strategies thatproduce clear decisions for a manager or analyst. The other endof the spectrum might include a fully automated application with
Trim Size: 6in x 9in Wells c03.tex V2 - 01/27/2017 2:09pm Page 34❦
❦ ❦
❦
34 Monetizing Your Data
embedded analytics driving automated actions. A few suggestionsfor you to consider when you think about the appropriate degree ofautomation to implement for your organization:
• Quick Wins—We are a big fan of getting something in peo-ple’s hands sooner rather than later. Small, quick wins are farbetter than a big-bang approach. Iterate your way through thesolution and get tons of feedback as you go.
• Results—As you are developing your solution, get early readson whether the results align back to the original hypothesisand are impactful enough to continue. If the end resultdelivers only a meager improvement in performance, it maynot be worth the cost and organizational energy to moveforward.
• Repeatability—Is this a one-off exercise or is it something thatcan be repeated many times by various groups and users? Inorder to automate, your solution should have a high degreeof repeatability.
• Scalability—The solution needs to be scalable to many users.Does the solution focus on two or three individuals or 20–30or 200–300? You will generally want a larger base of potentialusers for the automation to be worth the costs. However, if thesolution is impactful enough to the organization in drivingrevenue, it may make sense to automate even for only two orthree people.
• Technology Footprint—Depending on the technology foot-print of your organization, there can be many paths toautomation, such as through an enterprise business reportingplatform, an embedded analytical solution in your EnterpriseResource Planning (ERP) system, or a highly flexible datavisualization tool like Tableau.
• Data Plumbing—If you have to patch the data together withduct tape and bubble gum, it might not be a candidate for ahigh degree of automation. If the data sources are deliveredthrough repeatable or automated processes and the quality ofthe data is high, then it may be a good candidate.
We also want to emphasize the iterative nature of the analyticalexercise. You will find yourself going back and forth betweenthe phases as you iterate through development of your analyticalsolution. We often find ourselves starting with a metric that drives
Trim Size: 6in x 9in Wells c03.tex V2 - 01/27/2017 2:09pm Page 35❦
❦ ❦
❦
Decision Architecture Methodology: Closing the Gap 35
a decision in the Decision Analysis phase and by the time we get tothe Agile Analytics phase we may determine that some of the datadoes not exist or the quality of the data is so poor we cannot use it.At this point, we will iterate through Decision Analysis again to findrelevant information that is actionable and supported by qualitydata. There are several disciplines in play and the dance betweenthem causes rework as each discipline continues to refine their partof the solution.
A high-level overview of each of the phasesmay be in order beforewe go too deep into the specific areas. Let’s begin with the Discoveryphase. The Discovery phase starts with aligning your project goals toorganizational objectives to ensure alignment. Next we identify thebusiness priority, which may be a problem or opportunity. From ourbusiness priority we develop one ormore hypotheses we believe artic-ulate the priority in an actionable manner. Once we know what weare looking to address, we conduct interviews and working sessionsto ramp up on the subject matter, understand existing systems, andfine tune the hypothesis and scope.
Decision Analysis, the next phase, is designed to capture ques-tions, key decisions, action levers, metrics, data needs, and a categorytree. We leverage specific facilitation techniques in working sessionsdesigned around topics and compile this information into thevarious Decision Analysis components. This information drives thebuilding of category trees, key decisions, action levers, and success metrics,providing requirements for the Agile Analytics and MonetizationStrategy phases.
During the Decision Analysis and Agile Analytics phases,you build and refine your monetization strategy. In this phase youdevelop specific strategies, identify business levers, and assign actionsfrom the earlier phases to deploy to drive revenue or reduce costs.
The Agile Analytics phase encompasses building a solutionfrom the requirements gathered in the Decision Analysis andMonetization Strategy phases. This phase is composed of severalprocess steps: Data Development, Analytical Structure, DecisionTheory, Data Science, and Guided Analytics. These components mayvary in size and length depending on the level of automation andtechnology.
Finally, in the Enablement phase, once a solution has beendeveloped, it is rolled out to the user base. Adoption, a key themein this phase, only occurs if adequate testing and training have beensuccessfully conducted.
Trim Size: 6in x 9in Wells c03.tex V2 - 01/27/2017 2:09pm Page 36❦
❦ ❦
❦
36 Monetizing Your Data
Discovery Decision Analysis Agile Analytics Enablement
DefineBusiness
ObjectivesQuestionAnalysis Data Needs
DecisionTheory
DataScience
AnalyticalStructure
UI / UX
Guided Analytics
Testing
Training
Rollout
DataDevelopment
DashboardDevelopment
Category Tree
SuccessMetrics
Key Decisions
Action Levers
DefineHypothesis &Scope Effort
Interviews /WorkingSessions
ReviewReports /Systems
Monetization Strategy
BusinessLevers
DecisionAnalysis
Competitive &Market Info
GuidingPrinciples
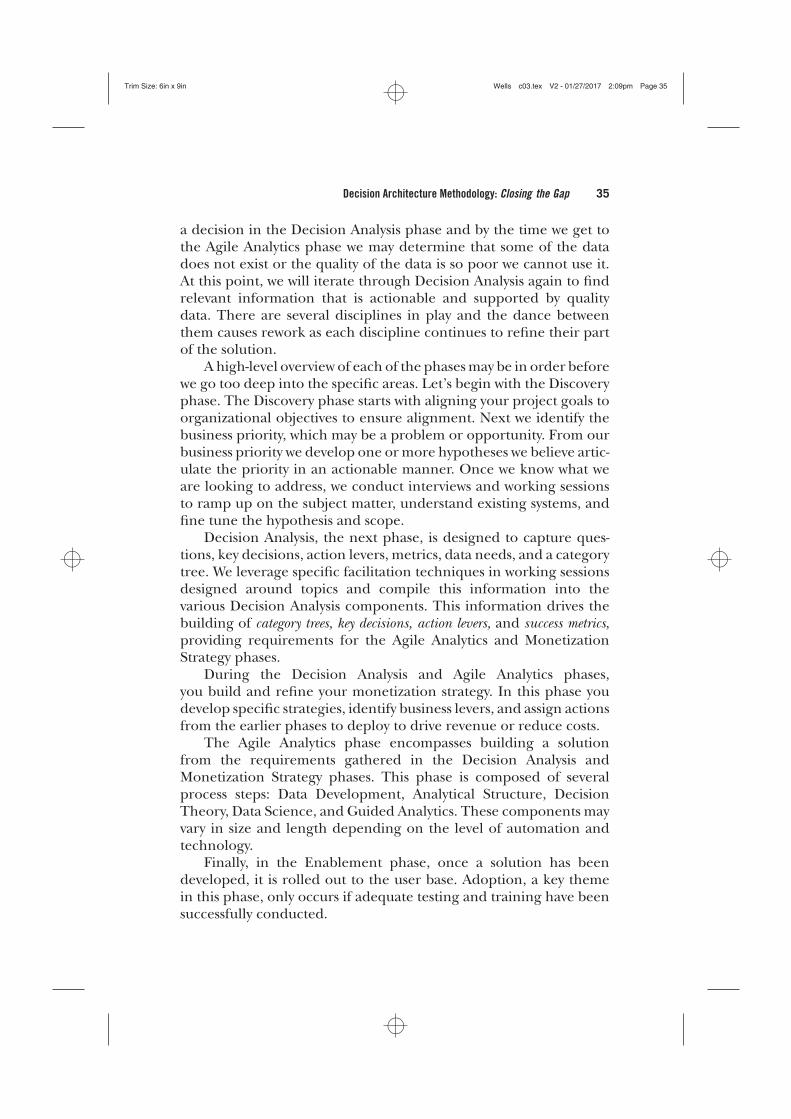
Figure 3.3 Decision Architecture Methodology
Figure 3.3 lays out the complete methodology. We describe eachof the process steps in detail in the following sections and chaptersbut first let’s go through a high-level overview of the primary phases.
Discovery
The Discovery phase starts with defining business objectives andaligning these to corporate goals. For example, the objective maybe to “Grow Revenue by 10% through marketing activities focusedon the Millennial generation.” If the end analytical solution doesnot align to the company’s objectives and goals, you may want toquestion whether the project is worth doing.
Once you know your business objective, it is time to define thehypothesis and scope the overall effort, a necessity in any analyticsproject. Your goal is to confirm or reshape the hypothesis fromyour learnings as you progress through the project. An examplehypothesis is that by combining social media data with our existingcustomer data, we can drive more relevant and targeted marketingactivities, achieving an 10 percent lift in our Millennial Segmentcredit card campaigns.
In order to develop amonetization strategy, anticipating the busi-ness levers that will drive your strategy is important. It will impactthe development of your hypothesis and the levers that should alignto your actions. Our chapter on Monetization Strategy (Chapter 5)introduces the business lever concept and provides more informationon the topic.
Trim Size: 6in x 9in Wells c03.tex V2 - 01/27/2017 2:09pm Page 37❦
❦ ❦
❦
Decision Architecture Methodology: Closing the Gap 37
Discovery
DefineBusiness
Objectives
DefineHypothesis &Scope Effort
Interviews /WorkingSessions
ReviewReports /Systems
Figure 3.4 Discovery Phase
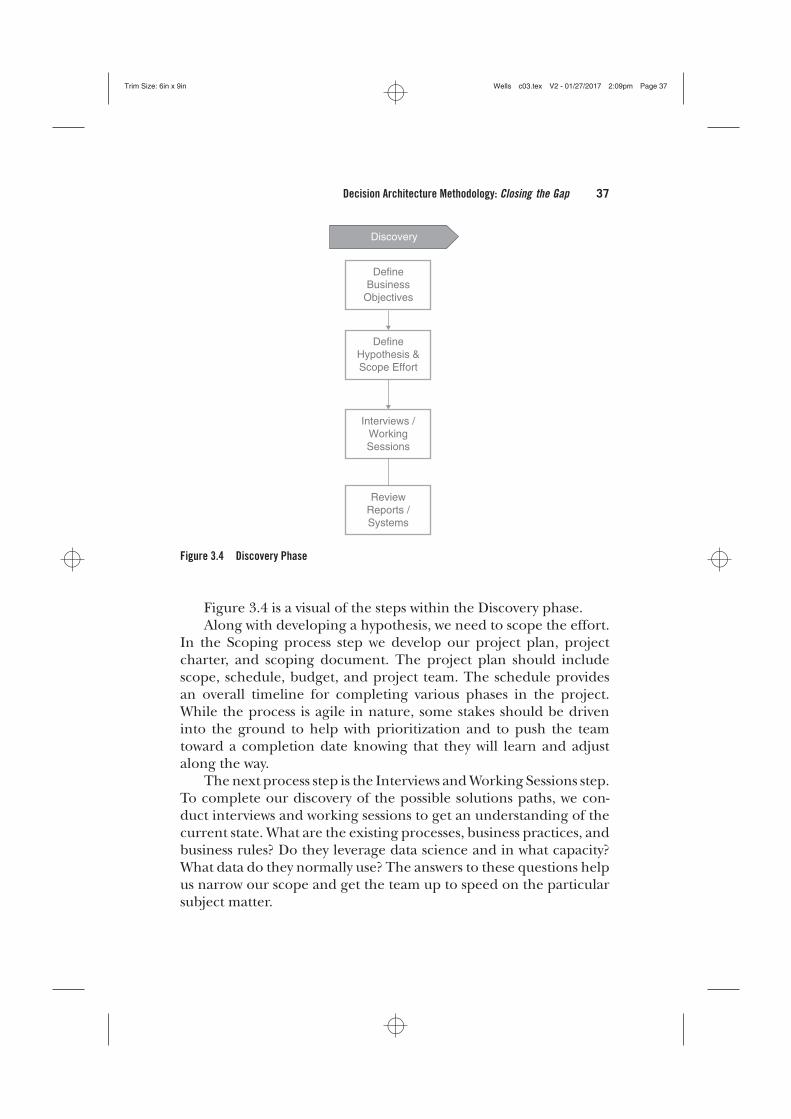
Figure 3.4 is a visual of the steps within the Discovery phase.Along with developing a hypothesis, we need to scope the effort.
In the Scoping process step we develop our project plan, projectcharter, and scoping document. The project plan should includescope, schedule, budget, and project team. The schedule providesan overall timeline for completing various phases in the project.While the process is agile in nature, some stakes should be driveninto the ground to help with prioritization and to push the teamtoward a completion date knowing that they will learn and adjustalong the way.
The next process step is the Interviews andWorking Sessions step.To complete our discovery of the possible solutions paths, we con-duct interviews and working sessions to get an understanding of thecurrent state. What are the existing processes, business practices, andbusiness rules? Do they leverage data science and in what capacity?What data do they normally use? The answers to these questions helpus narrow our scope and get the team up to speed on the particularsubject matter.
Trim Size: 6in x 9in Wells c03.tex V2 - 01/27/2017 2:09pm Page 38❦
❦ ❦
❦
38 Monetizing Your Data
The final process step in the Discovery phase is to Review Reportsand Systems. In this step we review each of the existing reports andthe various information systems to gain an understanding of the cur-rent state of the analytics in use. This step helps us understand whatdata is currently available and the capabilities that currently exist.
Each of the components in the Discovery Phase feeds our Deci-sion Analysis phase, which is where we explore and document thedetails of the decision process.
Decision Analysis
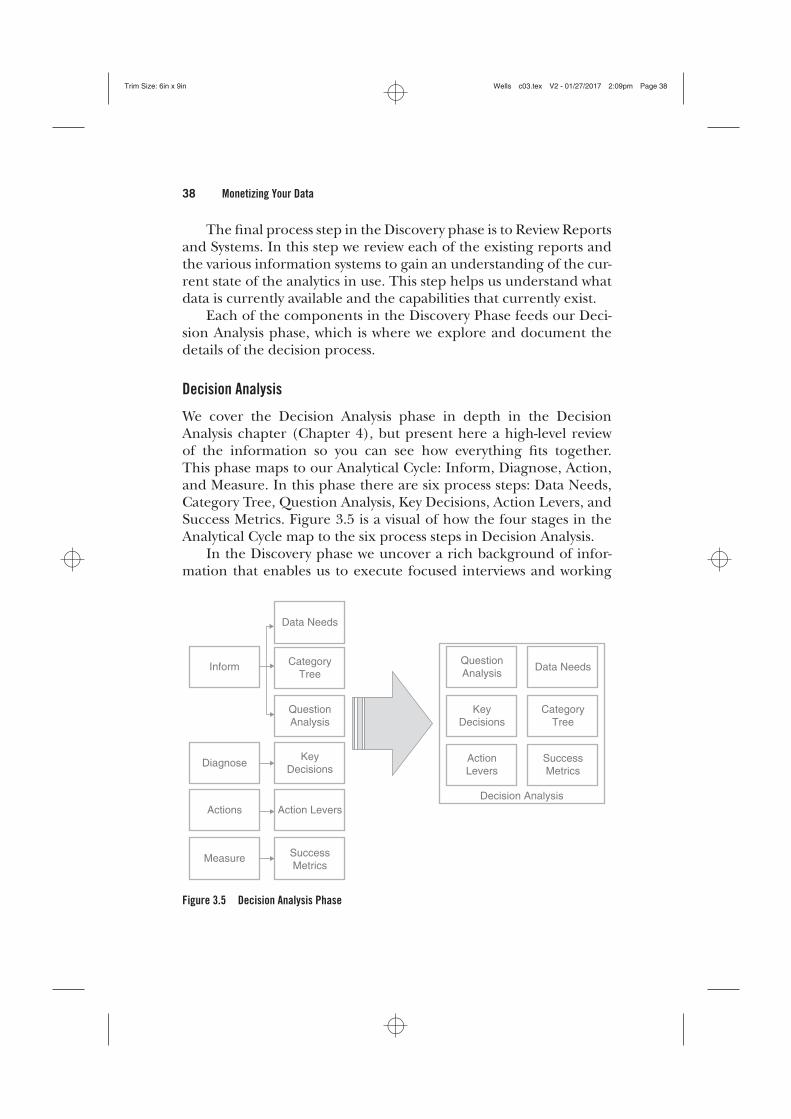
We cover the Decision Analysis phase in depth in the DecisionAnalysis chapter (Chapter 4), but present here a high-level reviewof the information so you can see how everything fits together.This phase maps to our Analytical Cycle: Inform, Diagnose, Action,and Measure. In this phase there are six process steps: Data Needs,Category Tree, Question Analysis, Key Decisions, Action Levers, andSuccess Metrics. Figure 3.5 is a visual of how the four stages in theAnalytical Cycle map to the six process steps in Decision Analysis.
In the Discovery phase we uncover a rich background of infor-mation that enables us to execute focused interviews and working
Inform
Diagnose
Actions
Measure SuccessMetrics
SuccessMetrics
Action LeversDecision Analysis
ActionLevers
KeyDecisions
KeyDecisions
QuestionAnalysis
QuestionAnalysis
CategoryTree
CategoryTree
Data Needs
Data Needs
Figure 3.5 Decision Analysis Phase
Trim Size: 6in x 9in Wells c03.tex V2 - 01/27/2017 2:09pm Page 39❦
❦ ❦
❦
Decision Architecture Methodology: Closing the Gap 39
sessions in the Decision Analysis phase. The Inform process stepdetermines the questions that the manager asks when consideringa problem. The output of this step, the Question Analysis, pointsus to the data and data sources needed to support the analyticeffort. In addition, in this process step we produce the CategoryTree, a diagram outlining the various information and diagnosticcategories. We view the nodes in the Category Tree as groupings oflike information such as sales performance or a particular diagnosticlike call center performance.
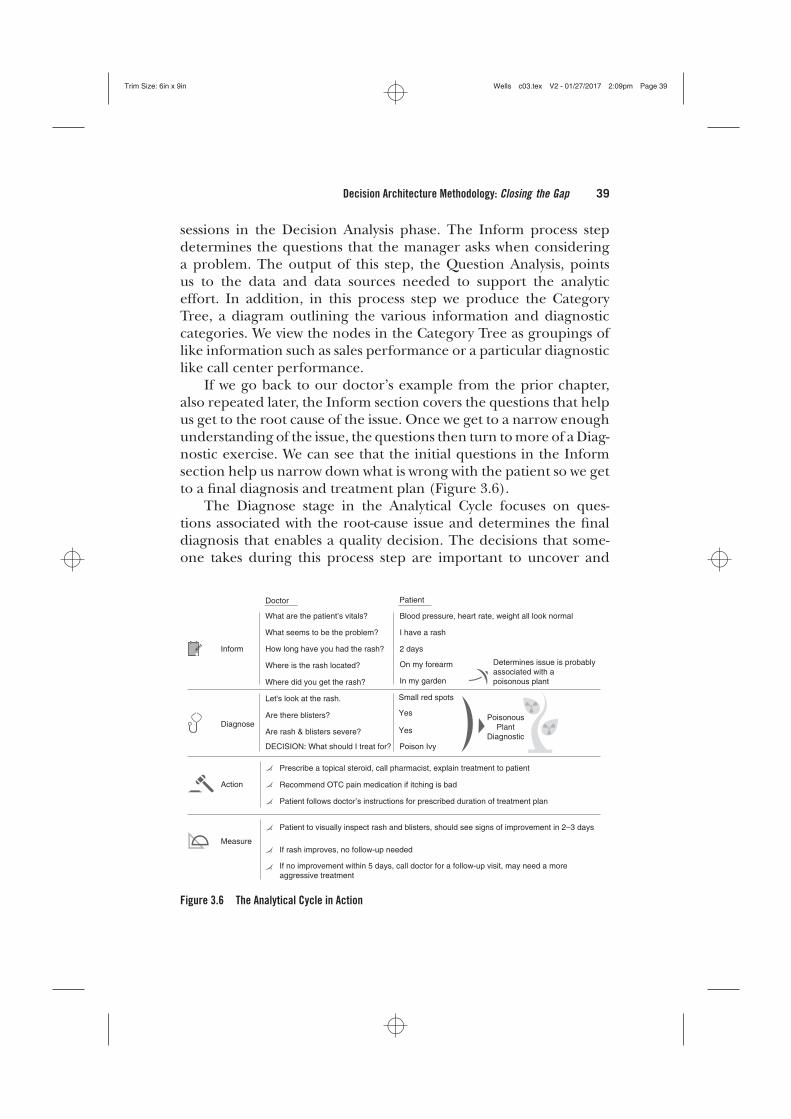
If we go back to our doctor’s example from the prior chapter,also repeated later, the Inform section covers the questions that helpus get to the root cause of the issue. Once we get to a narrow enoughunderstanding of the issue, the questions then turn tomore of aDiag-nostic exercise. We can see that the initial questions in the Informsection help us narrow down what is wrong with the patient so we getto a final diagnosis and treatment plan (Figure 3.6).
The Diagnose stage in the Analytical Cycle focuses on ques-tions associated with the root-cause issue and determines the finaldiagnosis that enables a quality decision. The decisions that some-one takes during this process step are important to uncover and
Doctor
What are the patient’s vitals?
What seems to be the problem?
How long have you had the rash?
Where is the rash located?
Where did you get the rash?
Let's look at the rash.
Are there blisters?
Are rash & blisters severe?
DECISION: What should I treat for?
Prescribe a topical steroid, call pharmacist, explain treatment to patient
Recommend OTC pain medication if itching is bad
Patient follows doctor’s instructions for prescribed duration of treatment plan
Patient to visually inspect rash and blisters, should see signs of improvement in 2–3 days
If rash improves, no follow-up needed
If no improvement within 5 days, call doctor for a follow-up visit, may need a moreaggressive treatment
Patient
Blood pressure, heart rate, weight all look normal
Determines issue is probablyassociated with apoisonous plant
I have a rash
2 days
On my forearm
In my garden
Small red spots
Yes
Yes
Poison Ivy
Inform
Diagnose
Action
Measure
PoisonousPlant
Diagnostic
Figure 3.6 The Analytical Cycle in Action
Trim Size: 6in x 9in Wells c03.tex V2 - 01/27/2017 2:09pm Page 40❦
❦ ❦
❦
40 Monetizing Your Data
are captured through Key Decisions. For example, once the doctordetermines that the rash has something to do with a poisonousplant, she then goes into a diagnostic about poisonous plants todetermine severity and treatment plan. Once the doctor narrowsdown the probable cause of the rash to poison ivy and the severity ofthe rash, she knows what decision to make.
The Action stage in the analytical cycle takes the Key Decisionsand maps Action Levers to each of them. These Action Levers arespecific initiatives that you can take to capture an opportunity orresolve an issue. This step also ensures that our Success Metrics areactionable. In the doctor example, we see the action is to prescribemedication and explain the treatment plan to the patient. It is impor-tant in this step for the patient to agree with the diagnosis and fullyunderstand the treatment plan. By taking this final step, we can havea higher confidence that the plan will be acted on.
Lastly, the Measure stage of the analytical cycle captures thesuccess metrics that help drive our decisions and measures ouroutcomes. From our example, the Measure stage determines if thetreatment plan is effective. If it is effective, there is nothing more todo. If the treatment is not effective, the patient will need to go backto the doctor to get a more aggressive treatment.
Monetization Strategy
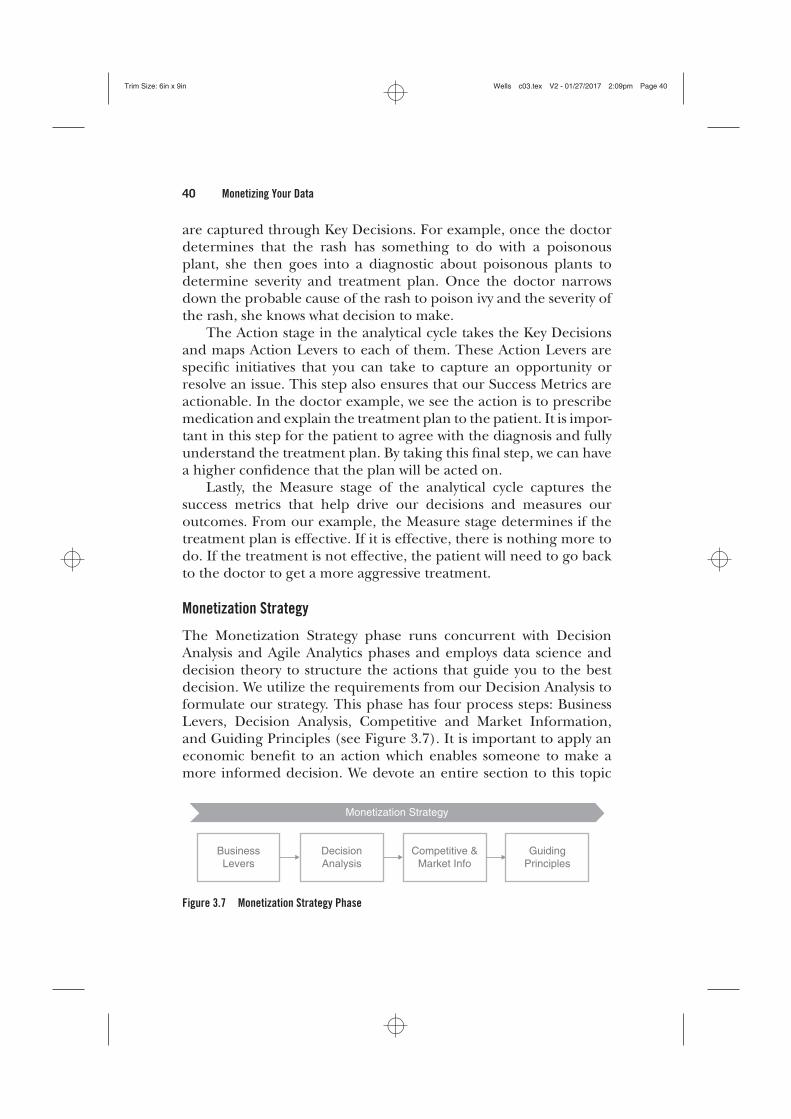
The Monetization Strategy phase runs concurrent with DecisionAnalysis and Agile Analytics phases and employs data science anddecision theory to structure the actions that guide you to the bestdecision. We utilize the requirements from our Decision Analysis toformulate our strategy. This phase has four process steps: BusinessLevers, Decision Analysis, Competitive and Market Information,and Guiding Principles (see Figure 3.7). It is important to apply aneconomic benefit to an action which enables someone to make amore informed decision. We devote an entire section to this topic
BusinessLevers
DecisionAnalysis
Competitive &Market Info
GuidingPrinciples
Monetization Strategy
Figure 3.7 Monetization Strategy Phase
Trim Size: 6in x 9in Wells c03.tex V2 - 01/27/2017 2:09pm Page 41❦
❦ ❦
❦
Decision Architecture Methodology: Closing the Gap 41
later in the book and provide a framework and case study to helpyou adopt these concepts.
Agile Analytics
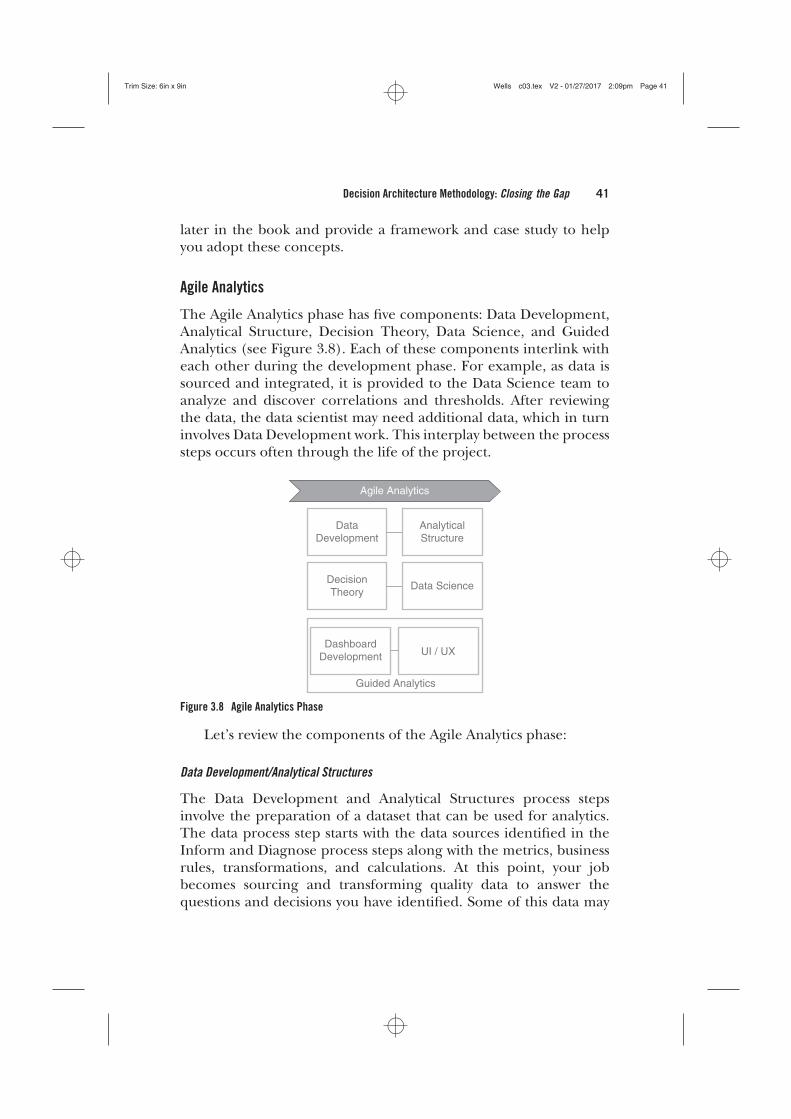
The Agile Analytics phase has five components: Data Development,Analytical Structure, Decision Theory, Data Science, and GuidedAnalytics (see Figure 3.8). Each of these components interlink witheach other during the development phase. For example, as data issourced and integrated, it is provided to the Data Science team toanalyze and discover correlations and thresholds. After reviewingthe data, the data scientist may need additional data, which in turninvolves Data Development work. This interplay between the processsteps occurs often through the life of the project.
Guided Analytics
UI / UXDashboard
Development
DecisionTheory
DataDevelopment
AnalyticalStructure
Agile Analytics
Data Science
Figure 3.8 Agile Analytics Phase
Let’s review the components of the Agile Analytics phase:
Data Development/Analytical Structures
The Data Development and Analytical Structures process stepsinvolve the preparation of a dataset that can be used for analytics.The data process step starts with the data sources identified in theInform and Diagnose process steps along with the metrics, businessrules, transformations, and calculations. At this point, your jobbecomes sourcing and transforming quality data to answer thequestions and decisions you have identified. Some of this data may
Trim Size: 6in x 9in Wells c03.tex V2 - 01/27/2017 2:09pm Page 42❦
❦ ❦
❦
42 Monetizing Your Data
come from within the walls of the company; other data you mayneed to purchase to round out the picture.
Extracting datamay involve various source systems, internally andexternally, and is often one of the most complicated steps. Onceyou have extracted the necessary data, you need to stitch it togetherinto an Analytical Structure via some type of key value relationshipbetween the datasets regardless of whether the data is structured orunstructured.
Ensuring the data correctly represents the subject of analysis iscritical; as the saying goes, “Garbage in, garbage out.” You will behard pressed to derive any meaningful analytics from a poor-qualitydataset.
Finally, an analytical structure needs to be developed that encom-passes the values, transformations, and aggregations to answer thevarious questions and decisions. For example, if the doctor wants tobuild a report to understand the most effective treatment optionsbased on the historical performance of various medications for thetreatment of poison ivy, she may have to combine several datasets.First she looks at patient records and then combines them with effi-cacy data for each of the medications. The ability to combine bothdatasets, the quality of the data, and the structuring of the data foranalysis is the focus for this process step.
The Data Development process step drives the Data Science andGuided Analytics process steps. Without a solid dataset to analyze,you cannot perform the Data Science process step. Likewise, withoutthe right analytical structure, dashboard development is not possible.
We will go into depth on this process in the Data Developmentchapter.
Data Science/Decision Theory
The Data Science and Decision Theory process steps help you findinsights and then structure the insights into a decision process todrive the best actions for the company.
The Data Science process step comprises descriptive and pre-dictive analytics techniques. The inputs into this process step arethe Data Development process step and requirements from theDecision Analysis phase, which include the Question Analysis, Key
Trim Size: 6in x 9in Wells c03.tex V2 - 01/27/2017 2:09pm Page 43❦
❦ ❦
❦
Decision Architecture Methodology: Closing the Gap 43
Decisions, Action Levers, and Success Metrics process steps. Withfurther analysis of our metrics, informed by our Question Analysis,we can specify particular Data Science studies we want to performto further develop the solution.
For example, having identified a particular metric that drivesa decision, we will want to establish thresholding for the metric todetermine when it has hit a boundary. This boundary serves as asignal that there may be an opportunity or issue. To continue withour poison ivy example, our doctor wants to know the threshold forblister sizes and treatment options. When the blisters reach over acertain threshold, she knows a more aggressive treatment is needed.If the blisters are within range or below, it might warrant a less aggres-sive treatment. This is a perfect exercise for a data scientist and wecover this in greater detail in the Data Science chapter (Chapter 9).
Whereas data science helps you turn information into insightsthat are actionable, we need tools that help us structure the decisionprocess to guide a person to the correct decision. Decision Theory,along with Behavioral Economics, focuses on understanding thecomponents of the decision process to explain why we make thechoices we do. It also provides a systematic way to consider tradeoffsamong attributes that helps us make a better decision. Thereare several tools and techniques in the Decision Theory chapter(Chapter 8) that help you structure your analytical solution.
Guided Analytics
Guided Analytics is the process you use to take your users throughthe analytical journey to make effective decisions. Guided Analyticsdepends on a solid foundation of User Interface (UI)/User Experi-ence (UX) and Dashboard Development. We discuss these conceptsin depth in the Agile Analytics section.
For now, let’s give an overview of some of the key concepts as wellas describe two experiences, one unguided and one guided.
Unguided—This is the statemost analytical solutions are in today.For now, let’s assume that we have a report that has beendeveloped that has Sales by Region, Sales by Product, andSales by Channel. There are pie charts that break out each of
Trim Size: 6in x 9in Wells c03.tex V2 - 01/27/2017 2:09pm Page 44❦
❦ ❦
❦
44 Monetizing Your Data
these dimensions to let us know our sales mix. After we viewthe information, we begin to wonder, How does this informa-tion compare with last month? Are we trending up or down?Do we have any opportunities or issues that we need to beaware of? What decisions are we supposed to make from thisreport? The issue we run into with unguided solutions is thatthe data on the report is simply informative and does notguide us to an opportunity or issue.
Guided—You log onto your dashboard to see how the organi-zation is performing today and over the past year. Your eyesare drawn to the Northeast region as a threshold has beentriggered on the metric associated with your Electric Car divi-sion sales volume. You click on the metric and are taken toanother dashboard to view the metric over a period of timeto see if the spike in sales is a onetime occurrence or a trend.You notice that it seems to be a short-term trend that hasbeen in place for the last several months. You also noticethat sales have increased to the point where you are havingout-of-stock issues, so you then drill down to the sales volumediagnostic. In the diagnostic you are presented several met-rics and a decision matrix that has been formulated into amonetization strategy. In the decision matrix you have fivedecisions presented to you of various opportunities to helpclose the shortage gap. Each decision has a monetary valueand probability score associated with it so you can determinewhich decision has the highest chance for success to returnthe largest amount of revenue to the company.
Which of these experiences did you prefer? The first experiencesimply helps you “read the news.” It tells you the current state ofthings but does not help you tease out any opportunities or issues.Nor does it provide a diagnostic experience to help you weighalternative decisions based on monetization factors. In the guidedexperience, you are taken on a journey to uncover an opportunityand several decisions you can make to resolve it.
We hope you learn how to build these guided experiences, orstories, through the techniques in this book and that by doing soyou empower your organization to be more competitive and driverevenue.
Storytelling is becoming a bigger movement in analytical circles.This is evidenced in Frank van den Driest, Stan Sthanunathan, and
Trim Size: 6in x 9in Wells c03.tex V2 - 01/27/2017 2:09pm Page 45❦
❦ ❦
❦
Decision Architecture Methodology: Closing the Gap 45
Keith Weed’s Harvard Business Review article, “Building an InsightsEngine.” Below is an excerpt from the article:
The i2020 research imparts a final lesson about what makes fora strong insights engine: good storytelling. At overperformingfirms, 61% of surveyed executives agreed that people in theirinsights functions were skilled at conveying their messagesthrough engaging narratives; at underperforming firms, only37% agreed.
At Unilever, CMI has embraced storytelling. Traditionally itspresentations were data-intensive, built on the assumption thata fact-filled talk would be more persuasive than a fact-based onewith less data and more narrative. Although data has its place,CMI has moved away from charts and tables and toward provoca-tive storytelling, embracing an ethos of “Show, don’t tell.”
These types of analytical stories are brought to life throughUI/UX and analytics elements such as metrics, trends, patterns,diagrams, alerts, and decision matrixes. A big part of the story is howa user engages with the solution, which is done through thoughtfuldeployment of UI/UX standards. In Tom Davenport’s article, “HowP&G Presents Data to Decision-Makers,” he argues that visual designcommonality is more important than creativity. If you establish acommon visual standard, it is easier for people to interpret theinformation. As a user navigates from dashboard to dashboard, theycan spend their energy interpreting the data versus learning howto reinterpret the visual cues. These standards and guidelines helpcreate consistent look and feel as well as better overall usability.
UI and UX development is part art and part science and iterativein nature. You will work with your users to see what is meaningful tothem and how they interpret information. Next you create the visualelements that help the users answer questions and make decisions todrive actions. For example, what are the thresholds for a particularmetric and what color should we choose to help draw the user’s eyeto an issue or opportunity? An easy-to-use interface that is intuitiveand guides a user through the analytic story to a decision promotesusability and, therefore, adoption.
The Guided Analytics solution often deploys a dashboard tool,but not always. The inputs to the process step are the Decision Anal-ysis, UI/UX Development, Data Development, Decision Theory,
Trim Size: 6in x 9in Wells c03.tex V2 - 01/27/2017 2:09pm Page 46❦
❦ ❦
❦
46 Monetizing Your Data
and Data Science. The Decision Analysis greatly influences theDashboard Development process step. A major influence is theCategory Tree, which maps out the thought process of how a userasks questions to diagnose an issue and then take action through aninformed decision. This is your “story” that draws the user to engagewith the solution. It is one of the most important components toget right.
Lastly, the Guided Analytics process step is one of the mostuser-engaged steps in the methodology. Working with the users tocycle through the various options in a dashboard tool and yourDecision Analysis is time consuming, but a process that ensures youget it right. We recommend frequent checkpoints with the end userto review progress and adjust accordingly. This level of engagementresults in an analytical tool guaranteed to meet user expectations asthey have seen the end product evolve and are invested in its success.
Enablement
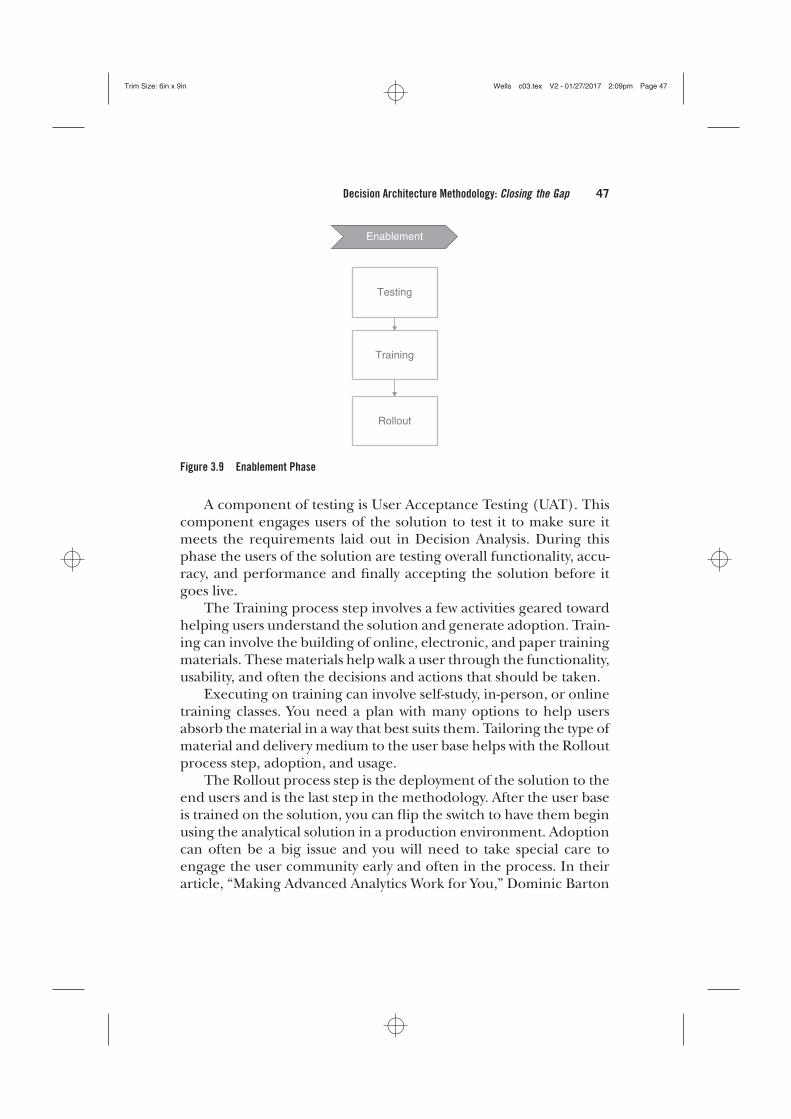
The Enablement phase is the last phase in the methodology and canvary in duration (Figure 3.9). It is also iterative in nature between ear-lier phases. For example, once you get to Testing, you may discoveran issue that needs to be addressed in the Dashboard Developmentprocess step. Youmay find yourself repeating through these two stepsuntil all the issues are resolved.
Continuous improvement, or the “good-enough” principle, is therecommended guidance during this stage. The solution will never beperfect but rather should be regarded as one that is constantly evolv-ing on the path to perfection. At some point, the analytical solutionis good enough to start providing value to the business and should berolled out. Once rolled out, you can begin to develop the next waveof capabilities on your path to perfection.
Let’s review each of the steps in the Enablement phase.Testing involves each of the analysts/developers testing their
components individually and as an integrated group. The testingprocess is focused on ensuring the functionality is correct, thedata and calculations are accurate, and the solution responds asintended. It is the last step for the individual developers to makesure they get their piece of the solution correct before the users testthe solution.
Trim Size: 6in x 9in Wells c03.tex V2 - 01/27/2017 2:09pm Page 47❦
❦ ❦
❦
Decision Architecture Methodology: Closing the Gap 47
Enablement
Testing
Training
Rollout
Figure 3.9 Enablement Phase
A component of testing is User Acceptance Testing (UAT). Thiscomponent engages users of the solution to test it to make sure itmeets the requirements laid out in Decision Analysis. During thisphase the users of the solution are testing overall functionality, accu-racy, and performance and finally accepting the solution before itgoes live.
The Training process step involves a few activities geared towardhelping users understand the solution and generate adoption. Train-ing can involve the building of online, electronic, and paper trainingmaterials. Thesematerials help walk a user through the functionality,usability, and often the decisions and actions that should be taken.
Executing on training can involve self-study, in-person, or onlinetraining classes. You need a plan with many options to help usersabsorb thematerial in a way that best suits them. Tailoring the type ofmaterial and delivery medium to the user base helps with the Rolloutprocess step, adoption, and usage.
The Rollout process step is the deployment of the solution to theend users and is the last step in the methodology. After the user baseis trained on the solution, you can flip the switch to have them beginusing the analytical solution in a production environment. Adoptioncan often be a big issue and you will need to take special care toengage the user community early and often in the process. In theirarticle, “Making Advanced Analytics Work for You,” Dominic Barton
Trim Size: 6in x 9in Wells c03.tex V2 - 01/27/2017 2:09pm Page 48❦
❦ ❦
❦
48 Monetizing Your Data
and David Court talk about the importance of adoption of an analyt-ical solution:
Managers must come to view analytics as central to solvingproblems and identifying opportunities—to make it part ofthe fabric of daily operations. Efforts will vary depending ona company’s goals and desired time line. Adult learners oftenbenefit from a “field and forum” approach, whereby theyparticipate in real-world, analytics-based workplace decisionsthat allow them to learn by doing.
At one industrial services company, the mission was toget basic analytics tools into the hands of its roughly 200 salesmanagers. Training began with an in-field assignment to read abrief document and collect basic facts about the market. Nextmanagers met in centralized, collaborative training sessionsduring which they figured out how to use the tools and marketfacts to improve sales performance. They then returned to thefield to apply what they had learned and, several weeks later,reconvened to review progress, receive coaching, and learnabout second-order analysis of their data. This process enableda four-person team to eventually build capabilities across theentire sales management organization.
Let’s review some techniques that can assist you in getting a highadoption level.
• Coaches—Typically, an analytical project can be complex; werecommend having coaches in the field to answer questionsand ensure usage of the solution. Coaches can be peersor supervisors of the user of the solution. The frequencyof coaching can be as often as daily and as far apart asmonthly. We encourage a high frequency of touchpoints atthe beginning of the rollout process.
• Performance Management—Another way to encourage adop-tion is performance management. If you can tie somethingin the employee’s yearly goals to the solution, that encour-ages adoption. For example, if you have deployed an analyticalsolution that helps people solve for the best marketing cam-paign, you can layer into the person’s yearly goals that they
Trim Size: 6in x 9in Wells c03.tex V2 - 01/27/2017 2:09pm Page 49❦
❦ ❦
❦
Decision Architecture Methodology: Closing the Gap 49
have to find a certain amount of revenue-generating initiativesfrom the solution.
• Embed the Process—Embedding the analytical solution as astep in a broader process helps with adoption. If we know weneed to use this tool before we are able to take the next stepin the process, it is ingrained in how we work. Take care toensure that the right handoffs are available in the solution tothe next step in the broader process.
• Create a Community—Ongoing engagement and continuousimprovement help build a user community that is engagedin the features and functionality for subsequent phases. Seekout feedback through newsletters, town halls, and ongoingmeetings about the solution. During these meetings, encour-age ideas around additional functionality that may be needed,maybe a new analytical function or new dataset that would sup-port a new metric. These new features generate a backlog ofwork for the next phase and excitement about the expansionof the system.
Summary
We reviewed a lot of concepts in this chapter. You may have to referto it often as you build out your solution. Do not feel obligated touse all of the methodology. If your situation does not require DataScience efforts, you can skip that process step. In addition, this is notintended to be a one-size-fits-all methodology and can be tailored tomeet your specific needs. For example, you may need approval stepsfor funding in the Discovery phase or a data governance step for anynew metrics created in the Data Development process step.
The book’s website (www.monetizingyourdata.com) is a resourcefor you to review tools, templates, and research articles that mightassist you if you are stuck in a given situation. Leverage this site as acommunity to post information to as well as seek out advice.