Embed Size (px)
Citation preview

Decisions, uncertainty, and the law
Statistical considerations of environmental risk policy
Peter Guttorp
[email protected]://www.stat.washington.edu/peter
NRCSE

Acknowledgements
Joint work with
Sofia Åberg
David Caccia
Laura Knudsen
Nicola Loperfido
Paul Sampson
Mary Lou Thompson
Larry Cox

Outline
Health effects
Regulations
Implementation
Statistical quality considerations
A general framework

Health effect studies
Often opportunistic
Rarely yield clear cutoff values
Uncertainty associated with dose-response curve
What are important health outcomes for policy setting?

Network bias
Many health effects studies useair quality data from compliance networks
health outcome data from hospital records
Compliance networks aim at finding large values of pollution
Actual exposure may be lower than network values

A calculation
X1,t
X1,t−1
X2,t−1
⎛
⎝
⎜⎜⎜
⎞
⎠
⎟⎟⎟~N3
μ1
μ1
μ2
⎛
⎝
⎜⎜
⎞
⎠
⎟⎟,
1 ρ αρρ 1 ραρ ρ 1
⎛
⎝
⎜⎜
⎞
⎠
⎟⎟
⎡
⎣
⎢⎢⎢
⎤
⎦
⎥⎥⎥
0 < ρ < 12ρ2 −1
ρ≤α ≤
1ρ
E X1,t X1,t−1 > X2,t−1( ) =μ1 + α1−ρ2
ξ1
μ1 −μ2
2 −2ρ
⎛
⎝⎜
⎞
⎠⎟

Special cases
Case Bias
negligibleμ1 >> μ2
μ1 = μ2 ≈α 1− ρ( ) / π
μ1 << μ2 ≈α μ2 − μ1( ) / 2
WHO health effects estimates for ozone
10% most sensitive healthy children get 5% reduction in lung capacity at .125 ppm hourly average
Double inflammatory response for healthy children at .09 ppm 8-hr average
Minimal public health effect at .06 ppm 8-hr average

North American ozone measurements 94-96

Transport wind vectors high regional O3 days
Task for authorities
Translate health effects into limit values for standard
Determine implementation rules for standard
Devise strategies for ozone reductionNeed to limit emissions of primary pollutants in summertime

Some standards
Ozone PM2.5
WHO 100 μg/m3
(46.7 ppb)
25 μg/m3
USA 80 ppb 35 μg/m3
EU 60 ppb 50 μg/m3
Canada 65 ppb 30 μg/m3
Max 8 hr average
24 hr ave
US 1-hr ozone standard
In each region the expected number of daily maximum 1-hr ozone concentrations in excess of 0.12 ppm shall be no higher than one per year
Implementation: A region is in violation if 0.12 ppm is exceeded at any approved monitoring site in the region more than 3 times in 3 years
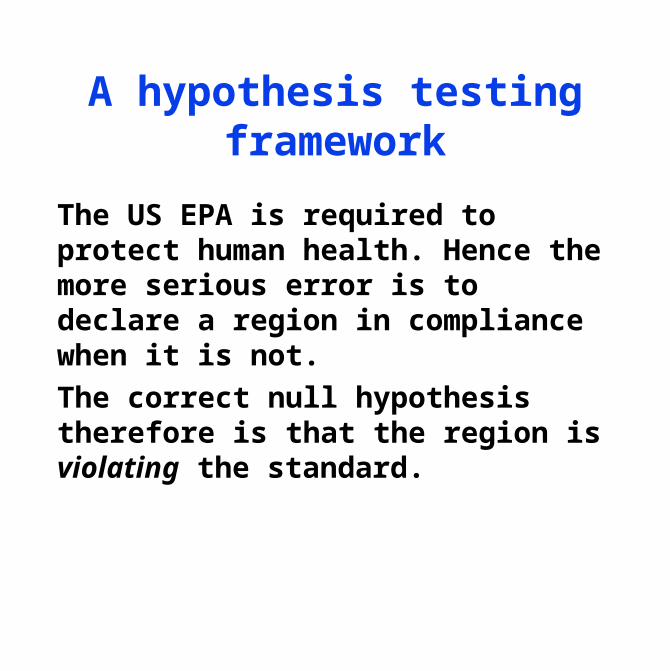
A hypothesis testing framework
The US EPA is required to protect human health. Hence the more serious error is to declare a region in compliance when it is not.
The correct null hypothesis therefore is that the region is violating the standard.

Optimal test
One station, observe Y3 = # exceedances in 3 years
Let = E(Y1)
H0: > 1 vs. HA: ≤ 1When = 1, approximately
Y3 ~ Bin(3•365,1/365) ≈ Po(3) and the best test rejects for small Y3.
For Y3 = 0 α = 0.05.In other words, no exceedances should be allowed.

How did the US EPA perform the test?
EPA wants Y3 ≤ 3, so α = 0.647
The argument is that ≈ Y3 / 3
(Law of large numbers applied to n=3)
Using Y3 / 3 as test statistic, equate the critical value to the boundary between the hypotheses (!).
This implementation of the standard does not offer adequate protection for the health of individuals.

An example
For Houston, TX, μ=0.235 (0.059 ppm) and =0.064.
The station exceeds 0.12 ppm with probability 0.041, for an expected number of exceedances of 15 (18 were observed in 1999)
At level 0.18 ppm (severe violation) the exceedance probability is 0.0016, corresponding to 0.6 violations per year (1 observed in 1999)
In order to have an exceedance probability of 1/365=.0027 we need the mean reduced to 0.182 (0.033 ppm)
Let Zi ~ N(μ,2 ).

A conditional calculation
Given an observation of .120 ppm in the Houston region, what is the probability that an individual in the region is subjected to more that .120 ppm?
Need to calculate supremum of Gaussian process (after transformation) over a region that is highly correlated with measurement site, taking into account measurement error.

Rice’s formula
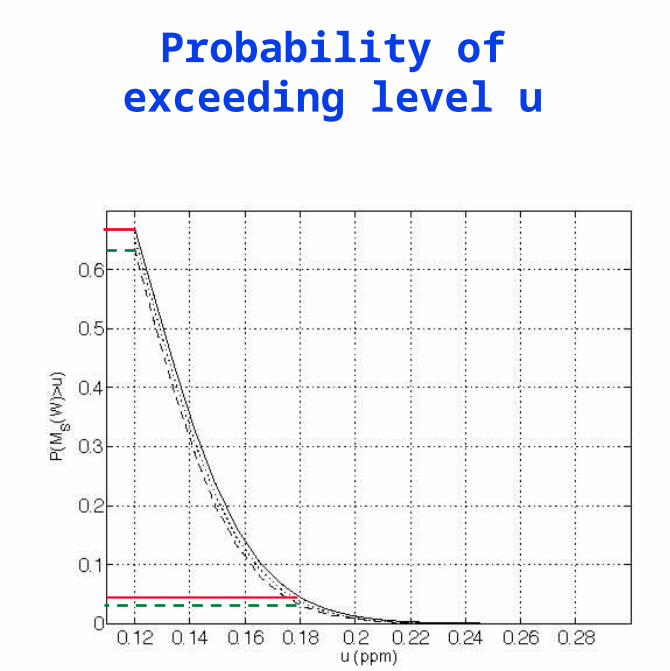
Probability of exceeding level u

Level of standard to protect against 0.18 ppm

General setup
Given measurements of a Gaussian field observed with error, find c[t] such that
where [t] denotes season and the mean of equals the -quantile of the estimated health effects distribution.
X(si, t j )ξ(s, t)
P( supv:ρ(u,v)≥β{ }
ξ(u, t) > c[ t] ) ≤α
ξ(u, t)

Are any standard setters listening to us?
Uncertainty in health effects estimation
Measurement error
Variability off network
Nonparametric methods?