Embed Size (px)
Citation preview

DEEP AQUIFER SHUTDOWN TESTS AT YALLOURN MINE
Coulthard M Dugan K
Rivalland J Wood W J
ABSTRACT
Prior to 2001 Yallourn Mine has pumped approximately 1000 Megalitres of water per annum from aquifers beneath the mine floor in order to control aquifer pressures that were thought to have an influence on mine floor and permanent batter stability. In 2001 one of the deep aquifer pumps was shut down for 5 months in order to measure the aquifer recoveries. Prior to the shutdown a UDEC model was created in order to predict what level of recovery in the aquifer pressures would be critical to mine stability. The shutdown showed that the aquifer levels recovered and stabilized at levels that did not threaten the stability of the mine. The aquifers recovered to levels below the critical levels identified in the UDEC model.

INTRODUCTION
Yallourn Mine, located in the Latrobe Valley approximately 140 kilometres east of
Melbourne (see Figure 1), has been operating since 1924. Currently there are three mines
winning brown coal in the Latrobe Valley: Yallourn, Hazelwood, and Loy Yang. The
State Electricity Commission of Victoria (SECV) managed these mines until 1996, when
Yallourn Mine was sold as part of the privatisation of the SECV. Today the mine is
operated by Roche Thiess Linfox (RTL) under an Alliance Contract with Yallourn
Energy Pty. Ltd.
Figure 1 Location Sketch
Yallourn produces approximately 17 Mtpa of brown coal. The pit void is roughly
rectangular, being 1700m long x 1300m wide, RL 38 at surface and RL –56 (AHD) at the
base of the mine. Figure 2 shows the current faces and permanent batters of the mine.

The SECV used deep aquifer dewatering programs to control the water pressure in
aquifers beneath the thick brown coal seams (Figure 3) because the aquifer pressures
were believed to have an effect on the stability of the permanent batters and floor of the
mines. Prior to 2001 Yallourn was extracting approximately 1000 Megalitres per annum
from aquifers 40 to 80 metres beneath the base of the mine.
This paper presents the results of pump shutdown tests at Yallourn and the results from
numerical modelling of the likely effects of the shutdown on the pit walls and floor.
The result from the shutdown tests was that after shutting off pump bore N5056 for 5
months and N4934 for 1 month there was no effect upon the stability of the permanent
batters or floor of the mine. Although the aquifer pressures did rise, in one bore by up to
20 metres, the pressures stabilized and stayed below the critical levels identified by
UDEC modeling.

#
#
#
Figure 2 Mine Layout
STRATIGRAPHY AND HYDROGEOLOGY
The stratigraphy of the Yallourn Mine is summarised in Figure 3: typically 10 – 44 m of
overburden overlies 50 – 88 m of brown coal, with various clays, sands and other coal
seams underlying the Yallourn Seam. The aquifers at Yallourn occur between 40 and
80m beneath the Yallourn seam.
N4934
N5280
N5056
1000m grid
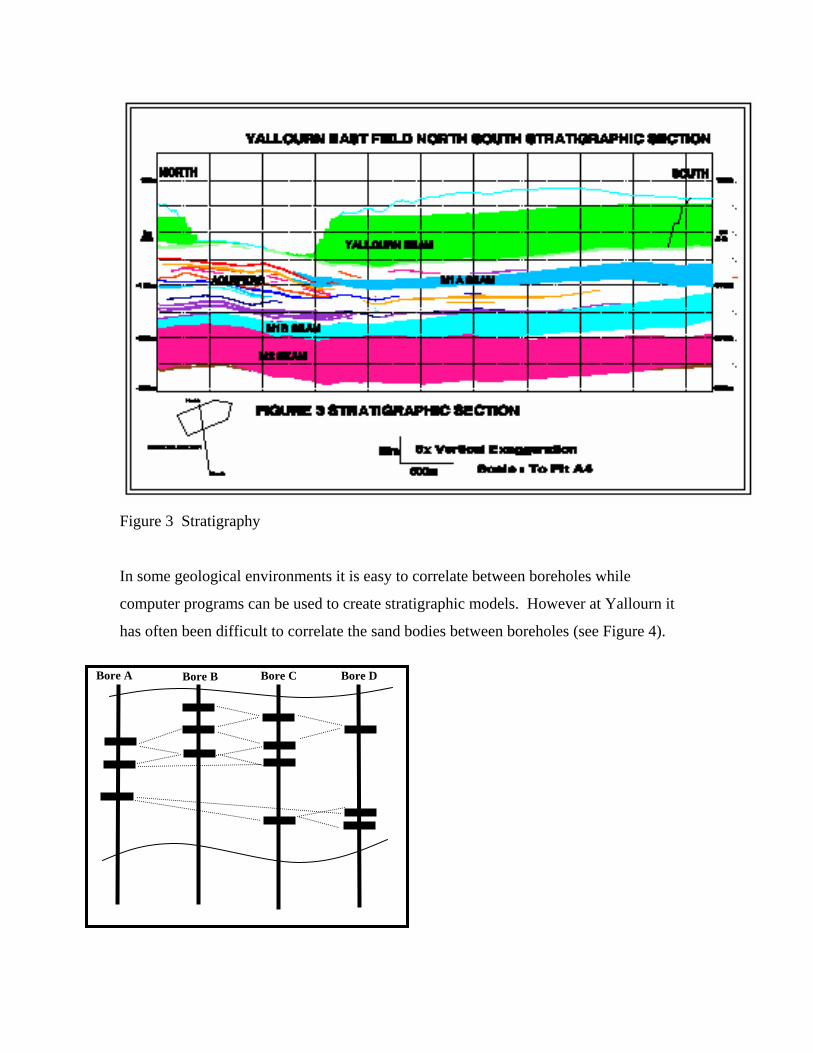
Figure 3 Stratigraphy
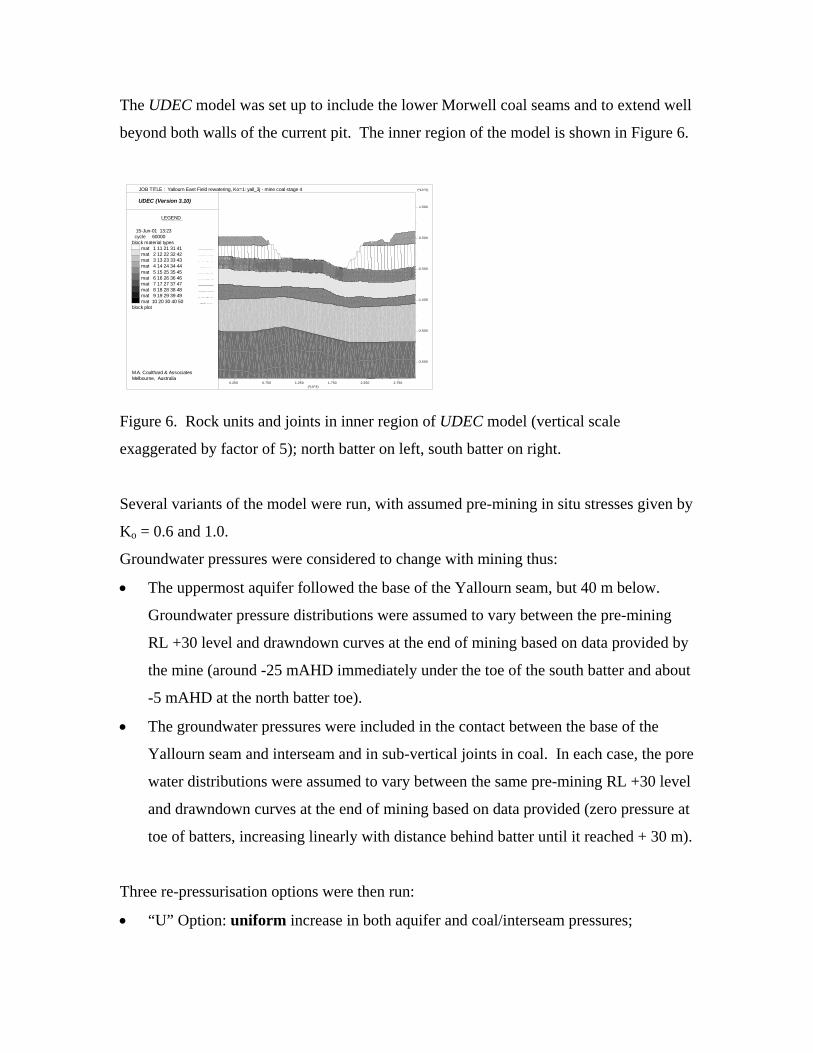
In some geological environments it is easy to correlate between boreholes while
computer programs can be used to create stratigraphic models. However at Yallourn it
has often been difficult to correlate the sand bodies between boreholes (see Figure 4).
Bore B Bore A Bore C Bore D

Figure 4 - Schematic of aquifer correlation difficulties
Between 1996 and 2001 various drilling programs were undertaken to locate and identify
sand bodies suitable for pump bores at Yallourn. Boreholes often failed to find
significant thicknesses of sand and it became increasingly difficult to correlate the sand
bodies between the bores. Following particular difficulties in locating suitable sands in
the 2000 drilling program, attempts to identify and correlate recognisable individual sand
units between the boreholes ceased.
It is thought that the aquifer systems are composed of sand lenses that are representative
of anastomosing stream channels with overbank and flood deposits associated with
various stream channels. This would account for the difficulties in intersecting sands
with some bores and the further difficulty of correlating individual sands across the bores.
DEWATERING PROGRAM
Following past experience with deep aquifer pressures at other mines, the SECV
determined that it would be necessary to install pumps in the aquifers underneath the
planned Yallourn East Field mine. Three pump bores have been installed in Yallourn
East Field – the installation dates and flow rates are tabulated in Table 1 below. Figure 2
shows locations of the three pump bores.
Table 1 - Pump bores in Yallourn East Field
Bore Installed Pumping commenced
Bore yield
(L/sec)
Drilling cost
Comments
N4934 Dec-93 18-Aug-94 21 $150,000 N5056 Mar-97 09-Nov-98 16 $130,000 N5280 Apr-00 14-Aug-00 3 $60,000 Disestablished in 2001; used
now as observation bore
In 1996 when the mine was sold the SECV prepared an estimate of the future
groundwater extractions that would be required from the deep aquifers. The predicted
extractions for the first 10 years are given in Table 2.

Table 2 - Predicted vs Actual Groundwater Extractions
Year Expected Extractions (ML) Actual Extractions (ML) 1996 473 473 1997 946 473 1998 1419 442 1999 1419 820 2000 1892 1243 2001 1892 1096 2002 1892 872 2003 2190 970 2004 2190 - 2005 2190 - 2006 2190 -
CONSEQUENCES OF AQUIFER PRESSURES
At the same time as the difficulties in establishing a consistent, stratigraphic system were
occurring, various bores in the base of the mine were registering high aquifer pressures.
Weight balance models developed by SECV indicated that these high pressures could be
capable of causing floor heave (Figure 5). Despite detailed inspections, no evidence of
batter instability or floor heave was seen in the mine.
Consequently the simple weight balance model was revised in various ways in 2000 and
2001 to include the strengths of the interseam clays and to consider discontinuous
aquifers rather than a continuous aquifer.

Figure 5 - Schematic of Simple SECV Weight Balance Model. If the Aquifer Pressure P
is greater than the depth stress corresponding to the confining weight W then there is not
enough weight in interseam clays to resist pressure from aquifer – result is floor heave.
Given the high aquifer pressures, the lack of any evidence of batter stability problems or
of significant floor heave, the discontinuous nature of the aquifers, the difficulty of
actually intersecting the aquifers with boreholes, and the much lower than expected
groundwater extraction rates, it was evident in mid 2001 that it was time to question the
thinking at the time regarding:
• The issue of aquifer pressures
• The management of aquifer pressures
• The risk management of aquifer pressures
The benefits to the mine from shutting down the dewatering program would be:
• Better understanding of sensitivity of mine stability to deep aquifer pressures – the
data gathered during a shutdown would help to quantify the problem, which in turn
would enable the mine to better identify what future drilling and pumping was
required.
P
W

If it could be proved from a shutdown test that aquifer pumping is unnecessary or can be
significantly reduced, the following would apply:
• Cost savings on future pump bores – up to $150,000 per bore with initial predictions
of one bore every 2 years.
• Less drilling required to look for sands that may or may not exist.
• Conservation of water resources
• Decreases the mine’s exposure to any future issues that might be associated with
extracting water from deep aquifers i.e. regional subsidence, effect upon other
groundwater users.
• Focus resources on other more critical issues – e.g. geologist time, resource drilling,
hydrogeology resources.
The broad consensus amongst mine personnel and consultants was that it should be safe
to conduct shutdown tests on the pumps in order to measure the rise in aquifer pressures.
However, some numerical modelling was commissioned to predict the likely effects of
such pressure rises before a final decision was taken.
UDEC MODELLING
Prior to the shut down a UDEC model (Itasca 2000a) was created to simulate what would
happen in the mine as a result of an increase in aquifer pressures. The program UDEC is
a two-dimensional distinct element stress analysis program, which can treat nonlinear
effects such as slip and separation on faults and joints, yield of rock material in shear or
tension, and large displacements and deformations. UDEC can also account for
groundwater pressures within joints (aquifers) and pore pressures within rock material. It
was chosen for this study instead of the corresponding 2D continuum program FLAC
(Itasca 2000b) so that the continuous sub-vertical J1/J2 structures in the coal seam could
be modelled explicitly.
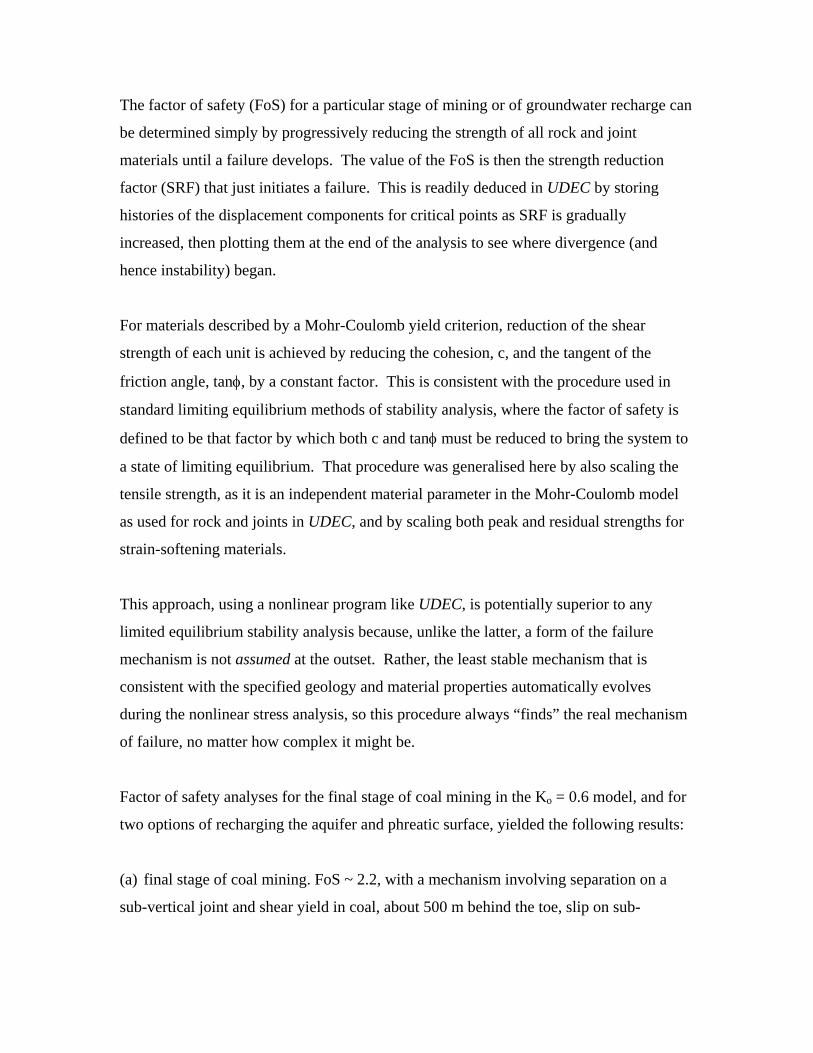
The UDEC model was set up to include the lower Morwell coal seams and to extend well
beyond both walls of the current pit. The inner region of the model is shown in Figure 6.
UDEC (Version 3.10)
LEGEND
15-Jun-01 13:23 cycle 60000 block material types mat 1 11 21 31 41 mat 2 12 22 32 42 mat 3 13 23 33 43 mat 4 14 24 34 44 mat 5 15 25 35 45 mat 6 16 26 36 46 mat 7 17 27 37 47 mat 8 18 28 38 48 mat 9 19 29 39 49 mat 10 20 30 40 50 block plot
-3.500
-2.500
-1.500
-0.500
0.500
1.500
(*10^2)
0.250 0.750 1.250 1.750 2.250 2.750(*10^3)
JOB TITLE : Yallourn East Field rewatering, Ko=1: yall_3j - mine coal stage 4
M.A. Coulthard & Associates Melbourne, Australia
Figure 6. Rock units and joints in inner region of UDEC model (vertical scale
exaggerated by factor of 5); north batter on left, south batter on right.
Several variants of the model were run, with assumed pre-mining in situ stresses given by
Ko = 0.6 and 1.0.
Groundwater pressures were considered to change with mining thus:
• The uppermost aquifer followed the base of the Yallourn seam, but 40 m below.
Groundwater pressure distributions were assumed to vary between the pre-mining
RL +30 level and drawndown curves at the end of mining based on data provided by
the mine (around -25 mAHD immediately under the toe of the south batter and about
-5 mAHD at the north batter toe).
• The groundwater pressures were included in the contact between the base of the
Yallourn seam and interseam and in sub-vertical joints in coal. In each case, the pore
water distributions were assumed to vary between the same pre-mining RL +30 level
and drawndown curves at the end of mining based on data provided (zero pressure at
toe of batters, increasing linearly with distance behind batter until it reached + 30 m).
Three re-pressurisation options were then run:
• “U” Option: uniform increase in both aquifer and coal/interseam pressures;

• “I” Option: “intermittent-in-x” increase in aquifer pressures and uniform increase in
coal/interseam pressures;
• “A” Option: uniform increase in aquifer pressures only (this was designed to give an
indication of the effects of the expected much slower recharge of the coal and
interseam pressures).
Hence, option “U” could be considered a worst case in terms of groundwater recharge
with Option “A” probably being a more likely “long term” case.
The models were initially examined at a “post mining/pre shut off” stage, to check that
they reflected the then current situation of stable batters, with no visible floor heave prior
to a pump being turned off. The UDEC model with Ko = 0.6 indicated no yield below the
pit floor and a convergence of 0.65m from the south batter crest to the north batter crest,
whereas the Ko = 1.0 model indicated sliding on the base of coal but otherwise generally
stable conditions. The Ko = 0.6 case was believed to be more realistic and more
accurately reflect the conditions of the pit.
The main results and conclusions from the Ko = 0.6 UDEC model were that south batter
failure was indicated at 60% recharge for both the “U” and “I” options. Floor heave was
obvious in the model at 40% recharge for the “U” option but at 60% for the “I” option.
For the “A” case both batters appeared stable up to the 80% recharge analysed although
local floor heave was indicated as early as a 40% recharge case. Examples of the
predicted response are shown in Figure 7.

UDEC (Version 3.10)
LEGEND
5-Jul-01 18:18 cycle 90000 block plot no. zones : total 13342at yield surface (*) 232yielded in past (X) 1159tensile failure (o) 2
-3.500
-2.500
-1.500
-0.500
0.500
1.500
(*10^2)
0.500 1.000 1.500 2.000 2.500 3.000(*10^3)
JOB TITLE : Run yall_3k - rew atering 2, uniform, aq+coal, Ko=0.6
M.A. Coulthard & Associates Melbourne, Australia
UDEC (Version 3.10)
LEGEND
5-Jul-01 18:18 cycle 90000 boundary plot joints now at shear limit joints w ith FN or SN = 0.0
-3.500
-2.500
-1.500
-0.500
0.500
1.500
(*10^2)
0.500 1.000 1.500 2.000 2.500 3.000(*10^3)
JOB TITLE : Run yall_3k - rew atering 2, uniform, aq+coal, Ko=0.6
M.A. Coulthard & Associates Melbourne, Australia
Figure 7. Groundwater pressure recharge – “U” option, 60%. Induced yield in rock material (upper plot); slip and separation on joints (lower plot).
Overall the models indicated that the south batter stability is sensitive to increasing
recharge (interseam and coal) while the north batter remains stable in virtually all cases.
Floor heave in the model was confined to the southern, lower section and could be a
localised feature due to the increase in dip of the coal in that area. Batter stability
(particularly the south batter) is sensitive to and related to the interseam and coal water
pressures rather than the recharge of the aquifer pressures (up to 80%).
It was predicted that turning the pump off and increasing the aquifer pressure to 80%
recharge would not pose a direct threat to batter stability. However, batter movements
would occur if the increase in aquifer pressure led to re-pressurisation of the interseam
and coal pressures.
The factor of safety (FoS) for a particular stage of mining or of groundwater recharge can
be determined simply by progressively reducing the strength of all rock and joint
materials until a failure develops. The value of the FoS is then the strength reduction
factor (SRF) that just initiates a failure. This is readily deduced in UDEC by storing
histories of the displacement components for critical points as SRF is gradually
increased, then plotting them at the end of the analysis to see where divergence (and
hence instability) began.
For materials described by a Mohr-Coulomb yield criterion, reduction of the shear
strength of each unit is achieved by reducing the cohesion, c, and the tangent of the
friction angle, tanφ, by a constant factor. This is consistent with the procedure used in
standard limiting equilibrium methods of stability analysis, where the factor of safety is
defined to be that factor by which both c and tanφ must be reduced to bring the system to
a state of limiting equilibrium. That procedure was generalised here by also scaling the
tensile strength, as it is an independent material parameter in the Mohr-Coulomb model
as used for rock and joints in UDEC, and by scaling both peak and residual strengths for
strain-softening materials.
This approach, using a nonlinear program like UDEC, is potentially superior to any
limited equilibrium stability analysis because, unlike the latter, a form of the failure
mechanism is not assumed at the outset. Rather, the least stable mechanism that is
consistent with the specified geology and material properties automatically evolves
during the nonlinear stress analysis, so this procedure always “finds” the real mechanism
of failure, no matter how complex it might be.
Factor of safety analyses for the final stage of coal mining in the Ko = 0.6 model, and for
two options of recharging the aquifer and phreatic surface, yielded the following results:
(a) final stage of coal mining. FoS ~ 2.2, with a mechanism involving separation on a
sub-vertical joint and shear yield in coal, about 500 m behind the toe, slip on sub-

horizontal interfaces and shear yield in (strain-softening) sub-floor material beneath crest
and in front of toe.
(b) rewatering of aquifer and coal, option “I”, 40% recharge: failure of toe of south batter
developed at SRF = 1.4.
SHUTDOWN RESULTS
On 1 October 2001 pump bore N5056 was shut down for five months, then on 21 January
2002 pump bore N4934 was shut down for 1 month. Both pumps were switched on again
on 22/23 February 2002. During the shut down, observation bores in the deep aquifers
were monitored in order to ensure that the aquifer pressures remained below the critical
levels identified by the UDEC model.
The response in the observation bores varied, with a maximum recovery of 20m
occurring in one bore relatively close to pump bore N5056; other observation bores
showed mixed responses to the rise in aquifer pressures. This is thought to be consistent
with an intermittent, discontinuous system of aquifers rather than a continuous well-
connected highly transmissive aquifer system.
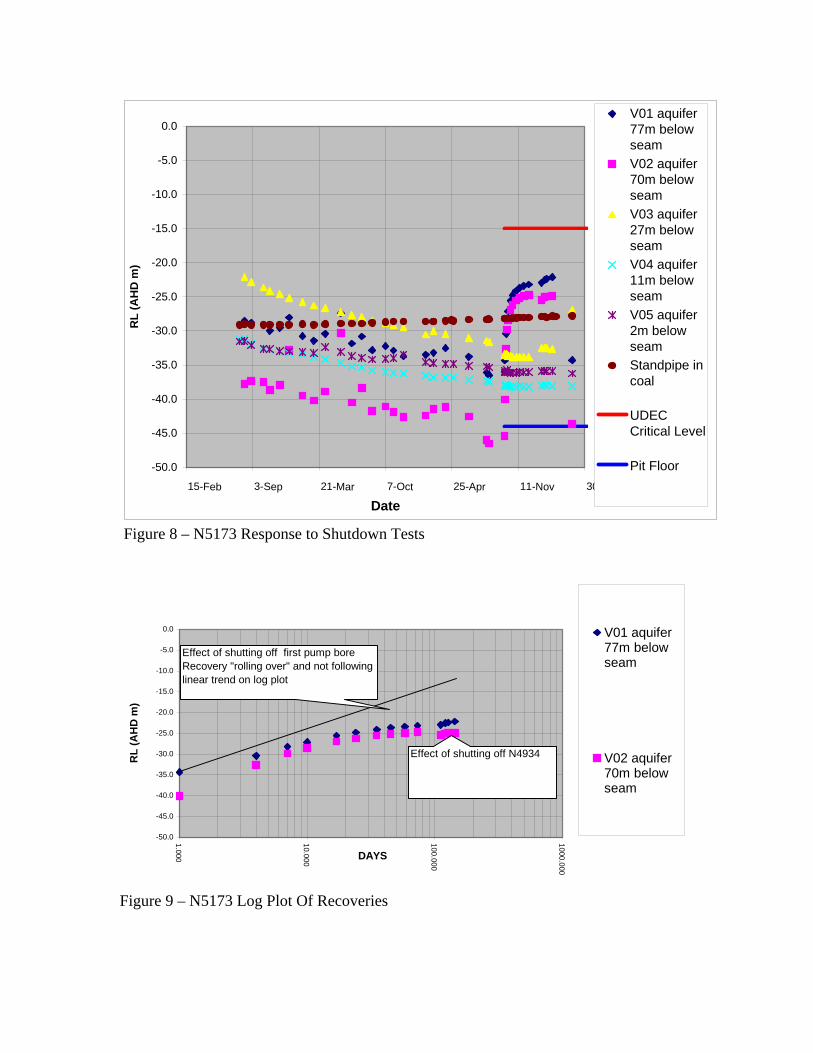
Figure 8 shows the response in bore N5173, which gave the best response of all of the
observation bores; this is thought to be due to a better connection between N5173 and
N5056 than in the other bores. Responses from the piezometers installed in the aquifers
in other observation bores varied between 0 and 10 metres. Most bores showed a quick
initial response and then flattened out in a similar fashion to bore N5173. Most
hydrographs when plotted on log paper gave a reasonably straight line. However it is of
interest to note that the log plot of bore N5173, although relatively straight, is “rolling
over” slightly and starting to plateau out at a maximum recovery (Figure 9).
-50.0
-45.0
-40.0
-35.0
-30.0
-25.0
-20.0
-15.0
-10.0
-5.0
0.0
15-Feb 3-Sep 21-Mar 7-Oct 25-Apr 11-Nov 30-May
Date
RL
(AH
D m
)
V01 aquifer77m belowseamV02 aquifer70m belowseamV03 aquifer27m belowseamV04 aquifer11m belowseamV05 aquifer2m belowseamStandpipe incoal
UDECCritical Level
Pit Floor
Figure 8 – N5173 Response to Shutdown Tests
-50.0
-45.0
-40.0
-35.0
-30.0
-25.0
-20.0
-15.0
-10.0
-5.0
0.01.000
10.000
100.000
1000.000
DAYS
RL
(AH
D m
)
V01 aquifer77m belowseam
V02 aquifer70m belowseam
Effect of shutting off first pump bore Recovery "rolling over" and not following linear trend on log plot
Effect of shutting off N4934
Figure 9 – N5173 Log Plot Of Recoveries

During the shut down fourteen survey marks were monitored to measure floor heave.
The survey marks are known locally as pins and are 19mm diameter mild steel bar, 1
metre long, hammered into the mine floor. Minimal movement was observed in these
pins (Table 3).
Table 3 - Pin movements during pump shutdown
Pin Vertical Displacement During Shutdown
(mm) YE4_1 2.5 YE4_2 -4.0 YE4_3 17.0 YE4_4 22.0 YE4_5 12.0 YE4_6 26.0 YE4_7 35.0 YE4_8 29.0 YE4_9 129.0
YE4_10 13.0 YE4_11 25.0 YE4_12 100.0 YE4_13 55.0 YE4_14 28.0 YE1_99 7.0
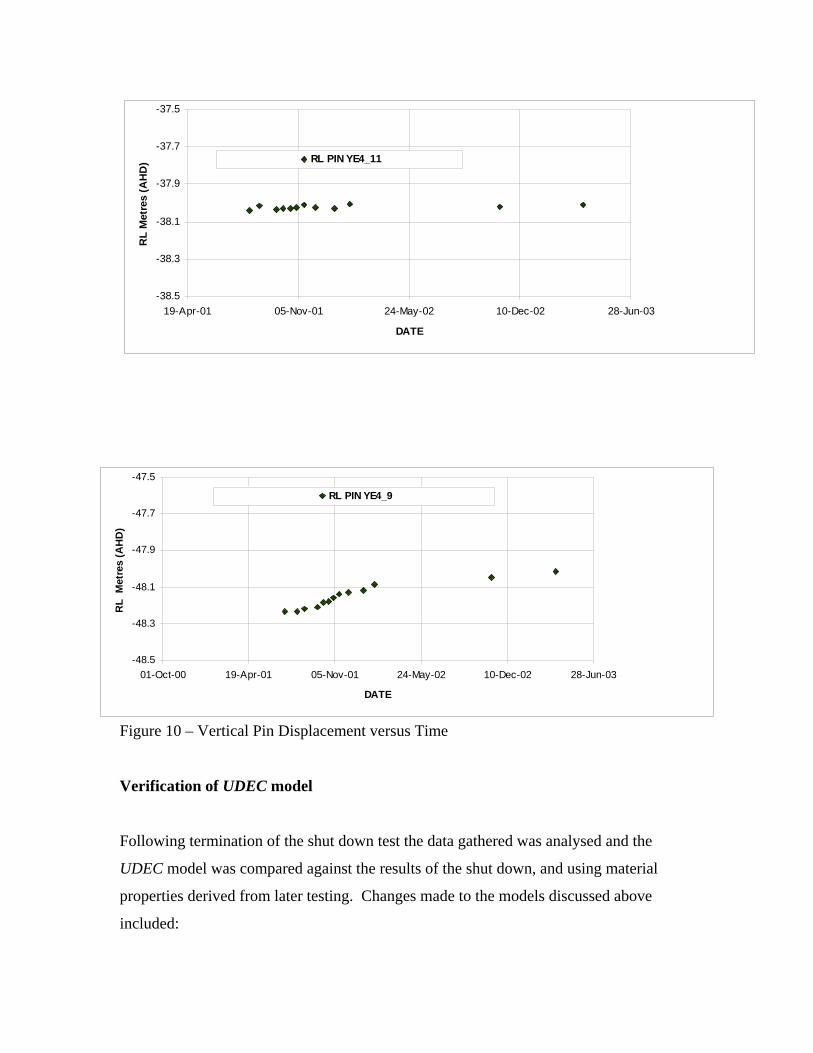
The majority of the pins showed relatively little movement during the shutdown trial. Pin
YE4_9 showed the maximum vertical movement during the shutdown test, viz. 129 mm.
This pin was close to the advancing mining face and the movement seen in this graph
could reflect local stress relief due to the advancing coalfaces. Pin YE4_11 is in the
centre of the pit and shows relatively little movement during the shutdown test (25 mm).
Fig 10 shows vertical pin displacement versus time for these two pins.
-38.5
-38.3
-38.1
-37.9
-37.7
-37.5
19-Apr-01 05-Nov-01 24-May-02 10-Dec-02 28-Jun-03
DATE
RL
Met
res
(AH
D) RL PIN YE4_11
Figure 10 – Vertical Pin Displacement versus Time
Verification of UDEC model
Following termination of the shut down test the data gathered was analysed and the
UDEC model was compared against the results of the shut down, and using material
properties derived from later testing. Changes made to the models discussed above
included:
-48.5
-48.3
-48.1
-47.9
-47.7
-47.5
01-Oct-00 19-Apr-01 05-Nov-01 24-May-02 10-Dec-02 28-Jun-03
DATE
RL
Met
res
(AH
D)
RL PIN YE4_9

• rock material moduli increased by a factor of 10, to restrict maximum pit floor
rebound to a more plausible value of about 0.5 m;
• revised strengths for coal-floor interface;
• only the aquifer was repressurised, i.e. watertable in coal and interseam material was
not altered, because the shutdown test had demonstrated that recovery of the latter
pressures lags significantly (years, not weeks) behind the aquifer;
• minor modifications to excavation regions and to watertable for final stage of
mining, to allow for lesser rebound of pit floor.
The drawndown aquifer piezometric pressure at the end of mining was as shown in
Figure 11, i.e. down to –30 m AHD over the chainage range 1600 – 1900 m, then grading
up to the assumed far-field value of +30 m AHD. The aquifer recovery options specified
by the mine, viz. to –25, 0 and +25 m AHD, were interpreted to mean that any points on
the initial piezometric curve that were below the recovery level were just reset to that
level. This is illustrated by the pressure curves for the first and second options, which are
also included in Figure 11. In the UDEC model, the relatively small change to recovery
option 1 was treated in a single analysis stage. In contrast, the change from –30 to +0 m
was set up to be analysed in four equal stages, i.e. recovery to -22.5, -15, -7.5 and then to
0 m AHD.
Overall the updated UDEC results with intermittent aquifer pressure recovery correlates
the best with the observations from the initial shutdown tests.

UDEC (Version 3.10)
LEGEND
9-Sep-02 13:46 cycle 60000 table plot -3.00E+01<tab 201> 3.00E+01-2.50E+01<tab 202> 3.00E+01 0.00E+00<tab 203> 3.00E+01 Vs. -1.50E+03<X value> 4.50E+03
-2.00 -1.00 0.00 1.00 2.00 3.00 4.00 5.00(e+03)
-4.00
-3.00
-2.00
-1.00
0.00
1.00
2.00
3.00
4.00(e+01)
JOB TITLE : Run yall_4ab - rewatering aquifer to 0 m; stage 1
M.A. Coulthard & Associates Melbourne, Australia
Figure 11. Drawn down aquifer pressure in final model (table 201) and recovery options 1 and 2 (tables 202 and 203 respectively).
A factor of safety analysis for the final stage of mining (no aquifer recharge) found that
deformations increased considerably between SRF= 1.7 and 1.8, indicating that FoS ≈
1.8. With uniform aquifer recovery to 0 m AHD, the system was stable at the first stage
(-22.5 m), but a FoS analysis had it failing slightly earlier, at SRF=1.7. However, the
strain-softening interseam material between the aquifer and the pit floor failed from about
chainage 1700 – 2000 m, at full strength, during the second stage (-15 m).
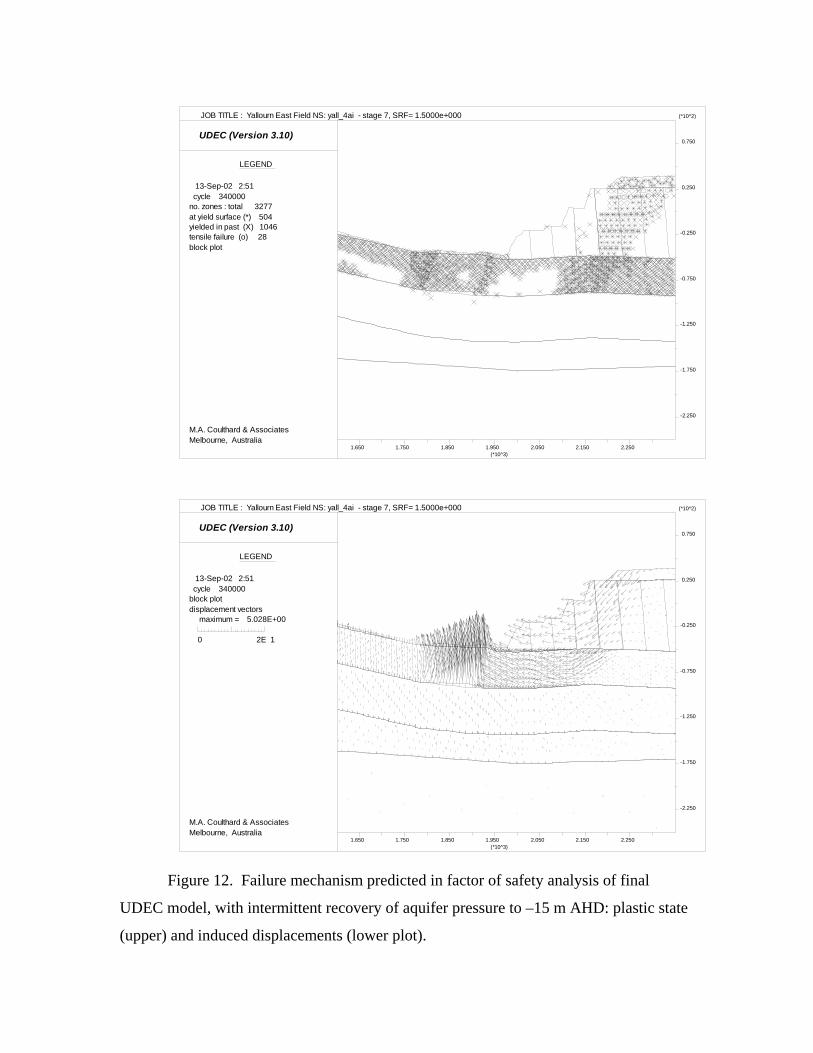
Finally, with ‘intermittent’ recovery in the aquifer pressure, to simulate the effect of sand
lenses, the system remained stable with 50% recovery, but a similar floor failure
developed at 75%, i.e. with recovery to –7.5 m AHD. A FoS analysis for the 50% case
revealed a slope failure developing at SRF=1.5. The mechanism was a mix of the
standard slope failure seen previously and the pit floor failure that developed in the
‘uniform’ case. This is illustrated in Figure 12.
UDEC (Version 3.10)
LEGEND
13-Sep-02 2:51 cycle 340000 no. zones : total 3277at yield surface (*) 504yielded in past (X) 1046tensile failure (o) 28block plot
-2.250
-1.750
-1.250
-0.750
-0.250
0.250
0.750
(*10^2)
1.650 1.750 1.850 1.950 2.050 2.150 2.250(*10^3)
JOB TITLE : Yallourn East Field NS: yall_4ai - stage 7, SRF= 1.5000e+000
M.A. Coulthard & Associates Melbourne, Australia
UDEC (Version 3.10)
LEGEND
13-Sep-02 2:51 cycle 340000 block plot displacement vectors maximum = 5.028E+00
0 2E 1
-2.250
-1.750
-1.250
-0.750
-0.250
0.250
0.750
(*10^2)
1.650 1.750 1.850 1.950 2.050 2.150 2.250(*10^3)
JOB TITLE : Yallourn East Field NS: yall_4ai - stage 7, SRF= 1.5000e+000
M.A. Coulthard & Associates Melbourne, Australia
Figure 12. Failure mechanism predicted in factor of safety analysis of final
UDEC model, with intermittent recovery of aquifer pressure to –15 m AHD: plastic state
(upper) and induced displacements (lower plot).

CONCLUSION AND CURRENT WORKS
The result from the shutdown tests was that after shutting off pump bore N5056 for 5
months and N4934 for 1 month was that there was no effect upon the stability of the
permanent batters or floor of the mine. Although the aquifer pressures did rise relatively
quickly, in one bore by up to 20 metres, the pressures stabilized and stayed below the
critical levels identified by UDEC modeling.
Following the success of the shutdown of N5056, and the analysis of the data gathered,
five new bores were drilled and installed with piezometers in the interseam clays. These
piezometers were placed under the proposed Morwell River Diversion to better measure
the effects of rising aquifer pressures upon the interseam pore pressures. The interseam
pore pressures are critical to the stability of the embankment that is currently under
construction.
Pump bore N4934 was shut down in March 2003; the shutdown test is under way at the
time of writing. It is planned to shut down pump bore N5056 again towards the end of
2003 and to monitor the aquifer pressures, interseam pressures, floor and batter
movements, in order to observe the effect of simultaneously having both pumps for an
extended period.
ACKNOWLEDGMENTS
The authors wish to thank Yallourn Energy and RTL for permission to publish this work.
REFERENCES
Dugan, K J, Coulthard, M A and Jorgensen, M, 2001. Yallourn aquifer pressure study –
final results of UDEC model, Report to Yallourn Energy Pty. Ltd. (unpublished).
Itasca, 2000a. UDEC: Universal Distinct Element Code, User Manual (Itasca
Consulting Group, Inc.: Minneapolis).

Itasca, 2000b. FLAC: Fast Lagrangian Analysis of Continua, User Manual (Itasca
Consulting Group, Inc.: Minneapolis).
Rivalland, J V, Coulthard, M A and Dugan, K.J, 2002. Yallourn coal mine – Eastfield
analyses and reviews of slope stability models 2002, Report to Yallourn Energy Pty. Ltd.
(unpublished).