Embed Size (px)
Citation preview
Contents lists available at ScienceDirect
Deep–Sea Research I
journal homepage: www.elsevier.com/locate/dsri
Variation of summer phytoplankton community composition and itsrelationship to nitrate and regenerated nitrogen assimilation across theNorth Atlantic Ocean
N. Van Oostendea,⁎, S.E. Fawcetta,b, D. Marconia, J. Lueders-Dumonta, A.J.M. Sabadelc,d,E.M.S. Woodwardd, B.F. Jönssona, D.M. Sigmana, B.B. Warda
a Department of Geosciences, Princeton University, Princeton New Jersey, USAb Department of Oceanography, University of Cape Town, Cape Town, South Africac Department of Chemistry, University of Otago, Dunedin, New Zealandd Plymouth Marine Laboratory, Plymouth, United Kingdom
A R T I C L E I N F O
Keywords:nitrate utilizationnitrogen assimilationnitrogen isotopesphytoplankton community compositionflow cytometryNorth Atlantic Ocean
A B S T R A C T
The North Atlantic Ocean is considered a nitrogen (N) limited system once vernal stabilisation of the watercolumn alleviates light limitation and allows phytoplankton growth to deplete surface nutrients to virtuallyundetectable levels. Ammonium and other regenerated N forms are then the main surface N source forphytoplankton production. The effort to determine which phytoplankton groups contribute to long-termbiological export production would be greatly aided by information on which phytoplankton groups areresponsible for the assimilation of nitrate, as opposed to those assimilating predominantly regenerated N. Inthis study, we used the natural abundance N isotopes to examine basin-scale patterns of nitrate and regeneratedN assimilation and evaluated the relationships between these trends and phytoplankton community composi-tion. Samples were collected during a summertime cruise transect (August–September 2013) from thesubtropical (36°N 73°W) to the subarctic (54°N 20°W) North Atlantic and analysed for the N isotopiccomposition (δ15N vs. N2 in air) of particulate nitrogen (PN) and nitrate, size-fractionated chlorophyll a, andphytoplankton group biomass using flow cytometry. The depth of the 300 nmol l−1 nitrate isopleth shoaled fromthe subtropics (79 m), where phytoplankton stripped surface waters of nitrate, to the subarctic, where itintersected with the surface and the upward nutrient supply drove a summer phytoplankton bloom. The δ15N ofPN above the nitracline increased from the subtropics (−0.3‰) to the subarctic (4.2‰), reflecting both achange in the δ15N of the subsurface nitrate source (from 2.4‰ to 5.1‰) and increased reliance byphytoplankton on nitrate relative to regenerated N. Throughout the transect, the phytoplankton communitywas mainly composed of pico- and nano-sized cells ( > 88% of chlorophyll a in the < 20 µm size fraction). In thepart of the transect southwest of the Grand Banks, Prochlorococcus and Synechococcus together dominated thepicophytoplankton biomass (58% and 18% on average) and comprised 35% and 9%, respectively, of combinedpico- and nanophytoplankton biomass. Pico- and nanoeukaryotes showed the opposite pattern, becoming moreimportant closer to the subarctic (up to 31% and 86% of combined pico- and nanophytoplankton biomass,respectively). The North Atlantic summertime patterns in N assimilation implied by the N isotopes wereconsistent with a higher degree of nitrate assimilation by larger eukaryotic cells and greater reliance onregenerated N by cyanobacterial picophytoplankton, congruent with the observed biomass distributions.
1. Introduction
According to the classical paradigm, the amount of new production,which drives the biological pump, is controlled by light intensity, thesupply rate of nitrate and other nutrients (phosphorus, iron) to theeuphotic zone, and the degree to which these nutrients are consumed
by phytoplankton (Dugdale and Goering, 1967). In contrast, regener-ated production is supported by forms of nitrogen (N) recycled in theeuphotic zone (predominantly ammonium and urea (Saito et al., 2014),and potentially augmented by in situ ammonia and nitrite oxidation)and, from a mass balance perspective, does not contribute to long-termexport production (Eppley and Peterson, 1979). Dinitrogen (N2)
http://dx.doi.org/10.1016/j.dsr.2016.12.012Received 2 June 2016; Received in revised form 30 November 2016; Accepted 20 December 2016
⁎ Corresponding author.E-mail address: [email protected] (N. Van Oostende).
Deep–Sea Research Part I 121 (2017) 79–94
Available online 28 December 20160967-0637/ © 2017 Elsevier Ltd. All rights reserved.
MARK

fixation, atmospheric deposition and riverine input also contributereactive N species that fuel new production, but their annual flux to thesurface ocean is minor compared to that of subsurface nitrate in theNorth Atlantic Ocean (Altieri et al., 2016; Deutsch et al., 2007; Duceet al., 2008; Gruber and Sarmiento, 1997; Oschlies, 2002).Understanding the mechanisms responsible for the patterns of primaryproduction and nutrient cycling in the ocean in part requires improvedknowledge of the spatial distribution of biodiversity and its associatedbiogeochemical activities. Phytoplankton have adapted to thrive in therange of nutrient regimes -from oligotrophic to mesotrophic- and lightregimes -from stable low- or high-light conditions to highly variableconditions– that occur in the ocean. Seasonal changes in insolation andheat flux, major hydrographic features such as ocean currents andfronts, as well as shorter-lived mesoscale eddies and meteorologicalevents all structure the distribution of phytoplankton assemblages andshape their nutrient uptake potential across the oceans (d'Ovidio et al.,2010; Garçon et al., 2001; Sambrotto et al., 1993). In turn, the speciescomposition and cell size structure of the plankton assemblage areoften characteristic of their immediate environment and its physico-chemical history.
The North Atlantic Ocean is classically considered an N-limitedsystem (Moore et al., 2013), becoming N and P co-limited further south(e.g. Moore et al. (2008)) and N and Fe co-limited further north (e.g.Nielsdóttir et al. (2009)), once the water column stratifies in spring andsummer and phytoplankton are released from the light limitation ofwinter. The North Atlantic spring bloom constitutes one of the largestbiological signals on Earth and is characterised by a succession ofphytoplankton groups (Lochte et al., 1993; Sieracki et al., 1993). Thedecreasingly turbulent, nutrient-rich, springtime conditions are char-acterised by fast-growing diatom-dominated planktonic communitiesassociated with high rates of new production and export productionuntil silicate is exhausted (Alkire et al., 2014; Cetinić et al., 2015;Rynearson et al., 2013). These high-biomass diatom blooms are thensucceeded by communities of smaller phytoplankton species (e.g.,coccolithphores) and mixotrophic flagellate species (e.g., dinoflagel-lates) in the more quiescent and nutrient-deplete summertime condi-tions, or in water masses originating from the subtropics (Barton et al.,2013; Dandonneau et al., 2004; Tarran et al., 2001).
At lower chlorophyll a concentrations ([Chla] < 1 mg m−3), whichare typically observed in low nutrient supply systems, the smallestnano- and picophytoplankton size-fractions make up the largest shareof total Chla (Chisholm, 1992; Marañón et al., 2012; Raimbault et al.,1988). The dominance of the pico- and nanophytoplankton biomass inthis case is reflected in their substantial contribution to primaryproductivity (Joint et al., 1993; Marañon et al., 2001). Beyond thepartitioning of phytoplankton functional groups into size classes(Sieburth et al., 1978), techniques such as flow cytometry have allowedquantification of at least some of their considerable phylogenetic andfunctional diversity (e.g., the distinction between phycoerythrin-con-taining cyanobacteria and coccolithophores), therefore allowing forextensive sampling and recognition of macro-ecological patterns inphytoplankton community structure (Li, 1997, 2002; Tarran et al.,2006). The picophytoplankton community (cell diameter < ~2–3 µm),of which the prokaryotic cyanobacterial genera Prochlorococcus andSynechococcus are usually numerically dominant, also harbours aconsiderable amount of eukaryotic diversity (Hooks et al., 1988;Kirkham et al., 2013; Vaulot et al., 2008). The larger cell size of theseeukaryotes means that, although they are typically less numerically-abundant than the very small picocyanobacteria (cell diameter ~0.6–1.2 µm), they often dominate the phytoplankton biomass (Li, 1995).The relatively larger nanophytoplankton, on the other hand, have onlyfairly recently been routinely measured using flow cytometry instead ofepifluorescence microscopy or concentrations of marker pigments(Tarran et al., 2006), which has allowed for higher sample throughput.The combination of phytoplankton community analysis with estimatesof phytoplankton group biomass based on flow cytometric size mea-
surements allows for a more quantitative understanding of thefunctioning of microbial communities (Laney and Sosik, 2014; Olsonet al., 1989; Rodrı́guez et al., 1998; Zubkov et al., 1998).
Intense biological activity during the spring and early summer inthe North Atlantic depletes the surface nutrients (Joint et al., 1993),and nutrient resupply from deeper waters is hampered by furtherstrengthening of the pycnocline. This leads to microbial communitiesbecoming increasingly dependent on regenerated forms of N forgrowth, such that they contribute less to new-, and by extensionexport-, production (Azam et al., 1983; Eppley and Peterson, 1979;Pomeroy, 1974). However, some phytoplankton groups appear to beeffective at assimilating nitrate at the low concentrations available atthe base of the euphotic zone in oligotrophic systems, and/or con-tribute disproportionally to carbon export. For example, pigment datafrom the subtropical North Atlantic suggest that nanoeukaryotescontribute equally to particulate organic carbon (POC) export andautotrophic biomass, while cyanobacteria contributions to POC exportare one-tenth of their contribution to autotrophic biomass (Lomas andMoran, 2011). Moreover, recent observations from the western andeastern subtropical North Atlantic have shown the importance ofpicoeukaryotes in nitrate assimilation and their potential for exportproduction compared to prokaryotic phytoplankton (Fawcett et al.,2011; Painter et al., 2014), even when euphotic zone nitrate concen-trations are below the limit of conventional colorimetric detectiontechniques. These findings emphasise the need for investigation of thedistribution and abundance of the diverse picoeukaryotic phytoplank-ton from oligo- to mesotrophic oceanic regimes.
Phytoplankton growth and community structure are closely linkedto the availability and biogeochemistry of N. Natural variations in the Nisotopes of nitrate and suspended particulate N (PN) provide anintegrative view of the N cycling activity of upper ocean biota.Regional and local differences in the supply of N to the euphotic zoneas either subsurface nitrate or recycled N will be reflected in the δ15N ofPN (δ15N, in per mille (‰) vs. N2 in air,={[(15N/14N)sample/(15N/14N)air]–1}×1000). Under nitrate-deplete summertime condi-tions, N forms regenerated by euphotic zone biota (predominantlyammonium) are thought to support most phytoplankton growth(Dugdale and Goering, 1967; Eppley and Peterson, 1979). The δ15Nof ammonium produced by surface ocean recycling is inferred to be lowbased on the amplitude of the isotopic fractionation associated with itsproduction (Checkley and Miller, 1989; Macko et al., 1986; Silfer et al.,1992). In addition to assimilation by phytoplankton, another possiblefate for euphotic zone ammonium is oxidation to nitrite and thennitrate (i.e., nitrification), which has the potential to complicateestimates of new production (Yool et al., 2007). However, like recycledammonium, nitrate regenerated in euphotic zone waters will be low inδ15N (DiFiore et al., 2009; Fawcett et al., 2011). This is because thecombined isotope effect of ammonia and nitrite oxidation is signifi-cantly greater than that of ammonium and nitrite assimilation (14–19‰ vs. 0–3‰; Casciotti, 2009; Casciotti et al., 2003; Hoch et al.,1992; Liu et al., 2013; Mariotti et al., 1981; Pennock et al., 1996),resulting in low-δ15N N being preferentially channelled into the nitratepool (Suppl. Text 2.1). Thus, the assimilation of recycled N, be itammonium or regenerated nitrate, will produce euphotic zone PN thatis low in δ15N.
The δ15N of subsurface ocean nitrate ranges between 2.4‰ and5.1‰ in our study region (see below; Marconi et al., 2015). In the caseof a high degree of consumption of the gross nitrate supply and lackingsubstantial assimilation of other (e.g., regenerated) N sources, the δ15Nof surface PN should approximate the δ15N of this source nitrate(Altabet and Francois, 1994). Thus, suspended PN comprising mainlynitrate-assimilating phytoplankton will have a higher δ15N than if themain phytoplankton N source had been regenerated N (Altabet, 1988;Fawcett et al., 2011). Concomitant measurements of the δ15N of PNand nitrate can therefore offer a spatiotemporally integrated view ofupper ocean N consumption and provide more information about N
N. Van Oostende et al. Deep–Sea Research Part I 121 (2017) 79–94
80
transformation processes than measurements of N concentrationsalone.
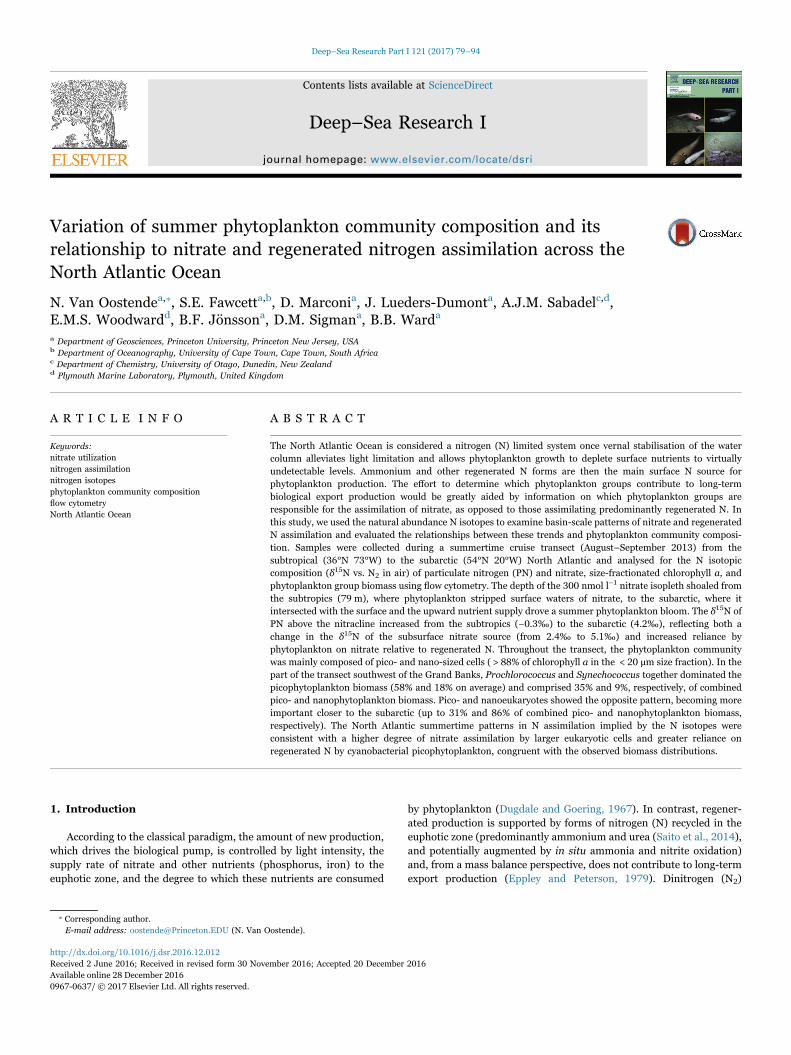
The goal of this study was to determine the basin-scale patterns ofN assimilation across the North Atlantic Ocean and its relationship tothe phytoplankton community size-structure and composition. To thisend, we assessed primary production and N cycling using a suite ofphysical, ecological, biogeochemical and isotopic measurements madealong a summer transect from the subtropical to the subarctic NorthAtlantic Ocean (Fig. 1). We hypothesised that the relative dominance ofthe phytoplankton community by pico- and nanoeukaryotes, comparedto cyanobacterial picophytoplankton, would increase towards thesubarctic North Atlantic in parallel with an increase in nitrateassimilation as recorded by the δ15N of upper ocean nitrate and PN.
2. Methods and materials
The cruise transect was carried out in late summer of 2013 (23rd ofAugust to 3rd of September) on board the R/V Endeavor, which sailedfrom Morehead City, North Carolina (34.7°N 76.7°W) to the subarcticNorth Atlantic (54.0°N 20.4°W) (Fig. 1). Daily conductivity-tempera-ture-density (CTD) casts to 1000 m depth were performed at dawn, at12 stations, at intervals of approximately 220 nautical miles (~410 km;Table 1). At each station, water for the determination of chemical andbiological variables was collected from 9 depths using a set of 12 Niskinbottles (30 l capacity). Surface water samples (5 m depth) werecollected via the ship's clean seawater inflow at each station, and every6 h along the transect. Results from chemical, biological, and CTDmeasurements are available at BCO-DMO: http://www.bco-dmo.org/project/544343.
2.1. Hydrographic parameters
The depth of the mixed layer (MLD) was derived using a differencein density threshold of 0.045 kg m−3 from the water density value at10 m depth (cf. de Boyer Montégut et al. (2004)). Because most CTDcasts were performed at dawn, the euphotic zone depth (Zeu), which wedefine as the depth at which light intensity is 1% of its surface value,was derived from each vertical chlorophyll a (Chla) profile (see below)by progressively integrating the water column Chla content [ΣChla] tosimultaneously obtain [ΣChla] and Zeu through an iterative process(described by Morel and Berthon (1989) and re-parameterised inMorel and Maritorena (2001)). Based on the work of Marra et al.(2014) in the western North Atlantic, and according to equation 3 inBoss and Behrenfeld (2010),
Z log PAR Z log= (0. 17/0. 98 × ) × ( / (0. 01)),Ic eu10 10
we assumed 0.17 mol quanta m−2 day−1 to be the compensationirradiance (Ic) below which light is insufficient to support net photo-
Fig. 1. Bathymetric map of stations in the southwest (black symbols), shelf (greysymbol) and northeast (white symbols) section of the transect.
Table
1Locationan
dsamplingdateof
tran
sect
stations.
Zeu:eu
photic
zonedep
that
1%of
surfacePAR;MLD:mixed
layerdep
th;ZIc:ligh
tcompen
sation
dep
th;ΣChla:dep
th-integrated
Chla
from
surfaceto
ZIc.
Transect
section
Station
Date
Latitude(°N)
Lon
gitude(°W)
Zeu
(m)
ZIc(m
)MLD
(m)
Nitraclinedep
th(m
)30
0nmol
[NO
3- ]l-1isop
leth
(m)
ΣChla
(mgm
−2)
Southwest
220
13–08
–23
35.55
73.27
115
143
2665
7912
.13
2013
–08
–24
37.44
68.51
103
126
3310
710
115
.54
2013
–08
–25
38.78
64.71
120
115
4579
859.9
520
13–08
–26
40.27
60.00
106
130
3054
5714
.66
2013
–08
–27
41.90
55.06
9010
821
7071
18.7
Shelf
720
13–08
–28
43.96
50.13
57a
57a
2230
3312
.78
2013
–08
–29
45.74
45.17
8310
117
4546
18.0
920
13–08
–30
47.71
39.50
7771
3035
3718
.2
Northeast
1120
13–08
–31
49.35
34.69
7182
2835
4123
.512
2013
–09
–01
50.93
29.90
7079
3833
3722
.013
2013
–09
–02
52.64
24.45
5058
3642
033
.615
2013
–09
–03
54.02
20.44
5247
3945
030
.4
aBecau
seof
thelow
valueof
thederived
ligh
tattenuationcoeffi
cien
tat
station7,
thebo
ttom
dep
this
listed
insteadof
Zeu
andZIc.
N. Van Oostende et al. Deep–Sea Research Part I 121 (2017) 79–94
81

autotrophy. Although this Ic value may be an underestimate (Lawset al., 2014), it encompassed the depth of maximum Chla concentrationat the southwestern stations of our transect and did not significantlyaffect the [ΣChla] at the northeastern stations compared to higher Icvalues found in the literature (cf. Letelier et al. (2004)). This lightcompensation depth (ZIc), the lower boundary of a stratum of constantdaily integrated photon flux, was calculated using the previously-estimated Zeu and the surface daily integrated photosyntheticallyavailable radiation (PAR) values obtained from NASA Aqua Modislevel 3 data. Because of the small light attenuation coefficient derived atstation 7, the bottom depth was used instead of Zeu and ZIc.
2.2. Nutrient and chlorophyll measurements
Seawater for nutrient assays was collected from the Niskin bottlesattached to the CTD/Rosette system into acid cleaned (10% HCl), ‘aged’by multiple water rinsing and soaking cycles, 60 ml HDPE (Nalgene)sample bottles. In most cases, samples were analysed immediately fornutrients, and always within 2–3 h of collection. The micromolarnutrient analysis was carried out using a Bran and Luebbe 5-channel(nitrate, nitrite, phosphate, silicate, ammonium) AAIII segmented flow,colorimetric, autoanalyser, using classical proven analytical techniques(Woodward and Rees, 2001). Micromolar detection limits for nitrate,nitrite, and phosphate were 0.2 µmol l−1, and for ammonium was0.5 µmol l−1. The concentration of silicate was always within thedetection limit of the analyser. The accuracy of the measurementswas 1–2%.
Nanomolar ammonium was analysed using a method based on thegas diffusion of ammonia across a Teflon membrane driven by adifferential pH gradient, and detection by a Jasco fluorometer (adapta-tion of Jones (1991)) following its reaction with a fluorescent reagent.Nanomolar nitrate, nitrite, and phosphate were detected using colori-metric methodologies as with the standard segmented flow analyser,but using 2 m long Liquid waveguides capillary cells as the analyticalflow cells; the detection limits for nanomolar nitrate and phosphatewere 1 nmol l−1, and for nitrite was 0.5 nmol l−1. The nitracline wasdefined as the sampling depth in the upper 150 m of the water columnat which the nitrate concentration gradient was the steepest. The depthof the 300 nmol nitrate l−1 isopleth was obtained from individualnutrient profiles through linear interpolation.
Clean handling techniques were employed to avoid any contamina-tion of the samples, particularly for the ammonium samples. Dura-Touch gloves were used at all times and samples were not decanted ortransferred, but were kept tightly closed until just before ammoniumanalysis in order to avoid any contamination from external sources. Nowater column nutrient samples were frozen or stored. All sampling andhandling techniques, whenever possible, followed the internationalnutrient GO-SHIP manual (Hydes et al., 2010).
Discrete Chla samples were measured fluorometrically (Holm-Hansen and Riemann, 1978) at 6 depths spanning the surface, thebottom of the euphotic zone, and the mixed layer and Chla maximumdepths. Up to 4 l of seawater, retrieved directly from the Niskin bottlesor the surface seawater inflow, were sequentially filtered through a20 µm pore-size polycarbonate filter, a 2 µm pore-size polycarbonatefilter, and a 0.3 µm pore-size glass fiber filter (GF-75; Sterlitech;47 mm diameter). Filtrations were performed in the dark under lowvacuum ( < 200 mbar). The Chla filters were packaged into aluminiumfoil (GF filter) or a 5 ml cryovial (polycarbonate filters) and immedi-ately frozen at −80 °C until analysis. Chlorophyll was extracted in 90%acetone at 4 °C overnight and measured using a Turner Trilogyfluorometer, calibrated against a pure Chla standard (Anacystisnidulans Chla, Sigma-Aldrich, Saint-Louis, USA). Measurements werecorrected for the fluorescence of phaeopigments after acidification withHCl (24 mM final concentration). Depth-integrated Chla was calculatedusing the fluorometric measurements from the CTD casts (Fluo), whichwere rescaled according to the relationship between log10[Chla] and
log10[Fluo] (log10[Chla] (ng l−1)=0.74×log10[Fluo] +2.52; r2=0.74, p
< 0.001, df=95) and checked for the absence of systematic residualerrors. The proportion of Chla in each biomass size fraction along thedepth profile was linearly interpolated using the point measurements ofsize-fractionated Chla. Depth-integrated Chla in each size fraction wascalculated by trapezoidally integrating the rescaled [Fluo] over thewater column to ZIc or the MLD, whichever was deepest.
2.3. Nitrogen isotope measurements
2.3.1. Water column nitrate+nitriteSeawater samples for analysis of the N isotopic composition of
nitrate+nitrite and nitrate-only were collected unfiltered at regulardepth intervals from the surface to 1000 m in 60 ml ( > 150 m) or125 ml ( < 150 m) square-bottomed, wide-mouth HDPE bottles(Nalgene). Bottles were acid-washed and rinsed with deionised waterprior to sampling. At sea, pre-labelled bottles and caps were rinsedthree times with sample water, filled to ~85% of the bottle volume, andfrozen upright at −20 °C until analysis.
Isotopic analyses were conducted using the “denitrifier method”,wherein denitrifying bacteria lacking nitrous oxide (N2O) reductasequantitatively convert nitrate and nitrite in the sample to N2O gas(Casciotti et al., 2002; Sigman et al., 2001) (see also Weigand et al.(2016)) for the updated protocol used for analysing these samples). Theisotopic composition of N2O was then measured by gas chromatogra-phy-isotope ratio mass spectrometry (GC-IRMS) using a purpose-builton-line N2O extraction and purification system and a Thermo MAT 253mass spectrometer. Seawater solutions of the international nitratereference materials, IAEA-N3 and USGS-34, as well as an in-houseN2O standard, were run in parallel with the samples in order tomonitor the quality of bacterial N conversion and mass spectrometricmeasurements. The reference materials bracketed each group of ~10samples and were used to correct the measured δ15N to N2 in air(Casciotti et al., 2002; McIlvin and Casciotti, 2011; Sigman et al.,2001). Data are reported here only for samples with nitrate+nitriteconcentrations ≥300 nmol l−1.
The presence of nitrite, even at very low concentrations, cansignificantly alter the isotopic composition of nitrate+nitrite relativeto that of nitrate alone (Fawcett et al., 2015; Granger and Sigman,2009; Marconi et al., 2015; Smart et al., 2015). In this study, we usedthe δ15N of nitrate-only to avoid interference from the isotopiccomposition of nitrite, which originates from the first step of nitrifica-tion or is excreted by phytoplankton following intracellular nitratereduction to nitrite (Lomas and Lipschultz, 2006); it thus does notcontribute to new production sensu strictu. The mean differencebetween the δ15N of nitrate+nitrite and the δ15N of nitrate-only inthe upper 150 m was ~1‰, and this was mostly dependent on therelative contribution of nitrite to the combined nitrate+nitrite pool (6%on average). However, the nitrite concentration was significant attimes, and the greatest δ15N difference (~4.8‰) was observed wherethe contribution of nitrite to the nitrate+nitrite pool was highest (32%at ~60 °W; station 5 at 60 m).
In order to measure the δ15N of nitrate-only for samples with adetectable concentration of nitrite, a nitrite removal pre-treatment isrequired. The detection limit for nitrite in this case was 2 nmol kg−1.Samples collected between the surface and ~125 m were treated fornitrite removal via the addition of 10 µl of sulphamic acid solution perml of sample, which converts sample nitrite to N2 gas with a reactiontime of 2–8 min, followed by the addition of 5.5 µl of 2 M NaOH per mlof sample to restore the pH of the sample to ~7–9 (Granger andSigman, 2009). The pooled standard error for δ15N was 0.04‰ and0.11‰ (n≥3) for nitrate+nitrite and nitrate concentrations ≥0.5 µmoll−1 and < 0.5 µmol l−1, respectively. Hereafter, “nitrate” in the textrefers to nitrate-only, after the subtraction (for concentration) orremoval (for δ15N) of nitrite.
N. Van Oostende et al. Deep–Sea Research Part I 121 (2017) 79–94
82

2.3.2. Suspended particulate NSuspended PN was collected at various depths throughout the
euphotic zone, including within the surface mixed layer and at thedepth of maximum Chla concentration, by gentle vacuum filtration ( <135 mbar), of 8 l of seawater through a GF-75 filter. Filters weretransferred to pre-combusted (500 °C for 5 h) aluminium foil envel-opes, and immediately frozen at −80 °C until analysis. In the labora-tory, the PN filters were dried in a desiccating oven at 40 °C. Threesubsamples were cored from each filter and transferred to combusted4 ml glass Wheaton vials. PN was oxidised to nitrate using thepersulphate oxidation method of Knapp et al. (2005), and as modifiedby Fawcett et al. (2011, 2014); this was conducted in a laminar flowhood equipped with an ammonia/amine filter. Briefly, 2 ml of persul-phate oxidising reagent (POR) were added to each sample vial, as wellas to triplicate vials containing a filter blank plus varying quantities oftwo L-glutamic acid isotope standards, USGS-40 and USGS-41 (Qiet al., 2003); this allows determination of the N content and δ15N of thePOR+filter blank. The POR was made by dissolving 2.5 g of 4×recrystallised, methanol-rinsed potassium persulphate and 2.5 g ofsodium hydroxide in 100 ml of ultra high-purity deionised water.Following POR addition, vials were autoclaved at 121 °C for 55 minon a slow-vent setting, after which sample pH was lowered to 6–8 using12N HCl. The concentration and δ15N of the resultant nitrate wasmeasured via chemiluminescent analysis (Braman and Hendrix, 1989)and the denitrifier method (see above) (Casciotti et al., 2002; Sigmanet al., 2001). The final N content and δ15N of the oxidised samples wascorrected for the POR+filter blank. N content was converted to PNconcentration by normalising to whole-filter area and volume ofseawater filtered. For each station, upper ocean average δ15N-PN wascalculated by trapezoidally integrating the PN concentration from thesurface to the nitracline depth or the MLD, whichever was deepest, andthen weighting the individual measurements of δ15N-PN by the depth-integrated PN concentration for each depth interval. In order tocompare upper ocean δ15N-PN across the transect without the con-founding effect of the variable source nitrate δ15N, the measured δ15Nof nitrate at 250 m or 300 m at each station was subtracted from themass-weighted average δ15N-PN. Station 7 (bottom depth of 57 m) wasexcluded from these calculations due to the uncertainty of the δ15N ofits nitrate source and the potential impact of sedimentary processes onδ15N-PN.
2.4. Plankton abundance and biomass determination
The cell abundance of pico- and nanophytoplankton ( < ~14 µm celldiameter) was determined by flow cytometric analysis of 1500 µl ofglutaraldehyde-preserved (1% v/v) (Marie et al., 1997) samples using aBD Accuri C6 flow cytometer equipped with a blue laser (488 nm), at aflow rate of 100 µl min−1, and a core diameter of 22 µm. Standardfluorescent bead solutions were prepared daily and used as an internal
standard to assess instrument performance, to standardise scatter andfluorescence measurements (Rainbow Calibration Particles (8 peaks),BD Biosciences), and to validate the flow rate (TruCount, BDBiosciences) for quantitative applications. Each sample was run withfluorescent beads (YG beads, 0.94 µm Fluoresbrite® Yellow GreenMicrospheres, Polysciences, Inc.) as an internal standard for forwardscatter measurements.
Several phytoplankton groups were distinguished based on theirforward (FSC) and side scatter (SSC), Chla, and phycoerythrin (PE)fluorescence signals (Table 2): the picophytoplankton ( < ~2.5 µm)group comprised PE-containing Synechococcus and non-PE-contain-ing picoeukaryotes (picoEuks), the nanophytoplankton groups(nanoEuks, > ~2.5−14 µm) included PE-containing nanophytoplank-ton (PE-nanoEuk), non-PE-containing phytoplankton (noPE-nanoEuk), and coccolithophores (Cocco) (the latter group was identi-fied based on their enhanced side scatter signal). Representative flowcytometry density plots from which the phytoplankton populationswere identified are shown in Fig. S1.
The picoplanktonic Prochlorococcus cells were counted in SYBRGreen I-stained samples (Marie et al., 1997), according to (Heywoodet al., 2006), because of the difficulty of discriminating unstained cellsfrom background noise. The concentration of heterotrophic bacterialcells was determined by flow cytometric analysis of 250 µl of glutar-aldehyde-preserved (1% v/v) and SYBR Green I-stained (1:7500)samples according to Marie et al. (1997) and Gasol and Del Giorgio(2000). The Prochlorococcus and heterotrophic bacteria samples wereanalysed using a BD Accuri C6 flow cytometer, at a flow rate of35 µl min−1, and a core diameter of 16 µm. All plankton groups weregated and their abundance quantified using FlowJo software (Tree Star,Inc., www.flowjo.com).
The biovolume of phytoplankton cells analysed by flow cytometrywas derived from forward scatter measurements of individual cellsbased on the polynomial relationship between the log10 of measuredbiovolumes of pico- and nanophytoplankton cells and the log10 of thepeak area of their forward scatter signal (FSC-A) (Laney and Sosik,2014). A calibration procedure, using bead stocks and an unidentifiedcultured picoeukaryote from the Sosik Lab at Woods HoleOceanographic Institution, confirmed the inter-lab agreement of flowcytometry-derived biovolume estimates (Fig. S2). Since the largestphytoplankton cell in the empirical relationship of Laney and Sosik(2014) had a cell diameter of 14 µm and the number of cells larger thanthis in our samples was negligable, only cells up to ~14 µm in diameterwere included in the cell abundance and biovolume calculations.Cellular biomass was estimated according to the relationship betweencellular biovolume (µm3 cell−1) and carbon content (pmol cell−1) forglutaraldehyde preserved pico- and nanophytoplankton cells from(Verity et al., 1992): C =(0.433 ⁄12)×biovolume0.863.
Although Synechococcus cells could readily be counted based on theirsize and their characteristic PE fluorescence, the high signal-to-noise
Table 2Planktonic groups quantified by flow cytometry and distinguished based on their fluorescence and light scattering properties. These properties included chlorophyll (Chla) fluorescence(fluo.), phycoerythrin (PE) fluo., light side scatter (SSC) and forward scatter (FSC) signals. Nanoeukaryote phytoplankton (nanoEuks) include noPE-, PE-nanoEuk and Cocco (see textfor explanation of abbreviations).
Planktonic group Group abbreviation Cell size (µm) Chla fluo. PE fluo. SSC vs. FSC Stained DNA fluo.
Non-PE nanoeukaryote phytoplankton noPE-nanoEuk ~2.5−14 Yes No Low –
PE nanoeukaryote PE-nanoEuk ~2.5 − 14 Yes Yes Low –
PhytoplanktonCoccolithophore Cocco ~2.5 − 14 Yes No High –
Picoeukaryote Phytoplankton picoEuk ~1 − 2.5 Yes No Low –
Synechococcus – ~1 Yes Yes Low –
Prochlorococcus – < 1 Yes No Low YesHeterotrophic bacteria – < 1 No No Low Yes
N. Van Oostende et al. Deep–Sea Research Part I 121 (2017) 79–94
83

ratio in the FSC-A channel of the Accuri precluded a reliable cell sizeestimate for particles smaller than 1 µm. Therefore, the biomass ofSynechococcus was estimated using a conversion factor of 140 fg C cell−1
assuming a cell diameter of 1 µm and 270 fg C µm−3 (Bertilsson et al.,2003). The biomass of Prochlorococcus cells was calculated by using anaverage cellular carbon content of 53.5 fg C cell−1 (Bertilsson et al.,2003), which is very similar to the range of cellular carbon contentdetermined by Casey et al. (2013) for Prochlorococcus in the euphoticzone.
2.5. Primary productivity
Primary production rates were determined with the 13C-uptaketechnique using on-deck, running surface seawater-cooled incubations,which simulated the in situ irradiance conditions at three depthscorresponding to 55%, 33%, and 1% of surface PAR. The incubationswere started at dawn by adding 1.40 ml of a freshly prepared 13C-labelled (99%) bicarbonate solution (for a final concentration of200 µmol 13C l−1) to each light-shielded, mesh-wrapped polycarbonateincubation bottle, and lasted for 6.5 ± 0.2 h. The entire content(2300 ml) of each incubation bottle was then filtered through acombusted (450 °C for 5 h) GF-75 filter and frozen at −80 °C untilanalysis on land. In the laboratory, frozen GF-75 filters were thawedand fumed with concentrated HCl for 6 h to remove inorganic carbon,after which they were dried in a desiccating oven at 60 °C for at least24 h. The rim and two sections of each filter were cut out, placed in tincapsules, pelletised, and analysed on a Europa Scientific 20/20 triplecollector mass spectrometer. Measurements of particulate organiccarbon (POC) mass and isotopic composition were corrected for theblank, which consisted of a tin capsule and a blank pre-combusted GF-75 section. Daily standard curves bracketing anticipated sample masseswere run prior to samples, with urea as a laboratory standard, and themeasured isotopic composition was calibrated using peach leaf (NIST-1547) and L-glutamic acid (USGS-40; (Qi et al., 2003)) standards.Using the daily standard curves, the mass of POC in each sample wascalculated. The hourly rate of photosynthetic carbon fixation by thephytoplankton community was determined from duplicate incubationsamples by normalising the rate of dissolved inorganic carbon (DIC)incorporation into POC to the length of the incubation, calculatedfollowing (Legendre and Gosselin, 1997). These hourly rates ofphotosynthetic carbon fixation were then adjusted to account for thedeviation of surface seawater incubation temperature from in situtemperature using a Q10 temperature coefficient for growth of 1.88(Bissinger et al., 2008; Eppley, 1972).
2.6. Data analysis and mapping
The arithmetic mean of the data is reported ± the standarddeviation from the mean, or as a range of minimum to maximumvalues. CTD measurements were binned over 1 m depth intervals.Linear correlation between two sets of measurements was calculatedvia Pearson's coefficient using the pearsonr function from the SciPy0.16.1 statistical functions module, and the least-squares regression fortwo sets of measurements was computed using the linregress functionfrom the SciPy statistical functions module (SciPy 0.16.1, www.scipy.org). The Data-Interpolating Variational Analysis (DIVA) griddingoption in Ocean Data View (ODV4) was used to interpolate thebiological, physical, and chemical data in space (Schlitzer, 2015;Troupin et al., 2012). In section plots showing the relativeabundance of phytoplankton groups, data points below the lightcompensation depth, where an insufficient number of observations ina particular population (n < 250) were made due to insufficientsampling effort for the given population size, were removed. Sincethe data shown are ratios of a particular population to the sum of allpopulations, an insufficient number of observations in one populationcould have skewed the ratio estimate of individual populations.
3. Results
3.1. Overview of the transect hydrography and biogeochemistry
The transect cruise across the North Atlantic Ocean began onAugust 23rd, 2013 from the coast of North Carolina (USA) along theGulf Stream, crossed the Grand Banks, proceeded along the NorthAtlantic Current, and ended in the northeast (54°N 20°W) at thesouthern border of the subarctic Atlantic province (Fig. 1 and Fig. S3).The southwestern section of the transect followed the warm, salinewaters of the Gulf Stream to the west of the Grand Banks (~44°W).There, the west-to-east flowing Gulf Stream extends as the NorthAtlantic Current at 40°W, and is directed to the eastern Atlantic basinthrough the transverse Charlie-Gibbs Fracture Zone (Bower and vonAppen, 2008; García-Ibáñez et al., 2015). The transect was charac-terised by zonal and meridional gradients in temperature, salinity,nutrient and PN concentrations, N isotopic composition of nitrate andPN, and phytoplankton biomass. Using these gradients we operation-ally grouped the stations into the southwestern stations (2−6), the shelfstation (7), and the northeastern stations (8−15) (Table 1).
Sea surface temperature (SST) decreased zonally from 29.0 °C atstation 2 in the Gulf Stream to 13.8 °C at station 15 at the border of theAtlantic subarctic province, just west of Rockall Bank (Fig. 2A). Surfacesalinity decreased significantly from a maximum of 36.02 psu at station4, to 32.50 psu at station 7 at the tip of the Grand Banks shelf, and roseagain to a maximum of 35.38 psu at station 11 further northeast(Fig. 2B). Nutrient concentrations were depleted in at least the upper30 m of the water column throughout most of the transect (nitrate <100 nmol l−1, nitrite < 20 nmol l−1, ammonium < 50 nmol l−1, phos-phate < 100 nmol l−1; Fig. 2C and Fig. S4). At the northeasternstations, however, only silicate concentrations were low(332−779 nmol l−1), while at the southwestern stations, maximum
Fig. 2. Section plots of (A) temperature (colour shaded), (B) salinity (colour shaded),and (C) nitrate concentration (colour shaded and contour lines) along the transect.Contour lines in A and B represent the potential density anomaly (sigma-theta). Dottedprofiles are associated with station numbers listed at the top of the figure. The higherspatial frequency of the surface values is the result of 6-hourly underway sampling. Thethick grey dashed line indicates the depth of the nitracline.
N. Van Oostende et al. Deep–Sea Research Part I 121 (2017) 79–94
84

silicate concentrations ranged between 859 and 1856 nmol l−1 (Fig.S4D). The depth of the nitracline shoaled from the southwest(max.=101 m, station 3) to the northeast (min.=33 m), where nitratewas at least 451 nmol l−1 in surface waters of the northeastern stations(12, 13, 15) (Fig. 2C and Table 1). The depth of the nitracline wascorrelated with ZIc but not with MLD (Table 3). Nitrite maxima weretypically observed between the nitracline and ZIc (except at the north-eastern-most station 15, where the nitrite maximum was situated justbelow ZIc). Nitrite maxima ranged from 51 to 158 nmol l−1 at thesouthwestern stations, 42 nmol l−1 near the bottom of the shelf station,and from 69 to 485 nmol l−1 at the northeastern stations (Fig. S4A).
The distribution of upper ocean PN mirrored the distribution of
nitrate, with the highest concentrations at each station observed at orjust below the nitracline in the southwest or in the upper mixed layer ofthe northeastern stations (Fig. 2C and Fig. 3A). The concentration ofPN above Zeu ranged from 0.28 to 1.04 µmol l−1 at the southwesternstations and from 0.40 to 2.35 µmol l−1 at the northeastern stations.Occasional localised PN peaks (e.g., 3.97 µmol l−1 at 30 m at station 7on the Grand Banks shelf and 2.18 µmol l−1 at 45 m at station 8) wereobserved, and these corresponded with occurrences of high phyto-plankton biomass detected by flow cytometry (see Section 2.4). Thedistribution of POC was strongly correlated with that of PN (Table 3)and the POC-to-PN molar ratio of suspended particles throughout theeuphotic zone had an average value of 7.3 ± 2.8 (n=33), which did notshow a trend with longitude or latitude (r < 0.02, p > 0.1).
3.2. Nitrogen isotopic composition of PN and nitrate
Vertical patterns in the δ15N of nitrate and suspended PN provide atime-integrated view of the dynamics of new production – according tothe classical paradigm - at each station (Fig. 4). At depths shallowerthan the 300 nmol l−1 nitrate isopleth, the nitrate concentration wastoo low for δ15N determination. For all profiles, the δ15N of nitrate washighest at the shallowest depth for which nitrate concentration wasgreater than our δ15N quantification threshold, and was slightly higherat the northeastern stations (average of 9.4‰), compared to thesouthwest (average of 8.5‰) (Fig. 4B). Evidence for nitrate assimila-tion, implied by the elevated δ15N of shallow nitrate compared to itssubsurface source, was observed deeper in the water column to thesouthwest compared to the northeast (Fig. 4B). The relatively low δ15Nof the source nitrate (below the main thermocline and ZIc) in thesouthwestern section of the transect (2.5 ± 0.1‰ at 250 m, stations 2,3, 4 and 5) compared to the source nitrate in the northeastern section(4.7 ± 0.2‰ between 200 and 300 m) points to different origins for thisnitrate.
The δ15N of PN increased from the southwest (−0.4 ± 0.4‰ at20 m, n=5; 0.3 ± 1.1‰ for all samples above the nitracline, n=9;stations 2–6) to the northeast (4.2 ± 0.2‰ above the nitracline;
Table 3Pearson correlation coefficient between different biogeochemical and/or physical variables measured in the upper 145 m of the water column. Heterotrophic bacterial cell abundance(het. bact. cell abund.), temperature (T), relative carbon biomass contribution of nanoeukaryote phytoplankton (%nanoEuk C) to total flowcytometric phytoplankton biomass (FCMphyto C), relative carbon biomass contribution of Prochlorococcus and Synechococcus to FCM phyto C (%picocyano C), upper ocean mass-weighted average δ15N of suspended PN(δ15NPN) minus the δ15N of the subsurface nitrate source (δ15NPN – δ15NNO3).
variable y variable x Pearson's r p n data subset
Nitracline depth Zeu 0.56 > 0.05 12 Upper 125 mNitracline depth ZIc 0.64 < 0.05 12 Upper 145 mNitracline depth MLD 0.18 > 0.05 12 Upper 125 mNitracline depth δ15NPN −0.73 < 0.01 11 Above nitracline depth or MLDNitracline depth δ15NPN – δ15NNO3 −0.53 > 0.05 11 Above nitracline depth or MLD%nanoEuk C δ15NPN 0.91 < 0.001 11 Above nitracline depth or MLD%nanoEuk C δ15NPN – δ15NNO3 0.75 < 0.01 11 Above nitracline depth or MLD%picocyano C δ15NPN −0.93 < 0.001 11 Above nitracline depth or MLD%picocyano C δ15NPN – δ15NNO3 −0.84 < 0.005 11 Above nitracline depth or MLDPOC PN 0.91 < 0.001 33 55, 30% and 1% light depthsPOC FCM phyto C 0.91 < 0.001 36 55, 30% and 1% light depthsPOC Chla 0.83 < 0.001 34 55, 30% and 1% light depthshet. bact. cell abund. FCM phyto C 0.85 < 0.001 94 Upper 125 mhet. bact. cell abund. Chla 0.84 < 0.001 81 Upper 125 mhet. bact. cell abund. ρDIC 0.76 < 0.001 36 55, 30% and 1% light depthsρDIC POC 0.70 < 0.001 36 55, 30% and 1% light depthsρDIC Chla 0.76 < 0.001 34 55, 30% and 1% light depthsρDIC FCM phyto C 0.73 < 0.001 36 55, 30% and 1% light depthsVDIC T 0.70 < 0.001 36 55, 30% and 1% light depthsVDIC %nanoEuk C −0.42 < 0.05 36 55, 30% and 1% light depthsVDIC %nanoEuk C −0.46 < 0.05 24 55% and 30% light depthsVDIC %nanoEuk C −0.80 < 0.005 12 30% light depth%nanoEuk C T −0.77 < 0.001 36 55, 30% and 1% light depths%nanoEuk C T −0.77 < 0.001 24 55% and 30% light depths%nanoEuk C T −0.89 < 0.001 12 30% light depth
Fig. 3. Depth section plots of (A) suspended particulate organic nitrogen and (B)suspended particulate organic carbon concentration. The thick grey dashed line indicatesthe depth of the nitracline. Transect station numbers are designated at the top of thefigure.
N. Van Oostende et al. Deep–Sea Research Part I 121 (2017) 79–94
85

stations 11, 12, 13 and 15, n=7) (Fig. 4A). The mass-weighted upperocean average δ15N of PN decreased with increasing depth of thenitracline and the difference between the δ15N of PN and source nitratewas less to the northeast, indicating higher nitrate reliance (Table 3;excluding shelf station 7). In general, the δ15N of PN increased withdepth from the shallowest sample to the waters at or below thenitracline.
3.3. Phytoplankton chlorophyll a biomass and community size-structure
Surface Chla concentrations were low ( < 0.5 mg m−3) across mostof the transect but increased sharply at the northeastern end (Fig. 5A).The depth of the Chla maximum at each station shoaled from thesouthwest to the northeast, essentially following the depth of thenitracline. The depth-integrated chlorophyll (ΣChla), integrated fromthe surface to the light compensation depth (ZIc), was also higher at thenortheastern stations 13 and 15 (33.6 mg m−2 and 30.4 mg m−2,respectively) compared to the transect average (19.1 ± 7.2 mg m−2,n=12) (Fig. 6). The degree to which these patterns in Chla distributionwere representative of the average conditions during late summer wasassessed by comparing in situ Chla measurements to the distribution ofclimatological remote sensing data for each station (Fig. S5). Themedian [Chla] above ZIc was below average (i.e., the median) for thesouthwestern stations and stations 7 and 8, near average for stations9–12, and above average for the two northeastern-most stations 13 and15. The higher-than-expected [Chla] at the two northeastern-moststations is thus indicative of summer bloom conditions.
Throughout the transect, most of the ΣChla was contained in thepico ( < 2 µm) (78 ± 13%, n=12) and nano sized-fractions (2–20 µm)(20 ± 11%, n=12). The proportion of Chla in the micro sized-fraction (> 20 µm) was very low on average (3 ± 2%, n=12) (Fig. 6). Thenortheastern stations (12, 13 and 15), together with the shelf station
7, were characterised by the highest contribution of nanophytoplank-ton (up to 36% at station 13) and microphytoplankton (up to 8% atstation 7) to ΣChla.
3.4. Pico- and nanoplankton abundance and biomass
The abundance and biomass of pico- and nanoplankton weredetermined by flow cytometry in order to produce a more detaileddescription of phytoplankton community diversity and to assess thebiomass distribution of each phytoplankton group, avoiding the con-founding effect of light intensity that complicates interpretation of thecomplementary size-fractionated Chla measurements. At the south-western stations, Prochlorococcus cells numerically dominated thephytoplankton community yet Prochlorococcus was not detected atthe shelf and northeastern stations (Fig. S6A). Maximum cell concen-trations at the southwestern stations were observed deep in theeuphotic zone, above or just below the nitracline (0.86−1.24×10⁶ cellsml−1), as well as in the upper 20 m of the water column at stations 5
Fig. 4. Depth section plots of (A) the N isotopic composition of suspended particulateorganic nitrogen (δ15N-PN) with contour lines indicating PN concentration (µmol l-1),and (B) the N isotopic composition of nitrate (δ15N-NO3
-) with NO3- concentration
contour lines (µmol l-1). Station numbers are listed at the top of the figure. The thick greydashed line indicates the depth of the nitracline and the grey circles indicate sampleswhere the PN or NO3
- concentration was too low for its isotopic composition to bemeasured.
Fig. 5. Depth section plots of (A) chlorophyll a and (B) combined pico- and nanophy-toplankton carbon biomass concentration along the transect course. Dotted profilesamples are associated with station numbers listed at the top of the figure. The thick greydashed line indicates the depth of the nitracline and the thick white dashed linerepresents the light compensation depth (ZIc at 0.17 mol PAR quanta m−2 day−1).
Fig. 6. Depth-integrated chlorophyll a (ΣChla) in each size fraction ( < 2 µm, 2–20 µmand > 20 µm) above the light compensation depth (ZIc, see Table 1) as a percentage ofthe total integrated Chla measured at each station (solid black line).
N. Van Oostende et al. Deep–Sea Research Part I 121 (2017) 79–94
86

and 6 (0.86−1.44×10⁵ cells ml−1). Synechococcus was present through-out the transect although cell concentrations were low in the south-western section, increasing towards the northeast. At the southwesternstations the highest abundance of this group was mostly confined to theupper 20 m (0.80 ± 0.13×10⁴ cells ml−1, n=9), except at station 6 wherethe maximum abundance was observed just above the nitracline (63 m;2.30×10⁴ cells ml−1). Synechococcus cells were most abundant in thenitracline at the shelf station 7 and station 8, and at the surface of thenortheastern station 13 (5.32−7.19×10⁴ cells ml−1) (Fig. S6B). Theabundance of picoeukaryotes and nanoeukaryotes was lower in thesouthwestern part of the transect, with maxima at or below thenitracline (picoEuks: 4.4 ± 2.3×10³ cells ml−1; nanoEuks: 0.6 ±0.3×10³ cells ml−1), compared to the shelf and the northeasternstations (picoEuks: 9.8 ± 6.7×10³ cells ml−1; nanoEuks: 3.1 ± 1.6×10³
cells ml−1) (Figs. S6C and S6D). In the nanophytoplankton size group,the noPE-nanoEuk population was by far the most numericallyabundant group (94 ± 6% of total nanophytoplankton cells). The cellabundance of the other nanophytoplankton groups, Cocco and PE-nanoEuk, was very low across the entire transect ( < 0.1×10³ cellsml−1, < 0.4×10³ cells ml−1), although PE-nanoEuk cells constituted upto 20% of all nanophytoplankton cells at station 6 (data not shown).
Because of large differences in cell size, the total biomass distribu-tion of populations determined from biovolume estimates (Figs. 5B and7) is distinct from the patterns of Chla and cell abundance outlined
above (Fig. 6A and S6). Prochlorococcus contributed up to 0.47 ± 0.12µmol C l−1 or 46 ± 7% (n=5) of the combined pico- and nanophyto-plankton carbon biomass at their depth maxima at the southwesternstations (Figs. 7A and 8A). The biomass concentrations ofSynechococcus and picoeukaryotes were of the same order of magni-tude (Fig. 7B and C), with maxima ranging from 0.10 to 0.27 µmol C l−1
and 0.16–0.42 µmol C l−1 at the southwestern stations, and from 0.15to 0.85 µmol C l−1 and 0.21–1.04 µmol C l−1 at the shelf and north-eastern stations. Nanoeukaryote biomass at the southwestern stationswas lower than at the shelf and northeastern stations. At their depthmaxima, nanoeukaryote's biomass ranged from 0.32 to 0.84 µmol C l−1
in the southwest, from 1.04 to 5.33 µmol C l−1 in the northeast, andhad a localised peak of 8.63 µmol C l−1 at the shelf station (30 m)(Fig. 7D). Cyanobacteria dominanted the picophytoplankton biomassin the southwestern section (76 ± 14%, n=27) compared to the north-eastern stations (37 ± 20%, n=38) in the upper 125 m of the watercolumn (Fig. 8A and B).
The vertical distribution of picophytoplankton biomass showedgroup-specific trends. The picoeukaryote populations made up arelatively greater proportion of the pico- and nanophytoplanktonbiomass (17.0 ± 7.9%, n=20) at the depths near the nitracline (whenpresent) compared to Synechococcus (9.2 ± 7.7%, n=20) (Fig. 8B and
Fig. 7. Depth section plots of the carbon biomass concentration of (A) Prochlorococcus,(B) Synechococcus, (C) picoeukaryotes, and (D) nanophytoplankton as enumerated byflow cytometry across the transect course. Dotted profile samples are associated with thestation numbers listed at the top of the figure. The thick grey dashed line indicates thedepth of the nitracline. Note the difference in colour bar scale for each phytoplanktongroup.
Fig. 8. Depth section plots of the proportion of biomass represented by (A)Prochlorococcus, (B) Synechococcus, (C) picoeukaryotes, and (D) nanoeukaryotes asdetermined by flow cytometry. The thick grey dashed line indicates the depth of thenitracline and the thick white dashed line represents the light compensation depth (ZIc at0.17 mol PAR quanta m-2 day−1). Dotted profile samples are associated with the stationnumbers listed at the top of the figure. Samples with a potentially unrepresentativepopulation estimates ( < 250 nanophytoplankton cells counted) are greyed-out. Note thatthe different phytoplankton groups are plotted using different colour scales selected toemphasise their distribution patterns.
N. Van Oostende et al. Deep–Sea Research Part I 121 (2017) 79–94
87

C). Synechococcus populations, on the other hand, were mostlyconfined to the better-lit shallower water column (18.4 ± 9.0%,n=27), where the relative contribution of picoeukaryotes was lower(8.9 ± 5.0%, n=27 not adjacent to the nitracline).
The nanoeukaryote phytoplankton made up a substantial portion ofthe pico- and nanophytoplankton biomass despite their relatively lowcell numbers, contributing 40 ± 11% (n=23) of the biomass at thesouthwestern stations, and 69 ± 11% (n=39) at the shelf and north-eastern stations in the upper 125 m of the water column (in instanceswhere a representative population sample of at least 250 nanophyto-plankton cells were counted) (Fig. 8D and S6D). The distribution of thenanophytoplankton biomass was heterogeneous, with low concentra-tions in the euphotic zone in the southwestern part of the transect(0.34 ± 0.19 µmol C l−1, n=22), localised maxima at stations 7 and 8(8.63 and 3.81 µmol C l−1), and high concentrations in the upper mixedlayer of the northeastern stations 12, 13 and 15 (3.23 ± 1.18 µmol C l−1,n=9) (Fig. 7D).
The average cellular carbon content for the picoeukaryotes andcombined nanoeukaryote phytoplankton groups was 64 ± 16 fmol Ccell−1 (n=73) and 741 ± 247 fmol C cell−1 (n=68, excluding station 7),respectively, corresponding reasonably well to the values reported by(Tarran et al., 2006) for picoeukaryotes (36.7 fmol C cell−1) and totalnanoeukaryotes (763 fmol C cell−1) in the Northeast Atlantic in earlysummer. Noteworthy was the larger cellular biomass of total nanoeu-karyotes (1585 ± 537 fmol C cell−1, n=8) in the cold, low salinity watersat the shelf station 7 compared to the rest of the transect. The flowcytometry-derived phytoplankton biomass (FCM phyto C, µmol C l−1)explained 73% of the variance in POC concentration (µmol C l−1) acrossthe transect, and the deviation from a one-to-one relationship betweenboth measures of biomass (log10[POC]=0.81×log10[FCM phytoC]+0.64, n=36, p < 0.001) points to either an underestimate of totalphytoplankton biomass by FCM phyto C or to the contribution of non-phytoplankton particles, such as heterotrophs and detritus, to the POC.
Finally, the cell abundance of heterotrophic bacteria over the upper125 m ranged from 0.10−1.66×10⁶ cells ml−1, generally decreasingwith depth (Fig. S7), and it was positively correlated with total Chla,FCM phyto C and the rate of inorganic carbon fixation (ρDIC,µmol C l−1 h−1) (see Section 3.5) (Table 3). These strong correlationssuggest a close coupling between the phototrophic and heterotrophiccomponents of the microbial food web.
3.5. Primary production and phytoplankton turnover rate
The activity of the phytoplankton standing stocks was estimated bymeasuring the inorganic carbon fixation rate (i.e., primary production;ρDIC, µmol C l−1 h−1) at each transect station at three irradiance levelswithin the euphotic zone. Carbon fixation rates (n=36) ranged from0.009 µmol C l−1 h−1 at the base of the euphotic zone in the oligo-trophic surface waters in the southwest, to 0.132 µmol C l−1 h−1 at thesubsurface biomass peak in the colder Grand Bank shelf water (30 m,station 7), and then up to 0.222 µmol C l−1 h−1 during the summerphytoplankton bloom at the northeastern-most station 15 (Fig. 9A).The ρDIC showed a positive relationship with the different measures ofbiomass: [POC], [Chla] and FCM phyto C across the transect and lightdepths (Table 3).
The turnover rate of phytoplankton biomass (VDIC, h−1), obtainedby normalising the carbon fixation rates to [FCM phyto C], ranged from0.012 to 0.086 h−1 and was generally slowest at the deepest light depth(Fig. 9B). Across the transect, VDIC was positively correlated with insitu temperature (Table 3). The phytoplankton community composi-tion could partly explain the variation in VDIC, as it was negativelycorrelated with the proportion of nanophytoplankton FCM carbonbiomass (Table 3). However, this is likely at least partly due to thenegative correlation between the proportion of nanophytoplanktonFCM carbon biomass and in situ temperature (Table 3).
4. Discussion
4.1. Late summer hydrography and biogeochemistry in the NorthAtlantic
The zonal/meridional transect crossed several biogeographicalprovinces (Gulf Stream (GFST), Northwest Atlantic shelves(NWCS), North Atlantic Drift (NADR), and the southern borderof the Atlantic subarctic province (SARC)) (Fig. 1) (Longhurst(2007), Reygondeau et al. (2013), G. Reygondeau, personal com-munication 2014). The broad patterns in temperature, Zeu and thehorizontal and vertical distribution of Chla were representative ofthe classical biogeographical provinces described by Longhurst(2007) for the locations sampled during late summer (WorldOcean Atlas 2013 (WOA13), August–September; https://www.nodc.noaa.gov/OC5/woa13/pubwoa13.html). A large part of thesouthwestern section of the transect followed the Gulf Stream,which was characterised by high SST ( > 23 °C). The transectstations did not intersect any mesoscale eddies, as seen from thesurface velocity fields (Fig. S3), but the cruise track did traversesub-mesoscale fronts characterised by sharp changes in surfacetemperature and salinity (Fig. S8). At station 8, for example, theSST was ~2.5–3.0 °C warmer than at adjacent (24−39 km) stations.The depleted surface nutrient concentrations throughout thetransect were typical for the late summer (nitrate 0–2.00 µmol l−1, phosphate 0.03–0.30 µmol l−1, silicate 0.06–3.00µmol l−1; WOA13, August–September, upper 25 m). The low Chlaconcentrations throughout the transect (median [Chla]ZIc perstation range 0.09–0.34 mg m−3) were characteristic or lower-than-expected for the regions and/or the time of year (e.g., theGulf Stream and Grand Banks shelf), with the exception of thesummer bloom conditions observed at the two northeastern-moststations (median [Chla]ZIc range 0.66–0.74 mg m−3) (Fig. S5).
4.2. Phytoplankton community composition from the Gulf Stream tothe subarctic Atlantic
The biogeochemical gradients along the zonal/meridional NorthAtlantic transect were reflected in the phytoplankton communitycomposition. The biomass and cell abundance of late summer phyto-plankton communities throughout the transect (GFST – SARC) were
Fig. 9. Depth section plots of (A) inorganic carbon fixation rate (transport rate; ρDIC)and (B) inorganic carbon fixation rate normalised to flow cytometry-derived phytoplank-ton biomass (specific rate; VDIC). The thick grey dashed line indicates the depth of thenitracline. Dotted profile samples are associated with the station numbers listed at thetop of the figure.
N. Van Oostende et al. Deep–Sea Research Part I 121 (2017) 79–94
88

strongly dominated by pico- and nanophytoplankton groups.Microphytoplankton biomass, based on size-fractionated Chla, con-stituted only a minor part of the summer phytoplankton communities.The lack of significant microphytoplankton Chla even at the north-eastern summer bloom stations (Fig. 6) may be a consequence ofinsufficient silicate replenishment in the case of diatoms, or slowgrowth response time and sensitivity to increased turbulence in thecase of phototrophic dinogflagellates (Barton et al., 2015; Irwin et al.,2012). The patterns in pico- and nanophytoplankton community size-structure and low levels of biomass were consistent with the fewavailable summer field observations for the region using either flowcytometry (Buck et al., 1996; Li, 1995; Li and Harrison, 2001) orpigment-based approaches (Dandonneau et al., 2004).
The maximum cell abundance of Prochlorococcus at the south-western stations in this study was comparable to that observed by flowcytometry in surface waters of the western North Atlantic in Augustand September (~0.5–1×10⁵ ml−1; Casey et al. (2007); DuRand et al.(2001)), the eastern North Atlantic (35°N 23°W) in September(~1×10⁵ ml−1) (Zinser et al., 2006) and in the Gulf Stream(~6×10⁴ ml−1 at ~37°N ~69°W; ~1.2×10⁵ ml−1 at ~42°N ~55°W) inJune and September (Cavender-Bares et al., 2001; Li, 1995). The lackof Prochlorococcus cells from the Grand Banks (~44°N) northwards isconsistent with its average geographical distribution and preference forwarmer water (at least ~12 °C) (Partensky et al., 1999b).
The detection of Synechococcus populations throughout the trans-ect is in accordance with the cosmopolitan distribution of this genus(Partensky et al., 1999a). Relatively higher contributions ofSynechococcus to the pico- and nanophytoplankton biomass weremeasured near the surface at the southwestern stations as well as inlower salinity surface waters of the shelf and adjacent station,consistent with the genus' reported niche breadth (Partensky et al.,1999a; Zwirglmaier et al., 2008). Synechococcus reached its highestcell abundance at the northeastern summer bloom station 13(7.19×10⁴ cells ml−1) where nitrate had likely been recently resupplied.These higher cell concentrations are comparable to those measured byBuck et al. (1996) and Heywood et al. (2006) during a summer transect(~2×10⁴−1×10⁵ cells ml−1, from 45 to 60°N) and may have beenstimulated by the higher nitrate concentrations (Glover et al., 2007,1988) (see below).
Picoeukaryote phytoplankton were a ubiquitous feature of theplankton community throughout the transect and, based on theirbiomass distribution, contributed significantly to Chla in the picophy-toplankton size-group, together with their cyanobacterial counterparts(Figs. 6–8). This extensive geographical distribution may reflect thehigh taxonomic diversity within this group (Grob et al., 2011; Kirkhamet al., 2013). The exception to the ubiquitous presence of thepicoeukaryotes was their relative absence at the Grand Banks shelfstation where they were replaced by Synechococcus and nanophyto-plankton. In general, picoeukaryote phytoplankton contributed rela-tively more to biomass deeper in the water column, closer to thenitracline. Such a vertical distribution pattern seems to be a consistentfeature of this flow cytometrically-defined group across differentenvironments (Buck et al., 1996; Cabello et al., 2016; Painter et al.,2014; Tarran et al., 2006). When nitrate was available near the surface,such as at the northeastern summer bloom stations, picoeukaryotebiomass was still relatively more abundant closer to the base ofthe euphotic zone even though this group had a higher biomassthroughout the water column compared to the southwestern sectionof the transect.
The main trend in the distribution of nanophytoplankton was a highercontribution to the total phytoplankton biomass from the Grand Banksshelf to the northern part of the NADR province compared to the GulfStream stations (Figs. 6–8). This trend coincided with the northeastwardshoaling of the nitracline along the transect. The patchiness of nanophy-toplankton biomass corresponded to localised increases in nutrient andlight availability (e.g., station 7, 13 and 15), suggesting that this size-group
may respond more strongly to the alleviation of nutrient limitation (e.g.,nitrate), or be under looser top-down control than smaller-sized phyto-plankton. At the northeastern-most summer bloom station, calcifiedcoccolithphore cells did not contribute significantly to the nanophyto-plankton biomass ( <~14 µm) although late summer coccolithophoreblooms have been documented quite regularly north of the subpolar front(52–54°N) (Holligan et al., 1993; Longhurst, 2007), which is at thenorthern boundary of our transect. North of that area and in the absenceof a coccolithophore bloom, the majority of summer phytoplanktoncommunity biomass (mean euphotic zone [Chla]=0.41 mg m−3) has beenobserved to comprise of small flagellates (picoeukaryotes (18%), nanoeu-karyotes (68%) and Cocco (6%)), with only minor contributions fromSynechococcus (7%) and diatoms (1%) (Poulton et al., 2010). This iscomparable to the phytoplankton community composition we observed atthe northeastern end of our transect.
4.3. Imprint of phytoplankton nitrogen utilisation on the nitrogenisotopes
The increase in the δ15N of surface suspended PN along the path ofthe Gulf Stream and the North Atlantic Current, from ~0‰ in thesouthwest to ~5‰ in the northeastern part of the transect, is a firstorder reflection of the isotopic composition of the subsurface nitratesource, the degree to which this nitrate is consumed by phytoplankton,and the extent of phytoplankton reliance on other N forms relative tosubsurface nitrate. However, variations in the degree of consumptionof the supplied nitrate are unlikely to be an important driver of theδ15N of surface suspended PN at most stations because the isotopeeffect of nitrate assimilation is not expressed when nitrate is completelyconsumed (i.e., surface nitrate concentration was < 100 nmol l−1 at allstations except 12, 13 and 15) (Fig. 2C).
Regarding the subsurface nitrate source, the basin-scale signal ofN2 fixation is evident as a "bolus" of low-δ15N nitrate (~2.5 ± 0.1‰) inthe thermocline (~200–400 m) of the southwestern stations (Fig. 4B;Knapp et al. (2008)). However, N2 fixation need not be occurring in situto produce this signal. Rather, its isotopic imprint is advected andintegrated into subtropical thermocline waters on the timescale ofdecades through the remineralisation of low-δ15N PN deriving from N2
fixation elsewhere in the basin (Knapp et al., 2005). By contrast, thehigher δ15N of subsurface nitrate at the northeastern stations (4.7 ±0.2%) is similar to the mean δ15N of deep ocean nitrate (~5‰; Sigmanet al. (2000)), and derives from the combined influence ofMediterranean Water, North Atlantic Central Water, and SubpolarMode Water (Talley, 2011).
In contrast to the δ15N of subsurface nitrate, which ranged from2.4‰ to 5.1‰ along the transect, N2 fixation and atmospheric Ndeposition introduce low-δ15N-N to surface waters (−5‰ to 0‰;Carpenter et al. (1997); Knapp et al. (2008); Minagawa and Wada(1986)). However, studies conducted near our southwestern stationssuggest that, on an annual basis, fluxes from both sources are too low toaccount for the low δ15N of PN in this region (Altabet, 1988; Knap andJickells, 1986; Knapp et al., 2008, 2005; Michaels et al., 1993). Instead,the low-δ15N PN to the southwest of the transect is best interpreted asthe result of upper ocean N recycling (Altabet, 1988; Fawcett et al.,2011, 2014; Treibergs et al., 2014): Zooplankton sustained by upperocean PN metabolise and excrete 15N-depleted ammonium, the assim-ilation of which renders phytoplankton (i.e., PN) low in δ15N (Checkleyand Miller, 1989; Montoya et al., 2002). The apparently strongerreliance on regenerated N to the southwest of the transect, as impliedby the δ15N of PN, is consistent with the observed depletion of thesurface nitrate pool in this region (Fig. 2C).
From the Grand Banks shelf to the northeastern end of the transectnear the subarctic Atlantic, the δ15N of PN gradually increases(Fig. 4A), reflecting increased reliance on subsurface nitrate as wellas a higher δ15N for the nitrate supply (Fig. 4B). However, removingthe potentially confounding effect of subsurface nitrate δ15N does not
N. Van Oostende et al. Deep–Sea Research Part I 121 (2017) 79–94
89

remove the clear pattern of increasing PN δ15N and thus increasingdependence on nitrate relative to regenerated N from the Gulf Streamto the southwest to the subarctic Atlantic to the northeast (Fig. 10).Stations 8 and 9, although having a similar fraction of nanophyto-plankton biomass as the more northeastern stations, had SST and SSSproperties that were different from stations further northeast (Fig. S8),indicating mixing with fresher water masses. This could cause themisidentification of the nitrate source and thus an overcorrection of thesurface δ15N-PN (Fig. 10, central diamond pair, Table 3). Theincreased reliance on subsurface nitrate inferred from the zonal risein δ15N-PN is reflected in the increased biomass contribution ofnanoeukaryotes and decreased biomass contribution of picocyanobac-teria to the phytoplankton community, from the Gulf Stream tosubarctic Atlantic part of the transect (Fig. 10 and Table 3). One caveatto the above is that using the δ15N of bulk suspended PN to assessautotrophic N assimilation patterns is not ideal since PN also containsheterotrophic and detrital biomass N, which have different δ15N
signatures (Fawcett et al., 2011). For example, the rise in δ15N-PNbelow the nitracline at all stations from which we have sufficiently deepdata (Fig. 4A and S9) likely indicates a contribution of degradeddetrital PN, which is high in δ15N due to the preferential remineraliza-tion of 14N by heterotrophic bacteria (Altabet and McCarthy, 1986;Möbius, 2013).
Nitrate was easily detectable throughout surface waters of thenorthern extent of the NADR (stations 13 and 15, Fig. 2C), such thatthe isotope discrimination during nitrate assimilation needs to beconsidered when inferring phytoplankton reliance on nitrate versusregenerated N from the δ15N of suspended PN. Station 12 is excludedfrom this analysis because we have only two euphotic zone measure-ments of nitrate > 300 nmol l−1, both of which are below the MLD.During nitrate assimilation, phytoplankton preferentially consume14N-bearing nitrate, leaving the ambient nitrate pool enriched in 15N(Sigman et al., 1999; Wada and Hattori, 1978). Algal nitrate consump-tion thus elevates the δ15N of subsurface nitrate supplied to theeuphotic zone by upward vertical mixing. The phytoplankton PNproduced from the consumption of this nitrate is lower in δ15N thanthe nitrate itself due to the isotopic fractionation that occurs during itsassimilation; this is quantified by the isotope effect, εassim (εassim, in ‰vs. N2 in air, =(14k/15k–1)×1000, where 14k and 15k are the ratecoefficients of the reaction for 14N- and 15N-containing nitrate,respectively). The δ15N of PN increases with increasing surface oceannitrate consumption (Altabet and Francois, 1994), ultimately approx-imating the δ15N of the source nitrate upon complete nitrate consump-tion. We used the Rayleigh model to estimate εassim from the verticalprofiles of nitrate concentration and δ15N, which can then be used topredict the δ15N of PN produced from the assimilation of nitrate with asource concentration and δ15N equal to that measured at each station(Fig. S9A-D; Suppl. Text 1).
At both stations, the δ15N of suspended PN from the mixed layer isvery similar to the integrated product δ15N predicted by the Rayleighmodel (Fig. S9, Suppl. Text 1), suggesting a strong reliance on nitrateby the community. The elevated surface nitrate concentration at station15 could be due to its location close to the margin of the subpolar gyre,where the unused nitrate concentration tends to be higher than in therest of the basin at this time of year (WOA 2013; cf. Fig. 2b in Straubet al. (2013)). As such, the nitrate supply could have been advectedfrom this perennial high-nutrient region to the northwest. However,nitrate appears to have been recently (on the order of days to a week)resupplied to the surface at station 15 as suggested by in situ [Chla],which was two times higher than expected compared to remote sensingclimatology for this area (Fig. S5), and the relatively high primaryproduction rate (~2 µmol l−1 d−1). Moreover, the mass-weighted δ15Nof PN in the upper mixed layer is higher (4.3‰) than that predicted bythe integrated product of the Rayleigh model (~3‰; Fig. S9D,integrated product); this may reflect a contribution of PN producedprior to the bloom, which had a δ15N of ~5‰ due to completeconsumption of the subsurface nitrate supply. The δ15N of the PNsampled during the cruise may not yet have been altered significantlyby the consumption of lower-δ15N, newly-supplied nitrate.
High δ15N-PN may also reflect a significant contribution fromrapidly growing phytoplankton (i.e., nanoeukaryotes; Figs. 7D and10A) with a δ15N that is more similar to the Rayleigh model'sinstantaneous product than integrated product, since growing phyto-plankton integrate over only a short period of time and thus a shortdegree of nitrate consumption (Fawcett et al., 2011). Nitrate waspresent at concentrations > 2 μmol l−1 throughout the mixed layer atstation 15, with a δ15N ranging from 6.3‰ to 11‰. Consumption ofthis nitrate would produce instantaneous product biomass with anaverage δ15N of 5.9‰; including some portion of this in the suspendedPN pool could easily elevate its δ15N above that of the predictedintegrated product.
One final consideration is the potential effect of euphotic zonenitrification on the δ15N of nitrate and PN. As described above, the co-
Fig. 10. The distribution of relative nanoeukaryote (A) and picocyanobacteria (B) depth-integrated carbon biomass contribution as a function of the upper ocean mass-weightedδ15N of PN minus the δ15N of the subsurface nitrate source (δ15NPN - δ15NNO3-source), as aproxy for nitrate utilisation. Phytoplankton carbon biomass and δ15N-PN data from eachstation (excluding station 7, see Methods section) are from the surface to the nitraclinedepth or the MLD, whichever was deepest. Station symbols as in Fig. 1.
N. Van Oostende et al. Deep–Sea Research Part I 121 (2017) 79–94
90

occurrence of ammonium assimilation and nitrification will result inthe production of low-δ15N regenerated nitrate, rendering it indis-tinguishable from other recycled N forms, and distinct from subsurfacenitrate (DiFiore et al., 2009; Fawcett et al., 2011). Thus, even ifeuphotic zone nitrification were occurring, δ15N-PN would still accu-rately record the extent of new relative to regenerated production overmost of the transect.However, at the stations with relatively high upperocean nitrate concentrations (12, 13, and 15), euphotic zone PNproduced from regenerated nitrate assimilation could be mistaken forPN produced by the assimilation of subsurface nitrate with an isotopeeffect. Since regenerated nitrate will be assimilated with the same εassimas subsurface nitrate, the fact that mixed layer δ15N-PN is wellpredicted by the Rayleigh model does not rule out the possibility thatsome fraction of the nitrate being assimilated was produced in theeuphotic zone. This can be addressed using the oxygen (O) isotopes ofnitrate (δ18O, in ‰ vs. VSMOW) in conjunction with the N isotopes.Briefly, co-occurring nitrate assimilation and nitrification causessamples to fall above a 1:1 line in nitrate δ15N vs. δ18O space, whereasnitrate assimilation alone results in samples falling on the 1:1 line(Sigman et al., 2005; Wankel et al., 2007; Suppl. Text 2.2). Evaluationof the coupled N and O isotopes of nitrate at the northeastern-moststations reveals a 1:1 relationship in the upper 100 m (Fig. S9E-F),strongly indicating that euphotic zone nitrification is insignificantrelative to the upward transport of subsurface nitrate. In sum, thePN and nitrate isotope data suggest near-complete reliance of thephytoplankton community on subsurface nitrate in the mixed layer ofthe northeastern-most stations, consistent with a zonal pattern ofincreasing new production from the Gulf Stream to the southwest tosubarctic Atlantic to the northeast of the transect.
The dominance of cyanobacterial picoplankton biomass in the GulfStream together with the isotopic evidence for high reliance on recycledN (Fig. 10B) suggests that their ecological strategy is in exploiting theseN forms in oligotrophic environments (Fawcett et al., 2011; Zubkovet al., 2003). Culture studies have shown that all ecotypes ofProchlorococcus grow well on ammonium (e.g., Moore et al., 2007;Moore et al., 2002), most can utilise urea, and some low-light strainswill grow on nitrite (Moore et al., 2002). Only recently has there been areport of nitrate assimilation by cultured ecotypes (Berube et al., 2015)but their importance in the ocean remains unknown. This is thought tobe due to a lack of the genetic machinery for nitrate reduction(Dufresne et al., 2003; Moore et al., 2002), which is an energeticallyexpensive process. There have been very few direct studies of thenutritional ecology of Prochlorococcus in the field (Casey et al., 2007;Li, 1994; Martiny et al., 2009; Zubkov et al., 2003). Zubkov et al.(2003) and Zubkov and Tarran (2005) reported high in situ rates oforganic N assimilation by marine cyanobacteria in the Arabian Sea andSouth Atlantic subtropical front, and attributed 33% of the totalbacterial turnover of amino acids to Prochlorococcus, suggesting thatthis allows them to dominate over other autotrophs and heterotrophicbacteria in oligotrophic waters. While there is some evidence thatcertain strains of Prochlorococcus may be able to use nitrate in theenvironment (Casey et al., 2007; Martiny et al., 2009; Treibergs et al.,2014), their overwhelming preference appears to be for reduced Nforms. This, coupled with their extremely high affinity for phosphate inthe open ocean (Lomas et al., 2014), underscores the adaptation of thisorganism to chronically oligotrophic environments (Moore et al., 2002;Scanlan and Post, 2008) and explains their dominance to the southwestof the transect.
The congruence between the N isotopes and the distribution ofSynechococcus along the transect is less straightforward and probablyoriginates from the ecotype diversity of this genus (Zwirglmaier et al.,2008). Indeed, Synechococcus is the most ubiquitous photoautotrophin the ocean, and has been found in virtually every marine environment(Campbell et al., 1997; Olson et al., 1990; Partensky et al., 1996).Although often discussed in the context of the subtropical ocean gyres,Synechococcus tends to be more numerically abundant in nutrient-rich
rather than oligotrophic environments (Partensky et al., 1999a;Scanlan, 2003), which is consistent with our observations (Fig. S6B).Cultured marine Synechococcus species have been reported to utiliseammonium, nitrite, nitrate, urea, and amino acids (Collier et al., 1999;Glibert et al., 1986; Lindell et al., 1998; Moore et al., 2002; Paerl,1991), and under severe N deprivation, some strains will even degradetheir phycoerythrin protein-pigment complex as an internal N source(Kana et al., 1992; Wyman et al., 1985). With the exception of threerecent isolates from the Red Sea that cannot assimilate nitrate (Fulleret al., 2003), all studied strains of Synechococcus can utilise bothnitrate and nitrite as their sole N source (Bird and Wyman, 2003;Moore et al., 2002). In the environment, Synechococcus growth ratescorrelate with ambient nitrate concentrations (Blanchot et al., 1992;Partensky et al., 1999a), and natural populations of Synechococcusappear to respond to periodic nitrate inputs (DuRand et al., 2001;Glover et al., 1988). The ability to assimilate both oxidised and reducedN forms may reflect a higher cellular N requirement, especially giventhe large, N-rich light-harvesting protein complexes (phycobilisomes)that must be maintained (Scanlan, 2003). This could explain thepredominance of Synechococcus shallower in the water column(Figs. 7B and 8B) as the low light levels at the base of the euphoticzone may not yield sufficient energy to reduce oxidised N forms. In anycase, our data are consistent with the competitive advantage ofSynechococcus being its cosmopolitan nutritional ecology.
Isotopic evidence for nitrate assimilation near the nitraclineappears to be associated with a higher relative abundance of picoeu-karyote phytoplankton biomass at this depth, suggesting that picoeu-karyotes, despite their small mean cell size ( < 2.5 µm), are importantdrivers of new production across the transect (Fig. 8C). This isconsistent with studies by Fawcett et al. (2011, 2014) and Painteret al. (2014) that demonstrated the importance of this phytoplanktongroup to new and export production in the oligotrophic North Atlantic,due to their apparent affinity for nitrate even when ambient concen-trations are extremely low, as well as their position deeper in the watercolumn near the nitracline. In contrast to the picoeukaryotes andconsistent with the observations of Painter et al. (2014), in thisstudy the nanoeukaryotic phytoplankton contribution to biomass wasmost important when nitrate was available near the surface or hadbeen fairly recently supplied (Fig. 10A). This appears to have beenthe case at the two northeastern-most stations where the δ15N ofnitrate was high throughout euphotic zone waters (indicating partialnitrate consumption), and may point to a growth response bynanoeukaryote phytoplankton groups and an increased reliance onnitrate when it is abundant. Measurements of the δ15N of flow-sortedphytoplankton groups would help to clarify their various nutritionalniches and further our understanding of the role of communitycomposition and structure in the marine nitrogen cycle across biogeo-chemical regimes.
5. Conclusions
Phytoplankton play a pivotal role in the cycling of energy andelements through the ocean's food webs, and so determine both thestrength and efficiency of the biological pump. The broad metabolic(e.g., (in)ability for nitrate uptake) and morphological (e.g., cell size)diversity in phytoplankton species often translates into differentbiogeochemical functions (e.g., with regard to export production).This study captured an ocean basin-scale gradient in surface Nutilisation in oligotrophic to mesotrophic regimes, from the subtropicalNorth Atlantic along the Gulf Stream and the North Atlantic Current upto the southern boundary of the subarctic Atlantic. Increasing ecosys-tem reliance on subsurface nitrate (i.e., classical new production),inferred from N species concentration measurements and the Nisotopic composition of PN and nitrate from this summer transect,was associated with the shoaling of the nitracline from the Gulf Streamto the subarctic Atlantic. This broad zonal pattern in autotrophic
N. Van Oostende et al. Deep–Sea Research Part I 121 (2017) 79–94
91

nitrate assimilation was reflected in changes in the composition of thephytoplankton assemblage, as indicated by the distinct distribution ofphytoplankton group-specific contributions to Chla and carbon bio-mass, found between biogeochemical provinces. This is consistent withthe differential N assimilation capabilities of the dominant phytoplank-ton groups in each region, as well as with variations in the rate ofnitrate supply to the photic zone from the subtropics to the temperateoceanic provinces. Identification of the phytoplankton groups thatassimilate nitrate using a combination of flow cytometric sorting and Nisotope analysis would shed further light on the relationship betweenphytoplankton diversity and N cycling in the ocean, opening up thesuspended PN “black box” to further mechanistic and ecologicalunderstanding.
Acknowledgements
The captain and crew of the R/V Endeavor for their professional-ism. Jeff Hoffman (JCVI) and Keiran Swart for assistance with CTDdeployment and sampling. Sean McIntee for help with flow cytometricanalyses. Heidi Sosik and her lab for providing the materials and datafor the intercalibration of flow cytometric forward scatter and biovo-lume relationships. Gabriel Reygondeau for attributing the samplingstations to dynamic biogeochemical provinces. National ScienceFoundation Grant no. OCE-1136345 for funding B.B. Ward and D.M.Sigman. The two anonymous reviewers for their helpful comments andsuggestions, which helped to improve this manuscript.
Appendix A. Supplementary material
Supplementary data associated with this article can be found in theonline version at doi:10.1016/j.dsr.2016.12.012.
References
Alkire, M., Lee, C., D'Asaro, E., Perry, M., Briggs, N., Cetinić, I., Gray, A., 2014. Netcommunity production and export from Seaglider measurements in the NorthAtlantic after the spring bloom. J. Geophys. Res.: Oceans 119 (9), 6121–6139.
Altabet, M., 1988. Variations in nitrogen isotopic composition between sinking andsuspended particles: implications for nitrogen cycling and particle transformation inthe open ocean. Deep Sea Res. Part A. Oceanogr. Res. Pap. 35 (4), 535–554.
Altabet, M.A., McCarthy, J.J., 1986. Vertical patterns in 15 N natural abundance in PONfrom the surface waters of warm-core rings. J. Mar. Res. 44 (1), 185–201.
Altabet, M.A., Francois, R., 1994. Sedimentary nitrogen isotopic ratio as a recorder forsurface ocean nitrate utilization. Glob. Biogeochem. Cycles 8, 103–116.
Altieri, K.E., Fawcett, S.E., Peters, A.J., Sigman, D.M., Hastings, M.G., 2016. Marinebiogenic source of atmospheric organic nitrogen in the subtropical North Atlantic.Proc. Natl. Acad. Sci. USA 113 (4), 925–930.
Azam, F., Fenchel, T., Field, J.G., Gray, J.S., Meyerreil, L.A., Thingstad, F., 1983. Theecological role of water-column microbes in the sea. Mar. Ecol.-Prog. Ser. 10 (3),257–263.
Barton, A.D., Lozier, M.S., Williams, R.G., 2015. Physical controls of variability in NorthAtlantic phytoplankton communities. Limnol. Oceanogr. 60 (1), 181–197.
Barton, A.D., Finkel, Z.V., Ward, B.A., Johns, D.G., Follows, M.J., 2013. On the roles ofcell size and trophic strategy in North Atlantic diatom and dinoflagellatecommunities. Limnol. Oceanogr. 58 (1), 254–266.
Bertilsson, S., Berglund, O., Karl, D.M., Chisholm, S.W., 2003. Elemental composition ofmarine Prochlorococcus and Synechococcus: implications for the ecologicalstoichiometry of the sea. Limnol. Oceanogr. 48 (5), 1721–1731.
Berube, P.M., Biller, S.J., Kent, A.G., Berta-Thompson, J.W., Roggensack, S.E., Roache-Johnson, K.H., Ackerman, M., Moore, L.R., Meisel, J.D., Sher, D., 2015. Physiologyand evolution of nitrate acquisition in Prochlorococcus. ISME J. 9 (5), 1195–1207.
Bird, C., Wyman, M., 2003. Nitrate/nitrite assimilation system of the marinepicoplanktonic cyanobacterium Synechococcus sp. strain WH 8103: effect ofnitrogen source and availability on gene expression. Appl. Environ. Microbiol. 69(12), 7009–7018.
Bissinger, J.E., Montagnes, D.J.S., Sharples, J., Atkinson, D., 2008. Predicting marinephytoplankton maximum growth rates from temperature: improving on the Eppleycurve using quantile regression. Limnol. Oceanogr. 53 (2), 487–493.
Blanchot, J., Rodier, M., Le Bouteiller, A., 1992. Effect of El Niño Southern Oscillationevents on the distribution and abundance of phytoplankton in the Western PacificTropical Ocean along 165 E. J. Plankton Res. 14 (1), 137–156.
Boss, E., Behrenfeld, M., 2010. In situ evaluation of the initiation of the North Atlanticphytoplankton bloom. Geophys. Res. Lett. 37, 5.
Bower, A.S., von Appen, W.-J., 2008. Interannual variability in the pathways of the NorthAtlantic Current over the Mid-Atlantic Ridge and the Impact of Topography. J. Phys.
Oceanogr. 38 (1), 104–120.de Boyer Montégut, C., Madec, G., Fischer, A.S., Lazar, A., Iudicone, D., 2004. Mixed
layer depth over the global ocean: an examination of profile data and a profile-basedclimatology. J. Geophys. Res.: Oceans 109 (C12), C12003.
Braman, R.S., Hendrix, S.A., 1989. Nanogram nitrite and nitrate determination inenvironmental and biological materials by vanadium(iii) reduction with chemi-luminescence detection. Anal. Chem. 61 (24), 2715–2718.
Buck, K.R., Chavez, F.P., Campbell, L., 1996. Basin-wide distributions of living carboncomponents and the inverted trophic pyramid of the central gyre of the NorthAtlantic Ocean, summer 1993. Aquat. Microb. Ecol. 10 (3), 283–298.
Cabello, A.M., Latasa, M., Forn, I., Morán, G., Massana, R, X.A., 2016. Verticaldistribution of major photosynthetic picoeukaryotic groups in stratified marinewaters. Environ. Microbiol., (n/a-n/a).
Campbell, L., Liu, H., Nolla, H.A., Vaulot, D., 1997. Annual variability of phytoplanktonand bacteria in the subtropical North Pacific Ocean at Station ALOHA during the1991–1994 ENSO event. Deep Sea Res. Part I: Oceanogr. Res. Pap. 44 (2), 167–192.
Carpenter, E.J., Harvey, H.R., Fry, B., Capone, D.G., 1997. Biogeochemical tracers of themarine cyanobacterium Trichodesmium. Deep Sea Res. Part I: Oceanogr. Res. Pap.44 (1), 27–38.
Casciotti, K., Sigman, D., Hastings, M.G., Böhlke, J., Hilkert, A., 2002. Measurement ofthe oxygen isotopic composition of nitrate in seawater and freshwater using thedenitrifier method. Anal. Chem. 74 (19), 4905–4912.
Casciotti, K.L., 2009. Inverse kinetic isotope fractionation during bacterial nitriteoxidation. Geochim. Et. Cosmochim. Acta 73 (7), 2061–2076.
Casciotti, K.L., Sigman, D.M., Ward, B.B., 2003. Linking diversity and stable isotopefractionation in ammonia-oxidizing bacteria. Geomicrobiol. J. 20 (4), 335–353.
Casey, J.R., Lomas, M.W., Mandecki, J., Walker, D.E., 2007. Prochlorococcus contributesto new production in the Sargasso Sea deep chlorophyll maximum. Geophys. Res.Lett. 34 (10).
Casey, J.R., Aucan, J.P., Goldberg, S.R., Lomas, M.W., 2013. Changes in partitioning ofcarbon amongst photosynthetic pico- and nano-plankton groups in the Sargasso Seain response to changes in the North Atlantic Oscillation. Deep-Sea Res. Part II-Top.Stud. Oceanogr. 93, 58–70.
Cavender-Bares, K.K., Karl, D.M., Chisholm, S.W., 2001. Nutrient gradients in thewestern North Atlantic Ocean: relationship to microbial community structure andcomparison to patterns in the Pacific OceanDeep Sea Res. Part I: Oceanogr. Res. Pap.48, 2373–2395.
Cetinić, I., Perry, M.J., D'Asaro, E., Briggs, N., Poulton, N., Sieracki, M.E., Lee, C.M.,2015. A simple optical index shows spatial and temporal heterogeneity inphytoplankton community composition during the 2008 North Atlantic bloomexperiment. Biogeosciences 12 (7), 2179–2194.
Checkley, D.M., Miller, C.A., 1989. Nitrogen isotope fractionation by oceaniczooplankton. Deep Sea Res. Part A. Oceanogr. Res. Pap. 36 (10), 1449–1456.
Chisholm, S.W., 1992. Phytoplankton size. In: Falkowski, P.G., Woodhead, A.D., Vivirito,K. (Eds.), Primary Productivity and Biogeochemical Cycles in the Sea. Springer, US,213–237.
Collier, J.L., Brahamsha, B., Palenik, B., 1999. The marine cyanobacteriumSynechococcus sp. WH7805 requires urease (urea amiohydrolase, EC 3.5. 1.5) toutilize urea as a nitrogen source: molecular-genetic and biochemical analysis of theenzyme. Microbiology 145 (2), 447–459.
Dandonneau, Y., Deschamps, P.-Y., Nicolas, J.-M., Loisel, H., Blanchot, J., Montel, Y.,Thieuleux, F., Bécu, G., 2004. Seasonal and interannual variability of ocean color andcomposition of phytoplankton communities in the North Atlantic, equatorial Pacificand South Pacific. Deep Sea Res. Part II: Top. Stud. Oceanogr. 51 (1–3), 303–318.
Deutsch, C., Sarmiento, J.L., Sigman, D.M., Gruber, N., Dunne, J.P., 2007. Spatialcoupling of nitrogen inputs and losses in the ocean. Nature 445 (7124), 163–167.
DiFiore, P.J., Sigman, D.M., Dunbar, R.B., 2009. Upper ocean nitrogen fluxes in thePolar Antarctic Zone: constraints from the nitrogen and oxygen isotopes of nitrate.Geochem. Geophys. Geosyst. 10, 11.
d'Ovidio, F., De Monte, S., Alvain, S., Dandonneau, Y., Lévy, M., 2010. Fluid dynamicalniches of phytoplankton types. Proc. Natl. Acad. Sci. USA 107 (43), 18366–18370.
Duce, R., LaRoche, J., Altieri, K., Arrigo, K., Baker, A., Capone, D., Cornell, S., Dentener,F., Galloway, J., Ganeshram, R., 2008. Impacts of atmospheric anthropogenicnitrogen on the open ocean. Science 320 (5878), 893–897.
Dufresne, A., Salanoubat, M., Partensky, F., Artiguenave, F., Axmann, I.M., Barbe, V.,Duprat, S., Galperin, M.Y., Koonin, E.V., Le Gall, F., 2003. Genome sequence of thecyanobacterium Prochlorococcus marinus SS120, a nearly minimal oxyphototrophicgenome. Proc. Natl. Acad. Sci. USA 100 (17), 10020–10025.
Dugdale, R.C., Goering, J.J., 1967. Uptake of new and regenerated forms of nitrogen inprimary productivity. Limnol. Oceanogr. 12 (2), 196–206.
DuRand, M.D., Olson, R.J., Chisholm, S.W., 2001. Phytoplankton population dynamicsat the Bermuda Atlantic Time-series station in the Sargasso Sea. Deep-Sea Res. PartII-Top. Stud. Oceanogr. 48 (8–9), 1983–2003.
Eppley, R.W., 1972. Temperature and phytoplankton growth in sea. Fish. Bull. 70 (4),1063–1085.
Eppley, R.W., Peterson, B.J., 1979. Particulate organic-matter flux and planktonic newproduction in the deep ocean. Nature 282 (5740), 677–680.
Fawcett, S.E., Lomas, M.W., Ward, B.B., Sigman, D.M., 2014. The counterintuitive effectof summer‐to‐fall mixed layer deepening on eukaryotic new production in theSargasso Sea. Glob. Biogeochem. Cycles 28 (2), 86–102.
Fawcett, S.E., Ward, B.B., Lomas, M.W., Sigman, D.M., 2015. Vertical decoupling ofnitrate assimilation and nitrification in the Sargasso Sea. Deep Sea Res. Part I:Oceanogr. Res. Pap. 103, 64–72.
Fawcett, S.E., Lomas, M., Casey, J.R., Ward, B.B., Sigman, D.M., 2011. Assimilation ofupwelled nitrate by small eukaryotes in the Sargasso Sea. Nat. Geosci. 4 (10),717–722.
N. Van Oostende et al. Deep–Sea Research Part I 121 (2017) 79–94
92

Fuller, N.J., Marie, D., Partensky, F., Vaulot, D., Post, A.F., Scanlan, D.J., 2003. Clade-specific 16S ribosomal DNA oligonucleotides reveal the predominance of a singlemarine Synechococcus clade throughout a stratified water column in the red Sea.Appl. Environ. Microbiol. 69 (5), 2430–2443.
García-Ibáñez, M.I., Pardo, P.C., Carracedo, L.I., Mercier, H., Lherminier, P., Ríos, A.F.,Pérez, F.F., 2015. Structure, transports and transformations of the water masses inthe Atlantic Subpolar Gyre. Prog. Oceanogr. 135, 18–36.
Garçon, V.C., Oschlies, A., Doney, S.C., McGillicuddy, D., Waniek, J., 2001. The role ofmesoscale variability on plankton dynamics in the North Atlantic. Deep Sea Res. PartII: Top. Stud. Oceanogr. 48 (10), 2199–2226.
Gasol, J.M., Del Giorgio, P.A., 2000. Using flow cytometry for counting naturalplanktonic bacteria and understanding the structure of planktonic bacterialcommunities. Sci. Mar. 64 (2), 197–224.
Glibert, P., Kana, T., Olson, R., Kirchman, D., Alberte, R., 1986. Clonal comparisons ofgrowth and photosynthetic responses to nitrogen availability in marineSynechococcus spp. J. Exp. Mar. Biol. Ecol. 101 (1–2), 199–208.
Glover, H.E., Garside, C., Trees, C.C., 2007. Physiological responses of Sargasso Seapicoplankton to nanomolar nitrate perturbations. J. Plankton Res. 29 (3), 263–274.
Glover, H.E., Prézelin, B.B., Campbell, L., Campbell, M., Garside, C., 1988. A nitrate-dependent Synechococcus bloom in surface Sargasso Sea water. Nature 331 (6152),161–163.
Granger, J., Sigman, D.M., 2009. Removal of nitrite with sulfamic acid for nitrate N andO isotope analysis with the denitrifier method. Rapid Commun. Mass Spectrom. 23(23), 3753–3762.
Grob, C., Hartmann, M., Zubkov, M.V., Scanlan, D.J., 2011. Invariable biomass-specificprimary production of taxonomically discrete picoeukaryote groups across theAtlantic Ocean. Environ. Microbiol. 13 (12), 3266–3274.
Gruber, N., Sarmiento, J.L., 1997. Global patterns of marine nitrogen fixation anddenitrification. Glob. Biogeochem. Cycles 11 (2), 235–266.
Heywood, J.L., Zubkov, M.V., Tarran, G.A., Fuchs, B.M., Holligan, P.M., 2006.Prokaryoplankton standing stocks in oligotrophic gyre and equatorial provinces ofthe Atlantic Ocean: evaluation of inter-annual variability. Deep Sea Res. Part II: Top.Stud. Oceanogr. 53 (14–16), 1530–1547.
Hoch, M.P., Fogel, M.L., Kirchman, D.L., 1992. Isotope fractionation associated withammonium uptake by a marine bacterium. Limnol. Oceanogr. 37 (7), 1447–1459.
Holligan, P.M., Fernandez, E., Aiken, J., Balch, W.M., Boyd, P., Burkill, P.H., Finch, M.,Groom, S.B., Malin, G., Muller, K., Purdie, D.A., Robinson, C., Trees, C.C., Turner,S.M., Vanderwal, P., 1993. A biogeochemical study of the coccolithophore, Emilianiahuxleyi, in the North-Atlantic. Glob. Biogeochem. Cycles 7 (4), 879–900.
Holm-Hansen, O., Riemann, B., 1978. Chlorophyll a determination – improvements inmethodology. Oikos 30, 438–447.
Hooks, C.E., Bidigare, R.R., Keller, M.D., Guillard, R.R., 1988. Coccoid eukaryotic marineultraplankters with four different hplc pigment signatures. J. Phycol. 24 (4),571–580.
Hydes, D.J., Aoyama, M., Aminot, A., Bakker, K., Becker, S., Coverly, S., Daniel, A.,Dickson, A.G., Grosso, O., Kerouel, R., van Ooijen, J., Sato, K., Tanhua, T.,Woodward, E.M.S., Zhang, J.Z., 2010. Determination of dissolved nutrients (N, P, Si)in seawater with high precision and inter-comparability using gas-segmentedcontinuous flow analysers. The GO-SHIP Repeat Hyrography Manual: a Collection ofExpert Reports and Guidelines.
Irwin, A.J., Nelles, A.M., Finkel, Z.V., 2012. Phytoplankton niches estimated from fielddata. Limnol. Oceanogr. 57 (3), 787–797.
Joint, I., Pomroy, A., Savidge, G., Boyd, P., 1993. Size-fractionated primary productivityin the northeast Atlantic in May–July 1989. Deep Sea Res. Part II: Top. Stud.Oceanogr. 40 (1), 423–440.
Jones, R., 1991. An improved fluorescence method for the determination of nanomolarconcentrations of ammonium in natural waters. Limnol. Oceanogr. 36 (4), 814–819.
Kana, T.M., Feiwel, N.L., Flynn, L.C., 1992. Nitrogen starvation in marine Synechococcusstrains: clonal differences in phycobiliprotein breakdown and energy coupling. Mar.Ecol.-Prog. Ser. 88, (75-75).
Kirkham, A.R., Lepere, C., Jardillier, L.E., Not, F., Bouman, H., Mead, A., Scanlan, D.J.,2013. A global perspective on marine photosynthetic picoeukaryote communitystructure. ISME J. 7 (5), 922–936.
Knap, A., Jickells, T., 1986. Significance of atmospheric-derived fixed nitrogen onproductivity of the Sargasso Sea. Nature 320, 158–160.
Knapp, A.N., Sigman, D.M., Lipschultz, F., 2005. N isotopic composition of dissolvedorganic nitrogen and nitrate at the Bermuda Atlantic Time-series Study site. Glob.Biogeochem. Cycles 19 (1).
Knapp, A.N., DiFiore, P.J., Deutsch, C., Sigman, D.M., Lipschultz, F., 2008. Nitrateisotopic composition between Bermuda and Puerto Rico: implications for N2 fixationin the Atlantic Ocean. Glob. Biogeochem. Cycles 22 (3).
Laney, S.R., Sosik, H.M., 2014. Phytoplankton assemblage structure in and around amassive under-ice bloom in the Chukchi Sea. Deep Sea Res. Part II: Top. Stud.Oceanogr. 105 (0), 30–41.
Laws, E.A., Letelier, R.M., Karl, D.M., 2014. Estimating the compensation irradiance inthe ocean: the importance of accounting for non-photosynthetic uptake of inorganiccarbon. Deep Sea Res. Part I: Oceanogr. Res. Pap. 93 (0), 35–40.
Legendre, L., Gosselin, M., 1997. Estimation of N or C uptake rates by phytoplanktonusing N-15 or C-13: Revisiting the usual computation formulae. J. Plankton Res. 19(2), 263–271.
Letelier, R.M., Karl, D.M., Abbott, M.R., Bidigare, R.R., 2004. Light driven seasonalpatterns of chlorophyll and nitrate in the lower euphotic zone of the North Pacificsubtropical Gyr. Limnol. Oceanogr. 49 (2), 508–519.
Li, W.K., 1994. Primary production of prochlorophytes, cyanobacteria, and eucaryoticultraphytoplankton: measurements from flow cytometric sorting. Limnol. Oceanogr.39 (1), 169–175.
Li, W.K.W., 1995. Composition of ultraphytoplankton in the central North Atlantic. Mar.Ecol. Prog. Ser. 122, 1–8.
Li, W.K.W., 1997. Cytometric diversity in marine ultraphytoplankton. Limnol. Oceanogr.42 (5), 874–880.
Li, W.K.W., 2002. Macroecological patterns of phytoplankton in the northwestern NorthAtlantic Ocean. Nature 419 (6903), 154–157.
Li, W.K.W., Harrison, W.G., 2001. Chlorophyll, bacteria and picophytoplankton inecological provinces of the North Atlantic. Deep Sea Res. Part II: Top. Stud.Oceanogr. 48 (10), 2271–2293.
Lindell, D., Padan, E., Post, A.F., 1998. Regulation of ntcA expression and nitrite uptakein the marine Synechococcus sp. strain WH 7803. J. Bacteriol. 180 (7), 1878–1886.
Liu, K.-K., Kao, S.-J., Chiang, K.-P., Gong, G.-C., Chang, J., Cheng, J.-S., Lan, C.-Y., 2013.Concentration dependent nitrogen isotope fractionation during ammonium uptakeby phytoplankton under an algal bloom condition in the Danshuei estuary, northernTaiwan. Mar. Chem. 157, 242–252.
Lochte, K., Ducklow, H.W., Fasham, M.J.R., Stienen, C., 1993. Plankton succession andcarbon cycling at 47°N-20°W during the JGOFS North-Atlantic bloom experiment.Deep-Sea Res. Part II-Top. Stud. Oceanogr. 40 (1–2), 91–114.
Lomas, M.W., Lipschultz, F., 2006. Forming the primary nitrite maximum: nitrifiers orphytoplankton? Limnol. Oceanogr. 51 (5), 2453–2467.
Lomas, M.W., Moran, S.B., 2011. Evidence for aggregation and export of cyanobacteriaand nano-eukaryotes from the Sargasso Sea euphotic zone. Biogeosciences 8 (1),203–216.
Lomas, M.W., Bonachela, J.A., Levin, S.A., Martiny, A.C., 2014. Impact of oceanphytoplankton diversity on phosphate uptake. Proc. Natl. Acad. Sci. 111 (49),17540–17545.
Longhurst, A., 2007. Ecological Geography of the Sea. Academic Press, London.Macko, S.A., Estep, M.L.F., Engel, M.H., Hare, P., 1986. Kinetic fractionation of stable
nitrogen isotopes during amino acid transamination. Geochim. Et. Cosmochim. Acta50 (10), 2143–2146.
Marañon, E., Holligan, P.M., Barciela, R., González, N., Mouriño, B., Pazó, M.J., Varela,M., 2001. Patterns of phytoplankton size structure and productivity in contrastingopen-ocean environments. Mar. Ecol. Prog. Ser. 216, 43–56.
Marañón, E., Cermeno, P., Latasa, M., Tadonléké, R.D., 2012. Temperature, resources,and phytoplankton size structure in the ocean. Limnol. Oceanogr. 57 (5), 1266.
Marconi, D., Weigand, M.A., Rafter, P.A., McIlvin, M.R., Forbes, M., Casciotti, K.L.,Sigman, D.M., 2015. Nitrate isotope distributions on the US GEOTRACES NorthAtlantic cross-basin section: signals of polar nitrate sources and low latitude nitrogencycling. Mar. Chem. 177, 143–156.
Marie, D., Partensky, F., Jacquet, S., Vaulot, D., 1997. Enumeration and cell cycleanalysis of natural populations of marine picoplankton by flow cytometry using thenucleic acid stain SYBR green I. Appl. Environ. Microbiol. 63 (1), 186–193.
Mariotti, A., Germon, J., Hubert, P., Kaiser, P., Letolle, R., Tardieux, A., Tardieux, P.,1981. Experimental determination of nitrogen kinetic isotope fractionation: someprinciples; illustration for the denitrification and nitrification processes. Plant Soil 62(3), 413–430.
Marra, J.F., Lance, V.P., Vaillancourt, R.D., Hargreaves, B.R., 2014. Resolving theocean's euphotic zone. Deep Sea Res. Part I: Oceanogr. Res. Pap. 83 (0), 45–50.
Martiny, A.C., Kathuria, S., Berube, P.M., 2009. Widespread metabolic potential fornitrite and nitrate assimilation among Prochlorococcus ecotypes. Proc. Natl. Acad.Sci. USA 106 (26), 10787–10792.
McIlvin, M.R., Casciotti, K.L., 2011. Technical updates to the bacterial method for nitrateisotopic analyses. Anal. Chem. 83 (5), 1850–1856.
Michaels, A.F., Siegel, D.A., Johnson, R.J., Knap, A.H., Galloway, J.N., 1993. Episodicinputs of atmospheric nitrogen to the Sargasso Sea: contributions to new productionand phytoplankton blooms. Glob. Biogeochem. Cycles 7, 339–351.
Minagawa, M., Wada, E., 1986. Nitrogen isotope ratios of red tide organisms in the EastChina Sea: a characterization of biological nitrogen fixation. Mar. Chem. 19 (3),245–259.
Möbius, J., 2013. Isotope fractionation during nitrogen remineralization(ammonification): implications for nitrogen isotope biogeochemistry. Geochim.Cosmochim. Acta 105, 422–432.
Montoya, J.P., Carpenter, E.J., Capone, D.G., 2002. Nitrogen fixation and nitrogenisotope abundances in zooplankton of the oligotrophic North Atlantic. Limnol.Oceanogr. 47 (6), 1617–1628.
Moore, C.M., Mills, M.M., Langlois, R., Milne, A., Achterberg, E.P., LaRoche, J., Geider,R.J., 2008. Relative influence of nitrogen and phosphorous availability onphytoplankton physiology and productivity in the oligotrophic sub-tropical NorthAtlantic Ocean. Limnol. Oceanogr. 53 (1), 291–305.
Moore, C.M., Mills, M.M., Arrigo, K.R., Berman-Frank, I., Bopp, L., Boyd, P.W.,Galbraith, E.D., Geider, R.J., Guieu, C., Jaccard, S.L., Jickells, T.D., La Roche, J.,Lenton, T.M., Mahowald, N.M., Maranon, E., Marinov, I., Moore, J.K., Nakatsuka,T., Oschlies, A., Saito, M.A., Thingstad, T.F., Tsuda, A., Ulloa, O., 2013. Processesand patterns of oceanic nutrient limitation. Nat. Geosci. 6 (9), 701–710.
Moore, L.R., Post, A.F., Rocap, G., Chisholm, S.W., 2002. Utilization of different nitrogensources by the marine cyanobacteria Prochlorococcus and Synechococcus. Limnol.Oceanogr. 47 (4), 989–996.
Moore, L.R., Coe, A., Zinser, E.R., Saito, M.A., Sullivan, M.B., Lindell, D., Frois-Moniz,K., Waterbury, J., Chisholm, S.W., 2007. Culturing the marine cyanobacteriumProchlorococcus. Limnol. Oceanogr. Methods 5, 353–362.
Morel, A., Berthon, J.F., 1989. Surface pigments, algal biomass profiles, and potentialproduction of the euphotic layer – relationships reinvestigated in view of remote-sensing applications. Limnol. Oceanogr. 34 (8), 1545–1562.
Morel, A., Maritorena, S., 2001. Bio-optical properties of oceanic waters: a reappraisal. J.Geophys. Res.: Oceans 106 (C4), 7163–7180.
Nielsdóttir, M.C., Moore, C.M., Sanders, R., Hinz, D.J., Achterberg, E.P., 2009. Iron
N. Van Oostende et al. Deep–Sea Research Part I 121 (2017) 79–94
93

limitation of the postbloom phytoplankton communities in the Iceland Basin. Glob.Biogeochem. Cycles 23 (3).
Olson, R.J., Zettler, E.R., Anderson, O.K., 1989. Discrimination of eukaryoticphytoplankton cell types from light scatter and autofluorescence propertiesmeasured by flow cytometry. Cytometry 10 (5), 636–643.
Olson, R.J., Chisholm, S.W., Zettler, E.R., Altabet, M.A., Dusenberry, J.A., 1990. Spatialand temporal distributions of prochlorophyte picoplankton in the North AtlanticOcean. Deep Sea Res. Part A Oceanogr. Res. Pap. 37 (6), 1033–1051.
Oschlies, A., 2002. Nutrient supply to the surface waters of the North Atlantic: a modelstudy. J. Geophys. Res.: Oceans 107 (C5), 14–11-14-13.
Paerl, H.W., 1991. Ecophysiological and trophic implications of light-stimulated aminoacid utilization in marine picoplankton. Appl. Environ. Microbiol. 57 (2), 473–479.
Painter, S.C., Patey, M.D., Tarran, G.A., Torres-Valdès, S., 2014. Picoeukaryotedistribution in relation to nitrate uptake in the oceanic nitracline. Aquat. Microb.Ecol. 72 (3), 195–213.
Partensky, F., Blanchot, J., Vaulot, D., 1999a. Differential distribution and ecology ofProchlorococcus and Synechococcus in oceanic waters: a review. Bull. Inst.Oceanogr. Monaco Numero Spec., 457–476.
Partensky, F., Hess, W.R., Vaulot, D., 1999b. Prochlorococcus, a marine photosyntheticprokaryote of global significance. Microbiol. Mol. Biol. Rev. 63 (1), 106–127.
Partensky, F., Blanchot, J., Lantoine, F., Neveux, J., Marie, D., 1996. Vertical structure ofpicophytoplankton at different trophic sites of the tropical northeastern AtlanticOcean. Deep Sea Res. Part I: Oceanogr. Res. Pap. 43 (8), 1191–1213.
Pennock, J.R., Velinsky, D.J., Ludlam, J.M., Sharp, J.H., Fogel, M.L., 1996. Isotopicfractionation of ammonium and nitrate during uptake by Skeletonema costatum:implications for δ15N dynamics under bloom conditions. Limnol. Oceanogr. 41 (3),451–459.
Pomeroy, L.R., 1974. Oceans food web, a changing paradigm. Bioscience 24 (9),499–504.
Poulton, A.J., Charalampopoulou, A., Young, J.R., Tarran, G.A., Lucas, M.I., Quartly,G.D., 2010. Coccolithophore dynamics in non-bloom conditions during late summerin the central Iceland Basin (July–August 2007). Limnol. Oceanogr. 55 (4),1601–1613.
Qi, H., Coplen, T.B., Geilmann, H., Brand, W.A., Böhlke, J., 2003. Two new organicreference materials for δ13C and δ15N measurements and a new value for the δ13C ofNBS 22 oil. Rapid Commun. Mass Spectrom. 17 (22), 2483–2487.
Raimbault, P., Rodier, M., Taupier-Letage, I., 1988. size fraction of phytoplankton in theLigurian Sea and the Algerian Basin (Mediterranean Sea): size distribution versustotal concentration. Mar. Microb. Food Webs 3 (1), 1–7.
Reygondeau, G., Longhurst, A., Martinez, E., Beaugrand, G., Antoine, D., Maury, O.,2013. Dynamic biogeochemical provinces in the global ocean. Glob. Biogeochem.Cycles 27 (4), 1046–1058.
Rodrı́guez, J., Blanco, J.M., Jiménez-Gómez, F., Echevarrı́a, F., Gil, J., Rodrı́guez, V.,Ruiz, J., Bautista, B., Guerrero, F., 1998. Patterns in the size structure of thephytoplankton community in the deep fluorescence maximum of the Alboran Sea(southwestern mediterranean). Deep Sea Res. Part I: Oceanogr. Res. Pap. 45 (10),1577–1593.
Rynearson, T.A., Richardson, K., Lampitt, R.S., Sieracki, M.E., Poulton, A.J., Lyngsgaard,M.M., Perry, M.J., 2013. Major contribution of diatom resting spores to vertical fluxin the sub-polar North Atlantic. Deep Sea Res. Part I: Oceanogr. Res. Pap. 82, 60–71.
Saito, M.A., McIlvin, M.R., Moran, D.M., Goepfert, T.J., DiTullio, G.R., Post, A.F.,Lamborg, C.H., 2014. Multiple nutrient stresses at intersecting Pacific Ocean biomesdetected by protein biomarkers. Science 345 (6201), 1173–1177.
Sambrotto, R.N., Martin, J.H., Broenkow, W.W., Carlson, C., Fitzwater, S.E., 1993.Nitrate utilization in surface waters of the Iceland Basin during spring and summerof 1989. Deep Sea Res. Part II: Top. Stud. Oceanogr. 40 (1), 441–457.
Scanlan, D.J., 2003. Physiological diversity and niche adaptation in marineSynechococcus. Adv. Microb. Physiol. 47, 1–64.
Scanlan, D.J., Post, A.F., 2008. Aspects of marine cyanobacterial nitrogen physiology andconnection to the nitrogen cycle. In: Capone, D.G., Bronk, D.A., Mulholland, M.R.,Carpenter, E.J. (Eds.), Nitrogen in the Marine Environment. Academic Press, SanDiego, CA, 1073–1195.
Schlitzer, R., 2015. Ocean Data View, ⟨http://odv.awi.de/⟩. ⟨http://odv.awi.de/⟩.Sieburth, J.M., Smetacek, V., Lenz, J., 1978. Pelagic ecosystem structure: heterotrophic
compartments of the plankton and their relationship to plankton size fractions 1.Limnol. Oceanogr. 23 (6), 1256–1263.
Sieracki, M.E., Verity, P.G., Stoecker, D.K., 1993. Plankton community response tosequential silicate and nitrate depletion during the 1989 North Atlantic springbloom. Deep-Sea Res. Part II-Top. Stud. Oceanogr. 40 (1–2), 213–225.
Sigman, D., Altabet, M., McCorkle, D., Francois, R., Fischer, G., 1999. The δ15N of nitratein the Southern Ocean: consumption of nitrate in surface waters. Glob. Biogeochem.Cycles 13 (4), 1149–1166.
Sigman, D., Altabet, M., McCorkle, D., Francois, R., Fischer, G., 2000. The δ15N of nitrate
in the Southern Ocean: nitrogen cycling and circulation in the ocean interior. J.Geophys. Res.: Oceans 105 (C8), 19599–19614.
Sigman, D., Casciotti, K., Andreani, M., Barford, C., Galanter, M., Böhlke, J., 2001. Abacterial method for the nitrogen isotopic analysis of nitrate in seawater andfreshwater. Anal. Chem. 73 (17), 4145–4153.
Sigman, D.M., Granger, J., DiFiore, P.J., Lehmann, M.M., Ho, R., Cane, G., van Geen, A.,2005. Coupled nitrogen and oxygen isotope measurements of nitrate along theeastern North Pacific margin. Glob. Biogeochem. Cycles 19, 4.
Silfer, J., Engel, M., Macko, S., 1992. Kinetic fractionation of stable carbon and nitrogenisotopes during peptide bond hydrolysis: experimental evidence and geochemicalimplications. Chem. Geol.: Isot. Geosci. Sect. 101 (3–4), 211–221.
Smart, S.M., Fawcett, S.E., Thomalla, S.J., Weigand, M.A., Reason, C.J., Sigman, D.M.,2015. Isotopic evidence for nitrification in the Antarctic winter mixed layer. Glob.Biogeochem. Cycles 29 (4), 427–445.
Straub, M., Tremblay, M., Sigman, D., Studer, A., Ren, H., Toggweiler, J., Haug, G., 2013.Nutrient conditions in the subpolar North Atlantic during the last glacial periodreconstructed from foraminifera-bound nitrogen isotopes. Paleoceanography 28 (1),79–90.
Talley, L.D., Pickard, G.L., Emery, W.J., Swift, J.H., 2011. Descriptive PhysicalOceanography: An Introduction sixth edition. Elsevier, Boston.
Tarran, G.A., Heywood, J.L., Zubkov, M.V., 2006. Latitudinal changes in the standingstocks of nano- and picoeukaryotic phytoplankton in the Atlantic Ocean. Deep SeaRes. Part II: Top. Stud. Oceanogr. 53 (14–16), 1516–1529.
Tarran, G.A., Zubkov, M.V., Sleigh, M.A., Burkill, P.H., Yallop, M., 2001. Microbialcommunity structure and standing stocks in the NE Atlantic in June and July of1996. Deep-Sea Res. Part II-Top. Stud. Oceanogr. 48 (4–5), 963–985.
Treibergs, L.A., Fawcett, S.E., Lomas, M.W., Sigman, D.M., 2014. Nitrogen isotopicresponse of prokaryotic and eukaryotic phytoplankton to nitrate availability inSargasso Sea surface waters. Limnol. Oceano. 59 (3), 972–985.
Troupin, C., Barth, A., Sirjacobs, D., Ouberdous, M., Brankart, J.-M., Brasseur, P., Rixen,M., Alvera-Azcarate, A., Belounis, M., Capet, A., Lenartz, F., Toussaint, M.-E.,Beckers, J.-M., 2012. Generation of analysis and consistent error fields using theData Interpolating Variational Analysis (Diva). Ocean Model. 52–53, 90–101.
Vaulot, D., Eikrem, W., Viprey, M., Moreau, H., 2008. The diversity of small eukaryoticphytoplankton (≤3 μm) in marine ecosystems. FEMS Microbiol. Rev. 32 (5),795–820.
Verity, P.G., Robertson, C.Y., Tronzo, C.R., Andrews, M.G., Nelson, J.R., Sieracki, M.E.,1992. Relationships between cell-volume and the carbon and nitrogen-content ofmarine photosynthetic nanoplankton. Limnol. Oceanogr. 37 (7), 1434–1446.
Wada, E., Hattori, A., 1978. Nitrogen isotope effects in the assimilation of inorganicnitrogenous compounds. Geo Microbiol. 7 (7), 85–101.
Wankel, S.D., Kendall, C., Pennington, J.T., Chavez, F.P., Paytan, A., 2007. Nitrificationin the euphotic zone as evidenced by nitrate dual isotopic composition: observationsfrom Monterey Bay, California. Glob. Biogeochem. Cycles 21 (2).
Weigand, M.A., Foriel, J., Barnett, B., Oleynik, S., Sigman, D.M., 2016. Updates toinstrumentation and protocols for isotopic analysis of nitrate by the denitrifiermethod. Rapid Commun. Mass Spectrom. 30 (12), 1365–1383.
Woodward, E.M.S., Rees, A.P., 2001. Nutrient distributions in an anticyclonic eddy in theNorth East Atlantic Ocean, with reference to nanomolar ammonium concentrations.Deep Sea Res. Part II: Top. Stud. Oceanogr. 48 (4–5), 775–794.
Wyman, M., Gregory, R., Carr, N., 1985. Novel role for phycoerythrin in a marinecyanobacterium, Synechococcus strain DC2. Science 230 (4727), 818–820.
Yool, A., Martin, A.P., Fernández, C., Clark, D.R., 2007. The significance of nitrificationfor oceanic new production. Nature 447 (7147), 999–1002.
Zinser, E.R., Coe, A., Johnson, Z.I., Martiny, A.C., Fuller, N.J., Scanlan, D.J., Chisholm,S.W., 2006. Prochlorococcus Ecotype abundances in the North Atlantic Ocean Asrevealed by an Improved Quantitative PCR method. Appl. Environ. Microbiol. 72 (1),723–732.
Zubkov, M.V., Tarran, G.A., 2005. Amino acid uptake of Prochlorococcus spp. in surfacewaters across the South Atlantic Subtropical Front. Aquat. Microb. Ecol. 40 (3),241–249.
Zubkov, M.V., Sleigh, M.A., Tarran, G.A., Burkill, P.H., Leakey, R.J.G., 1998.Picoplanktonic community structure on an Atlantic transect from 50°N to 50°S.Deep Sea Res. Part I: Oceanogr. Res. Pap. 45 (8), 1339–1355.
Zubkov, M.V., Fuchs, B.M., Tarran, G.A., Burkill, P.H., Amann, R., 2003. High rate ofuptake of organic nitrogen compounds by Prochlorococcus cyanobacteria as a key totheir dominance in oligotrophic oceanic waters. Appl. Environ. Microbiol. 69 (2),1299–1304.
Zwirglmaier, K., Jardillier, L., Ostrowski, M., Mazard, S., Garczarek, L., Vaulot, D., Not,F., Massana, R., Ulloa, O., Scanlan, D.J., 2008. Global phylogeography of marineSynechococcus and Prochlorococcus reveals a distinct partitioning of lineages amongoceanic biomes. Environ. Microbiol. 10 (1), 147–161.
N. Van Oostende et al. Deep–Sea Research Part I 121 (2017) 79–94
94


![[37] Program organization research of Multistage Deep Sea Water](https://img.pdfslide.net/doc/110x75/589ec7e11a28ab814a8be964/37-program-organization-research-of-multistage-deep-sea-water-.jpg)