Embed Size (px)
Citation preview

15 March/mars 2018 COMMUNIQUE PR/CP(2018)16
North Atlantic Treaty Organisation – Organisation du Traité de l’Atlantique Nord Press & Media – Presse & Médias B-1110 Bruxelles Belgique E-mail: [email protected] – Tel.: 32 2 707 50 41 – Fax: 32 2 707 13 99 – Internet: www.nato.int
News and information is routinely placed on the NATO website. This includes audio files, transcripts and high resolution photographs, which are posted as soon as possible after events of media interest. Check the 'What's New' file. Nouvelles et informations sont régulièrement affichées sur le site Web de l'OTAN, sous la forme de fichiers audio, de transcriptions et de photographies destinées à la publication. Elles sont disponibles le plus rapidement possible après les événements présentant un intérêt pour les médias. Cliquer sur "Quoi de neuf?"
Defence Expenditure of NATO Countries (2010-2017)
NATO collects defence expenditure data from Allies on a regular basis and presents aggregates and subsets of this information. Each Ally’s Ministry of Defence reports current and estimated future defence expenditure according to an agreed definition of defence expenditure. The amounts represent payments by a national government actually made, or to be made, during the course of the fiscal year to meet the needs of its armed forces, those of Allies or of the Alliance. NATO also makes use of up-to-date economic and demographic information available from the Directorate-General for Economic and Financial Affairs of the European Commission (DG-ECFIN), and the Organisation for Economic Co-operation and Development (OECD).
In view of differences between the definition of NATO defence expenditure and national definitions, the figures shown in this report may diverge considerably from those which are quoted by media, published by national authorities or given in national budgets. Equipment expenditure includes expenditure on major equipment as well as on research and development devoted to major equipment. Personnel expenditure includes pensions paid to retirees.
The cut-off date for information used in this report was 9 February 2018. Figures for 2017 are estimates.

Cumulative spending increase for the period from 2015 to 2017, above 2014 level: +46.0 Bn USD
Notes: Figures for 2017 are estimates. The NATO Europe and Canada aggregate from 2017 includes Montenegro, which became an Ally on 5 June 2017.
* Defence expenditure does not include pensions.
-2-
Graph 1 : NATO Europe and Canada - defence expenditure
(annual real change, based on 2010 prices and exchange rates)
Graph 2 : Defence expenditure as a share of GDP versus equipment
expenditure as a share of defence expenditure 2017e
-2.14 -2.33 -2.46
-1.64
-0.96
1.84
3.08
4.87
-4
-3
-2
-1
0
1
2
3
4
5
6
2010 2011 2012 2013 2014 2015 2016 2017e
%
ALBBEL
BGR*
CAN
HRV
CZEDNK
EST
FRA
DEU
GRCHUN
ITA
LVA
LTU
LUX
MNE
NLD
NOR
POL
PRT
ROU
SVK
SVN
ESP
TUR
GBR
USA
0
5
10
15
20
25
30
35
40
0.0 0.5 1.0 1.5 2.0 2.5 3.0 3.5 4.0
Eq
uip
men
t exp
en
dit
ure
as
% o
f d
efe
nce e
xp
en
dit
ure
Defence expenditure as % of GDP
%
%
NATO guideline 2%
NATO guideline 20%
Median 19.27%
Median 1.30%

Notes: Figures for 2017 are estimates.
* Defence expenditure does not include pensions.
-3-
Graph 3 : Defence expenditure as a share of GDP (%)
(based on 2010 prices and exchange rates)
Graph 4 : Equipment expenditure as a share of defence expenditure (%)
(based on 2010 prices and exchange rates)
3.57
2.36
2.12 2.081.99
1.80 1.79 1.75 1.731.62 1.58 1.53
1.481.31 1.29 1.26 1.24 1.19 1.17 1.15 1.12 1.10 1.06 1.05 0.98 0.92 0.90
0.46
0.0
0.5
1.0
1.5
2.0
2.5
3.0
3.5
4.0
4.5
2014 2017e
%
NATO guideline 2%
33.20 32.9931.09
30.4029.54
28.43
25.5224.17
22.14 22.0320.94 20.42
19.42 19.31 19.24
17.22 16.8015.4715.34
13.75
12.10
11.1210.31 9.07
8.206.96
5.304.01
0
5
10
15
20
25
30
35
40
2014 2017e
%
NATO guideline 20%

Notes: Includes enlargements which took place in: 1999 (3 Allies), 2004 (7 Allies), 2009 (2 Allies) and 2017 (1 Ally). Figures for 2017 are estimates.
-4-
Graph 5 : Defence expenditure as a share of GDP (%)(based on 2010 prices and exchange rates)
Graph 6 : NATO Europe and Canada - defence expenditure(billion US dollars, based on 2010 prices and exchange rates)
2.01
1.45
5.29
3.57
3.28
2.42
0
1
2
3
4
5
6
719
89
1990
1991
1992
1993
1994
1995
1996
1997
1998
1999
2000
2001
2002
2003
2004
2005
2006
2007
2008
2009
2010
2011
2012
2013
2014
2015
2016
2017
e
%
United States
NATO Total
NATO Europe and Canada
NATO guideline 2%
200
225
250
275
300
325
350
1989
1990
1991
1992
1993
1994
1995
1996
1997
1998
1999
2000
2001
2002
2003
2004
2005
2006
2007
2008
2009
2010
2011
2012
2013
2014
2015
2016
2017
e
+ CZE, HUN, POL
+ BGR, EST, LVA, LTU, ROU, SVK, SVN
+ ALB, HRV + MNE
NATO Europe and Canada
Notes: Figures for 2017 are estimates. The NATO Europe and Canada aggregate from 2017 includes Montenegro, which became an Ally on 5 June 2017.
-5-
Graph 7 : Defence expenditure
(billion US dollars, based on 2010 prices and exchange rates)
Graph 8 : Defence expenditure as a share of GDP (%)
(based on 2010 prices and exchange rates)
720 726 686 645 611 594 603 618
293 286279
275272 277 286
300
1,014 1,012966
920883 871 889 917
0
200
400
600
800
1,000
1,200
2010 2011 2012 2013 2014 2015 2016 2017e
United States NATO Europe and Canada
4.81 4.78
4.42
4.08
3.77
3.56 3.56 3.57
1.59 1.52 1.48 1.45 1.40 1.40 1.42 1.45
0.0
0.5
1.0
1.5
2.0
2.5
3.0
3.5
4.0
4.5
5.0
5.5
2010 2011 2012 2013 2014 2015 2016 2017e
United States NATO Europe and Canada
%
Table 1 : Defence expenditure
Million national currency units
2010 2011 2012 2013 2014 2015 2016 2017e
Current prices
Albania (Leks) 19,321 19,877 19,820 19,022 18,788 16,671 16,250 17,199
Belgium (Euros) 3,960 3,956 4,023 3,964 3,913 3,789 3,901 3,965
Bulgaria * (Leva) 1,230 1,066 1,099 1,196 1,102 1,116 1,186 1,508
Canada (Canadian dollars) 19,255 21,808 19,978 18,764 20,076 23,900 23,474 27,607
Croatia (Kunas) 5,057 5,323 5,059 4,848 4,625 4,586 4,241 4,553
Czech Republic (Koruny) 50,808 43,131 42,780 42,035 41,003 47,264 45,598 52,714
Denmark (Kroner) 25,328 24,259 25,618 23,682 22,769 22,633 24,190 25,165
Estonia (Euros) 251 280 340 361 386 418 450 479
France (Euros) 39,241 38,443 39,105 39,402 39,149 39,199 39,950 40,852
Germany (Euros) 34,925 34,630 36,168 34,593 34,749 35,898 37,598 40,447
Greece (Euros) 5,966 4,934 4,384 3,999 3,939 4,073 4,190 4,213
Hungary (Forint) 280,895 295,967 297,650 286,341 281,402 316,338 362,798 402,793
Italy (Euros) 21,637 21,741 20,600 20,078 18,427 17,642 20,226 20,787
Latvia (Euros) 189 206 193 212 221 254 364 470
Lithuania (Euros) 246 248 252 267 322 425 575 724
Luxembourg (Euros) 187 167 167 176 190 225 213 256
Montenegro (Euros) 56 57 53 49 52 51 56 66
Netherlands (Euros) 8,472 8,156 8,067 7,702 7,788 7,816 8,234 8,686
Norway (Kroner) 39,279 40,534 41,560 43,518 46,234 46,900 50,937 55,309
Poland (Zlotys) 25,608 26,979 28,365 28,467 31,874 39,940 37,082 39,206
Portugal (Euros) 2,673 2,627 2,366 2,457 2,263 2,384 2,364 2,512
Romania (New Lei) 6,630 7,255 7,282 8,160 9,014 10,337 10,738 14,765
Slovak Republic (Euros) 859 766 794 729 752 889 907 1,004
Slovenia (Euros) 583 479 423 382 366 361 406 425
Spain (Euros) 11,132 10,059 10,828 9,495 9,508 10,000 9,014 10,739
Turkey (Liras) 21,241 22,807 24,956 27,466 29,727 32,522 38,141 44,240
United Kingdom (Pounds) 39,053 39,204 36,563 39,824 39,902 38,940 42,189 43,002
United States (US dollars) 720,423 740,744 712,947 680,856 653,942 641,253 656,059 685,957
Constant 2010 prices
Albania (Leks) 19,321 19,427 19,172 18,347 17,845 15,819 15,452 16,062
Belgium (Euros) 3,960 3,878 3,868 3,772 3,699 3,542 3,589 3,563
Bulgaria * (Leva) 1,230 1,006 1,021 1,119 1,026 1,017 1,057 1,336
Canada (Canadian dollars) 19,255 21,123 19,117 17,676 18,559 22,268 21,740 24,961
Croatia (Kunas) 5,057 5,235 4,898 4,657 4,440 4,403 4,076 4,324
Czech Republic (Koruny) 50,808 43,122 42,156 40,837 38,870 44,289 42,207 48,309
Denmark (Kroner) 25,328 24,104 24,865 22,783 21,681 21,401 22,884 23,387
Estonia (Euros) 251 266 313 321 339 362 383 391
France (Euros) 39,241 38,084 38,297 38,290 37,825 37,465 38,036 38,581
Germany (Euros) 34,925 34,263 35,242 33,058 32,621 33,035 34,146 36,173
Greece (Euros) 5,966 4,894 4,365 4,078 4,091 4,275 4,440 4,413
Hungary (Forint) 280,895 289,401 281,528 263,107 250,112 275,962 313,485 335,916
Italy (Euros) 21,637 20,949 19,521 18,526 16,709 15,735 17,610 17,906
Latvia (Euros) 189 194 175 189 194 222 318 400
Lithuania (Euros) 246 235 233 244 291 383 513 620
Luxembourg (Euros) 187 159 155 161 171 200 192 226
Montenegro (Euros) 56 57 52 48 50 48 50 58
Netherlands (Euros) 8,472 8,057 7,827 7,359 7,374 7,393 7,721 8,011
Norway (Kroner) 39,279 39,465 39,622 40,244 41,985 41,299 44,006 47,299
Poland (Zlotys) 25,608 26,135 26,847 26,865 29,933 37,226 34,419 35,858
Portugal (Euros) 2,673 2,634 2,382 2,418 2,211 2,283 2,232 2,344
Romania (New Lei) 6,630 6,927 6,641 7,196 7,818 8,739 8,886 11,980
Slovak Republic (Euros) 859 754 771 705 728 862 883 969
Slovenia (Euros) 583 474 416 370 352 344 383 391
Spain (Euros) 11,132 10,056 10,817 9,452 9,484 9,914 8,911 10,538
Turkey (Liras) 21,241 21,080 21,474 22,240 22,408 22,735 24,665 26,429
United Kingdom (Pounds) 39,053 38,431 35,291 37,720 37,156 36,096 38,340 38,294
United States (US dollars) 720,423 726,021 686,280 644,772 611,089 593,737 603,046 617,669
* Data do not include pensions.
-6-
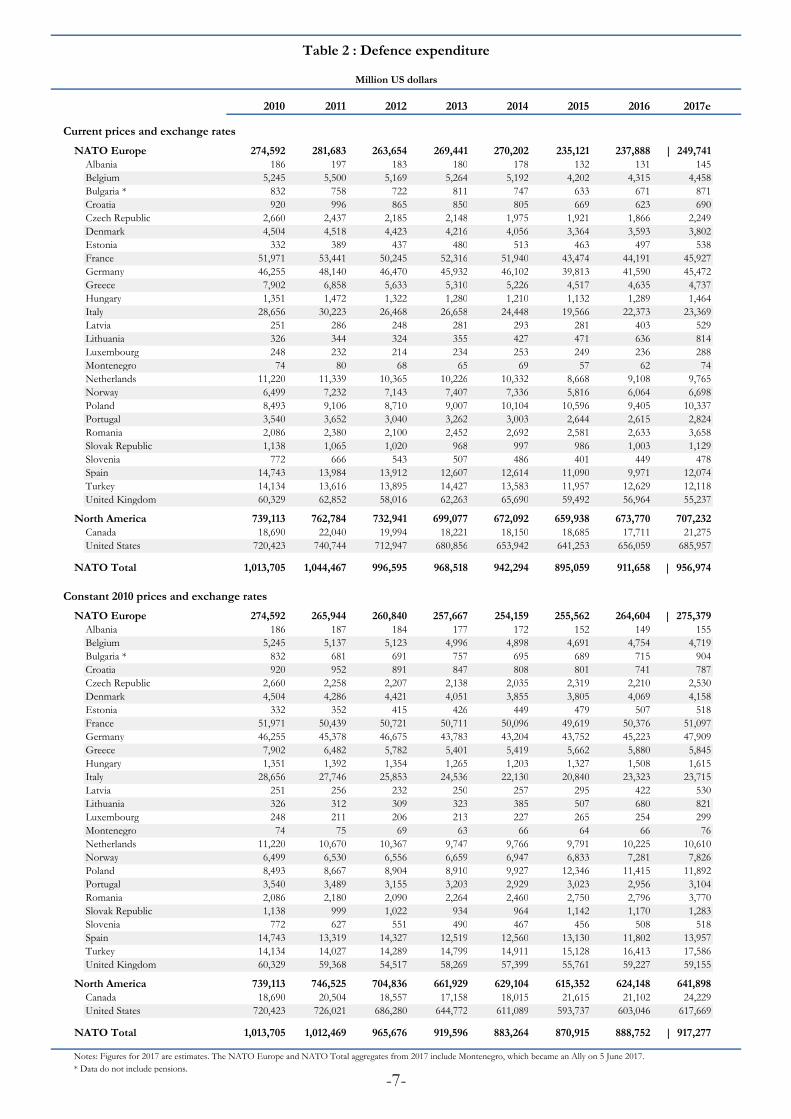
Table 2 : Defence expenditure
Million US dollars
2010 2011 2012 2013 2014 2015 2016 2017e
Current prices and exchange rates
NATO Europe 274,592 281,683 263,654 269,441 270,202 235,121 237,888 | 249,741
Albania 186 197 183 180 178 132 131 145
Belgium 5,245 5,500 5,169 5,264 5,192 4,202 4,315 4,458
Bulgaria * 832 758 722 811 747 633 671 871
Croatia 920 996 865 850 805 669 623 690
Czech Republic 2,660 2,437 2,185 2,148 1,975 1,921 1,866 2,249
Denmark 4,504 4,518 4,423 4,216 4,056 3,364 3,593 3,802
Estonia 332 389 437 480 513 463 497 538
France 51,971 53,441 50,245 52,316 51,940 43,474 44,191 45,927
Germany 46,255 48,140 46,470 45,932 46,102 39,813 41,590 45,472
Greece 7,902 6,858 5,633 5,310 5,226 4,517 4,635 4,737
Hungary 1,351 1,472 1,322 1,280 1,210 1,132 1,289 1,464
Italy 28,656 30,223 26,468 26,658 24,448 19,566 22,373 23,369
Latvia 251 286 248 281 293 281 403 529
Lithuania 326 344 324 355 427 471 636 814
Luxembourg 248 232 214 234 253 249 236 288
Montenegro 74 80 68 65 69 57 62 74
Netherlands 11,220 11,339 10,365 10,226 10,332 8,668 9,108 9,765
Norway 6,499 7,232 7,143 7,407 7,336 5,816 6,064 6,698
Poland 8,493 9,106 8,710 9,007 10,104 10,596 9,405 10,337
Portugal 3,540 3,652 3,040 3,262 3,003 2,644 2,615 2,824
Romania 2,086 2,380 2,100 2,452 2,692 2,581 2,633 3,658
Slovak Republic 1,138 1,065 1,020 968 997 986 1,003 1,129
Slovenia 772 666 543 507 486 401 449 478
Spain 14,743 13,984 13,912 12,607 12,614 11,090 9,971 12,074
Turkey 14,134 13,616 13,895 14,427 13,583 11,957 12,629 12,118
United Kingdom 60,329 62,852 58,016 62,263 65,690 59,492 56,964 55,237
North America 739,113 762,784 732,941 699,077 672,092 659,938 673,770 707,232
Canada 18,690 22,040 19,994 18,221 18,150 18,685 17,711 21,275
United States 720,423 740,744 712,947 680,856 653,942 641,253 656,059 685,957
NATO Total 1,013,705 1,044,467 996,595 968,518 942,294 895,059 911,658 | 956,974
Constant 2010 prices and exchange rates
NATO Europe 274,592 265,944 260,840 257,667 254,159 255,562 264,604 | 275,379
Albania 186 187 184 177 172 152 149 155
Belgium 5,245 5,137 5,123 4,996 4,898 4,691 4,754 4,719
Bulgaria * 832 681 691 757 695 689 715 904
Croatia 920 952 891 847 808 801 741 787
Czech Republic 2,660 2,258 2,207 2,138 2,035 2,319 2,210 2,530
Denmark 4,504 4,286 4,421 4,051 3,855 3,805 4,069 4,158
Estonia 332 352 415 426 449 479 507 518
France 51,971 50,439 50,721 50,711 50,096 49,619 50,376 51,097
Germany 46,255 45,378 46,675 43,783 43,204 43,752 45,223 47,909
Greece 7,902 6,482 5,782 5,401 5,419 5,662 5,880 5,845
Hungary 1,351 1,392 1,354 1,265 1,203 1,327 1,508 1,615
Italy 28,656 27,746 25,853 24,536 22,130 20,840 23,323 23,715
Latvia 251 256 232 250 257 295 422 530
Lithuania 326 312 309 323 385 507 680 821
Luxembourg 248 211 206 213 227 265 254 299
Montenegro 74 75 69 63 66 64 66 76
Netherlands 11,220 10,670 10,367 9,747 9,766 9,791 10,225 10,610
Norway 6,499 6,530 6,556 6,659 6,947 6,833 7,281 7,826
Poland 8,493 8,667 8,904 8,910 9,927 12,346 11,415 11,892
Portugal 3,540 3,489 3,155 3,203 2,929 3,023 2,956 3,104
Romania 2,086 2,180 2,090 2,264 2,460 2,750 2,796 3,770
Slovak Republic 1,138 999 1,022 934 964 1,142 1,170 1,283
Slovenia 772 627 551 490 467 456 508 518
Spain 14,743 13,319 14,327 12,519 12,560 13,130 11,802 13,957
Turkey 14,134 14,027 14,289 14,799 14,911 15,128 16,413 17,586
United Kingdom 60,329 59,368 54,517 58,269 57,399 55,761 59,227 59,155
North America 739,113 746,525 704,836 661,929 629,104 615,352 624,148 641,898
Canada 18,690 20,504 18,557 17,158 18,015 21,615 21,102 24,229
United States 720,423 726,021 686,280 644,772 611,089 593,737 603,046 617,669
NATO Total 1,013,705 1,012,469 965,676 919,596 883,264 870,915 888,752 | 917,277
* Data do not include pensions.
-7-
Notes: Figures for 2017 are estimates. The NATO Europe and NATO Total aggregates from 2017 include Montenegro, which became an Ally on 5 June 2017.

Table 3 : Defence expenditure as a share of GDP and annual real change
Based on 2010 prices
2010 2011 2012 2013 2014 2015 2016 2017e
Share of real GDP (%)
NATO Europe 1.63 1.55 1.52 1.49 1.44 1.42 1.44 | 1.46
Albania 1.56 1.53 1.49 1.41 1.35 1.17 1.10 1.10
Belgium 1.08 1.04 1.04 1.01 0.98 0.92 0.92 0.90
Bulgaria * 1.64 1.32 1.34 1.46 1.32 1.26 1.26 1.53
Croatia 1.54 1.60 1.53 1.47 1.41 1.37 1.23 1.26
Czech Republic 1.28 1.07 1.05 1.03 0.95 1.03 0.96 1.05
Denmark 1.40 1.31 1.35 1.23 1.15 1.12 1.17 1.17
Estonia 1.70 1.68 1.90 1.91 1.96 2.05 2.13 2.08
France 1.96 1.87 1.87 1.86 1.82 1.79 1.79 1.79
Germany 1.35 1.28 1.31 1.22 1.18 1.18 1.20 1.24
Greece 2.64 2.38 2.29 2.21 2.20 2.31 2.41 2.36
Hungary 1.03 1.05 1.03 0.95 0.86 0.92 1.02 1.06
Italy 1.35 1.30 1.24 1.20 1.08 1.01 1.12 1.12
Latvia 1.06 1.01 0.88 0.93 0.93 1.04 1.46 1.75
Lithuania 0.88 0.79 0.76 0.76 0.88 1.14 1.49 1.73
Luxembourg 0.47 0.39 0.38 0.38 0.38 0.43 0.40 0.46
Montenegro 1.80 1.75 1.66 1.47 1.50 1.40 1.42 1.58
Netherlands 1.34 1.25 1.23 1.16 1.15 1.12 1.15 1.15
Norway 1.51 1.51 1.47 1.48 1.51 1.46 1.54 1.62
Poland 1.77 1.72 1.74 1.72 1.85 2.22 2.00 1.99
Portugal 1.49 1.49 1.41 1.44 1.31 1.33 1.28 1.31
Romania 1.24 1.28 1.22 1.28 1.35 1.45 1.41 1.80
Slovak Republic 1.27 1.09 1.09 0.98 0.99 1.13 1.12 1.19
Slovenia 1.61 1.30 1.17 1.05 0.97 0.93 1.00 0.98
Spain 1.03 0.94 1.04 0.93 0.92 0.93 0.81 0.92
Turkey 1.83 1.64 1.59 1.52 1.45 1.39 1.46 1.48
United Kingdom 2.47 2.40 2.17 2.27 2.17 2.06 2.15 2.12
North America 4.46 4.43 4.09 3.77 3.50 3.33 3.33 3.35
Canada 1.16 1.23 1.10 0.99 1.01 1.20 1.16 1.29
United States 4.81 4.78 4.42 4.08 3.77 3.56 3.56 3.57
NATO Total 3.03 2.97 2.81 2.64 2.48 2.39 2.40 | 2.42
Annual real change (%)
NATO Europe -1.19 -3.15 -1.92 -1.22 -1.36 0.55 3.54 | 4.07
Albania 6.54 0.55 -1.32 -4.30 -2.74 -11.35 -2.32 3.95
Belgium -3.70 -2.07 -0.27 -2.48 -1.94 -4.24 1.35 -0.73
Bulgaria * -4.47 -18.22 1.54 9.53 -8.28 -0.84 3.88 26.42
Croatia -6.38 3.53 -6.44 -4.93 -4.65 -0.84 -7.43 6.10
Czech Republic -13.60 -15.13 -2.24 -3.13 -4.82 13.94 -4.70 14.46
Denmark 5.52 -4.83 3.15 -8.37 -4.84 -1.29 6.93 2.20
Estonia -3.09 6.11 17.69 2.67 5.39 6.74 5.94 2.19
France -0.94 -2.95 0.56 -0.02 -1.21 -0.95 1.53 1.43
Germany 1.44 -1.90 2.86 -6.20 -1.32 1.27 3.36 5.94
Greece -18.94 -17.97 -10.81 -6.59 0.33 4.48 3.86 -0.60
Hungary -8.08 3.03 -2.72 -6.54 -4.94 10.34 13.60 7.16
Italy -3.73 -3.18 -6.82 -5.09 -9.81 -5.83 11.91 1.68
Latvia -15.94 2.27 -9.53 7.89 2.53 14.79 43.13 25.80
Lithuania -16.85 -4.32 -0.90 4.72 19.15 31.64 33.96 20.73
Luxembourg 24.44 -15.12 -2.30 3.69 6.42 16.60 -3.89 17.55
Montenegro 4.62 0.63 -8.11 -8.44 4.49 -3.50 4.33 15.14
Netherlands -4.22 -4.90 -2.84 -5.98 0.19 0.26 4.43 3.76
Norway -1.08 0.47 0.40 1.57 4.32 -1.63 6.55 7.48
Poland 8.00 2.06 2.73 0.07 11.42 24.37 -7.54 4.18
Portugal -1.35 -1.45 -9.56 1.51 -8.56 3.24 -2.23 5.01
Romania -7.31 4.48 -4.13 8.36 8.63 11.78 1.68 34.82
Slovak Republic -12.02 -12.23 2.31 -8.63 3.22 18.53 2.44 9.67
Slovenia 2.38 -18.77 -12.07 -11.19 -4.74 -2.33 11.40 2.12
Spain -8.87 -9.66 7.57 -12.62 0.33 4.54 -10.11 18.25
Turkey 1.25 -0.75 1.87 3.56 0.75 1.46 8.49 7.15
United Kingdom 2.92 -1.59 -8.17 6.88 -1.49 -2.85 6.22 -0.12
North America -6.87 1.00 -5.58 -6.09 -4.96 -2.19 1.43 2.84
Canada -14.25 9.71 -9.50 -7.54 5.00 19.98 -2.37 14.82
United States -6.66 0.78 -5.47 -6.05 -5.22 -2.84 1.57 2.42
NATO Total -5.39 -0.12 -4.62 -4.77 -3.95 -1.40 2.05 | 3.21
* Defence expenditure does not include pensions.
-8-
Notes: Figures for 2017 are estimates. The NATO Europe and NATO Total aggregates from 2017 include Montenegro, which became an Ally on 5 June 2017.
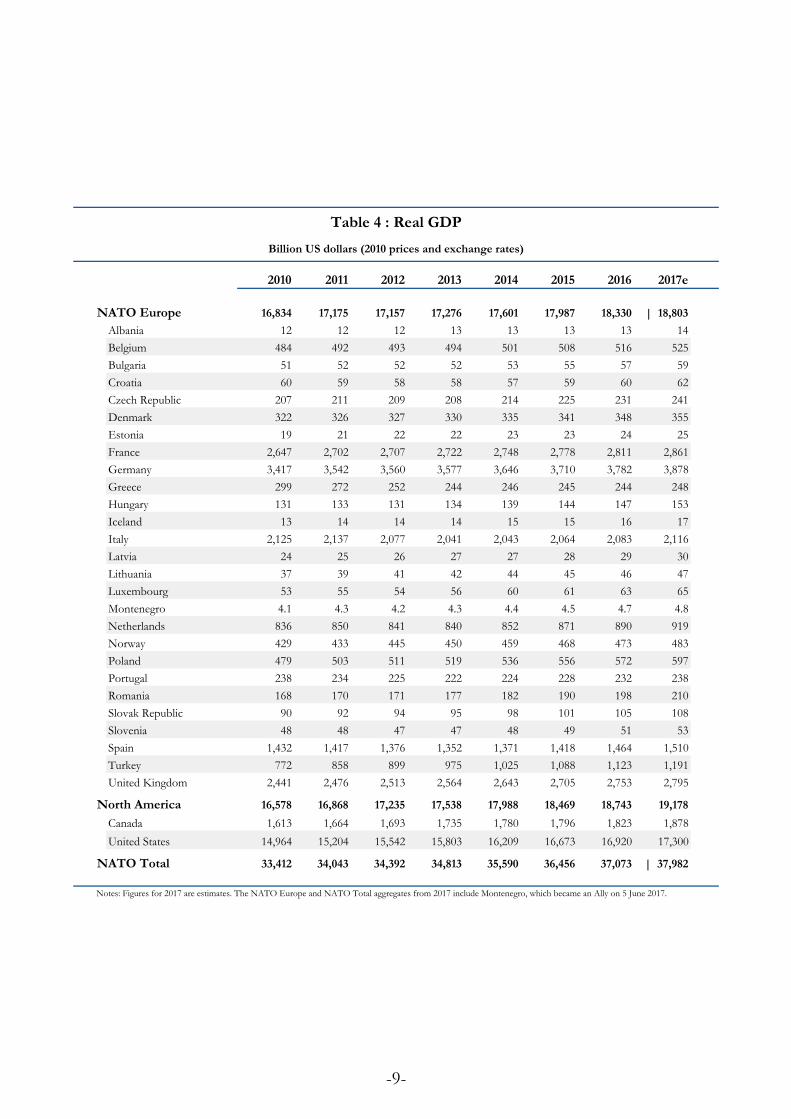
Table 4 : Real GDP
Billion US dollars (2010 prices and exchange rates)
2010 2011 2012 2013 2014 2015 2016 2017e
NATO Europe 16,834 17,175 17,157 17,276 17,601 17,987 18,330 | 18,803
Albania 12 12 12 13 13 13 13 14
Belgium 484 492 493 494 501 508 516 525
Bulgaria 51 52 52 52 53 55 57 59
Croatia 60 59 58 58 57 59 60 62
Czech Republic 207 211 209 208 214 225 231 241
Denmark 322 326 327 330 335 341 348 355
Estonia 19 21 22 22 23 23 24 25
France 2,647 2,702 2,707 2,722 2,748 2,778 2,811 2,861
Germany 3,417 3,542 3,560 3,577 3,646 3,710 3,782 3,878
Greece 299 272 252 244 246 245 244 248
Hungary 131 133 131 134 139 144 147 153
Iceland 13 14 14 14 15 15 16 17
Italy 2,125 2,137 2,077 2,041 2,043 2,064 2,083 2,116
Latvia 24 25 26 27 27 28 29 30
Lithuania 37 39 41 42 44 45 46 47
Luxembourg 53 55 54 56 60 61 63 65
Montenegro 4.1 4.3 4.2 4.3 4.4 4.5 4.7 4.8
Netherlands 836 850 841 840 852 871 890 919
Norway 429 433 445 450 459 468 473 483
Poland 479 503 511 519 536 556 572 597
Portugal 238 234 225 222 224 228 232 238
Romania 168 170 171 177 182 190 198 210
Slovak Republic 90 92 94 95 98 101 105 108
Slovenia 48 48 47 47 48 49 51 53
Spain 1,432 1,417 1,376 1,352 1,371 1,418 1,464 1,510
Turkey 772 858 899 975 1,025 1,088 1,123 1,191
United Kingdom 2,441 2,476 2,513 2,564 2,643 2,705 2,753 2,795
North America 16,578 16,868 17,235 17,538 17,988 18,469 18,743 19,178
Canada 1,613 1,664 1,693 1,735 1,780 1,796 1,823 1,878
United States 14,964 15,204 15,542 15,803 16,209 16,673 16,920 17,300
NATO Total 33,412 34,043 34,392 34,813 35,590 36,456 37,073 | 37,982
-9-
Notes: Figures for 2017 are estimates. The NATO Europe and NATO Total aggregates from 2017 include Montenegro, which became an Ally on 5 June 2017.

Table 5 : GDP per capita and defence expenditure per capita
2010 prices and exchange rates
2010 2011 2012 2013 2014 2015 2016 2017e
GDP per capita (thousand US dollars)
NATO Europe 30.3 30.8 30.6 30.7 31.2 31.8 32.2 | 32.9
Albania 4.1 4.2 4.3 4.3 4.4 4.5 4.7 4.9
Belgium 44.4 44.8 44.6 44.4 44.8 45.2 45.6 46.2
Bulgaria 6.8 7.0 7.1 7.2 7.3 7.6 8.0 8.3
Croatia 13.9 13.9 13.6 13.5 13.5 13.9 14.5 15.0
Czech Republic 19.7 20.1 19.9 19.8 20.3 21.4 21.9 22.8
Denmark 58.0 58.6 58.5 58.8 59.4 60.0 60.7 61.5
Estonia 14.6 15.8 16.5 16.9 17.4 17.8 18.1 18.8
France 40.7 41.4 41.3 41.3 41.5 41.7 42.0 42.6
Germany 42.6 44.1 44.3 44.4 45.0 45.4 45.8 46.6
Greece 26.9 24.5 22.8 22.3 22.6 22.6 22.7 23.1
Hungary 13.1 13.3 13.2 13.5 14.1 14.6 15.0 15.6
Iceland 41.7 42.4 42.7 44.1 44.5 45.8 48.4 50.8
Italy 35.5 35.6 34.4 33.7 33.6 34.0 34.4 34.9
Latvia 11.3 12.3 12.9 13.4 13.8 14.3 14.7 15.7
Lithuania 12.0 13.0 13.7 14.3 14.9 15.4 15.9 16.7
Luxembourg 104.8 105.0 102.3 103.3 106.8 107.7 108.2 108.8
Montenegro 6.7 6.9 6.7 6.9 7.0 7.3 7.5 7.8
Netherlands 50.3 50.9 50.2 50.0 50.5 51.4 52.3 53.7
Norway 87.8 87.5 88.7 88.5 89.3 90.1 90.3 91.4
Poland 12.4 13.1 13.3 13.5 13.9 14.5 14.9 15.5
Portugal 22.5 22.2 21.4 21.2 21.5 22.0 22.4 23.1
Romania 8.3 8.4 8.5 8.8 9.2 9.6 10.1 10.7
Slovak Republic 16.5 17.0 17.3 17.5 18.0 18.7 19.3 19.9
Slovenia 23.4 23.5 22.9 22.6 23.2 23.7 24.5 25.6
Spain 30.7 30.3 29.4 29.0 29.5 30.6 31.5 32.5
Turkey 10.6 11.6 12.0 12.8 13.3 13.9 14.2 14.8
United Kingdom 38.9 39.1 39.4 40.0 40.9 41.5 42.0 42.3
North America 48.2 48.7 49.4 49.9 50.7 51.7 52.1 52.9
Canada 47.3 48.2 48.6 49.2 50.0 50.0 50.3 51.5
United States 48.3 48.7 49.4 49.9 50.8 51.9 52.3 53.1
NATO Total 37.1 37.6 37.8 38.1 38.7 39.5 39.9 | 40.7
Defence expenditure per capita (US dollars)
NATO Europe 494 476 466 458 451 451 465 | 481
Albania 64 64 64 61 59 53 52 54
Belgium 481 467 463 449 438 417 421 415
Bulgaria * 113 93 95 104 96 96 100 128
Croatia 214 222 209 199 190 191 178 190
Czech Republic 253 215 210 203 193 220 209 239
Denmark 812 769 791 722 683 670 710 720
Estonia 249 265 313 322 341 365 385 393
France 800 772 773 769 756 745 753 760
Germany 576 565 580 543 533 536 548 576
Greece 711 584 523 493 497 523 545 545
Hungary 135 140 136 128 122 135 154 165
Italy 479 462 428 405 364 343 385 391
Latvia 120 125 114 124 129 149 215 273
Lithuania 105 103 103 109 131 175 237 290
Luxembourg 489 405 387 391 407 465 435 500
Montenegro 120 121 111 102 106 102 107 123
Netherlands 675 639 619 580 579 578 600 620
Norway 1,329 1,318 1,306 1,311 1,352 1,316 1,391 1,481
Poland 220 225 231 231 258 321 297 309
Portugal 335 330 300 306 282 292 286 301
Romania 103 108 104 113 124 139 142 193
Slovak Republic 210 185 189 172 178 211 215 236
Slovenia 377 306 268 238 226 221 246 251
Spain 317 285 306 269 270 283 254 300
Turkey 193 189 190 194 193 193 207 219
United Kingdom 961 938 856 909 889 856 903 896
North America 2,149 2,154 2,018 1,882 1,775 1,723 1,736 1,772
Canada 548 594 532 487 506 601 583 664
United States 2,325 2,326 2,183 2,037 1,916 1,849 1,865 1,896
NATO Total 1,127 1,119 1,062 1,006 961 943 957 | 982
* Defence expenditure does not include pensions.
-10-
Notes: Figures for 2017 are estimates. The NATO Europe and NATO Total aggregates from 2017 include Montenegro, which became an Ally on 5 June 2017.

Table 6 : Military personnel
Military personnel (thousands)
2010 2011 2012 2013 2014 2015 2016 2017e
NATO Europe 2,084 2,004 1,956 1,862 1,825 1,777 1,753 | 1,784
Albania 11 10 7.9 6.8 6.7 6.2 5.8 6.8
Belgium 34 32 31 31 31 30 29 28
Bulgaria 30 29 26 28 27 25 25 25
Croatia 16 16 16 16 15 15 15 15
Czech Republic 24 22 22 20 20 21 23 24
Denmark 19 19 19 18 17 17 17 17
Estonia 5.4 5.9 6.0 6.3 6.3 6.0 6.1 6.2
France 234 227 219 213 207 205 209 209
Germany 235 205 192 184 179 177 178 180
Greece 128 117 110 110 107 104 106 106
Hungary 20 19 19 18 17 17 18 19
Italy 193 192 189 189 183 178 176 181
Latvia 4.8 4.8 4.7 4.6 4.6 4.8 5.2 5.7
Lithuania 7.9 8.0 8.3 8.4 8.6 12 12 13
Luxembourg 0.9 0.9 0.8 0.9 0.8 0.8 0.8 0.8
Montenegro 2.1 1.9 1.9 1.9 1.9 1.7 1.7 1.7
Netherlands 48 45 44 42 41 41 40 41
Norway 19 21 21 20 21 21 20 20
Poland 100 97 98 100 99 99 102 111
Portugal 43 35 34 33 31 28 28 26
Romania 67 66 66 66 65 64 63 60
Slovak Republic 14 13 13 12 12 12 12 12
Slovenia 7.1 7.2 7.1 6.9 6.8 6.6 6.5 6.8
Spain 131 127 125 122 122 122 121 121
Turkey 495 495 495 427 427 399 373 387
United Kingdom 198 191 184 179 169 163 161 161
North America 1,488 1,493 1,467 1,450 1,404 1,387 1,375 1,379
Canada 61 68 68 68 66 73 73 73
United States 1,427 1,425 1,400 1,382 1,338 1,314 1,301 1,306
NATO Total 3,572 3,497 3,423 3,312 3,229 3,164 3,128 | 3,163
-11-
Notes: Figures for 2017 are estimates. The NATO Europe and NATO Total aggregates from 2017 include Montenegro, which became an Ally on 5 June 2017.

Table 7a : Distribution of defence expenditure by main category
Percentage of total defence expenditure
2010 2011 2012 2013 2014 2015 2016 2017e
Equipment (a)
Albania 15.69 13.36 14.44 16.29 16.65 8.92 8.01 6.96
Belgium 6.79 6.27 3.57 2.84 3.52 3.44 4.66 5.30
Bulgaria * 15.41 6.33 3.68 4.52 1.03 3.47 9.15 29.54
Canada 13.81 9.67 8.31 11.16 13.03 10.47 10.61 19.42
Croatia 8.12 15.79 14.72 10.72 7.35 10.58 10.09 9.07
Czech Republic 12.42 13.30 14.78 9.49 6.53 11.76 6.70 11.12
Denmark 14.10 9.68 9.03 11.26 10.99 11.50 13.68 12.10
Estonia 11.88 10.11 13.69 14.48 22.15 12.82 17.86 19.24
France 30.20 28.17 30.58 24.53 24.64 25.04 24.44 24.17
Germany 17.59 16.41 16.45 12.74 12.94 11.93 12.21 13.75
Greece 17.98 5.86 7.47 12.06 8.17 10.40 13.45 15.47
Hungary 12.10 12.29 5.84 11.08 7.76 9.75 13.37 15.34
Italy 10.92 11.74 8.87 12.51 10.92 9.72 19.09 20.94
Latvia 15.62 10.78 10.45 12.09 7.55 13.60 19.05 17.22
Lithuania 10.00 9.38 11.20 9.23 14.06 21.55 30.06 31.09
Luxembourg 34.45 21.86 17.11 14.57 22.61 33.33 30.07 32.99
Montenegro 3.66 1.73 4.44 1.32 7.46 5.43 4.46 8.20
Netherlands 15.70 14.43 13.41 12.57 10.68 11.16 14.14 16.80
Norway 18.13 17.04 17.76 18.89 21.17 22.49 24.05 25.52
Poland 18.13 16.13 15.16 13.90 18.84 33.20 21.62 22.14
Portugal 13.20 12.07 9.34 8.65 8.43 8.70 9.95 10.31
Romania 8.80 7.57 4.14 10.71 15.77 19.65 20.43 33.20
Slovak Republic 9.81 7.15 9.56 7.39 11.12 18.28 15.32 20.42
Slovenia 18.00 5.70 1.20 1.27 0.66 1.85 1.02 4.01
Spain 12.10 6.74 22.86 12.37 13.49 14.82 6.65 19.31
Turkey 27.98 24.57 21.21 26.89 25.08 25.13 25.59 30.40
United Kingdom 24.47 22.01 19.54 21.89 22.82 21.75 21.56 22.03
United States 24.02 26.99 26.97 25.83 25.97 25.41 25.05 28.43
Personnel (b)
Albania 75.66 77.07 69.97 75.25 68.05 78.15 68.05 68.20
Belgium 75.54 75.88 78.52 77.34 77.84 78.23 77.11 76.07
Bulgaria * 64.30 67.36 64.71 65.37 72.84 73.66 65.64 54.62
Canada 45.30 47.11 49.10 52.44 50.90 53.76 53.11 47.15
Croatia 71.56 67.17 68.13 68.06 69.25 63.64 67.13 62.77
Czech Republic 50.66 56.28 61.66 62.03 61.40 55.27 61.97 56.19
Denmark 50.81 52.22 49.05 51.74 51.27 52.01 49.51 48.95
Estonia 34.51 32.28 29.75 39.83 38.62 39.56 38.70 34.92
France 47.64 49.35 49.11 49.23 48.59 47.79 47.94 47.98
Germany 52.66 52.29 50.60 49.86 50.67 49.86 48.35 48.75
Greece 65.07 76.03 73.19 74.56 77.18 72.05 73.13 72.19
Hungary 56.35 50.64 47.69 48.96 49.77 48.21 49.66 42.41
Italy 75.08 74.78 77.05 75.00 76.41 77.55 70.79 66.41
Latvia 55.91 51.31 56.15 52.98 52.97 50.06 43.87 37.26
Lithuania 65.60 66.87 66.78 66.53 57.53 48.49 45.50 42.40
Luxembourg 45.63 52.29 54.23 51.10 49.31 42.77 45.56 38.85
Montenegro 73.63 82.88 82.68 87.68 78.53 78.03 75.32 72.78
Netherlands 52.28 54.66 57.54 58.53 56.50 55.51 51.77 50.97
Norway 42.69 43.43 42.38 41.02 39.36 38.70 37.28 35.48
Poland 56.79 57.80 57.34 57.70 51.45 41.96 47.15 47.92
Portugal 70.18 78.30 78.39 79.85 81.27 81.90 81.38 78.03
Romania 79.07 79.11 84.00 78.99 71.15 63.30 65.01 54.67
Slovak Republic 62.39 69.47 66.53 70.14 69.14 56.24 58.72 54.48
Slovenia 61.69 74.63 78.91 80.52 82.31 82.23 76.03 75.42
Spain 63.38 64.81 57.19 68.25 67.34 65.18 72.61 61.50
Turkey 49.75 53.02 56.02 54.58 56.88 56.82 57.69 53.28
United Kingdom 35.65 37.55 38.90 37.85 36.59 36.80 34.63 34.05
United States 46.70 33.01 32.12 34.38 35.45 36.64 45.01 42.07
* Defence expenditure does not include pensions.
(a) Equipment expenditure includes major equipment expenditure and R&D devoted to major equipment.
(b) Personnel expenditure includes military and civilian expenditure and pensions.
-12-
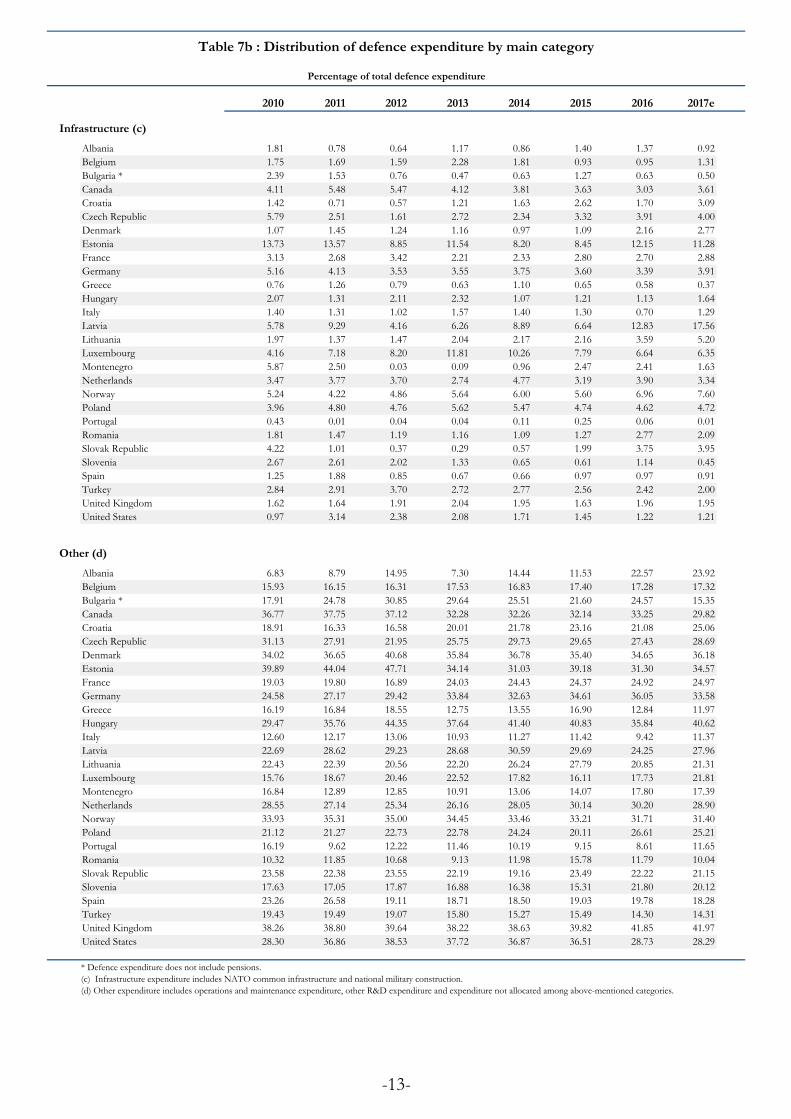
Table 7b : Distribution of defence expenditure by main category
Percentage of total defence expenditure
2010 2011 2012 2013 2014 2015 2016 2017e
Infrastructure (c)
Albania 1.81 0.78 0.64 1.17 0.86 1.40 1.37 0.92
Belgium 1.75 1.69 1.59 2.28 1.81 0.93 0.95 1.31
Bulgaria * 2.39 1.53 0.76 0.47 0.63 1.27 0.63 0.50
Canada 4.11 5.48 5.47 4.12 3.81 3.63 3.03 3.61
Croatia 1.42 0.71 0.57 1.21 1.63 2.62 1.70 3.09
Czech Republic 5.79 2.51 1.61 2.72 2.34 3.32 3.91 4.00
Denmark 1.07 1.45 1.24 1.16 0.97 1.09 2.16 2.77
Estonia 13.73 13.57 8.85 11.54 8.20 8.45 12.15 11.28
France 3.13 2.68 3.42 2.21 2.33 2.80 2.70 2.88
Germany 5.16 4.13 3.53 3.55 3.75 3.60 3.39 3.91
Greece 0.76 1.26 0.79 0.63 1.10 0.65 0.58 0.37
Hungary 2.07 1.31 2.11 2.32 1.07 1.21 1.13 1.64
Italy 1.40 1.31 1.02 1.57 1.40 1.30 0.70 1.29
Latvia 5.78 9.29 4.16 6.26 8.89 6.64 12.83 17.56
Lithuania 1.97 1.37 1.47 2.04 2.17 2.16 3.59 5.20
Luxembourg 4.16 7.18 8.20 11.81 10.26 7.79 6.64 6.35
Montenegro 5.87 2.50 0.03 0.09 0.96 2.47 2.41 1.63
Netherlands 3.47 3.77 3.70 2.74 4.77 3.19 3.90 3.34
Norway 5.24 4.22 4.86 5.64 6.00 5.60 6.96 7.60
Poland 3.96 4.80 4.76 5.62 5.47 4.74 4.62 4.72
Portugal 0.43 0.01 0.04 0.04 0.11 0.25 0.06 0.01
Romania 1.81 1.47 1.19 1.16 1.09 1.27 2.77 2.09
Slovak Republic 4.22 1.01 0.37 0.29 0.57 1.99 3.75 3.95
Slovenia 2.67 2.61 2.02 1.33 0.65 0.61 1.14 0.45
Spain 1.25 1.88 0.85 0.67 0.66 0.97 0.97 0.91
Turkey 2.84 2.91 3.70 2.72 2.77 2.56 2.42 2.00
United Kingdom 1.62 1.64 1.91 2.04 1.95 1.63 1.96 1.95
United States 0.97 3.14 2.38 2.08 1.71 1.45 1.22 1.21
Other (d)
Albania 6.83 8.79 14.95 7.30 14.44 11.53 22.57 23.92
Belgium 15.93 16.15 16.31 17.53 16.83 17.40 17.28 17.32
Bulgaria * 17.91 24.78 30.85 29.64 25.51 21.60 24.57 15.35
Canada 36.77 37.75 37.12 32.28 32.26 32.14 33.25 29.82
Croatia 18.91 16.33 16.58 20.01 21.78 23.16 21.08 25.06
Czech Republic 31.13 27.91 21.95 25.75 29.73 29.65 27.43 28.69
Denmark 34.02 36.65 40.68 35.84 36.78 35.40 34.65 36.18
Estonia 39.89 44.04 47.71 34.14 31.03 39.18 31.30 34.57
France 19.03 19.80 16.89 24.03 24.43 24.37 24.92 24.97
Germany 24.58 27.17 29.42 33.84 32.63 34.61 36.05 33.58
Greece 16.19 16.84 18.55 12.75 13.55 16.90 12.84 11.97
Hungary 29.47 35.76 44.35 37.64 41.40 40.83 35.84 40.62
Italy 12.60 12.17 13.06 10.93 11.27 11.42 9.42 11.37
Latvia 22.69 28.62 29.23 28.68 30.59 29.69 24.25 27.96
Lithuania 22.43 22.39 20.56 22.20 26.24 27.79 20.85 21.31
Luxembourg 15.76 18.67 20.46 22.52 17.82 16.11 17.73 21.81
Montenegro 16.84 12.89 12.85 10.91 13.06 14.07 17.80 17.39
Netherlands 28.55 27.14 25.34 26.16 28.05 30.14 30.20 28.90
Norway 33.93 35.31 35.00 34.45 33.46 33.21 31.71 31.40
Poland 21.12 21.27 22.73 22.78 24.24 20.11 26.61 25.21
Portugal 16.19 9.62 12.22 11.46 10.19 9.15 8.61 11.65
Romania 10.32 11.85 10.68 9.13 11.98 15.78 11.79 10.04
Slovak Republic 23.58 22.38 23.55 22.19 19.16 23.49 22.22 21.15
Slovenia 17.63 17.05 17.87 16.88 16.38 15.31 21.80 20.12
Spain 23.26 26.58 19.11 18.71 18.50 19.03 19.78 18.28
Turkey 19.43 19.49 19.07 15.80 15.27 15.49 14.30 14.31
United Kingdom 38.26 38.80 39.64 38.22 38.63 39.82 41.85 41.97
United States 28.30 36.86 38.53 37.72 36.87 36.51 28.73 28.29
* Defence expenditure does not include pensions.
(c) Infrastructure expenditure includes NATO common infrastructure and national military construction.
(d) Other expenditure includes operations and maintenance expenditure, other R&D expenditure and expenditure not allocated among above-mentioned categories.
-13-

-14-
NATO defence expenditure
NATO defines defence expenditure as payments made by a national government specifically to meet the needs of its armed forces, those of Allies or of the Alliance. A major component of defence expenditure is payments on Armed Forces financed within the Ministry of Defence (MoD) budget. Armed Forces include Land, Maritime and Air forces as well as Joint formations such as Administration and Command, Special Operations Forces, Medical Service, Logistic Command etc. They might also include "Other Forces" like Ministry of Interior troops, national police forces, gendarmerie, carabinieri, coast guards etc. In such cases, expenditure should be included only in proportion to the forces that are trained in military tactics, are equipped as a military force, can operate under direct military authority in deployed operations, and can, realistically, be deployed outside national territory in support of a military force. Also, expenditure on Other Forces financed through the budgets of ministries other than MoD should be included in defence expenditure.
Pension payments made directly by the government to retired military and civilian employees of military departments should be included regardless of whether these payments are made from the budget of the MoD or other ministries.
Expenditure for peacekeeping and humanitarian operations (paid by MoD or other ministries), the destruction of weapons, equipment and ammunition, contributions to eligible NATO-managed trust funds, and the costs associated with inspection and control of equipment destruction are included in defence expenditure.
Research and development (R&D) costs are to be included in defence expenditure. R&D costs should also include expenditure for those projects that do not successfully lead to production of equipment.
Expenditure for the military component of mixed civilian-military activities is included, but only when the military component can be specifically accounted for or estimated.
Expenditure on NATO Common infrastructure is included in the total defence expenditure of each Ally only to the extent of that nation's net contribution.
War damage payments and spending on civil defence are both excluded from the NATO definition of defence expenditure.
NATO uses United States dollars (USD) as the common currency denominator. The exchange rate applied to each Ally is the average annual rate published by the International Monetary Fund (IMF). The values for defence expenditure are expressed in current prices; constant prices; current prices and exchange rates; as well as constant prices and exchange rates.
Note to readers:
Iceland has no armed forces. For nations of the Euro zone, and Montenegro, monetary values in national currency are expressed in Euros for all years. Estonia adopted Euros from 2011, Latvia from 2014, and Lithuania from 2015. Montenegro joined the Alliance in 2017.
To avoid any ambiguity, the fiscal year has been designated by the year which includes the highest number of months: e.g. 2017 represents the fiscal year 2017/2018 for Canada and United Kingdom, and the fiscal year 2016/2017 for the United States. Because of rounding, the total figures may differ from the sum of their components.
Conventional signs:
e estimated - nil .. not available | break in continuity of series . decimal point

-15-
Nomenclature of NATO defence expenditure:
1 Operating costs
1.1 Military personnel 1.1.1 Pay and allowances 1.1.2 Employer's contributions to retirement funds 1.1.3 Other 1.2 Civilian personnel 1.2.1 Pay and allowances 1.2.2 Employer's contributions to retirement funds 1.3 Pensions 1.3.1 Paid to military retirees 1.3.2 Paid to civilian retirees 1.4 Operations and maintenance 1.4.1 Ammunition and explosives (excluding nuclear) 1.4.2 Petroleum products 1.4.3 Spare parts 1.4.4 Other equipment and supplies 1.4.5 Rents 1.4.6 Other operations and maintenance 2 Procurement and construction
2.1 Major equipment 2.1.1 Missile systems 2.1.2 Missiles (conventional weapons) 2.1.3 Nuclear weapons 2.1.4 Aircraft 2.1.5 Artillery 2.1.6 Combat vehicles 2.1.7 Engineering equipment 2.1.8 Weapons and small arms 2.1.9 Transport vehicles 2.1.10 Ships and harbour craft 2.1.11 Electronic and communications equipment 2.2 National military construction 2.3 NATO common infrastructure 2.3.1 Expenditure as host nation 2.3.2 Payments to other nations 2.3.3 Receipts from other nations 2.3.4 Land and utilities 3 Research and development
3.1 Devoted to major equipment 3.2 Other 4 Other expenditure
5 Total
6 Statistical discrepancy 7 Adjusted total
Main categories of defence expenditure:
- Equipment (Table 7a) – lines 2.1 + 3.1
- Personnel (Table 7a) – lines 1.1 + 1.2 + 1.3
- Infrastructure (Table 7b) – lines 2.2 + 2.3
- Other (Table 7b) – lines 1.4 + 3.2 + 4