Embed Size (px)
Citation preview
465
Vote 21
Defence Amount to be appropriated R18 414 380 000 Statutory appropriations – Responsible Minister Minister of Defence Administering Department Department of Defence Accounting Officer Secretary for Defence
Aim
The aim of the Department of Defence is to defend and protect South Africa, its territorial integrity, and its people, in accordance with the Constitution and international law regulating the use of force.
Key objectives and programmes The objectives of the Department of Defence are: • To defend South Africa, according to international law, against any aggression or threat of
aggression that endangers its stability • To deploy forces to enhance security internally or externally following government decisions • To provide support to the population or government departments in operations other than war
The Department’s main functions are to provide and maintain defence capabilities and to deliver services in terms of defence commitments made by Government, both internally and externally, whenever members of the South African National Defence Force (SANDF) are utilised. The Department collaborates with a range of government, regional, and international players to ensure that these objectives are met.
There are nine budget programmes through which the Department pursues its objectives: • Administration deals with the overall management of the Department. • Landward Defence, Air Defence and Maritime Defence provide and maintain capabilities for
defending and protecting the country. • Military Health Support provides and maintains medical combat support, as well as medical
services to members of the Department and their dependants. • Defence Intelligence provides military intelligence and counter-intelligence capabilities. • Joint Support provides generic supplies and services to various components of the Department. • Command and Control provides and maintains an operational command and control capability
for the deployment of combat forces, and maintains a Special Forces capability. • Special Defence Account provides for the acquisition of defence equipment, including in the
strategic arms procurement programme.
Strategic overview and key policy developments: 1998/99 – 2004/05
Over the past year the SANDF provided a diverse range of services to South Africa and other African nations, including: operations to combat crime in cooperation with the South African Police Service (SAPS); patrolling the country’s borders and rural areas; providing aid to other government departments (especially the departments of Health and Agriculture); and fulfilling international obligations during peace support operations in the Democratic Republic of the Congo (DRC), Burundi, and the Horn of Africa.
2002 Estimates of National Expenditure
466
The Defence Review, which followed the 1996 White Paper on National Defence, developed a Force Design for the SANDF. The review, and the resulting structures of the Department, are being revisited in the light of projected medium-term resource constraints. A new Force Design and Force Structure will be presented early in 2002, and, if approved, will be implemented in 2004.
It is envisaged that the Department’s rightsizing process will continue beyond 2004/05. Although it is possible that some units may have to be closed, personnel will, as far as possible, be redeployed to other units. The SANDF has developed the training capacity to re-skill personnel who may be transferred to other government departments or who may become redundant. In the meantime, the Department has reprioritised activities, taking into account the maintenance of personnel, defence capabilities and capacities, operational readiness, preparation for defence contingencies, the execution of operational tasks, commitments, and contractual obligations.
After a decade of declining investment in South Africa’s defence capability, and in the light of the 1996 Defence Review, Government has embarked on a 12-year strategic arms procurement programme. It includes the purchase of 4 naval corvettes, 3 submarines, 30 light utility helicopters, 24 trainer aircraft and 28 fighter aircraft, at a total cost in 1999 prices of US$4,8 billion (R30,3 billion). The Defence Vote includes the full costs of these purchases, including provision for inflation-related price escalation and projected exchange rate movements. Currently, total cash outlays are projected to amount to R52,7 billion, with annual payments reaching a peak of R7,7 billion in 2005/06. Projected annual commitments are summarised below:
2000/01 2001/02 2002/03 2003/04 2004/05 2005/06 R million 2 639 4 047 6 331 7 199 7 194 7 704 2006/07 2007/08 2008/09 2009/10 2010/11 2011/12 Total R million 5 960 4 491 3 502 1 314 1 182 1 160 52 723
The National Treasury has taken up loan facilities associated with the foreign supplies in the procurement programme, as these were available on favourable terms guaranteed by foreign export credit agencies. The costs of these loans are included in the provision for state debt costs.
The passing of the Defence Bill, already introduced in Parliament, will greatly alleviate problems arising from the misalignment of the present Act, drafted in 1957, with the Constitution.
Vote 21: Defence
467
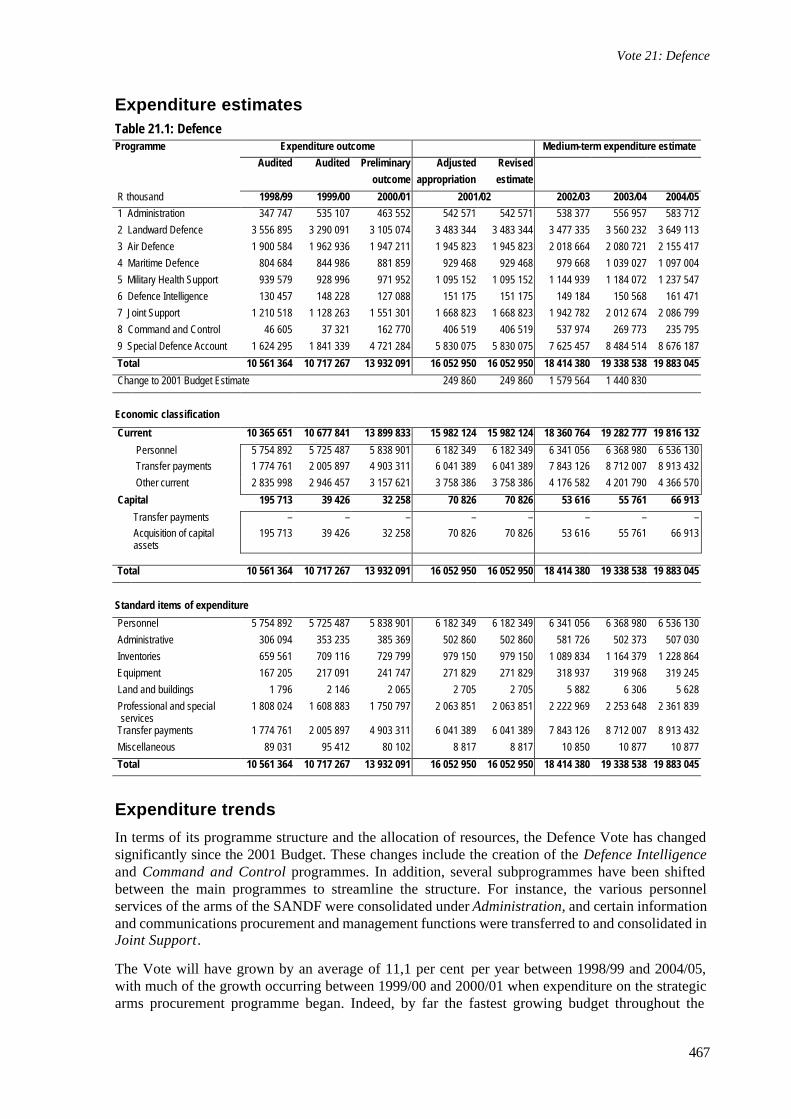
Expenditure estimates Table 21.1: Defence Programme Expenditure outcome Medium-term expenditure estimate
Audited Audited Preliminary Adjusted Revised
outcome appropriation estimate
R thousand 1998/99 1999/00 2000/01 2001/02 2002/03 2003/04 2004/05
1 Administration 347 747 535 107 463 552 542 571 542 571 538 377 556 957 583 712
2 Landward Defence 3 556 895 3 290 091 3 105 074 3 483 344 3 483 344 3 477 335 3 560 232 3 649 113
3 Air Defence 1 900 584 1 962 936 1 947 211 1 945 823 1 945 823 2 018 664 2 080 721 2 155 417
4 Maritime Defence 804 684 844 986 881 859 929 468 929 468 979 668 1 039 027 1 097 004
5 Military Health Support 939 579 928 996 971 952 1 095 152 1 095 152 1 144 939 1 184 072 1 237 547
6 Defence Intelligence 130 457 148 228 127 088 151 175 151 175 149 184 150 568 161 471
7 Joint Support 1 210 518 1 128 263 1 551 301 1 668 823 1 668 823 1 942 782 2 012 674 2 086 799
8 Command and Control 46 605 37 321 162 770 406 519 406 519 537 974 269 773 235 795
9 Special Defence Account 1 624 295 1 841 339 4 721 284 5 830 075 5 830 075 7 625 457 8 484 514 8 676 187
Total 10 561 364 10 717 267 13 932 091 16 052 950 16 052 950 18 414 380 19 338 538 19 883 045
Change to 2001 Budget Estimate 249 860 249 860 1 579 564 1 440 830
Economic classification
Current 10 365 651 10 677 841 13 899 833 15 982 124 15 982 124 18 360 764 19 282 777 19 816 132
Personnel 5 754 892 5 725 487 5 838 901 6 182 349 6 182 349 6 341 056 6 368 980 6 536 130 Transfer payments 1 774 761 2 005 897 4 903 311 6 041 389 6 041 389 7 843 126 8 712 007 8 913 432
Other current 2 835 998 2 946 457 3 157 621 3 758 386 3 758 386 4 176 582 4 201 790 4 366 570
Capital 195 713 39 426 32 258 70 826 70 826 53 616 55 761 66 913
Transfer payments – – – – – – – – Acquisition of capital assets
195 713 39 426 32 258 70 826 70 826 53 616 55 761 66 913
Total 10 561 364 10 717 267 13 932 091 16 052 950 16 052 950 18 414 380 19 338 538 19 883 045
Standard items of expenditure
Personnel 5 754 892 5 725 487 5 838 901 6 182 349 6 182 349 6 341 056 6 368 980 6 536 130
Administrative 306 094 353 235 385 369 502 860 502 860 581 726 502 373 507 030
Inventories 659 561 709 116 729 799 979 150 979 150 1 089 834 1 164 379 1 228 864
Equipment 167 205 217 091 241 747 271 829 271 829 318 937 319 968 319 245
Land and buildings 1 796 2 146 2 065 2 705 2 705 5 882 6 306 5 628
Professional and special services
1 808 024 1 608 883 1 750 797 2 063 851 2 063 851 2 222 969 2 253 648 2 361 839
Transfer payments 1 774 761 2 005 897 4 903 311 6 041 389 6 041 389 7 843 126 8 712 007 8 913 432
Miscellaneous 89 031 95 412 80 102 8 817 8 817 10 850 10 877 10 877
Total 10 561 364 10 717 267 13 932 091 16 052 950 16 052 950 18 414 380 19 338 538 19 883 045
Expenditure trends
In terms of its programme structure and the allocation of resources, the Defence Vote has changed significantly since the 2001 Budget. These changes include the creation of the Defence Intelligence and Command and Control programmes. In addition, several subprogrammes have been shifted between the main programmes to streamline the structure. For instance, the various personnel services of the arms of the SANDF were consolidated under Administration, and certain information and communications procurement and management functions were transferred to and consolidated in Joint Support.
The Vote will have grown by an average of 11,1 per cent per year between 1998/99 and 2004/05, with much of the growth occurring between 1999/00 and 2000/01 when expenditure on the strategic arms procurement programme began. Indeed, by far the fastest growing budget throughout the
2002 Estimates of National Expenditure
468
period is the Special Defence Account. Annual growth for Landward Defence, Air Defence and Maritime Defence is projected to average 1,6 per cent a year.
The considerable growth of Command and Control off a low base reflects the establishment of the Regional Joint Task Force headquarters, with consolidated expenditure previously incurred by each of the different arms of the SANDF. In addition, Special Operations was shifted from Landward Defence.
The Vote is dominated by spending on personnel and the acquisition of equipment. The former is projected to consume an average of 33,4 per cent of the Vote over the next three years, while current transfer payments, which include the strategic arms procurement programme administered by Armscor, are projected to consume 44,2 per cent of the Vote over the medium term.
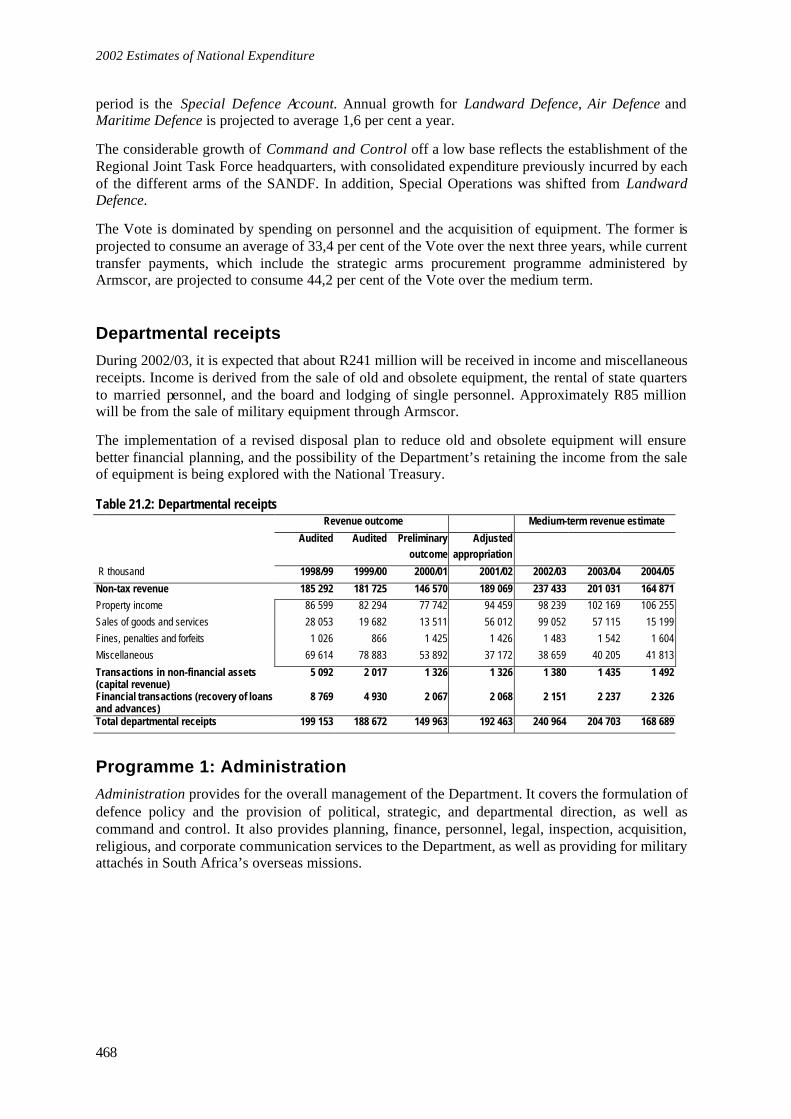
Departmental receipts
During 2002/03, it is expected that about R241 million will be received in income and miscellaneous receipts. Income is derived from the sale of old and obsolete equipment, the rental of state quarters to married personnel, and the board and lodging of single personnel. Approximately R85 million will be from the sale of military equipment through Armscor.
The implementation of a revised disposal plan to reduce old and obsolete equipment will ensure better financial planning, and the possibility of the Department’s retaining the income from the sale of equipment is being explored with the National Treasury.
Table 21.2: Departmental receipts Revenue outcome Medium-term revenue estimate
Audited Audited Preliminary Adjusted outcome appropriation
R thousand 1998/99 1999/00 2000/01 2001/02 2002/03 2003/04 2004/05
Non-tax revenue 185 292 181 725 146 570 189 069 237 433 201 031 164 871
Property income 86 599 82 294 77 742 94 459 98 239 102 169 106 255
Sales of goods and services 28 053 19 682 13 511 56 012 99 052 57 115 15 199
Fines, penalties and forfeits 1 026 866 1 425 1 426 1 483 1 542 1 604
Miscellaneous 69 614 78 883 53 892 37 172 38 659 40 205 41 813
Transactions in non-financial assets (capital revenue)
5 092 2 017 1 326 1 326 1 380 1 435 1 492
Financial transactions (recovery of loans and advances)
8 769 4 930 2 067 2 068 2 151 2 237 2 326
Total departmental receipts 199 153 188 672 149 963 192 463 240 964 204 703 168 689
Programme 1: Administration
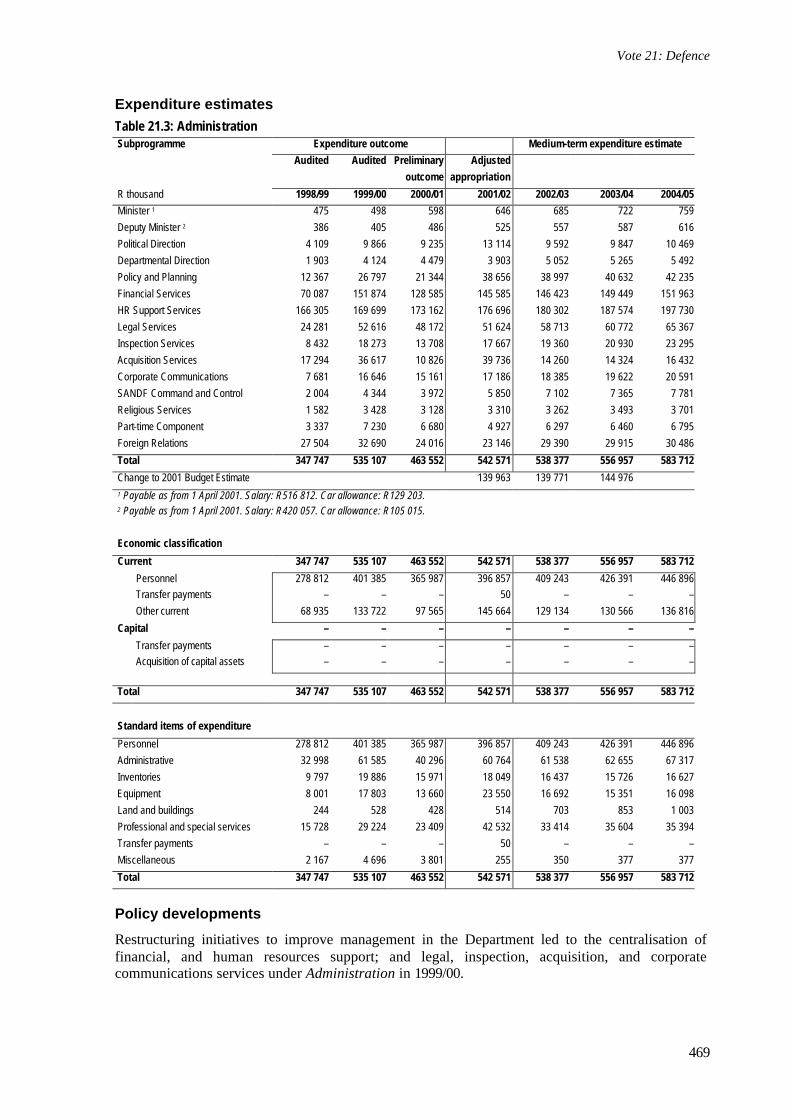
Administration provides for the overall management of the Department. It covers the formulation of defence policy and the provision of political, strategic, and departmental direction, as well as command and control. It also provides planning, finance, personnel, legal, inspection, acquisition, religious, and corporate communication services to the Department, as well as providing for military attachés in South Africa’s overseas missions.
Vote 21: Defence
469
Expenditure estimates Table 21.3: Administration Subprogramme Expenditure outcome Medium-term expenditure estimate
Audited Audited Preliminary Adjusted
outcome appropriation
R thousand 1998/99 1999/00 2000/01 2001/02 2002/03 2003/04 2004/05
Minister 1 475 498 598 646 685 722 759
Deputy Minister 2 386 405 486 525 557 587 616
Political Direction 4 109 9 866 9 235 13 114 9 592 9 847 10 469
Departmental Direction 1 903 4 124 4 479 3 903 5 052 5 265 5 492
Policy and Planning 12 367 26 797 21 344 38 656 38 997 40 632 42 235
Financial Services 70 087 151 874 128 585 145 585 146 423 149 449 151 963
HR Support Services 166 305 169 699 173 162 176 696 180 302 187 574 197 730
Legal Services 24 281 52 616 48 172 51 624 58 713 60 772 65 367
Inspection Services 8 432 18 273 13 708 17 667 19 360 20 930 23 295
Acquisition Services 17 294 36 617 10 826 39 736 14 260 14 324 16 432
Corporate Communications 7 681 16 646 15 161 17 186 18 385 19 622 20 591
SANDF Command and Control 2 004 4 344 3 972 5 850 7 102 7 365 7 781
Religious Services 1 582 3 428 3 128 3 310 3 262 3 493 3 701
Part-time Component 3 337 7 230 6 680 4 927 6 297 6 460 6 795
Foreign Relations 27 504 32 690 24 016 23 146 29 390 29 915 30 486
Total 347 747 535 107 463 552 542 571 538 377 556 957 583 712
Change to 2001 Budget Estimate 139 963 139 771 144 976
1 Payable as from 1 April 2001. Salary: R516 812. Car allowance: R129 203. 2 Payable as from 1 April 2001. Salary: R420 057. Car allowance: R105 015.
Economic classification
Current 347 747 535 107 463 552 542 571 538 377 556 957 583 712
Personnel 278 812 401 385 365 987 396 857 409 243 426 391 446 896 Transfer payments – – – 50 – – –
Other current 68 935 133 722 97 565 145 664 129 134 130 566 136 816
Capital – – – – – – –
Transfer payments – – – – – – – Acquisition of capital assets – – – – – – –
Total 347 747 535 107 463 552 542 571 538 377 556 957 583 712
Standard items of expenditure
Personnel 278 812 401 385 365 987 396 857 409 243 426 391 446 896
Administrative 32 998 61 585 40 296 60 764 61 538 62 655 67 317
Inventories 9 797 19 886 15 971 18 049 16 437 15 726 16 627
Equipment 8 001 17 803 13 660 23 550 16 692 15 351 16 098
Land and buildings 244 528 428 514 703 853 1 003
Professional and special services 15 728 29 224 23 409 42 532 33 414 35 604 35 394
Transfer payments – – – 50 – – –
Miscellaneous 2 167 4 696 3 801 255 350 377 377
Total 347 747 535 107 463 552 542 571 538 377 556 957 583 712
Policy developments
Restructuring initiatives to improve management in the Department led to the centralisation of financial, and human resources support; and legal, inspection, acquisition, and corporate communications services under Administration in 1999/00.
2002 Estimates of National Expenditure
470
The departmental planning process has been streamlined, and refocused on outputs rather than inputs, to meet government requirements. From 2002, the Chief of the SANDF’s Force Preparedness Schedule and Short-Term Force Employment Plan (STFEP) will specify the nature and levels of preparedness required of SANDF forces.
Expenditure trends
Spending on Administration increases by an annual average of 2,5 per cent from 2001/02 to 2004/05, compared to 16,0 per cent between 1998/99 and 2001/02. Slower growth is projected over the medium term as the benefits of restructuring are realised.
Much of the growth in the programme’s budget is explained by the consolidation of previously fragmented functions, and by the need to provide for the additional tasks of the Chief of the SANDF. In addition, new policies on promotions for legal practitioners – required to attract and retain skills – have necessitated some increased expenditure.
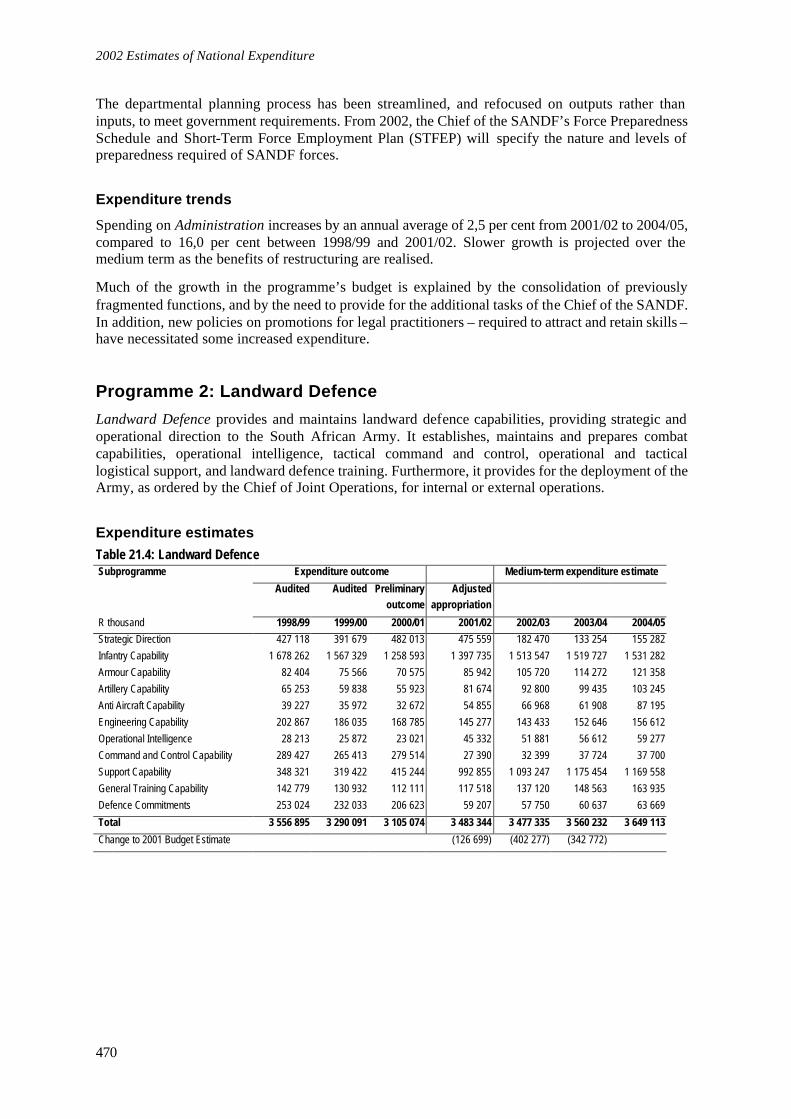
Programme 2: Landward Defence
Landward Defence provides and maintains landward defence capabilities, providing strategic and operational direction to the South African Army. It establishes, maintains and prepares combat capabilities, operational intelligence, tactical command and control, operational and tactical logistical support, and landward defence training. Furthermore, it provides for the deployment of the Army, as ordered by the Chief of Joint Operations, for internal or external operations.
Expenditure estimates Table 21.4: Landward Defence Subprogramme Expenditure outcome Medium-term expenditure estimate
Audited Audited Preliminary Adjusted outcome appropriation
R thousand 1998/99 1999/00 2000/01 2001/02 2002/03 2003/04 2004/05
Strategic Direction 427 118 391 679 482 013 475 559 182 470 133 254 155 282
Infantry Capability 1 678 262 1 567 329 1 258 593 1 397 735 1 513 547 1 519 727 1 531 282
Armour Capability 82 404 75 566 70 575 85 942 105 720 114 272 121 358
Artillery Capability 65 253 59 838 55 923 81 674 92 800 99 435 103 245
Anti Aircraft Capability 39 227 35 972 32 672 54 855 66 968 61 908 87 195
Engineering Capability 202 867 186 035 168 785 145 277 143 433 152 646 156 612
Operational Intelligence 28 213 25 872 23 021 45 332 51 881 56 612 59 277
Command and Control Capability 289 427 265 413 279 514 27 390 32 399 37 724 37 700
Support Capability 348 321 319 422 415 244 992 855 1 093 247 1 175 454 1 169 558
General Training Capability 142 779 130 932 112 111 117 518 137 120 148 563 163 935
Defence Commitments 253 024 232 033 206 623 59 207 57 750 60 637 63 669
Total 3 556 895 3 290 091 3 105 074 3 483 344 3 477 335 3 560 232 3 649 113
Change to 2001 Budget Estimate (126 699) (402 277) (342 772)
Vote 21: Defence
471
Expenditure outcome Medium-term expenditure estimate
Audited Audited Preliminary Adjusted outcome appropriation
R thousand 1998/99 1999/00 2000/01 2001/02 2002/03 2003/04 2004/05
Economic classification
Current 3 556 895 3 290 091 3 105 074 3 483 344 3 477 335 3 560 232 3 649 113
Personnel 2 886 205 2 657 686 2 454 882 2 483 999 2 398 533 2 361 042 2 349 982 Transfer payments – – – – – – –
Other current 670 690 632 405 650 192 999 345 1 078 802 1 199 190 1 299 131
Capital – – – – – – –
Transfer payments – – – – – – –
Acquisition of capital assets – – – – – – –
Total 3 556 895 3 290 091 3 105 074 3 483 344 3 477 335 3 560 232 3 649 113
Standard items of expenditure
Personnel 2 886 205 2 657 686 2 454 882 2 483 999 2 398 533 2 361 042 2 349 982
Administrative 104 957 83 027 118 981 125 834 113 961 127 548 143 202
Inventories 258 718 247 780 260 791 370 070 449 482 516 495 548 608
Equipment 17 065 17 363 21 273 91 751 63 390 71 676 60 773
Land and buildings 5 4 4 148 71 80 117
Professional and special services 253 834 252 037 218 035 411 533 451 898 483 391 546 431
Transfer payments – – – – – – –
Miscellaneous 36 111 32 194 31 108 9 – – –
Total 3 556 895 3 290 091 3 105 074 3 483 344 3 477 335 3 560 232 3 649 113
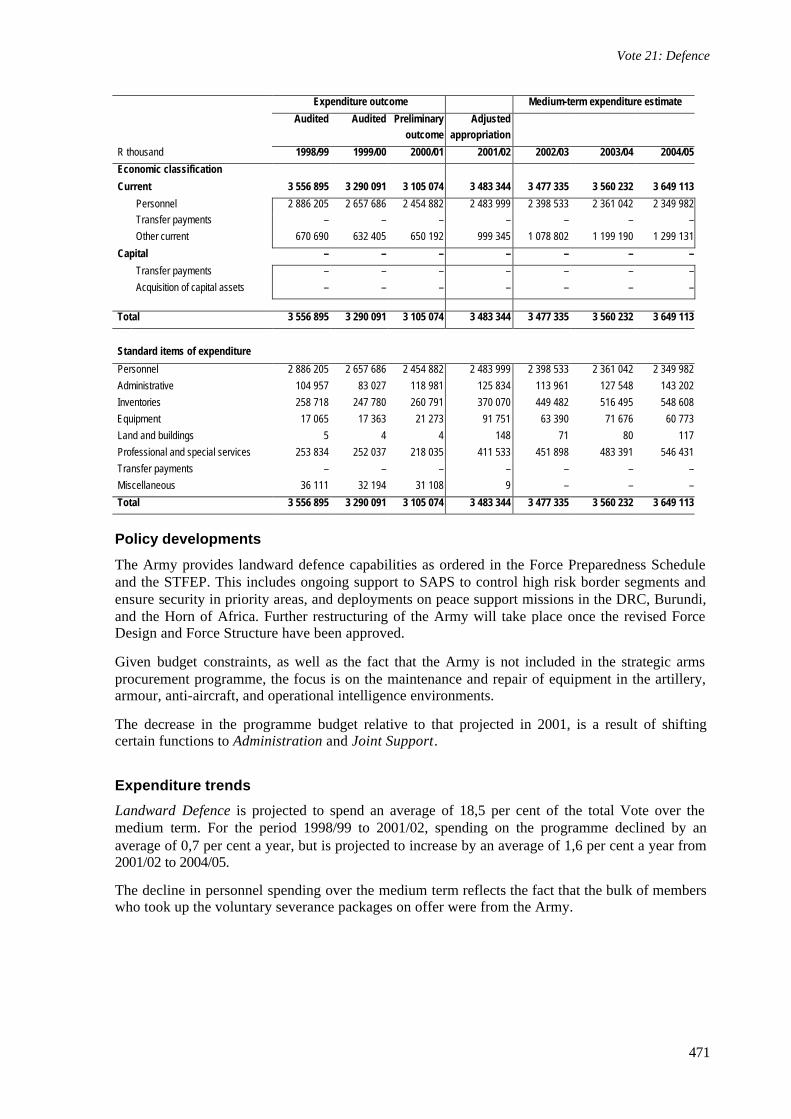
Policy developments
The Army provides landward defence capabilities as ordered in the Force Preparedness Schedule and the STFEP. This includes ongoing support to SAPS to control high risk border segments and ensure security in priority areas, and deployments on peace support missions in the DRC, Burundi, and the Horn of Africa. Further restructuring of the Army will take place once the revised Force Design and Force Structure have been approved.
Given budget constraints, as well as the fact that the Army is not included in the strategic arms procurement programme, the focus is on the maintenance and repair of equipment in the artillery, armour, anti-aircraft, and operational intelligence environments.
The decrease in the programme budget relative to that projected in 2001, is a result of shifting certain functions to Administration and Joint Support.
Expenditure trends
Landward Defence is projected to spend an average of 18,5 per cent of the total Vote over the medium term. For the period 1998/99 to 2001/02, spending on the programme declined by an average of 0,7 per cent a year, but is projected to increase by an average of 1,6 per cent a year from 2001/02 to 2004/05.
The decline in personnel spending over the medium term reflects the fact that the bulk of members who took up the voluntary severance packages on offer were from the Army.
2002 Estimates of National Expenditure
472
Key outputs, indicators and targets
Landward Defence Subprogramme Output Output measure/ indicator Target Infantry Capability Infantry capabilities and commitments 44 infantry battalions
183 Army Territorial Reserve commandos Armour Capability Armour capabilities and commitments 8 armoured regiments Artillery Capability Artillery capabilities and commitments 8 artillery regiments Anti-Aircraft Capability Anti-aircraft capabilities and commitments 5 air defence artillery regiments Engineering Capability Engineering capabilities and commitments 6 engineer regiments Command and Control Capability
Tactical command and control capabilities and commitments
2 brigade headquarters and 20 group headquarters
Operational Intelligence Operational intelligence capabilities and commitments
1 operational intelligence regiment
Support Capability Second line support and ceremonial capabilities and commitments
13 general support bases 2 (second line support) maintenance units 2 (second line support) workshops 1 ceremonial guard battalion 4 military bands Support and ceremonial services as per service agreements with clients
Maintain landward defence capabilities to respond to contingencies as they arise Deployment for border control and support to SAPS at a rate specified in the STFEP, including 19 full-time force companies and 23 Reserve Force platoons
Defence Commitments Landward defence capabilities for defence commitments
Landward defence commitments (internal and external) as specified in the STFEP
To provide the services required in terms of commitments
The Army has maintained a deployment of 19 full time Force Companies and 23 Reserve Force platoons in support of SAPS and for border control.
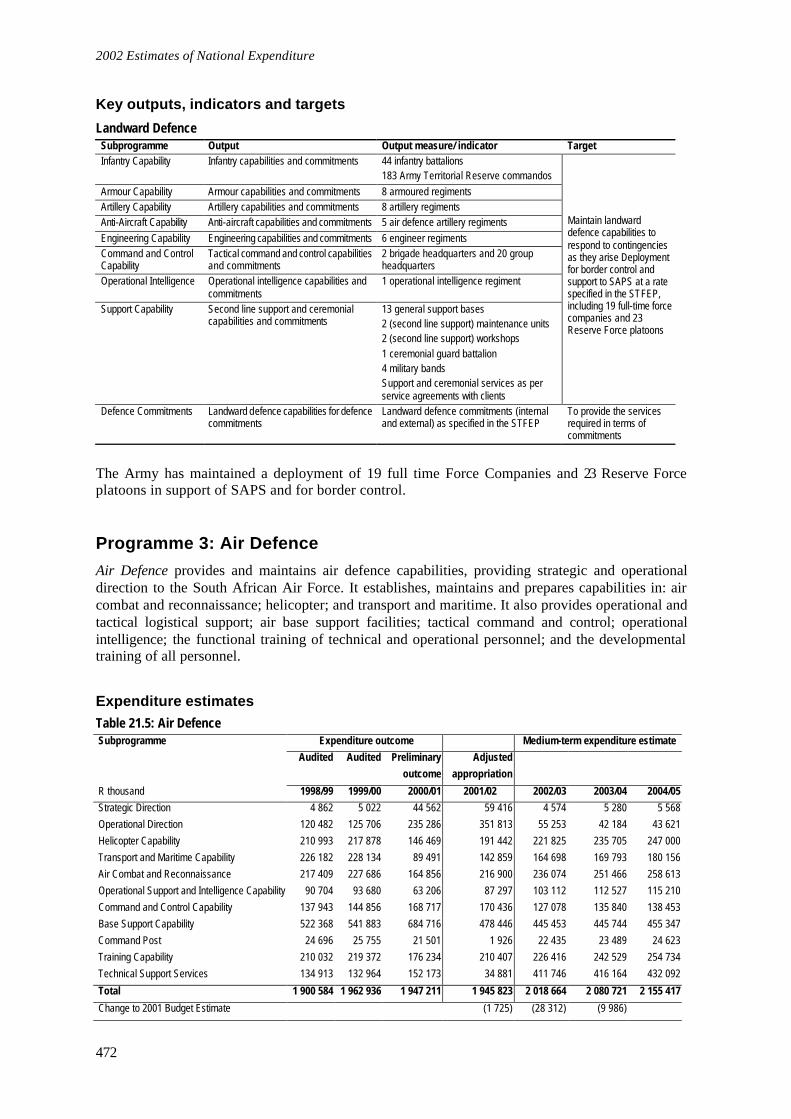
Programme 3: Air Defence
Air Defence provides and maintains air defence capabilities, providing strategic and operational direction to the South African Air Force. It establishes, maintains and prepares capabilities in: air combat and reconnaissance; helicopter; and transport and maritime. It also provides operational and tactical logistical support; air base support facilities; tactical command and control; operational intelligence; the functional training of technical and operational personnel; and the developmental training of all personnel.
Expenditure estimates Table 21.5: Air Defence Subprogramme Expenditure outcome Medium-term expenditure estimate
Audited Audited Preliminary Adjusted
outcome appropriation
R thousand 1998/99 1999/00 2000/01 2001/02 2002/03 2003/04 2004/05
Strategic Direction 4 862 5 022 44 562 59 416 4 574 5 280 5 568
Operational Direction 120 482 125 706 235 286 351 813 55 253 42 184 43 621
Helicopter Capability 210 993 217 878 146 469 191 442 221 825 235 705 247 000
Transport and Maritime Capability 226 182 228 134 89 491 142 859 164 698 169 793 180 156
Air Combat and Reconnaissance 217 409 227 686 164 856 216 900 236 074 251 466 258 613
Operational Support and Intelligence Capability 90 704 93 680 63 206 87 297 103 112 112 527 115 210
Command and Control Capability 137 943 144 856 168 717 170 436 127 078 135 840 138 453
Base Support Capability 522 368 541 883 684 716 478 446 445 453 445 744 455 347
Command Post 24 696 25 755 21 501 1 926 22 435 23 489 24 623
Training Capability 210 032 219 372 176 234 210 407 226 416 242 529 254 734
Technical Support Services 134 913 132 964 152 173 34 881 411 746 416 164 432 092
Total 1 900 584 1 962 936 1 947 211 1 945 823 2 018 664 2 080 721 2 155 417
Change to 2001 Budget Estimate (1 725) (28 312) (9 986)
Vote 21: Defence
473
Expenditure outcome Medium-term expenditure estimate
Audited Audited Preliminary Adjusted outcome appropriation
R thousand 1998/99 1999/00 2000/01 2001/02 2002/03 2003/04 2004/05
Economic classification
Current 1 900 584 1 962 936 1 947 211 1 945 823 2 018 664 2 080 721 2 155 417
Personnel 876 479 910 571 899 279 918 540 965 490 963 373 993 059 Transfer payments – – – – – – –
Other current 1 024 105 1 052 365 1 047 932 1 027 283 1 053 174 1 117 348 1 162 358
Capital – – – – – – –
Transfer payments – – – – – – –
Acquisition of capital assets – – – – – – –
Total 1 900 584 1 962 936 1 947 211 1 945 823 2 018 664 2 080 721 2 155 417
Standard items of expenditure
Personnel 876 479 910 571 899 279 918 540 965 490 963 373 993 059
Administrative 52 273 86 070 81 476 80 298 75 941 76 515 78 637
Inventories 152 441 203 750 192 874 167 937 220 735 220 428 230 656
Equipment 52 022 64 057 62 380 46 607 54 806 60 539 61 755
Land and buildings 10 11 10 – – – –
Professional and special services 751 363 687 121 700 442 732 424 701 692 759 866 791 310
Transfer payments – – – – – – –
Miscellaneous 15 996 11 356 10 750 17 – – –
Total 1 900 584 1 962 936 1 947 211 1 945 823 2 018 664 2 080 721 2 155 417
Policy developments
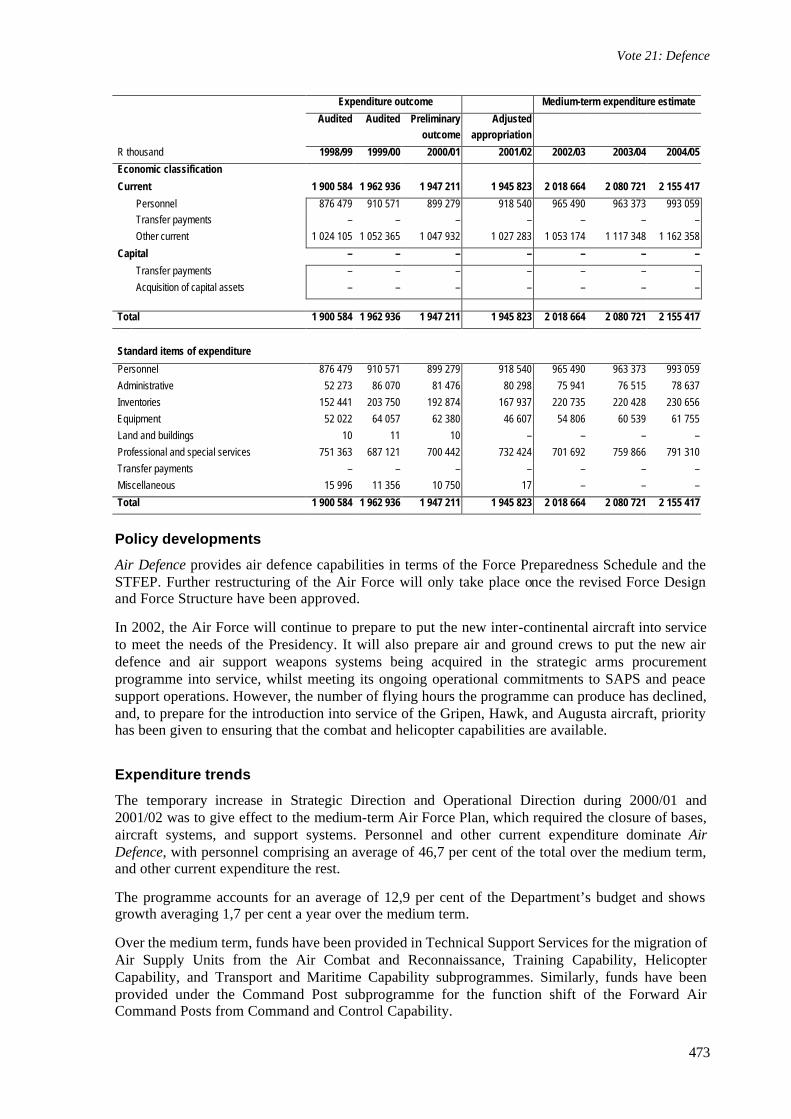
Air Defence provides air defence capabilities in terms of the Force Preparedness Schedule and the STFEP. Further restructuring of the Air Force will only take place once the revised Force Design and Force Structure have been approved.
In 2002, the Air Force will continue to prepare to put the new inter-continental aircraft into service to meet the needs of the Presidency. It will also prepare air and ground crews to put the new air defence and air support weapons systems being acquired in the strategic arms procurement programme into service, whilst meeting its ongoing operational commitments to SAPS and peace support operations. However, the number of flying hours the programme can produce has declined, and, to prepare for the introduction into service of the Gripen, Hawk, and Augusta aircraft, priority has been given to ensuring that the combat and helicopter capabilities are available.
Expenditure trends
The temporary increase in Strategic Direction and Operational Direction during 2000/01 and 2001/02 was to give effect to the medium-term Air Force Plan, which required the closure of bases, aircraft systems, and support systems. Personnel and other current expenditure dominate Air Defence, with personnel comprising an average of 46,7 per cent of the total over the medium term, and other current expenditure the rest.
The programme accounts for an average of 12,9 per cent of the Department’s budget and shows growth averaging 1,7 per cent a year over the medium term.
Over the medium term, funds have been provided in Technical Support Services for the migration of Air Supply Units from the Air Combat and Reconnaissance, Training Capability, Helicopter Capability, and Transport and Maritime Capability subprogrammes. Similarly, funds have been provided under the Command Post subprogramme for the function shift of the Forward Air Command Posts from Command and Control Capability.
2002 Estimates of National Expenditure
474
Key outputs, indicators and targets
Air Defence Subprogramme Output Output measure/ indicator Target Helicopter Capability
Helicopter capabilities for commitments
6 helicopter squadrons Helicopter commitments (internal and external)
44 aircraft producing 5 560 force preparation hours and 5 264 force employment hours
Transport and Maritime Capability
Transport and maritime capabilities for commitments
3 transport squadrons 1 maritime squadron 1 VIP squadron
27 aircraft producing 8 224 force preparation hours and 6 568 force employment hours
Air Combat and Reconnaissance
Air combat and reconnaissance capabilities for commitments
1 combat squadron and 1 combat training squadron 1 Electronic Warfare and In-Flight Refuelling squadron Air combat and reconnaissance commitments
Cheetah: 13 aircraft and 1 800 flying hours Impala: 14 aircraft and 2 500 flying hours
Operational Support and Intelligence Capability
Operational support and intelligence capabilities for commitments
Operational intelligence as required Counter-intelligence as required
Tactical image exploration centre Mission-ready security squadrons Tactical security squadron
Command and Control Capability
Command and control capabilities for commitments
6 fully staffed Forward Air Command Posts 4 fully staffed Air Operational Teams
Mission and air traffic controllers Maintain continuous capacity for interception for 30 days Continuous support to bases Continuous availability of in-flight and ground systems
Base Support Capability
Base support required for commitments
7 bases 3 Air Force stations
24-hour fire and rescue service Support as per service agreements
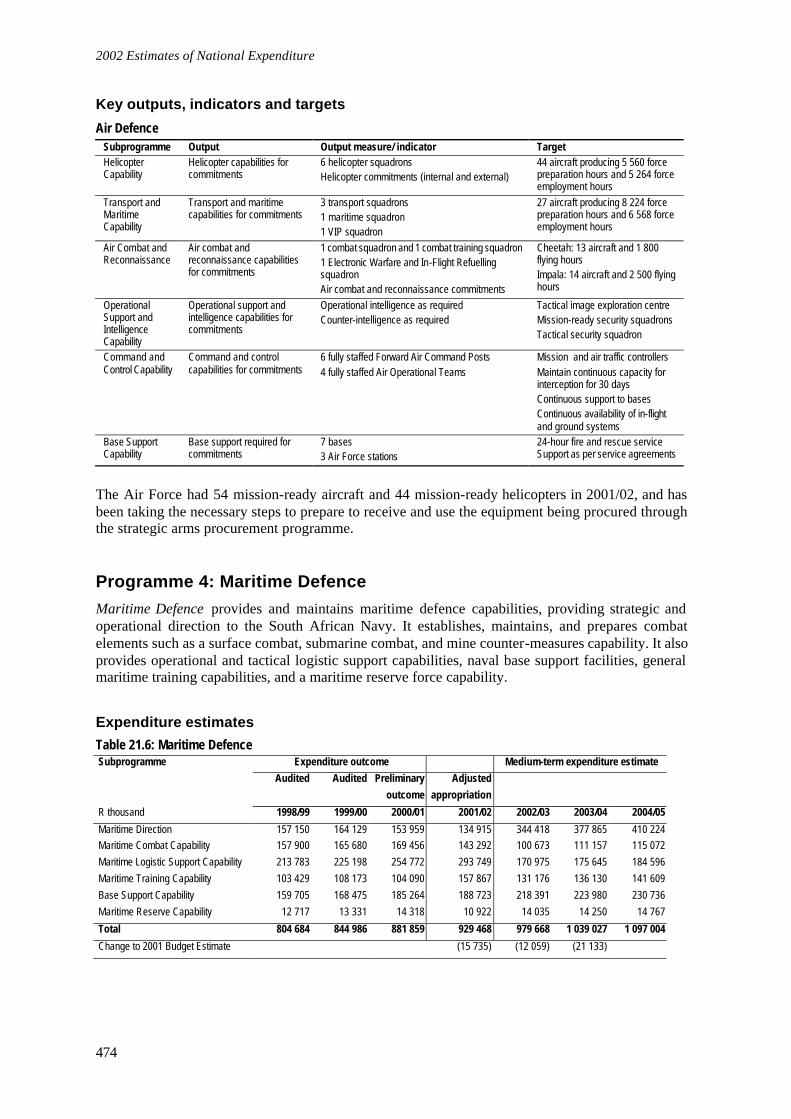
The Air Force had 54 mission-ready aircraft and 44 mission-ready helicopters in 2001/02, and has been taking the necessary steps to prepare to receive and use the equipment being procured through the strategic arms procurement programme.
Programme 4: Maritime Defence
Maritime Defence provides and maintains maritime defence capabilities, providing strategic and operational direction to the South African Navy. It establishes, maintains, and prepares combat elements such as a surface combat, submarine combat, and mine counter-measures capability. It also provides operational and tactical logistic support capabilities, naval base support facilities, general maritime training capabilities, and a maritime reserve force capability.
Expenditure estimates
Table 21.6: Maritime Defence Subprogramme Expenditure outcome Medium-term expenditure estimate
Audited Audited Preliminary Adjusted
outcome appropriation
R thousand 1998/99 1999/00 2000/01 2001/02 2002/03 2003/04 2004/05
Maritime Direction 157 150 164 129 153 959 134 915 344 418 377 865 410 224 Maritime Combat Capability 157 900 165 680 169 456 143 292 100 673 111 157 115 072
Maritime Logistic Support Capability 213 783 225 198 254 772 293 749 170 975 175 645 184 596
Maritime Training Capability 103 429 108 173 104 090 157 867 131 176 136 130 141 609
Base Support Capability 159 705 168 475 185 264 188 723 218 391 223 980 230 736
Maritime Reserve Capability 12 717 13 331 14 318 10 922 14 035 14 250 14 767
Total 804 684 844 986 881 859 929 468 979 668 1 039 027 1 097 004
Change to 2001 Budget Estimate (15 735) (12 059) (21 133)
Vote 21: Defence
475
Expenditure outcome Medium-term expenditure estimate
Audited Audited Preliminary Adjusted outcome appropriation
R thousand 1998/99 1999/00 2000/01 2001/02 2002/03 2003/04 2004/05
Economic classification
Current 804 684 844 986 881 859 929 468 979 668 1 039 027 1 097 004
Personnel 592 669 622 352 648 936 651 633 630 201 652 392 683 267 Transfer payments – – – – – – –
Other current 212 015 222 634 232 923 277 835 349 467 386 635 413 737
Capital – – – – – – –
Transfer payments – – – – – – –
Acquisition of capital assets – – – – – – –
Total 804 684 844 986 881 859 929 468 979 668 1 039 027 1 097 004
Standard items of expenditure
Personnel 592 669 622 352 648 936 651 633 630 201 652 392 683 267
Administrative 27 700 29 088 30 432 34 175 42 084 42 219 42 201
Inventories 58 420 61 346 64 181 82 046 105 203 135 131 162 270
Equipment 19 038 23 125 24 194 44 631 48 407 53 647 53 595
Land and buildings – – – – – – –
Professional and special services 97 991 101 330 106 013 116 983 153 773 155 638 155 671
Transfer payments – – – – – – –
Miscellaneous 8 866 7 745 8 103 – – – –
Total 804 684 844 986 881 859 929 468 979 668 1 039 027 1 097 004
Policy developments
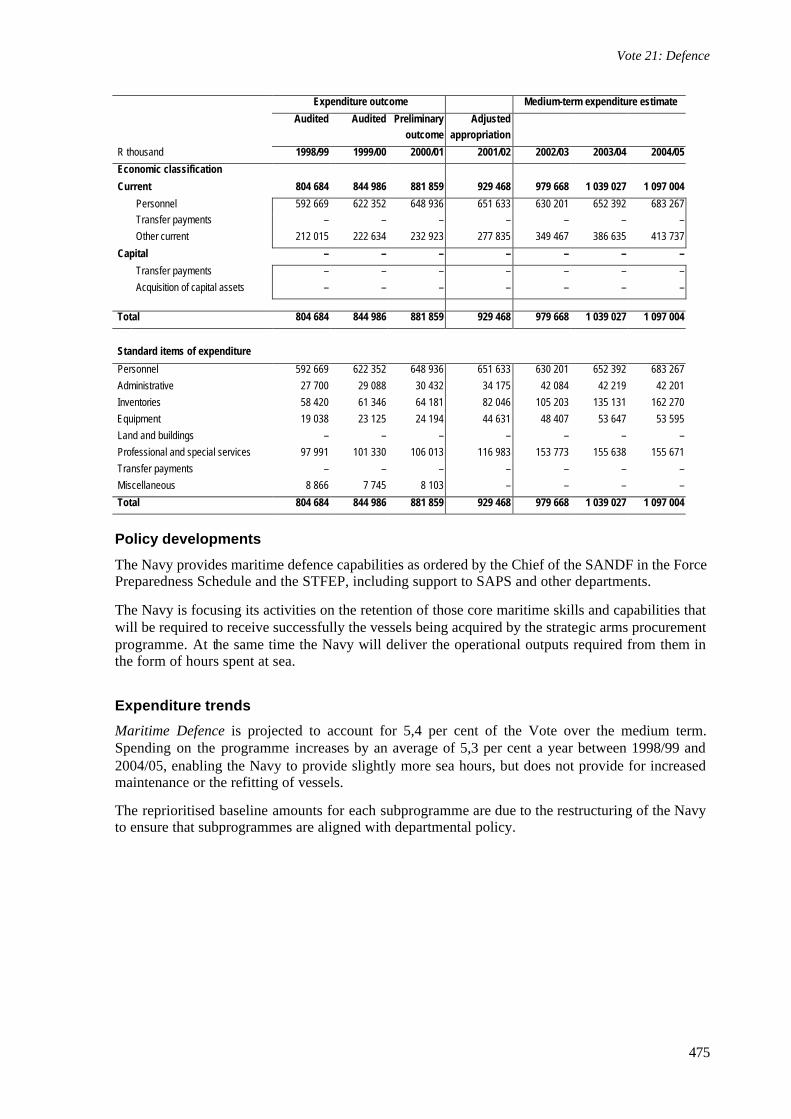
The Navy provides maritime defence capabilities as ordered by the Chief of the SANDF in the Force Preparedness Schedule and the STFEP, including support to SAPS and other departments.
The Navy is focusing its activities on the retention of those core maritime skills and capabilities that will be required to receive successfully the vessels being acquired by the strategic arms procurement programme. At the same time the Navy will deliver the operational outputs required from them in the form of hours spent at sea.
Expenditure trends
Maritime Defence is projected to account for 5,4 per cent of the Vote over the medium term. Spending on the programme increases by an average of 5,3 per cent a year between 1998/99 and 2004/05, enabling the Navy to provide slightly more sea hours, but does not provide for increased maintenance or the refitting of vessels.
The reprioritised baseline amounts for each subprogramme are due to the restructuring of the Navy to ensure that subprogrammes are aligned with departmental policy.
2002 Estimates of National Expenditure
476
Key outputs, indicators and targets
Maritime Defence Subprogramme Output Output measure/indicator Target Subprogrammes combine to deliver common outputs
Maritime defence capabilities and commitments Maritime defence commitments (internal and external) as specified in the STFEP
4 strike craft 2 submarines 2 combat support ships 2 minesweepers 2 mine-hunters 1 diving support ship 1 hydrographic survey ship 12 harbour patrol boats 3 inshore patrol boats 1 operational diving team 7 Reserve Force units
To maintain maritime defence capabilities and provide services in terms of commitments ordered by the Chief of the SANDF, including: – 18 972 force preparation hours – 15 635 force employment hours
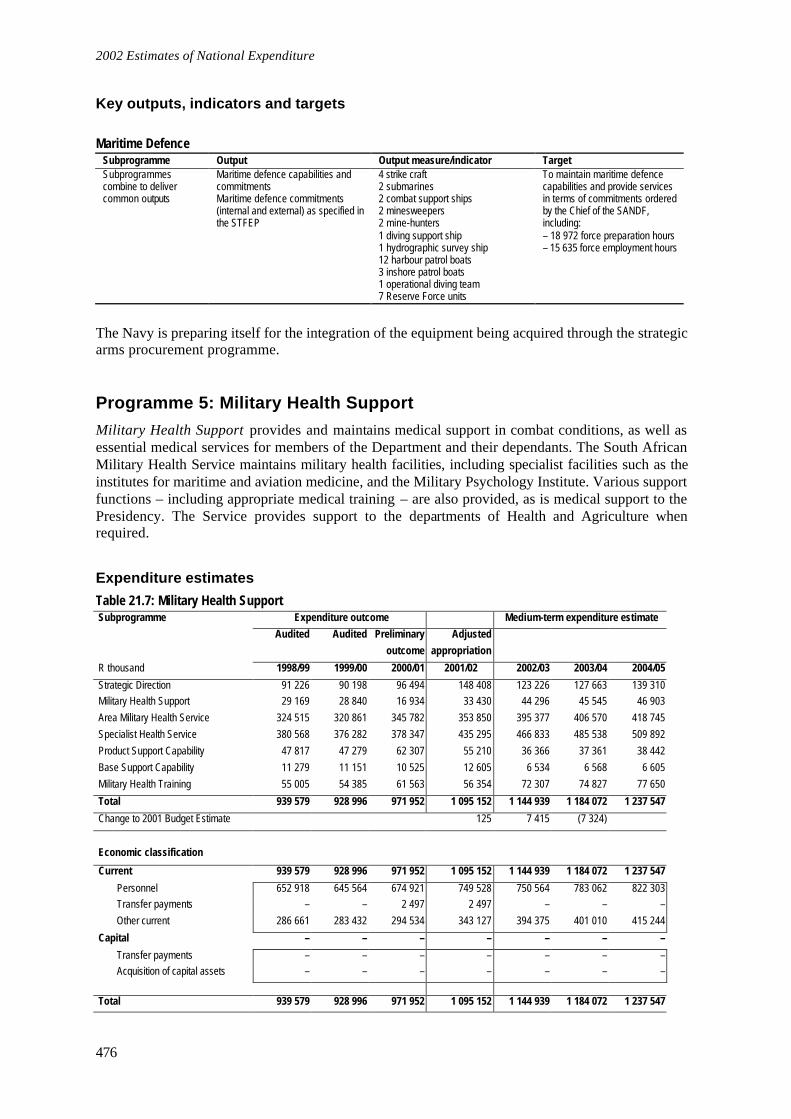
The Navy is preparing itself for the integration of the equipment being acquired through the strategic arms procurement programme.
Programme 5: Military Health Support
Military Health Support provides and maintains medical support in combat conditions, as well as essential medical services for members of the Department and their dependants. The South African Military Health Service maintains military health facilities, including specialist facilities such as the institutes for maritime and aviation medicine, and the Military Psychology Institute. Various support functions – including appropriate medical training – are also provided, as is medical support to the Presidency. The Service provides support to the departments of Health and Agriculture when required.
Expenditure estimates
Table 21.7: Military Health Support Subprogramme Expenditure outcome Medium-term expenditure estimate
Audited Audited Preliminary Adjusted
outcome appropriation
R thousand 1998/99 1999/00 2000/01 2001/02 2002/03 2003/04 2004/05
Strategic Direction 91 226 90 198 96 494 148 408 123 226 127 663 139 310 Military Health Support 29 169 28 840 16 934 33 430 44 296 45 545 46 903
Area Military Health Service 324 515 320 861 345 782 353 850 395 377 406 570 418 745
Specialist Health Service 380 568 376 282 378 347 435 295 466 833 485 538 509 892
Product Support Capability 47 817 47 279 62 307 55 210 36 366 37 361 38 442
Base Support Capability 11 279 11 151 10 525 12 605 6 534 6 568 6 605
Military Health Training 55 005 54 385 61 563 56 354 72 307 74 827 77 650
Total 939 579 928 996 971 952 1 095 152 1 144 939 1 184 072 1 237 547
Change to 2001 Budget Estimate 125 7 415 (7 324)
Economic classification
Current 939 579 928 996 971 952 1 095 152 1 144 939 1 184 072 1 237 547
Personnel 652 918 645 564 674 921 749 528 750 564 783 062 822 303 Transfer payments – – 2 497 2 497 – – –
Other current 286 661 283 432 294 534 343 127 394 375 401 010 415 244
Capital – – – – – – –
Transfer payments – – – – – – – Acquisition of capital assets – – – – – – –
Total 939 579 928 996 971 952 1 095 152 1 144 939 1 184 072 1 237 547
Vote 21: Defence
477
Expenditure outcome Medium-term expenditure estimate
Audited Audited Preliminary Adjusted outcome appropriation
R thousand 1998/99 1999/00 2000/01 2001/02 2002/03 2003/04 2004/05
Standard items of expenditure
Personnel 652 918 645 564 674 921 749 528 750 564 783 062 822 303
Administrative 21 131 20 893 21 896 33 096 40 876 40 876 43 876
Inventories 136 096 134 563 138 522 172 251 190 545 194 845 198 909
Equipment 28 924 33 542 35 151 44 478 55 468 58 303 65 473
Land and buildings – – – – 1 300 1 300 1 300
Professional and special services 89 742 86 259 90 398 93 302 106 186 105 686 105 686
Transfer payments – – 2 497 2 497 – – –
Miscellaneous 10 768 8 175 8 567 – – – –
Total 939 579 928 996 971 952 1 095 152 1 144 939 1 184 072 1 237 547
Policy developments
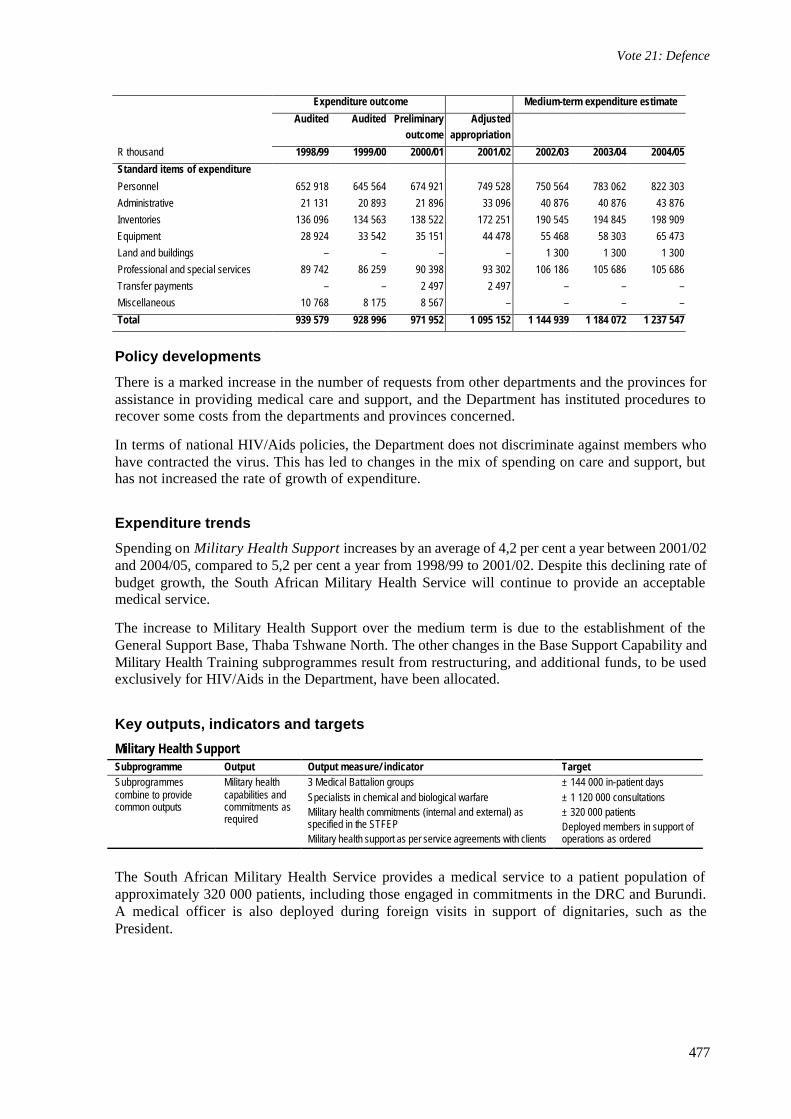
There is a marked increase in the number of requests from other departments and the provinces for assistance in providing medical care and support, and the Department has instituted procedures to recover some costs from the departments and provinces concerned.
In terms of national HIV/Aids policies, the Department does not discriminate against members who have contracted the virus. This has led to changes in the mix of spending on care and support, but has not increased the rate of growth of expenditure.
Expenditure trends
Spending on Military Health Support increases by an average of 4,2 per cent a year between 2001/02 and 2004/05, compared to 5,2 per cent a year from 1998/99 to 2001/02. Despite this declining rate of budget growth, the South African Military Health Service will continue to provide an acceptable medical service.
The increase to Military Health Support over the medium term is due to the establishment of the General Support Base, Thaba Tshwane North. The other changes in the Base Support Capability and Military Health Training subprogrammes result from restructuring, and additional funds, to be used exclusively for HIV/Aids in the Department, have been allocated.
Key outputs, indicators and targets
Military Health Support Subprogramme Output Output measure/ indicator Target Subprogrammes combine to provide common outputs
Military health capabilities and commitments as required
3 Medical Battalion groups Specialists in chemical and biological warfare Military health commitments (internal and external) as specified in the STFEP Military health support as per service agreements with clients
± 144 000 in-patient days ± 1 120 000 consultations ± 320 000 patients Deployed members in support of operations as ordered
The South African Military Health Service provides a medical service to a patient population of approximately 320 000 patients, including those engaged in commitments in the DRC and Burundi. A medical officer is also deployed during foreign visits in support of dignitaries, such as the President.

2002 Estimates of National Expenditure
478
Programme 6: Defence Intelligence
Defence Intelligence provides defence intelligence and counter-intelligence capabilities and services as ordered by the Chief of the SANDF. It also provides defence counter-intelligence for operational security and for personnel vetting. Components funded through Defence Intelligence work with the wider South African intelligence community in combating threats.
Expenditure estimates Table 21.8: Defence Intelligence Subprogramme Expenditure outcome Medium-term expenditure estimate
Audited Audited Preliminary Adjusted outcome appropriation
R thousand 1998/99 1999/00 2000/01 2001/02 2002/03 2003/04 2004/05
Strategic Direction 103 480 118 518 102 502 114 230 118 871 118 019 127 751
Defence Intelligence Services 11 855 13 577 10 338 12 649 12 583 13 938 14 345
Defence Counter Intelligence Services 5 894 6 751 5 865 6 036 4 620 5 080 5 769
Foreign Military Relations 4 250 3 680 3 680 3 500 1 858 1 858 1 858
Defence Intelligence Support Services 3 616 4 141 3 603 13 297 8 705 9 674 9 627
Defence Intelligence Training 1 362 1 561 1 100 1 463 2 547 1 999 2 121
Total 130 457 148 228 127 088 151 175 149 184 150 568 161 471
Change to 2001 Budget Estimate (13 145) (20 918) (24 778)
Economic classification
Current 130 457 148 228 127 088 151 175 149 184 150 568 161 471
Personnel 94 942 108 206 91 854 112 080 116 184 115 271 124 963
Transfer payments – – – – – – –
Other current 35 515 40 022 35 234 39 095 33 000 35 297 36 508
Capital – – – – – – –
Transfer payments – – – – – – –
Acquisition of capital assets – – – – – – –
Total 130 457 148 228 127 088 151 175 149 184 150 568 161 471
Standard items of expenditure
Personnel 94 942 108 206 91 854 112 080 116 184 115 271 124 963 Administrative 20 336 23 285 19 940 12 607 10 008 10 280 10 729
Inventories 2 955 3 324 2 941 3 872 4 490 4 694 4 777
Equipment 1 463 1 779 2 309 9 804 6 389 6 744 6 588
Land and buildings – – – – – – –
Professional and special services 9 134 9 771 8 488 12 812 12 113 13 579 14 414
Transfer payments – – – – – – –
Miscellaneous 1 627 1 863 1 556 – – – –
Total 130 457 148 228 127 088 151 175 149 184 150 568 161 471
Policy developments
The function of providing military attaché offices abroad, as well as the budget for this, will be shifted from this programme to Administration during 2002/03.
Expenditure trends
Defence Intelligence is a small component of the Vote, accounting for less than 1,0 per cent of the total over the medium term. Spending on the programme is expected to increase by an average of 2,2
Vote 21: Defence
479
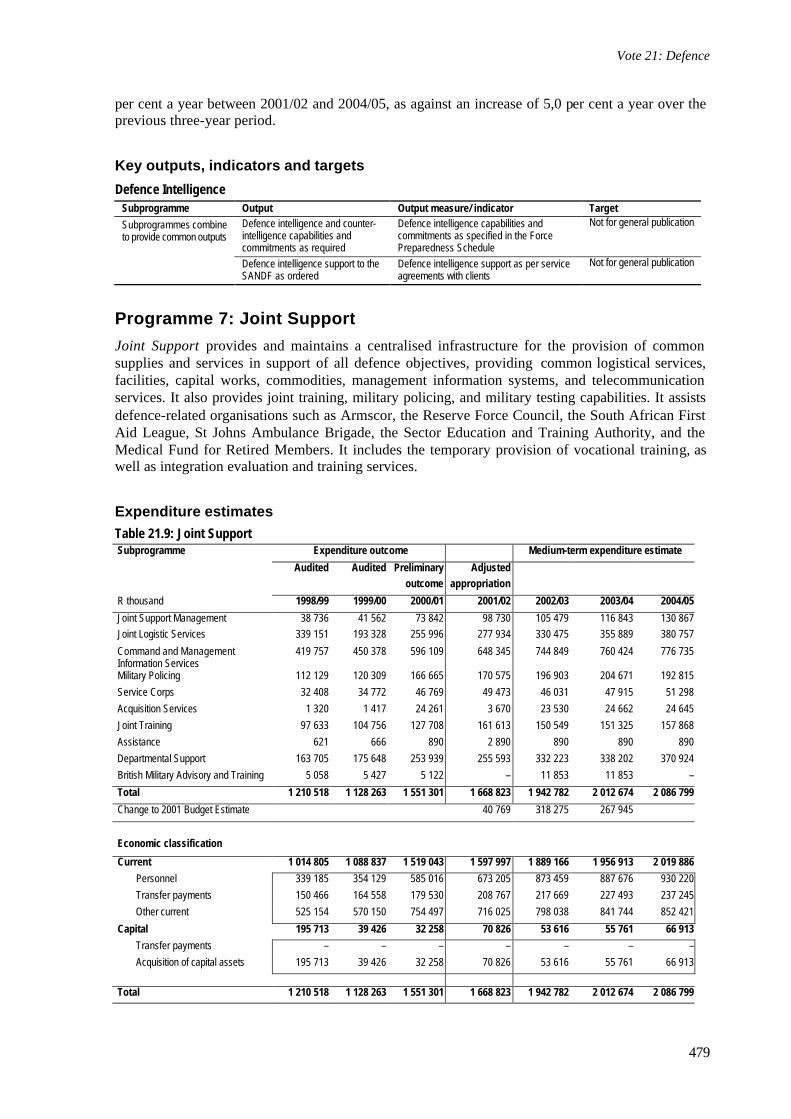
per cent a year between 2001/02 and 2004/05, as against an increase of 5,0 per cent a year over the previous three-year period.
Key outputs, indicators and targets
Defence Intelligence Subprogramme Output Output measure/ indicator Target
Defence intelligence and counter-intelligence capabilities and commitments as required
Defence intelligence capabilities and commitments as specified in the Force Preparedness Schedule
Not for general publication Subprogrammes combine to provide common outputs
Defence intelligence support to the SANDF as ordered
Defence intelligence support as per service agreements with clients
Not for general publication
Programme 7: Joint Support
Joint Support provides and maintains a centralised infrastructure for the provision of common supplies and services in support of all defence objectives, providing common logistical services, facilities, capital works, commodities, management information systems, and telecommunication services. It also provides joint training, military policing, and military testing capabilities. It assists defence-related organisations such as Armscor, the Reserve Force Council, the South African First Aid League, St Johns Ambulance Brigade, the Sector Education and Training Authority, and the Medical Fund for Retired Members. It includes the temporary provision of vocational training, as well as integration evaluation and training services.
Expenditure estimates Table 21.9: Joint Support Subprogramme Expenditure outcome Medium-term expenditure estimate
Audited Audited Preliminary Adjusted outcome appropriation
R thousand 1998/99 1999/00 2000/01 2001/02 2002/03 2003/04 2004/05
Joint Support Management 38 736 41 562 73 842 98 730 105 479 116 843 130 867 Joint Logistic Services 339 151 193 328 255 996 277 934 330 475 355 889 380 757
Command and Management Information Services
419 757 450 378 596 109 648 345 744 849 760 424 776 735
Military Policing 112 129 120 309 166 665 170 575 196 903 204 671 192 815
Service Corps 32 408 34 772 46 769 49 473 46 031 47 915 51 298
Acquisition Services 1 320 1 417 24 261 3 670 23 530 24 662 24 645
Joint Training 97 633 104 756 127 708 161 613 150 549 151 325 157 868
Assistance 621 666 890 2 890 890 890 890
Departmental Support 163 705 175 648 253 939 255 593 332 223 338 202 370 924
British Military Advisory and Training 5 058 5 427 5 122 – 11 853 11 853 –
Total 1 210 518 1 128 263 1 551 301 1 668 823 1 942 782 2 012 674 2 086 799
Change to 2001 Budget Estimate 40 769 318 275 267 945
Economic classification
Current 1 014 805 1 088 837 1 519 043 1 597 997 1 889 166 1 956 913 2 019 886
Personnel 339 185 354 129 585 016 673 205 873 459 887 676 930 220
Transfer payments 150 466 164 558 179 530 208 767 217 669 227 493 237 245
Other current 525 154 570 150 754 497 716 025 798 038 841 744 852 421
Capital 195 713 39 426 32 258 70 826 53 616 55 761 66 913
Transfer payments – – – – – – –
Acquisition of capital assets 195 713 39 426 32 258 70 826 53 616 55 761 66 913
Total 1 210 518 1 128 263 1 551 301 1 668 823 1 942 782 2 012 674 2 086 799
2002 Estimates of National Expenditure
480
Expenditure outcome Medium-term expenditure estimate
Audited Audited Preliminary Adjusted outcome appropriation
R thousand 1998/99 1999/00 2000/01 2001/02 2002/03 2003/04 2004/05
Standard items of expenditure
Personnel 339 185 354 129 585 016 673 205 873 459 887 676 930 220
Administrative 43 508 46 682 62 979 87 380 101 047 103 141 102 681
Inventories 38 073 35 688 51 361 128 710 52 909 55 371 54 964
Equipment 39 584 58 566 79 011 (3 768) 46 634 47 296 48 701
Land and buildings 1 537 1 603 1 544 2 043 3 808 4 073 3 208
Professional and special services 585 703 438 554 576 716 563 950 636 756 677 124 699 280
Transfer payments 150 466 164 558 179 530 208 767 217 669 227 493 237 245
Miscellaneous 12 462 28 483 15 144 8 536 10 500 10 500 10 500
Total 1 210 518 1 128 263 1 551 301 1 668 823 1 942 782 2 012 674 2 086 799
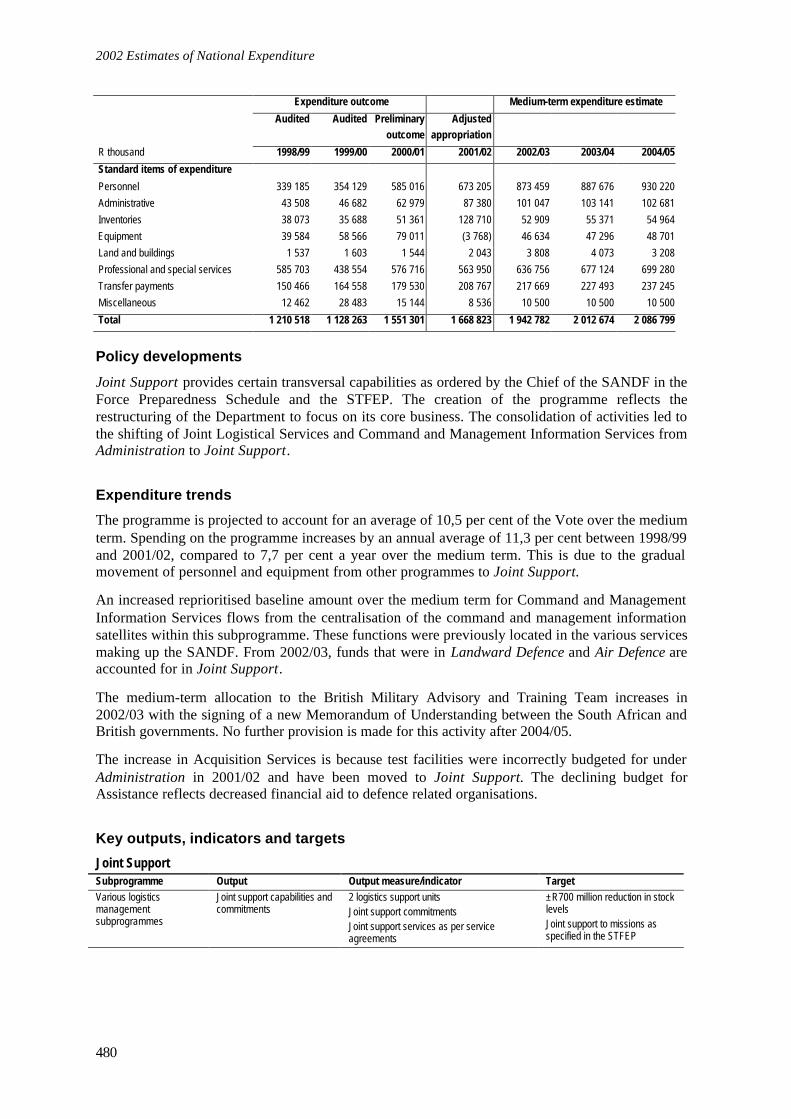
Policy developments
Joint Support provides certain transversal capabilities as ordered by the Chief of the SANDF in the Force Preparedness Schedule and the STFEP. The creation of the programme reflects the restructuring of the Department to focus on its core business. The consolidation of activities led to the shifting of Joint Logistical Services and Command and Management Information Services from Administration to Joint Support.
Expenditure trends
The programme is projected to account for an average of 10,5 per cent of the Vote over the medium term. Spending on the programme increases by an annual average of 11,3 per cent between 1998/99 and 2001/02, compared to 7,7 per cent a year over the medium term. This is due to the gradual movement of personnel and equipment from other programmes to Joint Support.
An increased reprioritised baseline amount over the medium term for Command and Management Information Services flows from the centralisation of the command and management information satellites within this subprogramme. These functions were previously located in the various services making up the SANDF. From 2002/03, funds that were in Landward Defence and Air Defence are accounted for in Joint Support.
The medium-term allocation to the British Military Advisory and Training Team increases in 2002/03 with the signing of a new Memorandum of Understanding between the South African and British governments. No further provision is made for this activity after 2004/05.
The increase in Acquisition Services is because test facilities were incorrectly budgeted for under Administration in 2001/02 and have been moved to Joint Support. The declining budget for Assistance reflects decreased financial aid to defence related organisations.
Key outputs, indicators and targets
Joint Support Subprogramme Output Output measure/indicator Target Various logistics management subprogrammes
Joint support capabilities and commitments
2 logistics support units Joint support commitments Joint support services as per service agreements
±R700 million reduction in stock levels Joint support to missions as specified in the STFEP
Vote 21: Defence
481
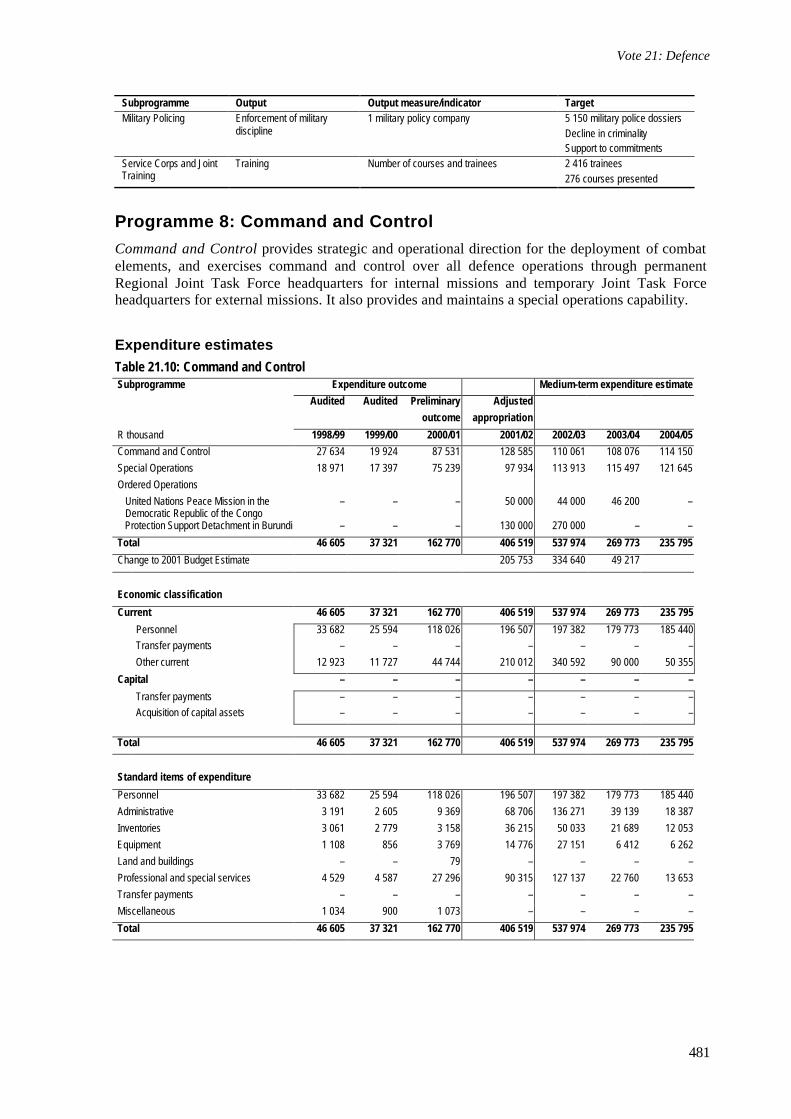
Subprogramme Output Output measure/indicator Target Military Policing Enforcement of military
discipline 1 military policy company 5 150 military police dossiers
Decline in criminality Support to commitments
Service Corps and Joint Training
Training Number of courses and trainees 2 416 trainees 276 courses presented
Programme 8: Command and Control
Command and Control provides strategic and operational direction for the deployment of combat elements, and exercises command and control over all defence operations through permanent Regional Joint Task Force headquarters for internal missions and temporary Joint Task Force headquarters for external missions. It also provides and maintains a special operations capability.
Expenditure estimates Table 21.10: Command and Control Subprogramme Expenditure outcome Medium-term expenditure estimate
Audited Audited Preliminary Adjusted
outcome appropriation
R thousand 1998/99 1999/00 2000/01 2001/02 2002/03 2003/04 2004/05
Command and Control 27 634 19 924 87 531 128 585 110 061 108 076 114 150
Special Operations 18 971 17 397 75 239 97 934 113 913 115 497 121 645
Ordered Operations
United Nations Peace Mission in the Democratic Republic of the Congo
– – – 50 000 44 000 46 200 –
Protection Support Detachment in Burundi – – – 130 000 270 000 – –
Total 46 605 37 321 162 770 406 519 537 974 269 773 235 795
Change to 2001 Budget Estimate 205 753 334 640 49 217
Economic classification
Current 46 605 37 321 162 770 406 519 537 974 269 773 235 795
Personnel 33 682 25 594 118 026 196 507 197 382 179 773 185 440 Transfer payments – – – – – – –
Other current 12 923 11 727 44 744 210 012 340 592 90 000 50 355
Capital – – – – – – –
Transfer payments – – – – – – – Acquisition of capital assets – – – – – – –
Total 46 605 37 321 162 770 406 519 537 974 269 773 235 795
Standard items of expenditure
Personnel 33 682 25 594 118 026 196 507 197 382 179 773 185 440
Administrative 3 191 2 605 9 369 68 706 136 271 39 139 18 387
Inventories 3 061 2 779 3 158 36 215 50 033 21 689 12 053
Equipment 1 108 856 3 769 14 776 27 151 6 412 6 262
Land and buildings – – 79 – – – –
Professional and special services 4 529 4 587 27 296 90 315 127 137 22 760 13 653
Transfer payments – – – – – – –
Miscellaneous 1 034 900 1 073 – – – –
Total 46 605 37 321 162 770 406 519 537 974 269 773 235 795
2002 Estimates of National Expenditure
482
Policy developments
Ordered Operations was established to reflect the involvement of South African forces in peace support operations in Africa. The budgeted amount in this subprogramme is for the deployment of members of the SANDF in the DRC (Operation MONUC) and in Burundi.
Expenditure trends
Command and Control is a relatively small programme. Spending increases by an average of 105,8 per cent between 1998/99 and 2001/02 due to the establishment of the Regional Joint Task Force headquarters, the shift of the Special Operations from Landward Defence, the start of Operation MONUC, and the protection service rendered in Burundi. The budget decreases after 2002/03, in the expectation that DRC and Burundi operations will end before 2004/05.
Key outputs, indicators and targets
Command and Control Subprogramme Output Output measure/indicator Target Command and Control
Command and control over all defence operations
1 Joint headquarters 5 Regional Joint Task Force headquarters Task Force headquarters as required
3 border control/support to SAPS 3 combined exercises 4 peace support operations
Special Operations Special Forces capabilities and commitments
1 Special Forces brigade Special Forces commitments
Not for general publication
Ordered Operations (a) MONUC
1 contingency support headquarters Special services capabilities (medical, cargo handling, crash rescue, and fire-fighting) as required in the Memorandum of Understanding (between the SANDF and the UN)
Compliance with Memorandum of Understanding
365 days support to United Nations mission in the Democratic Republic of the Congo
(b) Burundi 1 contingency support headquarters 1 VIP protection unit Total deployment of 701 members According to the Memorandum of Understanding between the South African government and the transitional government of Burundi
Compliance with Memorandum of Understanding
South African protection support detachment of 8 months to Burundi (final withdrawal date not yet determined)
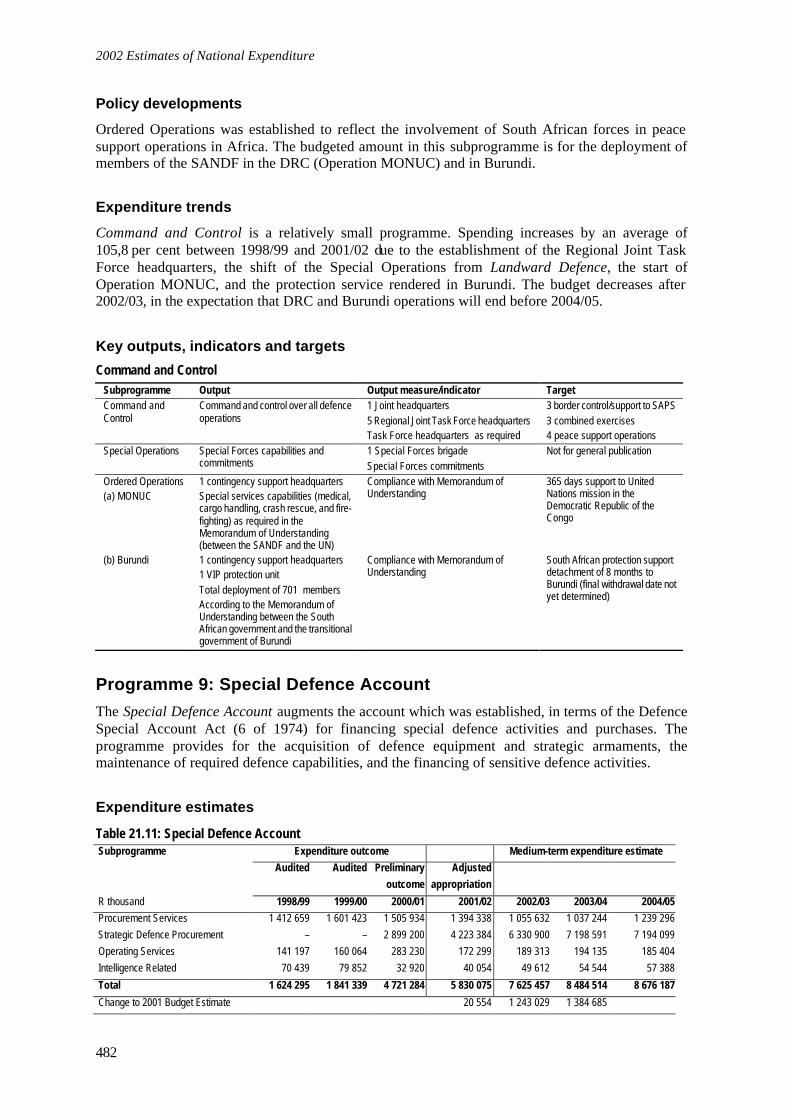
Programme 9: Special Defence Account
The Special Defence Account augments the account which was established, in terms of the Defence Special Account Act (6 of 1974) for financing special defence activities and purchases. The programme provides for the acquisition of defence equipment and strategic armaments, the maintenance of required defence capabilities, and the financing of sensitive defence activities.
Expenditure estimates
Table 21.11: Special Defence Account Subprogramme Expenditure outcome Medium-term expenditure estimate
Audited Audited Preliminary Adjusted
outcome appropriation
R thousand 1998/99 1999/00 2000/01 2001/02 2002/03 2003/04 2004/05
Procurement Services 1 412 659 1 601 423 1 505 934 1 394 338 1 055 632 1 037 244 1 239 296
Strategic Defence Procurement – – 2 899 200 4 223 384 6 330 900 7 198 591 7 194 099
Operating Services 141 197 160 064 283 230 172 299 189 313 194 135 185 404
Intelligence Related 70 439 79 852 32 920 40 054 49 612 54 544 57 388
Total 1 624 295 1 841 339 4 721 284 5 830 075 7 625 457 8 484 514 8 676 187
Change to 2001 Budget Estimate 20 554 1 243 029 1 384 685
Vote 21: Defence
483
Expenditure outcome Medium-term expenditure estimate
Audited Audited Preliminary Adjusted outcome appropriation
R thousand 1998/99 1999/00 2000/01 2001/02 2002/03 2003/04 2004/05
Economic classification
Current 1 624 295 1 841 339 4 721 284 5 830 075 7 625 457 8 484 514 8 676 187
Personnel – – – – – – – Transfer payments 1 624 295 1 841 339 4 721 284 5 830 075 7 625 457 8 484 514 8 676 187
Other current – – – – – – –
Capital – – – – – – –
Transfer payments – – – – – – –
Acquisition of capital assets – – – – – – –
Total 1 624 295 1 841 339 4 721 284 5 830 075 7 625 457 8 484 514 8 676 187
Standard items of expenditure
Personnel – – – – – – –
Administrative – – – – – – –
Inventories – – – – – – –
Equipment – – – – – – –
Land and buildings – – – – – – –
Professional and special services – – – – – – –
Transfer payments 1 624 295 1 841 339 4 721 284 5 830 075 7 625 457 8 484 514 8 676 187
Miscellaneous – – – – – – –
Total 1 624 295 1 841 339 4 721 284 5 830 075 7 625 457 8 484 514 8 676 187
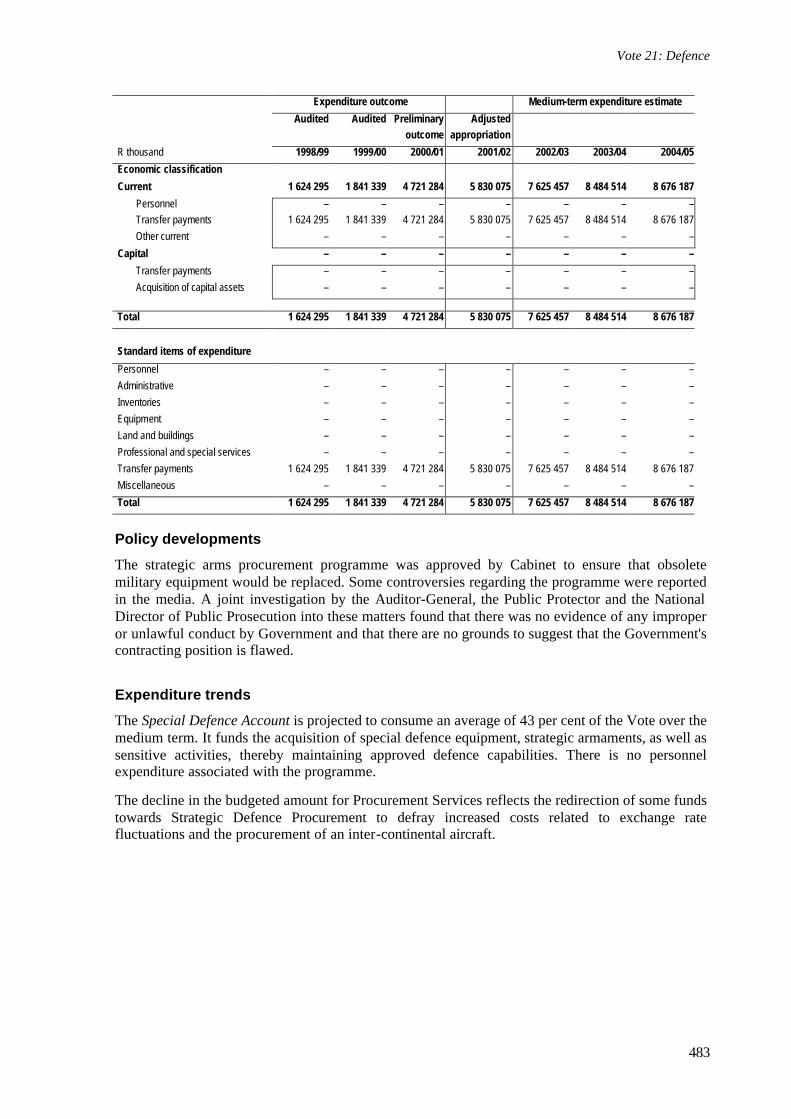
Policy developments
The strategic arms procurement programme was approved by Cabinet to ensure that obsolete military equipment would be replaced. Some controversies regarding the programme were reported in the media. A joint investigation by the Auditor-General, the Public Protector and the National Director of Public Prosecution into these matters found that there was no evidence of any improper or unlawful conduct by Government and that there are no grounds to suggest that the Government's contracting position is flawed.
Expenditure trends
The Special Defence Account is projected to consume an average of 43 per cent of the Vote over the medium term. It funds the acquisition of special defence equipment, strategic armaments, as well as sensitive activities, thereby maintaining approved defence capabilities. There is no personnel expenditure associated with the programme.
The decline in the budgeted amount for Procurement Services reflects the redirection of some funds towards Strategic Defence Procurement to defray increased costs related to exchange rate fluctuations and the procurement of an inter-continental aircraft.
2002 Estimates of National Expenditure
484
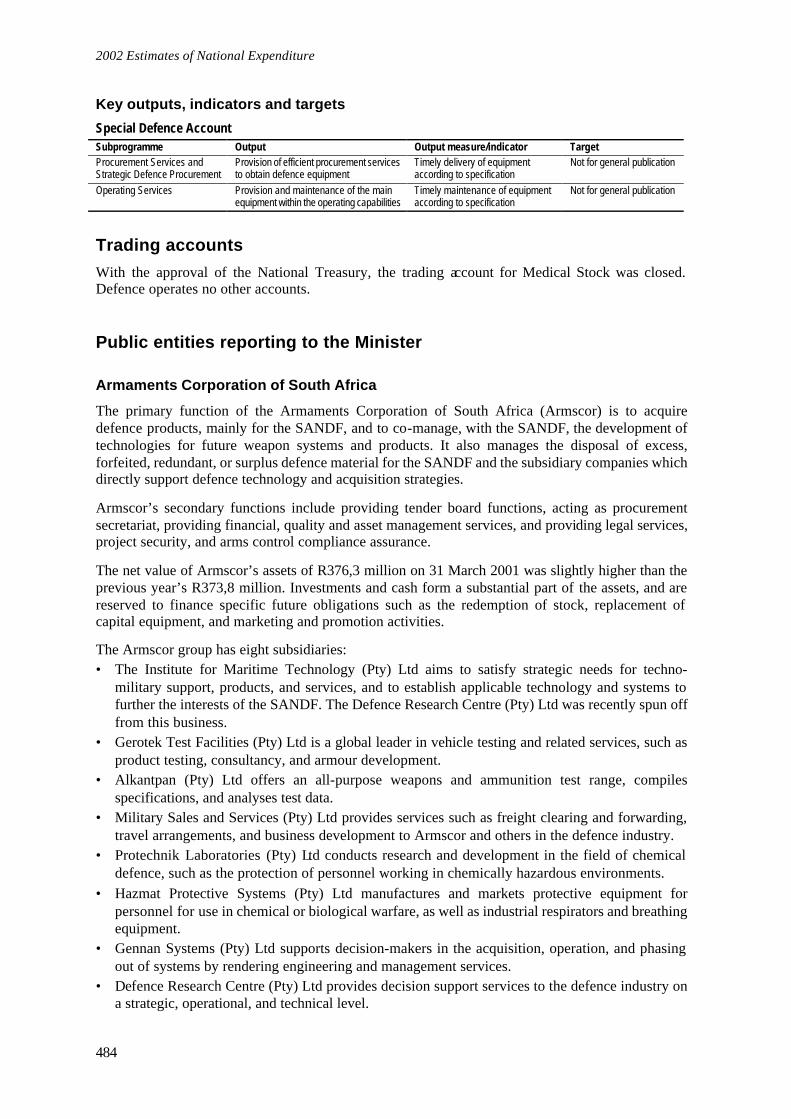
Key outputs, indicators and targets
Special Defence Account Subprogramme Output Output measure/indicator Target Procurement Services and Strategic Defence Procurement
Provision of efficient procurement services to obtain defence equipment
Timely delivery of equipment according to specification
Not for general publication
Operating Services Provision and maintenance of the main equipment within the operating capabilities
Timely maintenance of equipment according to specification
Not for general publication
Trading accounts
With the approval of the National Treasury, the trading account for Medical Stock was closed. Defence operates no other accounts.
Public entities reporting to the Minister
Armaments Corporation of South Africa
The primary function of the Armaments Corporation of South Africa (Armscor) is to acquire defence products, mainly for the SANDF, and to co-manage, with the SANDF, the development of technologies for future weapon systems and products. It also manages the disposal of excess, forfeited, redundant, or surplus defence material for the SANDF and the subsidiary companies which directly support defence technology and acquisition strategies.
Armscor’s secondary functions include providing tender board functions, acting as procurement secretariat, providing financial, quality and asset management services, and providing legal services, project security, and arms control compliance assurance.
The net value of Armscor’s assets of R376,3 million on 31 March 2001 was slightly higher than the previous year’s R373,8 million. Investments and cash form a substantial part of the assets, and are reserved to finance specific future obligations such as the redemption of stock, replacement of capital equipment, and marketing and promotion activities.
The Armscor group has eight subsidiaries: • The Institute for Maritime Technology (Pty) Ltd aims to satisfy strategic needs for techno-
military support, products, and services, and to establish applicable technology and systems to further the interests of the SANDF. The Defence Research Centre (Pty) Ltd was recently spun off from this business.
• Gerotek Test Facilities (Pty) Ltd is a global leader in vehicle testing and related services, such as product testing, consultancy, and armour development.
• Alkantpan (Pty) Ltd offers an all-purpose weapons and ammunition test range, compiles specifications, and analyses test data.
• Military Sales and Services (Pty) Ltd provides services such as freight clearing and forwarding, travel arrangements, and business development to Armscor and others in the defence industry.
• Protechnik Laboratories (Pty) Ltd conducts research and development in the field of chemical defence, such as the protection of personnel working in chemically hazardous environments.
• Hazmat Protective Systems (Pty) Ltd manufactures and markets protective equipment for personnel for use in chemical or biological warfare, as well as industrial respirators and breathing equipment.
• Gennan Systems (Pty) Ltd supports decision-makers in the acquisition, operation, and phasing out of systems by rendering engineering and management services.
• Defence Research Centre (Pty) Ltd provides decision support services to the defence industry on a strategic, operational, and technical level.
Vote 21: Defence
485
The activities of Armscor are mainly financed by an annual transfer payment from the Department of Defence, interest received on investments, the hiring out some of their buildings, commission from stock sales, and income from subsidiaries.
Armscor is currently listed as a Schedule 2 major public entity in terms of the Public Finance Management Act (1 of 1999). Actual and prospective changes to its powers and functions mean that an investigation has been initiated into whether it should be re-listed as a Schedule 3 Part A national public entity.
Castle Control Board Although the Castle of the Cape of Good Hope is currently the responsibility of the Minister of Defence, it is envisaged that in the near future it will become the responsibility of the Minister of Arts and Culture. The Department of Defence does not make any financial contribution towards the Castle of the Cape of Good Hope.
2002 Estimates of National Expenditure
486
Annexure
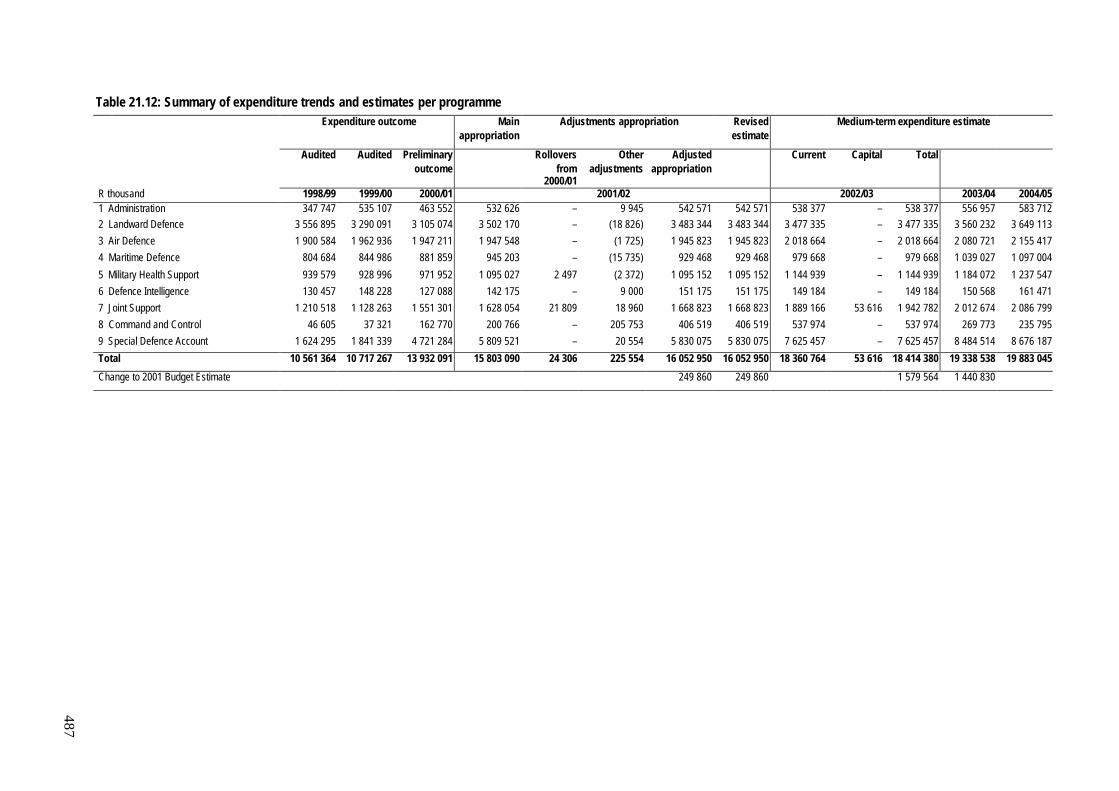
Vote 21: Defence Table 21.12: Summary of expenditure trends and estimates per programme
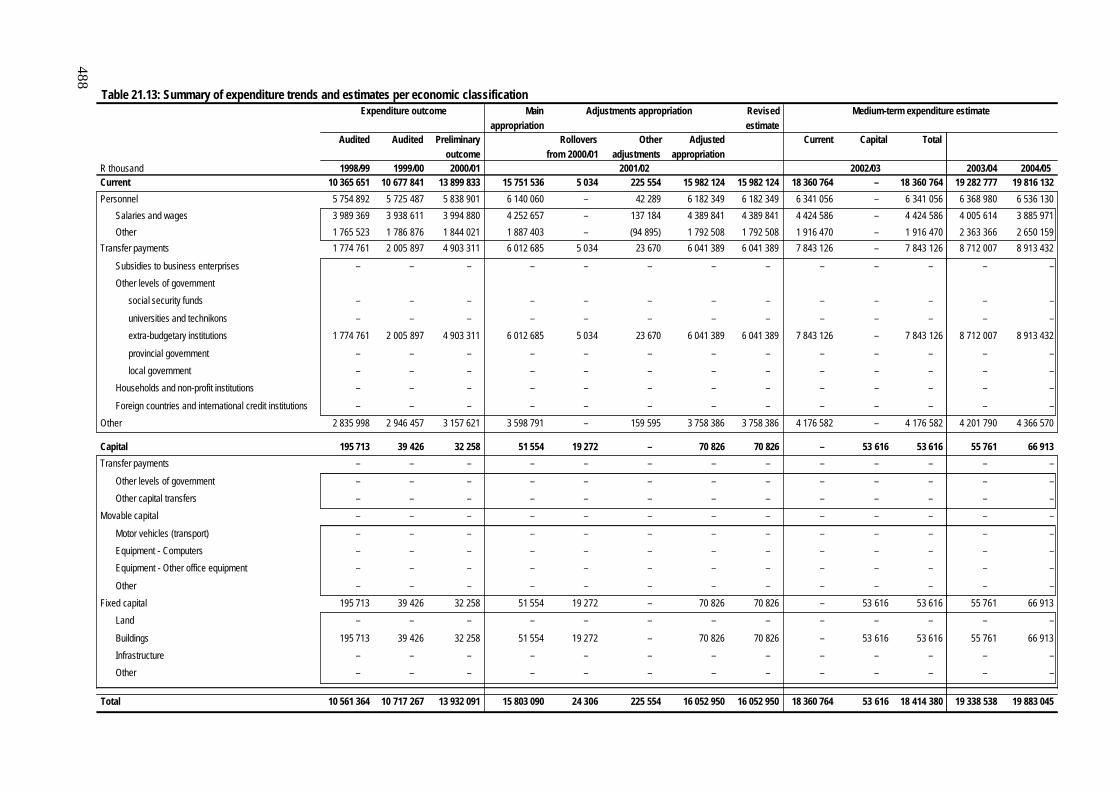
Table 21.13: Summary of expenditure trends and estimates per economic classification
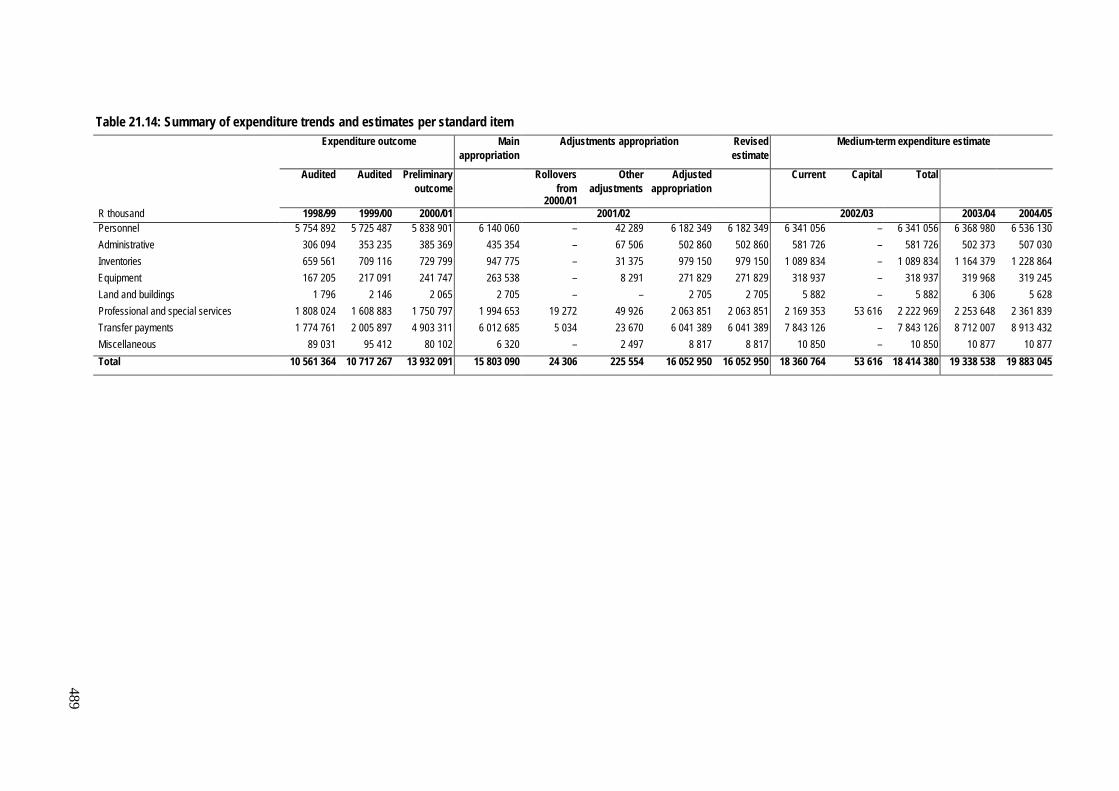
Table 21.14: Summary of expenditure trends and estimates per standard item
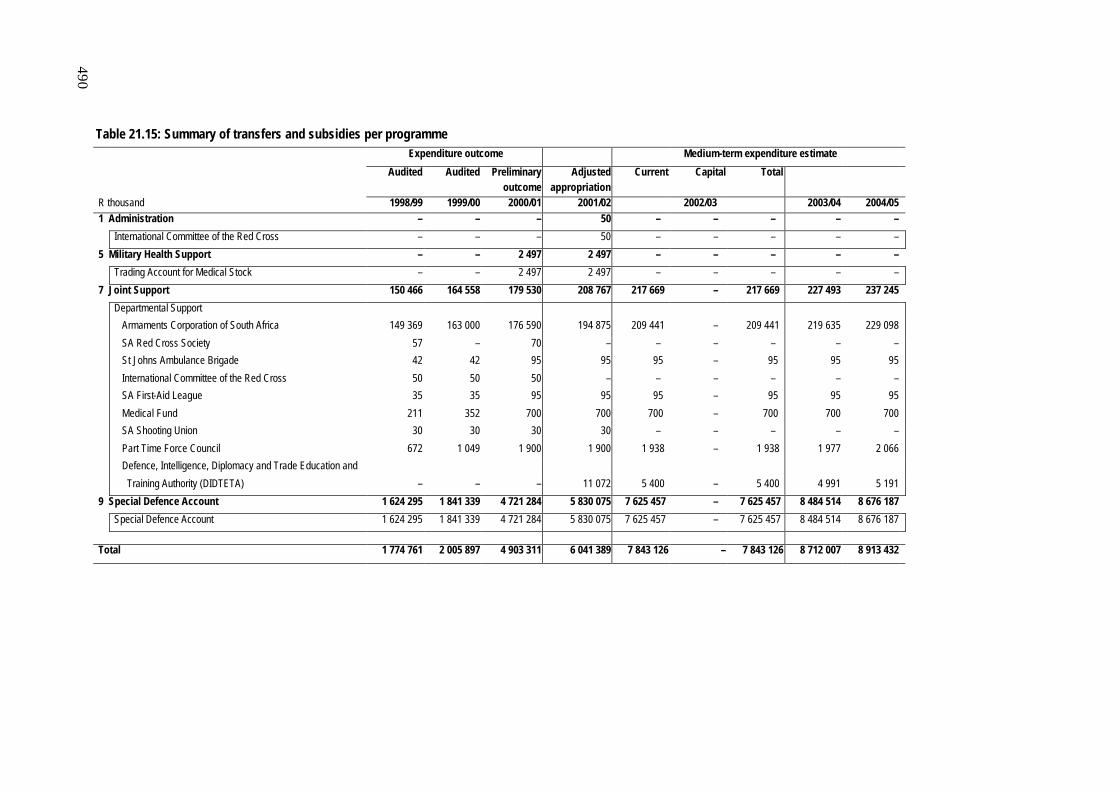
Table 21.15: Summary of transfers and subsidies per programme
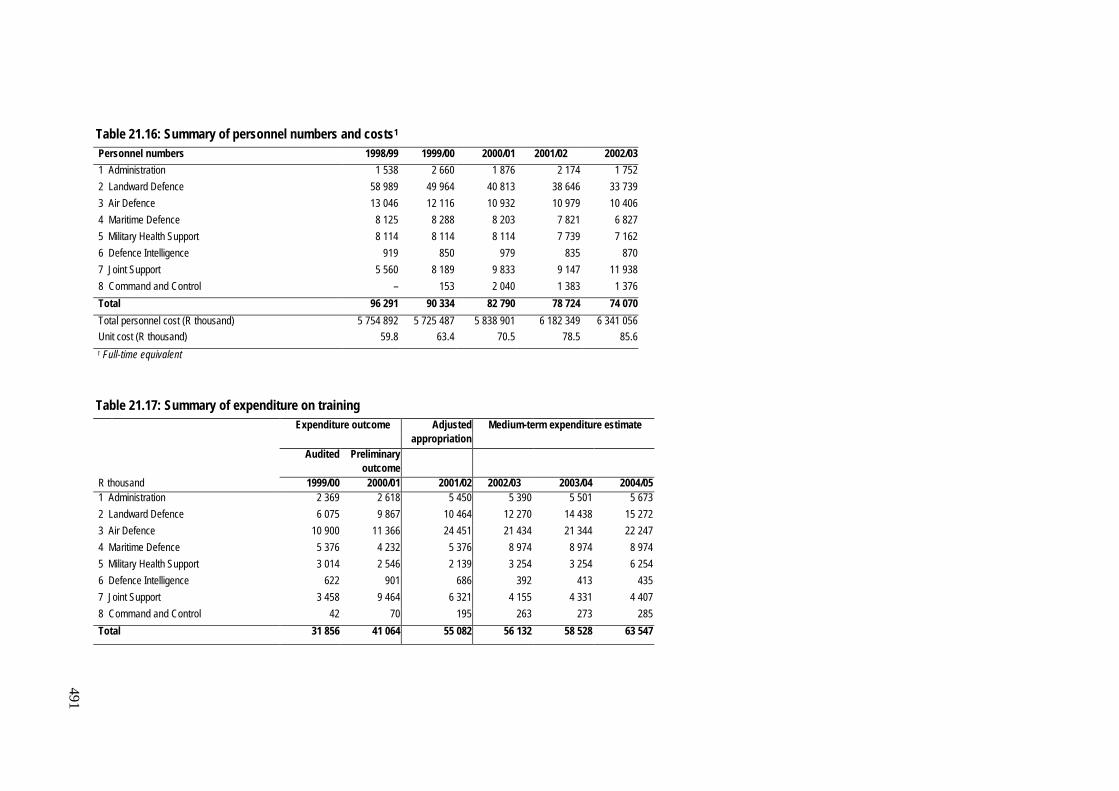
Table 21.16: Summary of personnel numbers and costs
Table 21.17: Summary of expenditure on training
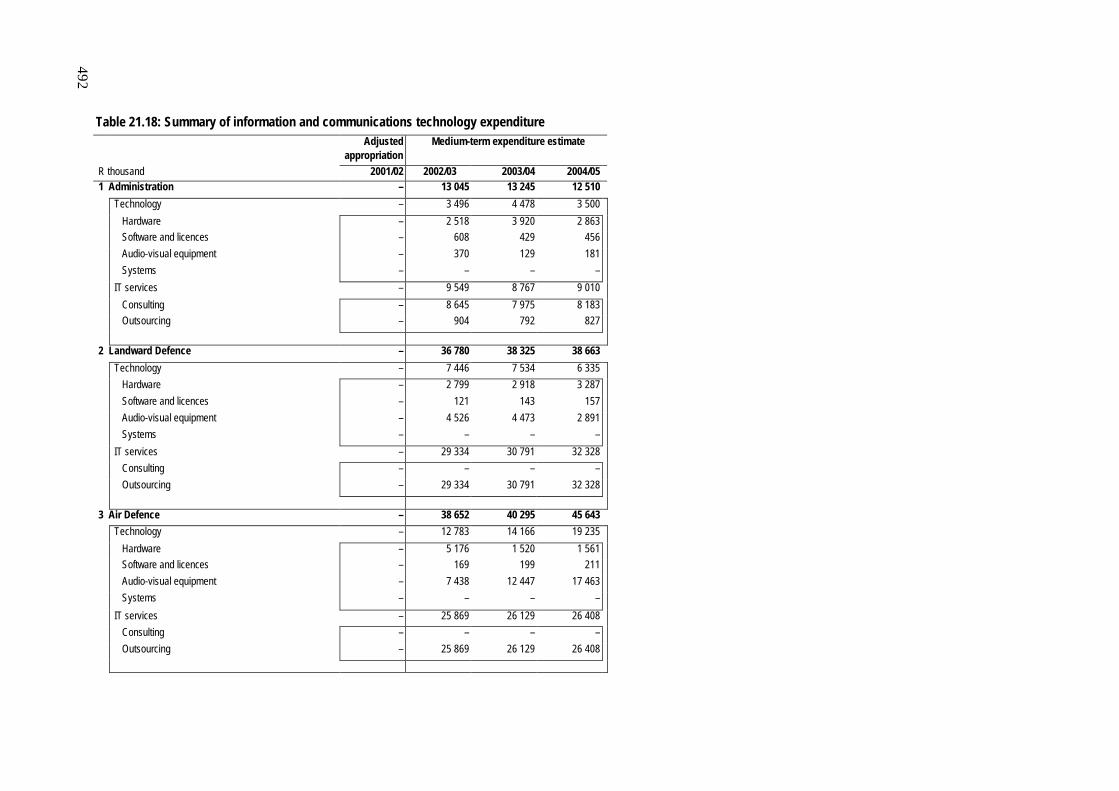
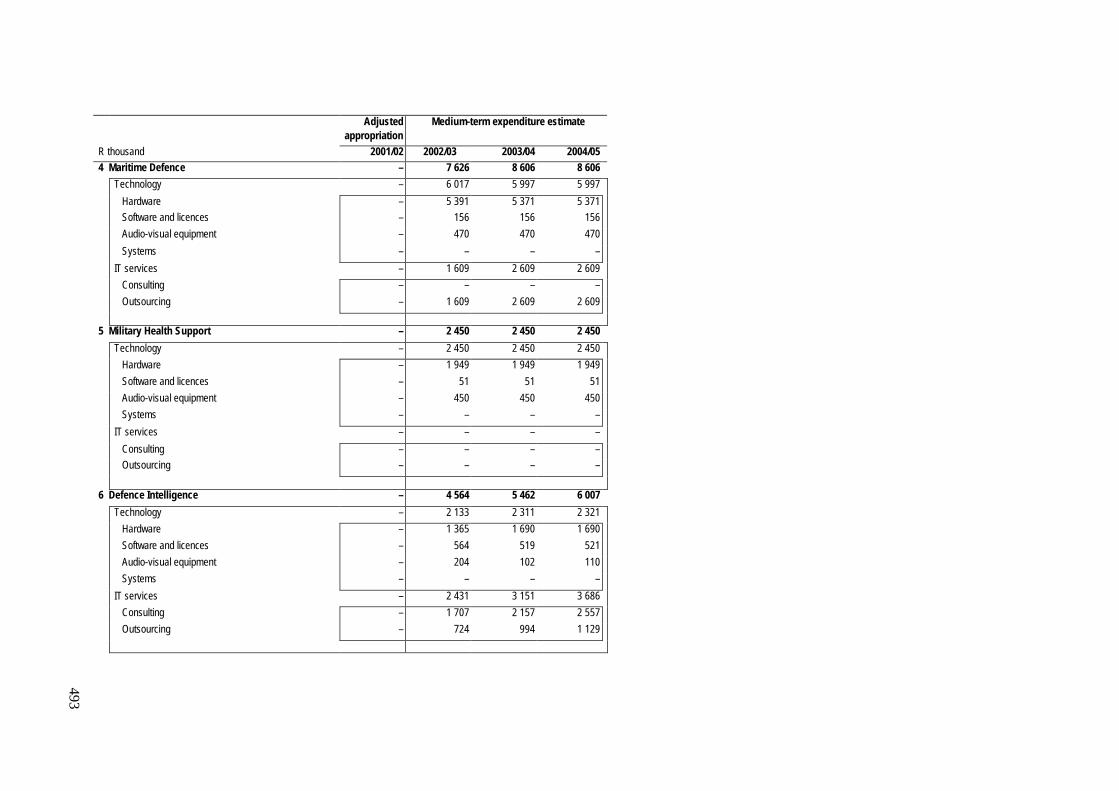
Table 21.18: Summary of information and communications technology expenditure
487
Table 21.12: Summary of expenditure trends and estimates per programme Expenditure outcome Main Adjustments appropriation Revised Medium-term expenditure estimate appropriation estimate
Audited Audited Preliminary Rollovers Other Adjusted Current Capital Total outcome from
2000/01 adjustments appropriation
R thousand 1998/99 1999/00 2000/01 2001/02 2002/03 2003/04 2004/05 1 Administration 347 747 535 107 463 552 532 626 – 9 945 542 571 542 571 538 377 – 538 377 556 957 583 712 2 Landward Defence 3 556 895 3 290 091 3 105 074 3 502 170 – (18 826) 3 483 344 3 483 344 3 477 335 – 3 477 335 3 560 232 3 649 113
3 Air Defence 1 900 584 1 962 936 1 947 211 1 947 548 – (1 725) 1 945 823 1 945 823 2 018 664 – 2 018 664 2 080 721 2 155 417
4 Maritime Defence 804 684 844 986 881 859 945 203 – (15 735) 929 468 929 468 979 668 – 979 668 1 039 027 1 097 004
5 Military Health Support 939 579 928 996 971 952 1 095 027 2 497 (2 372) 1 095 152 1 095 152 1 144 939 – 1 144 939 1 184 072 1 237 547
6 Defence Intelligence 130 457 148 228 127 088 142 175 – 9 000 151 175 151 175 149 184 – 149 184 150 568 161 471
7 Joint Support 1 210 518 1 128 263 1 551 301 1 628 054 21 809 18 960 1 668 823 1 668 823 1 889 166 53 616 1 942 782 2 012 674 2 086 799
8 Command and Control 46 605 37 321 162 770 200 766 – 205 753 406 519 406 519 537 974 – 537 974 269 773 235 795
9 Special Defence Account 1 624 295 1 841 339 4 721 284 5 809 521 – 20 554 5 830 075 5 830 075 7 625 457 – 7 625 457 8 484 514 8 676 187
Total 10 561 364 10 717 267 13 932 091 15 803 090 24 306 225 554 16 052 950 16 052 950 18 360 764 53 616 18 414 380 19 338 538 19 883 045
Change to 2001 Budget Estimate 249 860 249 860 1 579 564 1 440 830
488
Expenditure outcome Main Adjustments appropriation Revised Medium-term expenditure estimateappropriation estimate
Audited Audited Preliminary Rollovers Other Adjusted Current Capital Totaloutcome from 2000/01 adjustments appropriation
R thousand 1998/99 1999/00 2000/01 2001/02 2002/03 2003/04 2004/05Current 10 365 651 10 677 841 13 899 833 15 751 536 5 034 225 554 15 982 124 15 982 124 18 360 764 – 18 360 764 19 282 777 19 816 132
Personnel 5 754 892 5 725 487 5 838 901 6 140 060 – 42 289 6 182 349 6 182 349 6 341 056 – 6 341 056 6 368 980 6 536 130
Salaries and wages 3 989 369 3 938 611 3 994 880 4 252 657 – 137 184 4 389 841 4 389 841 4 424 586 – 4 424 586 4 005 614 3 885 971
Other 1 765 523 1 786 876 1 844 021 1 887 403 – (94 895) 1 792 508 1 792 508 1 916 470 – 1 916 470 2 363 366 2 650 159
Transfer payments 1 774 761 2 005 897 4 903 311 6 012 685 5 034 23 670 6 041 389 6 041 389 7 843 126 – 7 843 126 8 712 007 8 913 432
Subsidies to business enterprises – – – – – – – – – – – – –
Other levels of government
social security funds – – – – – – – – – – – – –
universities and technikons – – – – – – – – – – – – –
extra-budgetary institutions 1 774 761 2 005 897 4 903 311 6 012 685 5 034 23 670 6 041 389 6 041 389 7 843 126 – 7 843 126 8 712 007 8 913 432
provincial government – – – – – – – – – – – – –
local government – – – – – – – – – – – – –
Households and non-profit institutions – – – – – – – – – – – – –
Foreign countries and international credit institutions – – – – – – – – – – – – –
Other 2 835 998 2 946 457 3 157 621 3 598 791 – 159 595 3 758 386 3 758 386 4 176 582 – 4 176 582 4 201 790 4 366 570
Capital 195 713 39 426 32 258 51 554 19 272 – 70 826 70 826 – 53 616 53 616 55 761 66 913
Transfer payments – – – – – – – – – – – – –
Other levels of government – – – – – – – – – – – – –
Other capital transfers – – – – – – – – – – – – –
Movable capital – – – – – – – – – – – – –
Motor vehicles (transport) – – – – – – – – – – – – –
Equipment - Computers – – – – – – – – – – – – –
Equipment - Other office equipment – – – – – – – – – – – – –
Other – – – – – – – – – – – – –
Fixed capital 195 713 39 426 32 258 51 554 19 272 – 70 826 70 826 – 53 616 53 616 55 761 66 913
Land – – – – – – – – – – – – –
Buildings 195 713 39 426 32 258 51 554 19 272 – 70 826 70 826 – 53 616 53 616 55 761 66 913
Infrastructure – – – – – – – – – – – – –
Other – – – – – – – – – – – – –
10 561 364 10 717 267 13 932 091 15 803 090 24 306 225 554 16 052 950 16 052 950 18 360 764 53 616 18 414 380 19 338 538 19 883 045 Total
Table 21.13: Summary of expenditure trends and estimates per economic classification
489
Table 21.14: Summary of expenditure trends and estimates per standard item
Expenditure outcome Main Adjustments appropriation Revised Medium-term expenditure estimate appropriation estimate
Audited Audited Preliminary Rollovers Other Adjusted Current Capital Total outcome from
2000/01 adjustments appropriation
R thousand 1998/99 1999/00 2000/01 2001/02 2002/03 2003/04 2004/05 Personnel 5 754 892 5 725 487 5 838 901 6 140 060 – 42 289 6 182 349 6 182 349 6 341 056 – 6 341 056 6 368 980 6 536 130
Administrative 306 094 353 235 385 369 435 354 – 67 506 502 860 502 860 581 726 – 581 726 502 373 507 030
Inventories 659 561 709 116 729 799 947 775 – 31 375 979 150 979 150 1 089 834 – 1 089 834 1 164 379 1 228 864
Equipment 167 205 217 091 241 747 263 538 – 8 291 271 829 271 829 318 937 – 318 937 319 968 319 245
Land and buildings 1 796 2 146 2 065 2 705 – – 2 705 2 705 5 882 – 5 882 6 306 5 628
Professional and special services 1 808 024 1 608 883 1 750 797 1 994 653 19 272 49 926 2 063 851 2 063 851 2 169 353 53 616 2 222 969 2 253 648 2 361 839
Transfer payments 1 774 761 2 005 897 4 903 311 6 012 685 5 034 23 670 6 041 389 6 041 389 7 843 126 – 7 843 126 8 712 007 8 913 432
Miscellaneous 89 031 95 412 80 102 6 320 – 2 497 8 817 8 817 10 850 – 10 850 10 877 10 877
Total 10 561 364 10 717 267 13 932 091 15 803 090 24 306 225 554 16 052 950 16 052 950 18 360 764 53 616 18 414 380 19 338 538 19 883 045
490
Table 21.15: Summary of transfers and subsidies per programme
Expenditure outcome Medium-term expenditure estimate
Audited Audited Preliminary Adjusted Current Capital Total outcome appropriation
R thousand 1998/99 1999/00 2000/01 2001/02 2002/03 2003/04 2004/05 1 Administration – – – 50 – – – – –
International Committee of the Red Cross – – – 50 – – – – –
5 Military Health Support – – 2 497 2 497 – – – – –
Trading Account for Medical Stock – – 2 497 2 497 – – – – –
7 Joint Support 150 466 164 558 179 530 208 767 217 669 – 217 669 227 493 237 245
Departmental Support
Armaments Corporation of South Africa 149 369 163 000 176 590 194 875 209 441 – 209 441 219 635 229 098
SA Red Cross Society 57 – 70 – – – – – –
St Johns Ambulance Brigade 42 42 95 95 95 – 95 95 95
International Committee of the Red Cross 50 50 50 – – – – – –
SA First-Aid League 35 35 95 95 95 – 95 95 95
Medical Fund 211 352 700 700 700 – 700 700 700
SA Shooting Union 30 30 30 30 – – – – –
Part Time Force Council 672 1 049 1 900 1 900 1 938 – 1 938 1 977 2 066
Defence, Intelligence, Diplomacy and Trade Education and
Training Authority (DIDTETA) – – – 11 072 5 400 – 5 400 4 991 5 191
9 Special Defence Account 1 624 295 1 841 339 4 721 284 5 830 075 7 625 457 – 7 625 457 8 484 514 8 676 187
Special Defence Account 1 624 295 1 841 339 4 721 284 5 830 075 7 625 457 – 7 625 457 8 484 514 8 676 187
Total 1 774 761 2 005 897 4 903 311 6 041 389 7 843 126 – 7 843 126 8 712 007 8 913 432
491
Table 21.16: Summary of personnel numbers and costs1 Personnel numbers 1998/99 1999/00 2000/01 2001/02 2002/03
1 Administration 1 538 2 660 1 876 2 174 1 752
2 Landward Defence 58 989 49 964 40 813 38 646 33 739
3 Air Defence 13 046 12 116 10 932 10 979 10 406
4 Maritime Defence 8 125 8 288 8 203 7 821 6 827
5 Military Health Support 8 114 8 114 8 114 7 739 7 162
6 Defence Intelligence 919 850 979 835 870
7 Joint Support 5 560 8 189 9 833 9 147 11 938
8 Command and Control – 153 2 040 1 383 1 376
Total 96 291 90 334 82 790 78 724 74 070
Total personnel cost (R thousand) 5 754 892 5 725 487 5 838 901 6 182 349 6 341 056 Unit cost (R thousand) 59.8 63.4 70.5 78.5 85.6 1 Full-time equivalent
Table 21.17: Summary of expenditure on training
Expenditure outcome Adjusted Medium-term expenditure estimate appropriation Audited Preliminary outcome
R thousand 1999/00 2000/01 2001/02 2002/03 2003/04 2004/05 1 Administration 2 369 2 618 5 450 5 390 5 501 5 673
2 Landward Defence 6 075 9 867 10 464 12 270 14 438 15 272
3 Air Defence 10 900 11 366 24 451 21 434 21 344 22 247
4 Maritime Defence 5 376 4 232 5 376 8 974 8 974 8 974
5 Military Health Support 3 014 2 546 2 139 3 254 3 254 6 254
6 Defence Intelligence 622 901 686 392 413 435
7 Joint Support 3 458 9 464 6 321 4 155 4 331 4 407
8 Command and Control 42 70 195 263 273 285
Total 31 856 41 064 55 082 56 132 58 528 63 547
492
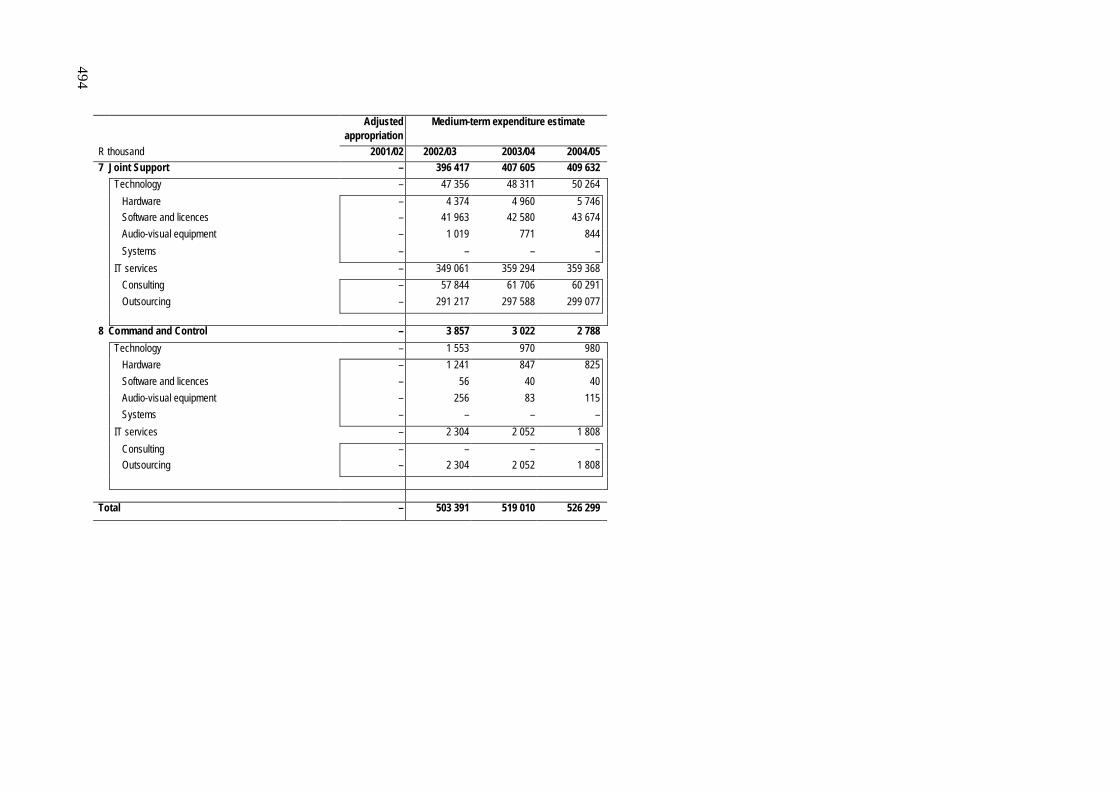
Table 21.18: Summary of information and communications technology expenditure
Adjusted Medium-term expenditure estimate appropriation
R thousand 2001/02 2002/03 2003/04 2004/05 1 Administration – 13 045 13 245 12 510
Technology – 3 496 4 478 3 500
Hardware – 2 518 3 920 2 863 Software and licences – 608 429 456
Audio-visual equipment – 370 129 181
Systems – – – –
IT services – 9 549 8 767 9 010
Consulting – 8 645 7 975 8 183 Outsourcing – 904 792 827
2 Landward Defence – 36 780 38 325 38 663
Technology – 7 446 7 534 6 335
Hardware – 2 799 2 918 3 287
Software and licences – 121 143 157
Audio-visual equipment – 4 526 4 473 2 891
Systems – – – –
IT services – 29 334 30 791 32 328
Consulting – – – –
Outsourcing – 29 334 30 791 32 328
3 Air Defence – 38 652 40 295 45 643
Technology – 12 783 14 166 19 235
Hardware – 5 176 1 520 1 561 Software and licences – 169 199 211
Audio-visual equipment – 7 438 12 447 17 463
Systems – – – –
IT services – 25 869 26 129 26 408
Consulting – – – –
Outsourcing – 25 869 26 129 26 408
493
Adjusted Medium-term expenditure estimate appropriation
R thousand 2001/02 2002/03 2003/04 2004/05 4 Maritime Defence – 7 626 8 606 8 606
Technology – 6 017 5 997 5 997
Hardware – 5 391 5 371 5 371 Software and licences – 156 156 156
Audio-visual equipment – 470 470 470
Systems – – – –
IT services – 1 609 2 609 2 609
Consulting – – – –
Outsourcing – 1 609 2 609 2 609
5 Military Health Support – 2 450 2 450 2 450
Technology – 2 450 2 450 2 450
Hardware – 1 949 1 949 1 949
Software and licences – 51 51 51
Audio-visual equipment – 450 450 450
Systems – – – –
IT services – – – –
Consulting – – – – Outsourcing – – – –
6 Defence Intelligence – 4 564 5 462 6 007
Technology – 2 133 2 311 2 321
Hardware – 1 365 1 690 1 690
Software and licences – 564 519 521
Audio-visual equipment – 204 102 110
Systems – – – –
IT services – 2 431 3 151 3 686
Consulting – 1 707 2 157 2 557
Outsourcing – 724 994 1 129
494
Adjusted Medium-term expenditure estimate appropriation
R thousand 2001/02 2002/03 2003/04 2004/05 7 Joint Support – 396 417 407 605 409 632
Technology – 47 356 48 311 50 264
Hardware – 4 374 4 960 5 746 Software and licences – 41 963 42 580 43 674
Audio-visual equipment – 1 019 771 844
Systems – – – –
IT services – 349 061 359 294 359 368
Consulting – 57 844 61 706 60 291
Outsourcing – 291 217 297 588 299 077
8 Command and Control – 3 857 3 022 2 788
Technology – 1 553 970 980
Hardware – 1 241 847 825
Software and licences – 56 40 40
Audio-visual equipment – 256 83 115
Systems – – – –
IT services – 2 304 2 052 1 808
Consulting – – – – Outsourcing – 2 304 2 052 1 808
Total – 503 391 519 010 526 299