Embed Size (px)
Citation preview

UNCLASSIFIED
Defense Technical Information CenterCompilation Part Notice
ADPO18962TITLE: Recent Advances in High Cycle Fatigue
DISTRIBUTION: Approved for public release, distribution unlimited
This paper is part of the following report:
TITLE: International Conference on the Mechanical Behavior of Materials[9th], ICM-9, Held in Geneva, Switzerland on 25-29 May 2003
To order the complete compilation report, use: ADA433037
The component part is provided here to allow users access to individually authored sectionsf proceedings, annals, symposia, etc. However, the component should be considered within
[he context of the overall compilation report and not as a stand-alone technical report.
The following component part numbers comprise the compilation report:ADP018903 thru ADP019136
UNCLASSIFIED

RECENT ADVANCES IN HIGH CYCLE FATIGUE*
Ted NicholasAir Force Institute of Technology (AFIT/ENY)
Wright-Patterson AFB, OH 45433, USAtheodore.nicholas(qafit.edu
ABSTRACT
High cycle fatigue (HCF) has been the cause of a number of turbine engine failures over thelast several years within the U.S. Air Force. Extensive investigations have determined that theroot cause, when related to material properties, is the accumulation of damage prior to andduring service which, in turn, reduces the capability of the material in terms of the fatigue limitstrength. Numerous studies have been conducted over the past several years to address thedetermination of fatigue limits. In this paper, in addition to developing approaches forpredicting fatigue limits under various mean stresses and biaxial stress states, methods arepresented for accounting for service-induced damage. One of the types of damage involves lowcycle fatigue (LCF) which, by itself, should not cause failure but may reduce the HCFcapability of the material. Data on the accumulation of damage under LCF or HCF overloadtransients, and their effects on the HCF strength of a titanium alloy are used to illustrate theinability of linear damage summation laws. A Kitagawa diagram with a short crack correctionis found to be useful in assessing the fatigue strength of both smooth and notched specimens.
INTRODUCTION
Damage tolerance in structural design involves the assumption of initial or service induceddamage, usually in the form of cracks, and inspection procedures to insure that any crackbelow the inspection limit will not grow to a catastrophic size before either the nextinspection, or for the life of the part. While this approach has been highly successful inavoiding low cycle fatigue (LCF) failures in U.S. Air Force gas turbine engines since theinception of damage tolerance and retirement-for-cause policies in the 1980's, a similarapproach cannot be used for high cycle fatigue (HCF) design. The very high frequencies andlarge numbers of cycles that can be accumulated under HCF in a very short time period,combined with the very large fraction of life consumed in crack nucleation, make itimpractical to inspect for cracks and apply damage tolerance principles. Rather, the approachto HCF has to be based on threshold or endurance limit concepts that involve determiningstress levels below which failures due to HCF will not occur. Such an approach to pristinematerials requires an extensive database, simple models for interpolating among meanstresses, and modeling concepts for biaxial stress conditions. Issues such as phase angles inbiaxial loading, frequency effects, load sequencing, and others start to make such predictionsmuch more difficult. Another aspect that must be addressed is the degradation of the fatiguestrength with time in service due to damage accumulation. Such damage may beinstantaneous, such as from foreign object damage (FOD), or gradually accumulated such asfrom fretting fatigue or LCF where cracks might form and continue to grow due to repeatedloading during service. In fact, FOD, fretting fatigue, and LCF have been identified as the
* The views expressed in this article are those of the author and do not reflect the official policy or position of the
United States Air Force, Department of Defense, or the US Government.
three primary concerns in the U.S. Air Force HCF program for addressing the tolerance ofmaterials to HCF subjected to in-service damage. The subjects of FOD and fretting fatigue aretouched upon in other papers in this conference [1,2], so this paper will concentrate only onsome issues with respect to fatigue limit stresses in both smooth bars and specimens subjectedto prior loading histories and associated damage in the form of LCF loading.
TOTAL LIFE APPROACHES
The terminology total life refers to determination of the fatigue limit strength for HCF at cyclecounts that exceed the possible exposure of a material during service without consideration ofnucleation or crack propagation as individual events. It is well known that in the HCF regime,nucleation comprises a large majority of a materials life. As an example, Morrissey et al. [3]have calculated crack growth lives for titanium cylindrical specimens and show that at a totallife of 107 cycles, approximately 98% of life is consumed in nucleating a crack to a length of57 jtm.
To represent the stress corresponding to a total life of, sayl0 7 cycles, a plot can be made ofthese stresses as a function of stress ratio (R = ratio of minimum to maximum stress).Alternately, data can be plotted as a function of mean stress. The Haigh diagram, incorrectlyreferred to as a Goodman diagram, is a common method of representing the fatigue limit orendurance limit stress of a material in terms of alternating stress, defined as half of thevibratory stress amplitude. Thus, the maximum dynamic stress is the sum of the mean andalternating stresses. For many rotating components, the mean stress is known fairly accuratelyfrom the rotational speed, but the alternating stress is less well defined because it depends onthe vibratory characteristics of the component. Thus a Haigh diagram represents the allowablevibratory stress as the vertical axis as a function of mean or steady stress on the x-axis. Manyattempts have been made to define the equation which best represents the data on a Haighdiagram [4]. Goodman [5] proposed use of the "dynamic theory" which results in a straightline when the allowable alternating stress is taken equal to half the ultimate stress. Of interestis that Goodman proposed such an equation as one that is "very easy of application and is,moreover, simple to remember" [5]. He also noted that "whether the assumptions of thetheory are justifiable or not is quite an open question."
800
700 -3 ML data_ AL ASE datao Q []1 ...... ........ oo.o i
500
400C,)
300
2 Ti-6AI-4V plateS200
10 cycles100 20-70 Hz- -
0 . .I . . I . . I I I
-400 -200 0 200 400 600 800 1000
Mean Stress (MPa)
Figure 1. Haigh diagram for Ti-6AI-4V plate with modified Jasper equation fit [4].

Recent work by Nicholas and Maxwell [4] has shown that a modified version of the constantenergy density range theory of Jasper [6] can represent fatigue strength at 107 cycles in a Ti-6A1-4V titanium alloy over a wide range of stress ratios (or mean stresses) including data inthe negative mean stress region. Figure 1 shows the fit to the data, which involves use of anempirical constant in the theory to account for the observation that compressive stressescontribute less than tensile stresses in fatigue.
The Jasper approach, described in detail in [4], computes the stored energy density range percycle. For uniaxial loading, assuming purely elastic behavior (a reasonable assumption forHCF), where stress and strain are related by c = Er, the stored energy density range is
2E (nT mx min
where E is Young's modulus, the plus sign is for stress ratio R < 0 and the minus sign forstress ratio R > 0. For the specific case of fully reversed loading, where R = - 1, the energy isU (2CT21
2E (2 1) (2)
where ay_ 1 represents the alternating stress (= maximum stress) at R = - 1. For any other caseof uniaxial loading, the following equation is easily derived and can be used to obtain thevalue of the alternating stress on a Haigh diagram:
cy 1 (1 - R) 2
- / -RR (3)
For fatigue involving cycling into compression, it is postulated that stored energy density percycle does not contribute towards the fatigue process as much when the stresses arecompressive as when they are in tension. Assuming that compressive stress energy contributesa fraction, u, compared to comparable energy in tension, then the total effective energy isformulated in the following manner, where 0 < u < 1:
Utot = Utens + U, Ucomp = constant (4)
In the use of this equation, energy terms corresponding to negative stresses have to bemodified by the coefficient u. The introduction of the constant U, has the effect of modifyingthe shape of the Jasper equation to fit data at negative mean stresses as illustrated in Fig. 1,where u, = 0.287 was obtained by fitting Eq. (4) to experimental data obtained at -4 < R < 0.8and particularly at values of stress ratio R < - I corresponding to negative mean stresses.
The extension of the modified Jasper equation to biaxial loading is not straightforwardbecause compression energy is calculated differently than tension energy for the same stressrange. For the case of pure torsion, the stress state due to shear of magnitude -10 is equivalent
to tension and compression on orthogonal planes of magnitude -10 and -10 , respectively,oriented 45 degrees to the shear case. It is not obvious how to calculate fatigue energy intorsion since it is not an invariant, given the postulated difference between tension andcompression energy. As an engineering solution, it is proposed that energy be calculatedbased on stresses in the principal directions, where shear stresses are zero. The calculations
for this case are then straightforward, where the relations between stress and strain make useof the two-dimensional equations of elasticity in plane stress. The results are presented in Fig.2 which shows the computed fatigue endurance limit under pure tension, Oytens, divided by the
computed fatigue (endurance) limit in the x direction, Gxend as a function of the ratio of the
applied stress in the y direction, cyyapp, divided by the applied stress in the x direction, cyxapp -
For comparison, the same quantities are computed for a von Mises equivalent stress.
Two data points are shown in Fig. 2 for fatigue limit stresses in torsion corresponding to a lifeof 106 cycles. The results were obtained on rectangular cross-section specimens of dimensions17.3 mm x 3.18 mm tested at 10 Hz. These specimens were tested as part of an ongoing FODstudy. The reference stresses for the uniaxial case are based on data from other studies [7] anduse of the modified Jasper Eq. (3) to fit the data and extrapolate to different values of R. It canbe seen that the principle stress energy formulation using the compression energymodification provides a reasonable correlation of the torsion fatigue data.
2
Jasper (R=0)
-- -von Mises
1.5 '- "- - Expt (R=O)
C
b
Ti-6A-4Va=0.287
0.5-1 -0.5 0 0.5 1
y,app x,app
Figure 2. Predictions of fatigue limit stress as a function of applied biaxial stress state.
LCF/HCF INTERACTIONS
Several series of tests have been conducted over the years in our laboratory at AFRL/MLwhere specimens have been subjected to LCF loading prior to HCF testing to obtain a fatiguelimit stress. In these types of tests, the LCF stress corresponding to a life in the typical range104 to 105 cycles is determined first from a series of LCF tests and then interpolating on a S-Ncurve. Some fraction of the LCF life is then applied to the specimen after which it is tested inHCF using the step-loading technique [8] where load-history effects and coaxing have beenshown not to be important in Ti-6A1-4V [9]. Two things should be noted in this type ofexperiment involving preloading under LCF. First, the LCF life is a statistical variable, sotesting up to a predetermined fraction of predicted life has an inherent error associated withwhat fraction of life it really was. Second, if LCF testing and HCF testing are performed at thesame value of stress ratio, R, then the LCF test will be at a larger stress than the HCF test for

an uncracked specimen. In the event that a crack is formed during LCF, application of a lowerload during HCF testing can amount to an overload effect, so the fatigue limit may tend to behigher than that obtained without an overload effect. Such a phenomenon was demonstratedby Moshier et al [10] and is discussed below.
1.2 I 1.41.2 0R=.1
0
0. A 8 FO R0.80.8 =I
' =t 0.80.6 A
Ti-6A-4V 0.6
0.4 Cylindrical specimens0 Park 0.4* Morrissey Ti-6A[-4V plate
0.2 11 Maxwell 0.2 k, 2.7
0 0.2 0.4 0.6 0.8 1 0 0.2 0.4 0.6 0.8 1
NIN r N/Nr
Figure 3. Normalized endurance limit Figure 4. Fatigue strength of notchedstress as function of LCF history. specimens subjected to prior LCF [7].
Data obtained from different tests on smooth bars subjected to LCF, then HCF, aresummarized in Fig. 3, where the fatigue limit stress is normalized against the data for testswithout any prior history. The horizontal axis is the number of LCF cycles divided by theexpected life at the stress level and R used in the LCF tests. Noting that from a designperspective that the allowable LCF life would be much less than the average, LCF cycle ratiosin practice should not be expected to exceed 0.5 of the average, and even less when factors ofsafety are included. Thus, any reasonable number of LCF cycles that might be encounteredare expected to be confined only to the left portion of Fig. 3. The data show, that withinreasonable scatter, the HCF limit does not appear to be degraded by any significant amount intests covering a range of LCF stress levels and corresponding lives, and stress ratios in bothLCF and HCF. Data designated Park and Morrissey appear in [ 11] and [3], respectively.
Similar data obtained from tests on notched specimens are presented in Fig. 4. In these cases,preloading in LCF often involved testing at stress levels that produced plastic deformationnear the notch root. The plastic strain field was normally larger than that obtained under pureHCF with no preload, so the comparison of data from LCF/HCF tests with pure HCF tests ismuch more complicated than in the smooth bar case. In the case of specimens tested at R=0.8,the high peak stresses under HCF combined with the plastic deformation occurring under theprior LCF makes the comparisons even more difficult. It should be noted that in at least twocases of this type of LCF/HCF loading, a crack was found on the fracture surface whichindicated that the LCF produced initial cracking which resulted in a reduction of subsequentHCF strength [7]. The effect of precracking is discussed below. Nonetheless, the reduction offatigue strength due to LCF in notched specimens does not appear to be very significant untilat least 25% of LCF life has been expended. As pointed out above, this is based on averagelife so that with scatter and a factor of safety, it is not reasonable to expect that a materialwould be subjected to 25% of average life in service.
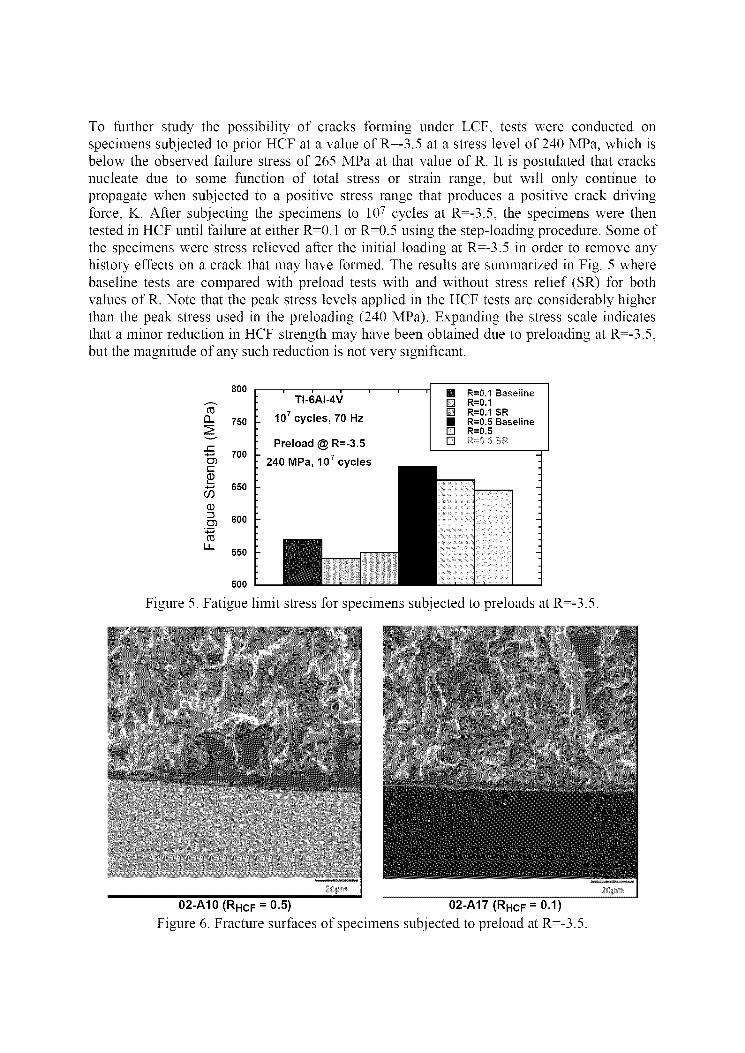
To further study the possibility of cracks forming under LCF, tests were conducted onspecimens subjected to prior HCF at a value of R=-3.5 at a stress level of 240 MPa, which isbelow the observed failure stress of 265 MPa at that value of R. It is postulated that cracksnucleate due to some function of total stress or strain range, but will only continue topropagate when subjected to a positive stress range that produces a positive crack drivingforce, K. After subjecting the specimens to 107 cycles at R=-3.5, the specimens were thentested in HCF until failure at either R=0. I or R=0.5 using the step-loading procedure. Some ofthe specimens were stress relieved after the initial loading at R=-3.5 in order to remove anyhistory effects on a crack that may have formed. The results are summarized in Fig. 5 wherebaseline tests are compared with preload tests with and without stress relief (SR) for bothvalues of R. Note that the peak stress levels applied in the HCF tests are considerably higherthan the peak stress used in the preloading (240 MPa). Expanding the stress scale indicatesthat a minor reduction in HCF strength may have been obtained due to preloading at R=-3.5,but the magnitude of any such reduction is not very significant.
800 T - R=0.1 BaselineTi---4V c R=0.1
7c El R=0.1 SR0_ 750 107 cycles, 70 Hz U R=0.5 Baseline
[ R=0.570 Preload @ R=-3.5 El
- 700100) 240 MPa, 1 cycles
-*-o 65
600
LL 550
500
Figure 5. Fatigue limit stress for specimens subjected to preloads at R=-3.5.
02-AlO (RHCF = 0.5) 02-A17 (RHCF = 0.1)Figure 6. Fracture surfaces of specimens subjected to preload at R=-3.5.
Following the reasoning above, where nucleation might be expected at stress levels belowthose for propagation when R is negative, the fracture surfaces of several of the specimenspretested at R=-3.5 and then failed at positive values of R were observed under SEM and areshown in Fig. 6. While the observations on these two specimens which had somewhat lowerfatigue limit stresses are not entirely conclusive, there are indications, as outlined in thepictures, that a crack might have formed during the R=-3.5 testing. Such features were notobserved in baseline specimens which received no stressing at negative R. Of significance isthe size of the possible cracks seen which appear to be no deeper than 30 or 40 Jtm.
FRACTURE MECHANICS APPROACHES
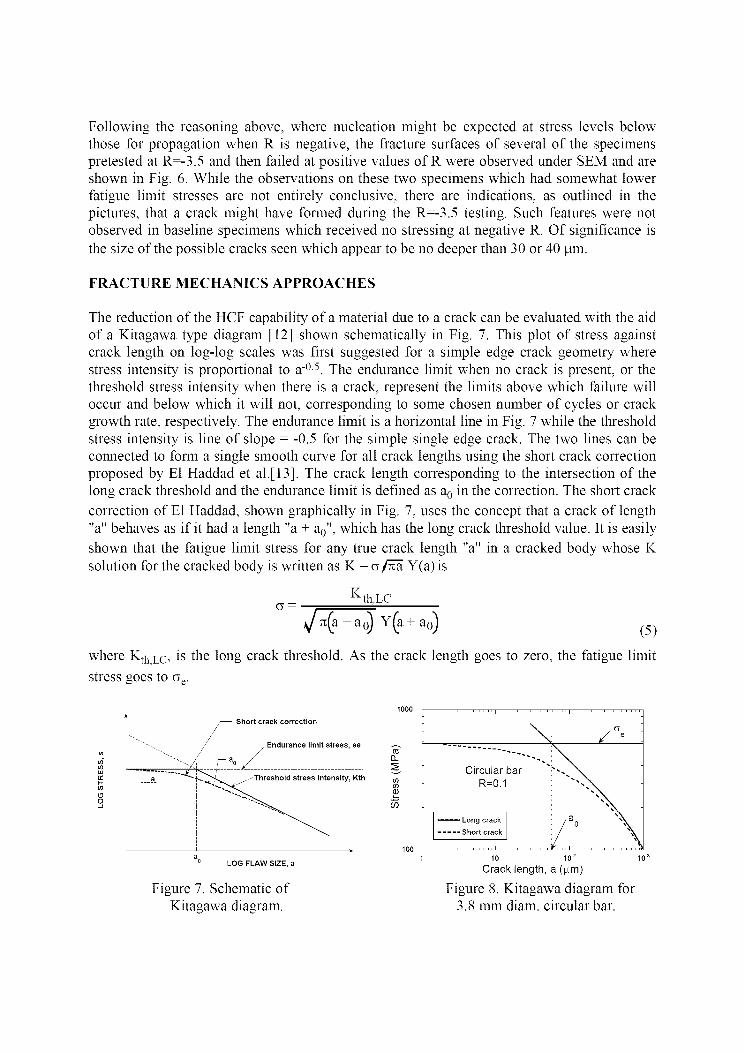
The reduction of the HCF capability of a material due to a crack can be evaluated with the aidof a Kitagawa type diagram [12] shown schematically in Fig. 7. This plot of stress againstcrack length on log-log scales was first suggested for a simple edge crack geometry wherestress intensity is proportional to a-0.5. The endurance limit when no crack is present, or thethreshold stress intensity when there is a crack, represent the limits above which failure willoccur and below which it will not, corresponding to some chosen number of cycles or crackgrowth rate, respectively. The endurance limit is a horizontal line in Fig. 7 while the thresholdstress intensity is line of slope = -0.5 for the simple single edge crack. The two lines can beconnected to form a single smooth curve for all crack lengths using the short crack correctionproposed by El Haddad et al.[13]. The crack length corresponding to the intersection of thelong crack threshold and the endurance limit is defined as a0 in the correction. The short crack
correction of El Haddad, shown graphically in Fig. 7, uses the concept that a crack of length"a" behaves as if it had a length "a + a0", which has the long crack threshold value. It is easilyshown that the fatigue limit stress for any true crack length "a" in a cracked body whose Ksolution for the cracked body is written as K = cy/' Y(a) is
Kth, LC
7i(a+a) Y(a+ ao) (5)
where KthLC, is the long crack threshold. As the crack length goes to zero, the fatigue limit
stress goes to Ge.
1000Short crack correction
Endurance limit stress, se ------
(Circular bara Threshold stress intensity, Kth R=O. 1
to U)
(I)0 -Long ....ck a0 *'
------------------------------------Short crack
100 . . . . ... )aa 1 10 102 101
LOG FLAW SIZE, a Crack length, a ([Lm)
Figure 7. Schematic of Figure 8. Kitagawa diagram forKitagawa diagram. 3.8 mm diam. circular bar.

A Kitagawa diagram for a circular bar of diam. = 3.8 mm is shown in Fig. 8. Note that thelong crack threshold is not a straight line but, rather, takes the form of the actual K solutionfor that geometry [12]. In an investigation of history effects where specimens were firstsubjected to stresses up to 40% above the HCF fatigue limit, no cracks were detected on thefracture surfaces [12]. However, since the detection limit is less than a0 in this case, Fig. 8,
cracks having lengths below a0 = 57 jtm should not have a detrimental effect on fatigue limitstress. In general, the Kitagawa diagram with the short crack correction shows that if thethreshold data follow the curve, that cracks of length ao or less have fatigue limit stresseswhich are not significantly lower than the endurance limit for any geometry. At a crack lengthof a0, the fatigue limit stress is l/\N2 or 0.71 of the endurance limit. Thus, it is not surprising tofind that small cracks formed under fretting fatigue [14,15], under LCF at notches [7,10] or insmooth bars [3,11] do not have a significant detrimental effect on the fatigue limit stress asillustrated partially in Figs. 3 and 4. The data of Fig. 5 and possible crack sizes shown in Fig.6 also support this conclusion.
One of the more revealing studies of the application of fracture mechanics to prediction ofHCF thresholds or fatigue limit stresses is the recently published work of Moshier et al. [10].There, notched specimens were precracked in LCF and subsequently retested in HCF todetermine the fatigue limit stress. Fracture mechanics was used to relate the observed stressesto stress intensities including corrections for small crack behavior using the approachsuggested by El Haddad. Specimens having a notch with kt = 2.25 were subjected to LCF ateither R=-I or R=0.1 until a crack was detected using an infrared detection system. Surfaceflaws at the notch root having depths under 20 jtm were detected and subsequently heat tintedin order to be able to detect them on the subsequent fracture surface. All of the crackedspecimens were then tested under HCF in order to establish the fatigue limit stress using steploading. K analysis of the surface flaw at a notch root, combined with a small crackcorrection, were plotted on a Kitagawa type diagram as shown in Fig. 9. Of significance is theuse of a Kitagawa type diagram for geometries having cracks other than a single edge crack.In this case, the geometry is that of a double notched tension specimen. The use of theKitagawa diagram for this geometry shows that the endurance limit and the value of a0 for theshort crack correction are not material constants but, rather, material parameters for theparticular geometry and stress ratio, R, being investigated.
The maximum stress levels for LCF precracking at R=-I and R=0.1 in Fig. 9 were below andabove the stress levels that caused failure in HCF, respectively. In the formation of a crackunder LCF and the subsequent propagation under HCF, these conditions would be referred toas an underload (negative overload) and overload, respectively. For the overload condition, asimple model was developed in [10] which modified the threshold K. The modified K alongwith the small crack correction is plotted as the thin line in Fig. 9 while the experimental datain the form of fatigue limit stress with LCF at R=0. I are plotted as hollow circles. The modelprovides a very good representation of the data. Similarly, the data representing LCFprecracking at R=-I are well represented by an uncorrected threshold K with a small crackcorrection. The data are represented by the hollow triangles while the threshold K is shown asthe thin dashed line. In this case, no underload model is needed to correct for the effectivethreshold. Of particular interest are the data points from precracking at either value of Rwhere stress relief annealing was performed after the LCF precracking, denoted by SRA in

the figure. These data show that the SRA process removes any history effects and theresulting precracks follow the prediction of the long crack threshold with the a0 short crack
correction. The need for the short crack correction is easily seen by the two curves with heavylines which represent the threshold for a long crack (dashed) and the overload correctedthreshold (solid). The intersection of these curves with the endurance limit line represents thevalue of a0, the El Haddad small crack correction factor, for this geometry..
400
Fatigue limit
090 3000O LCF R=0.1
"l 200 A LCF R=-1.0
ELCF R=-1.0 with SRA 0
E -- - Long crack DK h
--- Long crack DKh with a0- Prediction without a0-- Prediction with a
100
1 10 100 500
Crack depth, c (rim)
Figure 9. Experimental data and model predictions fornotched specimens on a Kitagawa diagram [10].
Cracks formed under fretting fatigue have been measured after HCF testing to determine thefatigue limit stress. In two separate investigations [14,15], the crack sizes and correspondingstresses were plotted on a Kitagawa type diagram for the specific crack specimen geometry,including a small crack correction. In both cases, the data follow the curve connecting theendurance limit stress with the threshold stress intensity as shown schematically in Fig. 7,using a small crack correction. The cracks formed under fretting fatigue are subjected to anominal stress condition of fully reversed loading, and no apparent history effect appears tobe present in the two studies cited.
CONCLUSIONS
Fatigue limit stresses in smooth bars and threshold stress intensities in precracked specimensare easily accounted for by using a compression modified version of the energy based conceptof Jasper, and the Kitagawa diagram with the El Haddad small crack correction, respectively.The Jasper formulation appears to be extendable to biaxial loading by considering stresses inprinciple directions. The Kitagawa/El Haddad approach seems able to explain the relativelysmall reduction in fatigue limit stress due to small cracks of the order of a0 in length.
ACKNOWLEDGEMENTS
Much of the work described herein was conducted as part of the USAF HCF Program. Theauthor would like to thank his many colleagues who contributed to this effort, in particular,

David Maxwell for the work on negative R effects, Ken Goecke for the torsion study, andJohn Porter, all of UDRI, for the excellent support in fractography throughout the program.
REFERENCES
[1] S.R. Thompson,.J.J. Ruschau and T. Nicholas, "An Assessment of Laboratory Techniquesfor Simulating Foreign Object Damage on a Leading Edge Geometry," (this volume).
[2] S. Mall, "Fretting Fatigue Crack Nucleation Criterion for Ti-6A1-4V," (this volume).
[3] R.J. Morrissey, P. Golden and T. Nicholas, "Damage Accumulation under IntermediateCycle Fatigue," Int. J Fatigue (in press).
[4] T. Nicholas and D.C. Maxwell, Fatigue and Fracture Mechanics: 33'd Volume, ASTM
STP 1417, W.G. Reuter and R.S. Piascik, Eds., ASTM, West Conshohocken, PA, pp. 476-492, 2002.
[5] J. Goodman, Mechanics Applied to Engineering, Volume 1, 9th ed., Longmans, Green &Co., Inc., New York, p.634, 1930; see also 1st edition, p. 455, 1899.
[6] T.M. Jasper, Philosophical Magazine, Series. 6, vol. 46, pp. 609-627, Oct. 1923.
[7] D. Lanning, G.K. Haritos,.T. Nicholas and D.C. Maxwell, Fatigue Fract. Engng. Mater.Struct., vol. 24, pp. 565-578, 2001.
[8] D.C. Maxwell and T. Nicholas, Fatigue and Fracture Mechanics: 29th Volume, ASTMSTP 1321, T. L. Panontin and S. D. Sheppard, Eds., ASTM, West Conshohocken, PA, pp.626-641, 1999.
[9] T. Nicholas, Fatigue Fract. Engng. Mater. Struct., vol. 25, pp. 861-869, 2002.
[10] M.A. Moshier, T. Nicholas and B.M. Hillberry, Fatigue and Fracture Mechanics: 3 3'rd
Volume, ASTMSTP 1417, W.G. Reuter and R.S. Piascik, Eds., ASTM, West Conshohocken,PA, pp. 129-146, 2002.
[ 11 ] S. Mall, T. Nicholas and T.-W. Park,., "Effect of Pre-Damage from Low Cycle Fatigueon High Cycle Fatigue Strength of Ti-6A1-4V," Int. J Fatigue (in press).
[12] H. Kitagawa and S. Takahashi, Proc. of Second International Conference on MechanicalBehaviour of Materials, Boston, MA, pp. 627-631, 1976.
[13] M.H. El Haddad, K.N. Smith, and T.H Topper, Journal of Engineering Materials andTechnology, vol. 101, pp. 42-46. 1979.
[14] A.L Hutson, C. Neslen and T. Nicholas, Tribology International, vol. 36, pp 133-143,2003.
[15] P.J. Golden, B.B. Bartha, A.F. Grandt, Jr. and T. Nicholas, "Measurement of the FatigueCrack Propagation Threshold of Fretting Cracks in Ti-6A1-4V," Int. J Fatigue (in press).